
U.S. and Global STEM Education and Labor Force
The U.S. STEM workforce relies on STEM-trained workers with a broad range of educational credentials. STEM education equips Americans with the S&E skills and knowledge needed to participate in the STEM workforce. STEM education also leads to better public perceptions and understanding of science and the broader impact of its role in society.
Elementary and Secondary (K–12) Mathematics and Science
Elementary and secondary education in mathematics and science are the foundation for entry into postsecondary STEM majors and STEM-related occupations. The United States ranks higher in science literacy (7th out of 37 Organisation for Economic Co-operation and Development [OECD] countries) than it does in mathematics literacy (25th of 37 OECD countries). The average U.S. mathematics score in 2018 was lower than the OECD average and has not measurably changed since 2003, whereas the average U.S science score was higher than the OECD average and has improved by 13 points since 2006 (Figure 1).
Average scores of 15-year-old students on the PISA mathematics and science literacy scales, by OECD education system: 2018
| Subject | Lowest average score | United States | OECD average | Highest average score |
|---|---|---|---|---|
| Mathematics | 391 | 478 | 489 | 527 |
| Science | 413 | 502 | 489 | 530 |
Note(s):
OECD is Organisation for Economic Co-operation and Development. PISA is Program for International Student Assessment.
Source(s):
OECD, PISA, 2018.
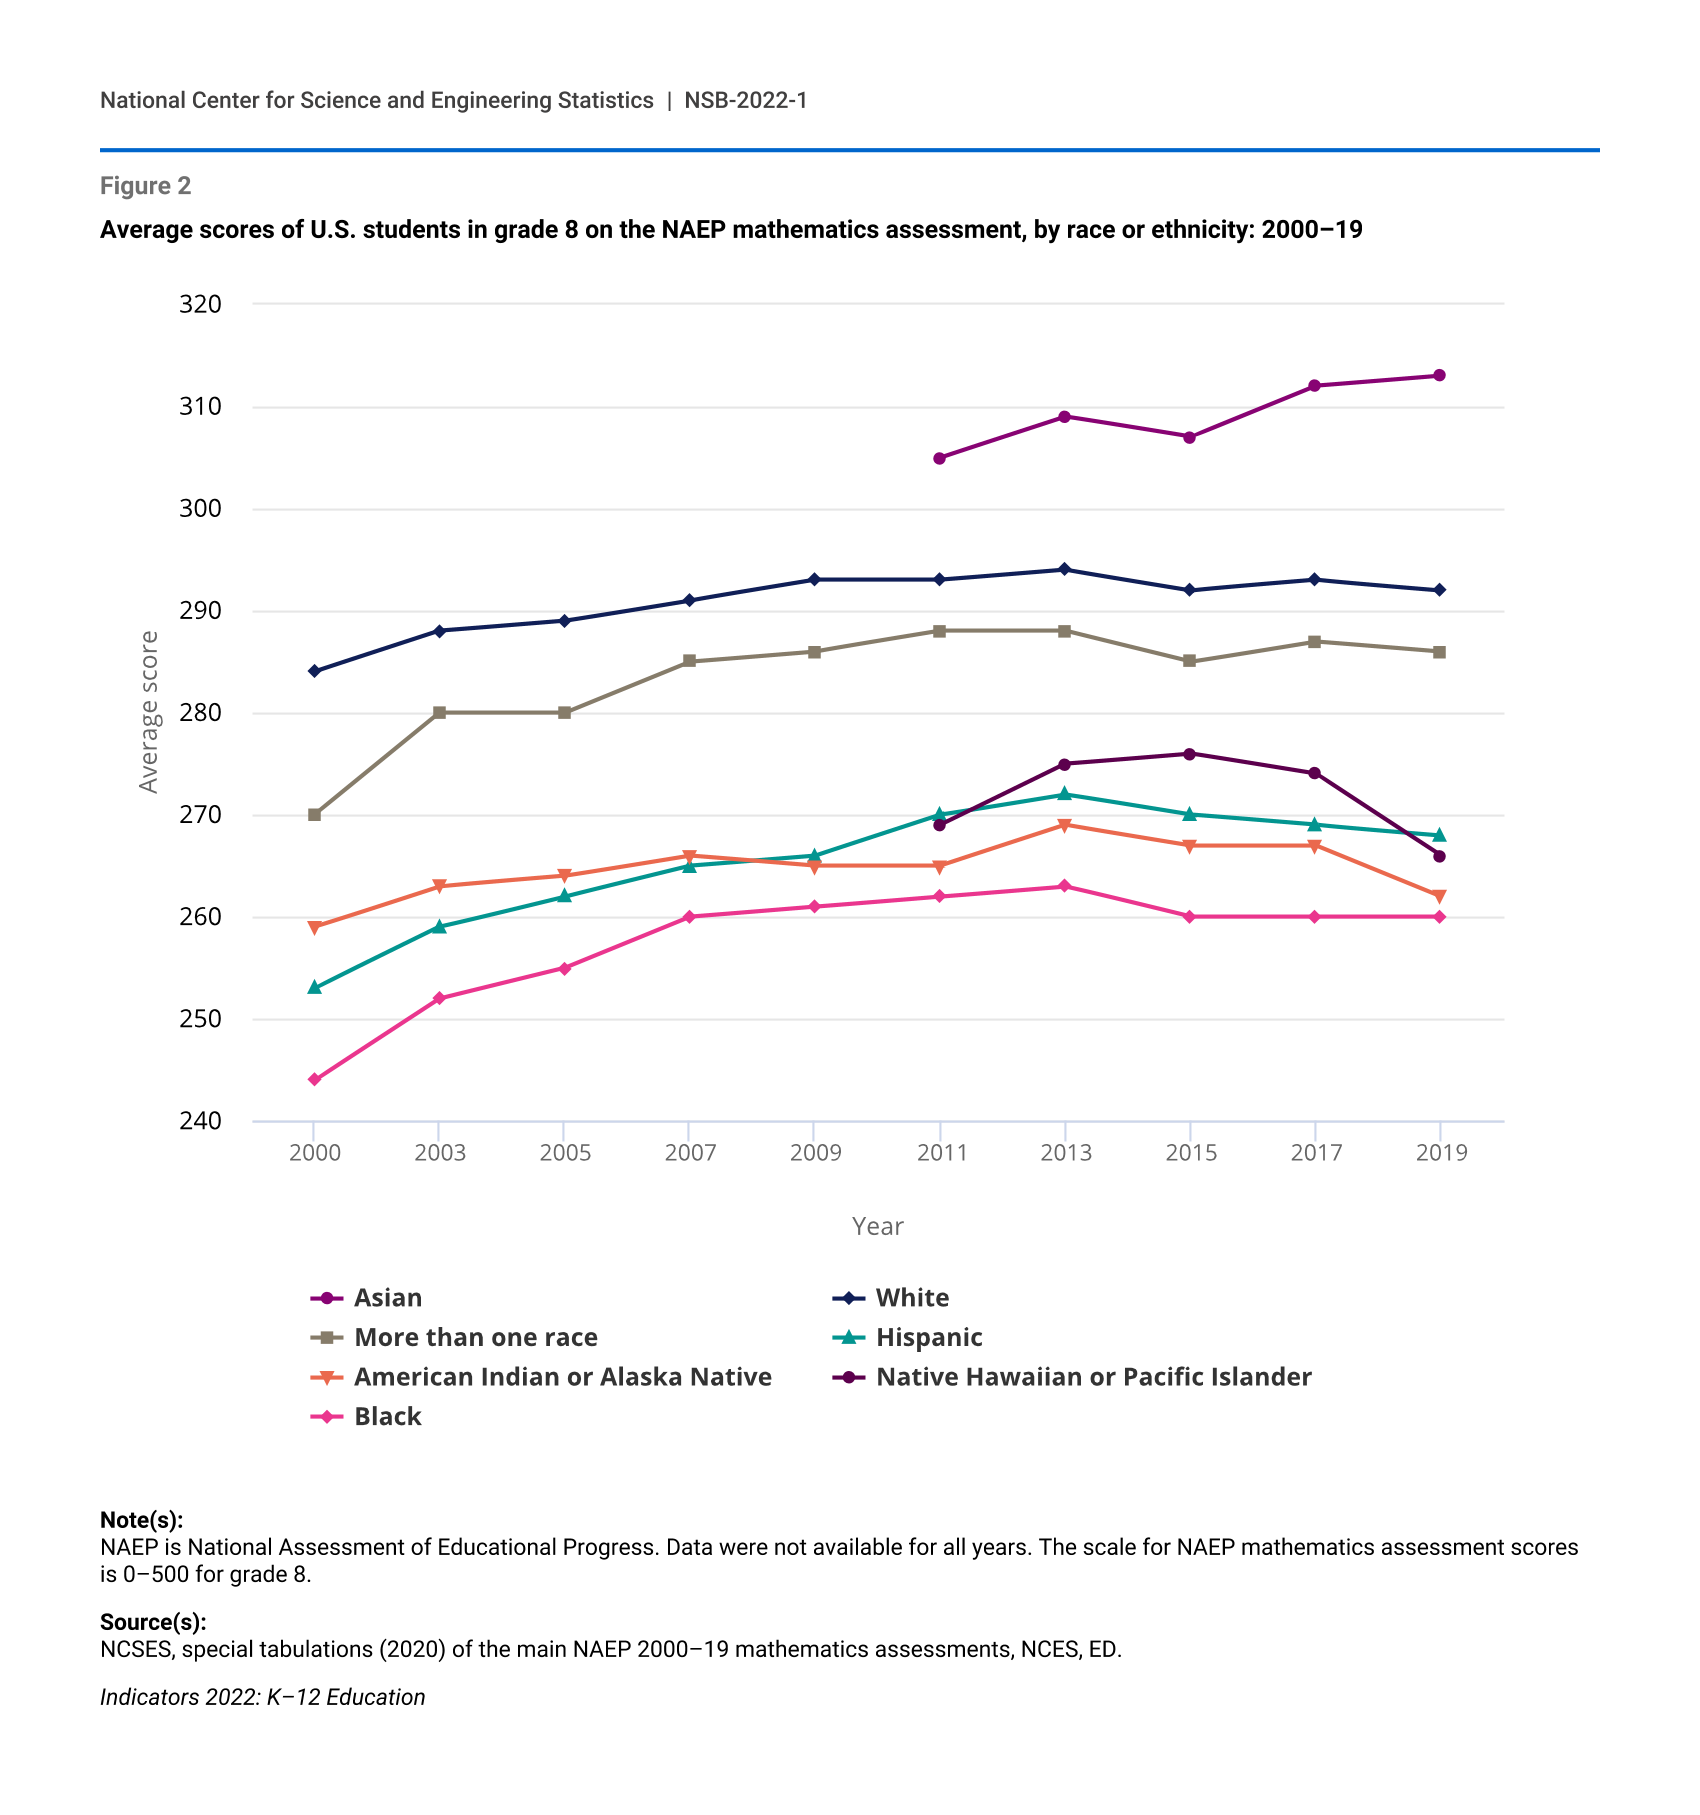
This low international ranking of the United States in mathematics is consistent with the lack of improvement in student achievement for more than a decade. Mathematics scores for Black, Hispanic, Native Hawaiian or Pacific Islander, and American Indian or Alaska Native students persistently lag behind the scores of their White and Asian peers. Among fourth graders in 2019, scores in mathematics were 18–25 points lower for students in these racial or ethnic minority groups than for White students; this gap was even wider (24–32 points) among eighth-graders (Figure 2). Asian students consistently outperformed all other groups in both grades 4 and 8.
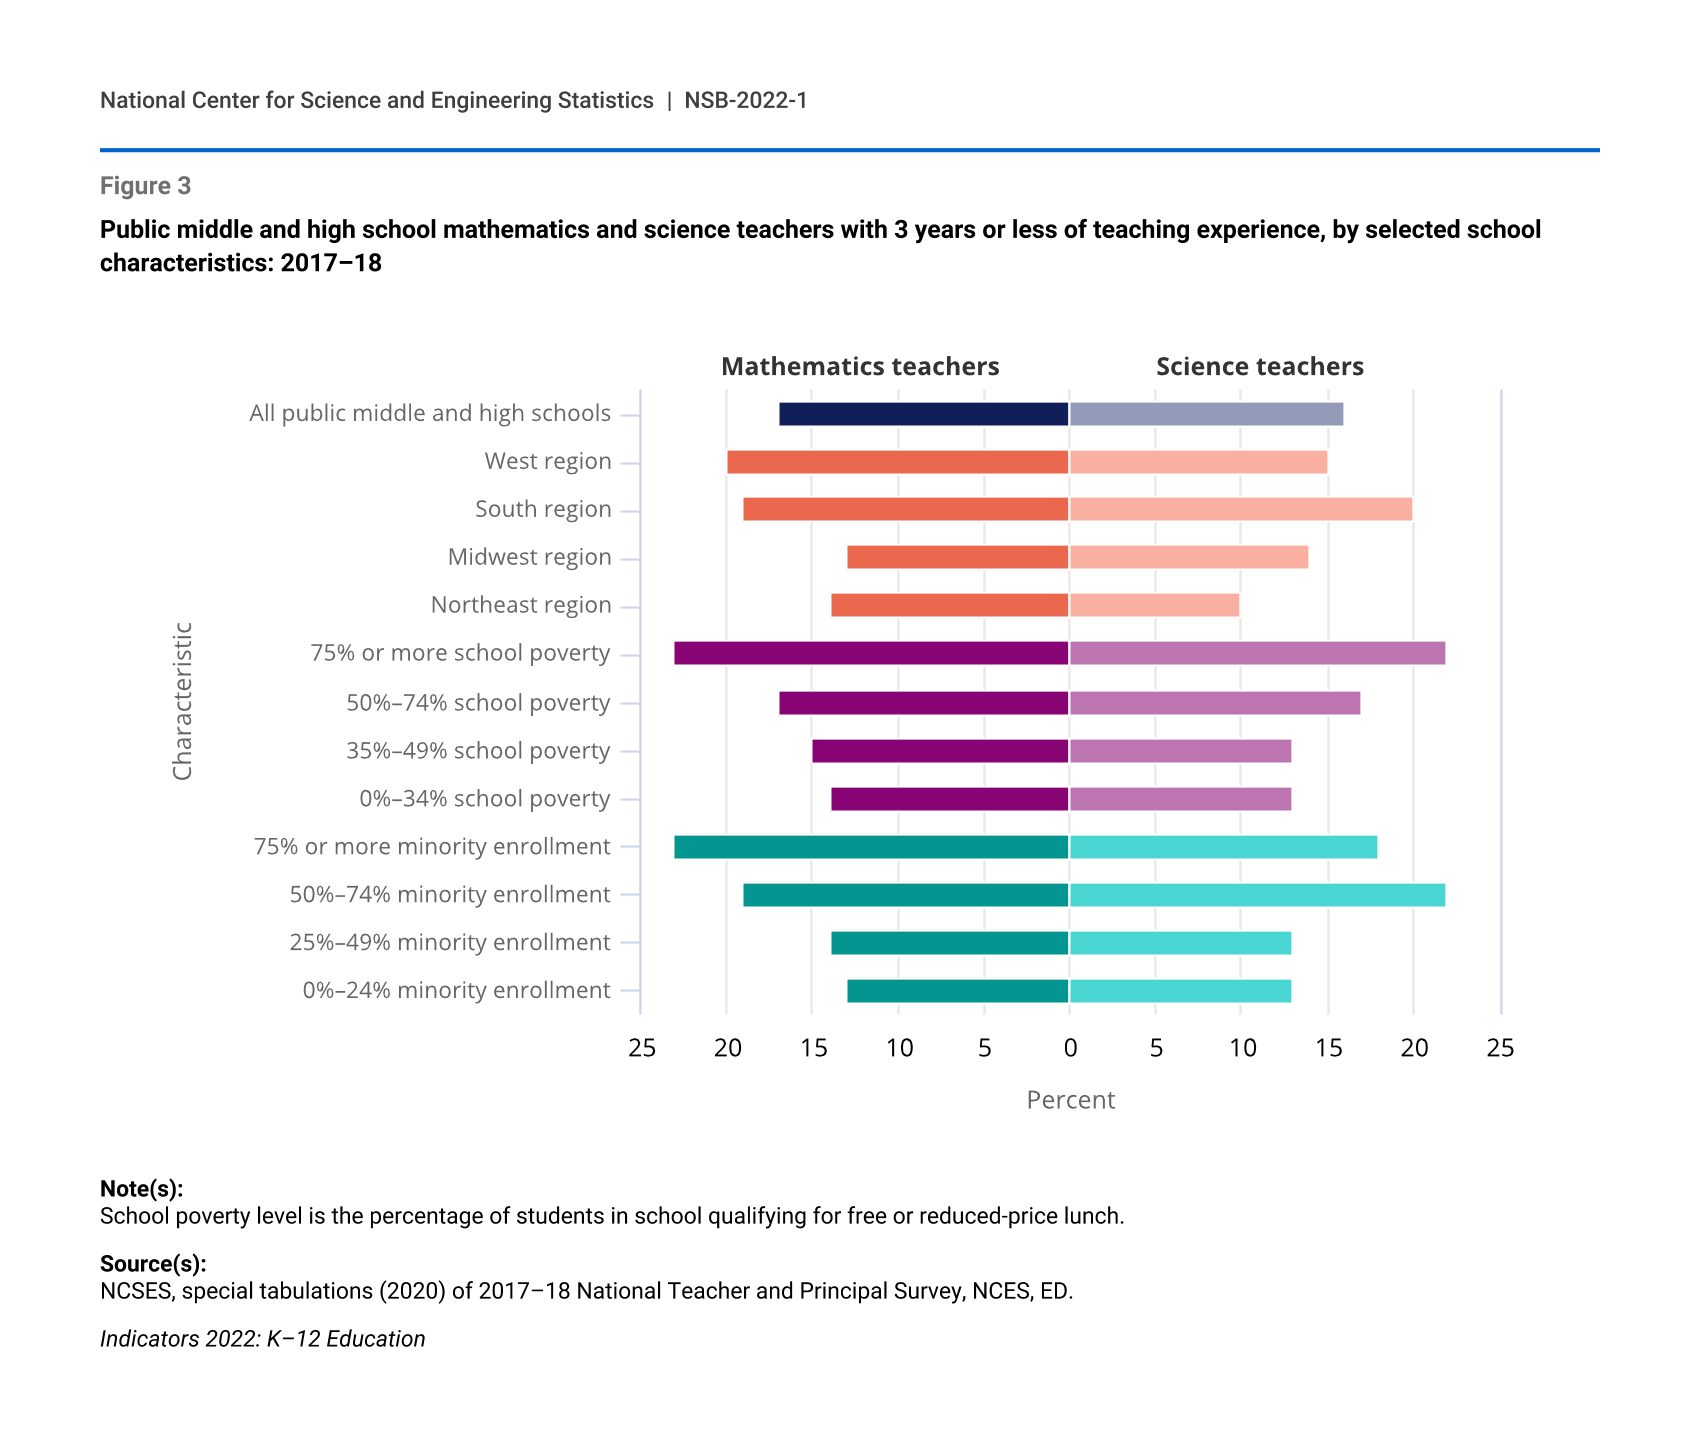
Teacher qualifications vary across student demographic groups and U.S. regions. In 2018, STEM teachers with less than 3 years of experience were more prevalent at schools with high-minority or high-poverty populations (Figure 3). They also tend to be more prevalent in the southern and western regions of the United States.
Average scores of U.S. students in grade 8 on the NAEP mathematics assessment, by race or ethnicity: 2000–19
| Year | Asian | White | More than one race | Hispanic | American Indian or Alaska Native | Native Hawaiian or Pacific Islander | Black |
|---|---|---|---|---|---|---|---|
| 2000 | NA | 284 | 270 | 253 | 259 | NA | 244 |
| 2003 | NA | 288 | 280 | 259 | 263 | NA | 252 |
| 2005 | NA | 289 | 280 | 262 | 264 | NA | 255 |
| 2007 | NA | 291 | 285 | 265 | 266 | NA | 260 |
| 2009 | NA | 293 | 286 | 266 | 265 | NA | 261 |
| 2011 | 305 | 293 | 288 | 270 | 265 | 269 | 262 |
| 2013 | 309 | 294 | 288 | 272 | 269 | 275 | 263 |
| 2015 | 307 | 292 | 285 | 270 | 267 | 276 | 260 |
| 2017 | 312 | 293 | 287 | 269 | 267 | 274 | 260 |
| 2019 | 313 | 292 | 286 | 268 | 262 | 266 | 260 |
Note(s):
NAEP is National Assessment of Educational Progress. Data were not available for all years. The scale for NAEP mathematics assessment scores is 0–500 for grade 8.
Source(s):
NCSES, special tabulations (2020) of the main NAEP 2000–19 mathematics assessments, NCES, ED.
Public middle and high school mathematics and science teachers with 3 years or less of teaching experience, by selected school characteristics: 2017–18
| Characteristic | Mathematics teachers | Science teachers |
|---|---|---|
| All public middle and high schools | 17 | 16 |
| West region | 20 | 15 |
| South region | 19 | 20 |
| Midwest region | 13 | 14 |
| Northeast region | 14 | 10 |
| 75% or more school poverty | 23 | 22 |
| 50%–74% school poverty | 17 | 17 |
| 35%–49% school poverty | 15 | 13 |
| 0%–34% school poverty | 14 | 13 |
| 75% or more minority enrollment | 23 | 18 |
| 50%–74% minority enrollment | 19 | 22 |
| 25%–49% minority enrollment | 14 | 13 |
| 0%–24% minority enrollment | 13 | 13 |
Note(s):
School poverty level is the percentage of students in school qualifying for free or reduced-price lunch.
Source(s):
NCSES, special tabulations (2020) of 2017–18 National Teacher and Principal Survey, NCES, ED.
S&E Higher Education in the United States
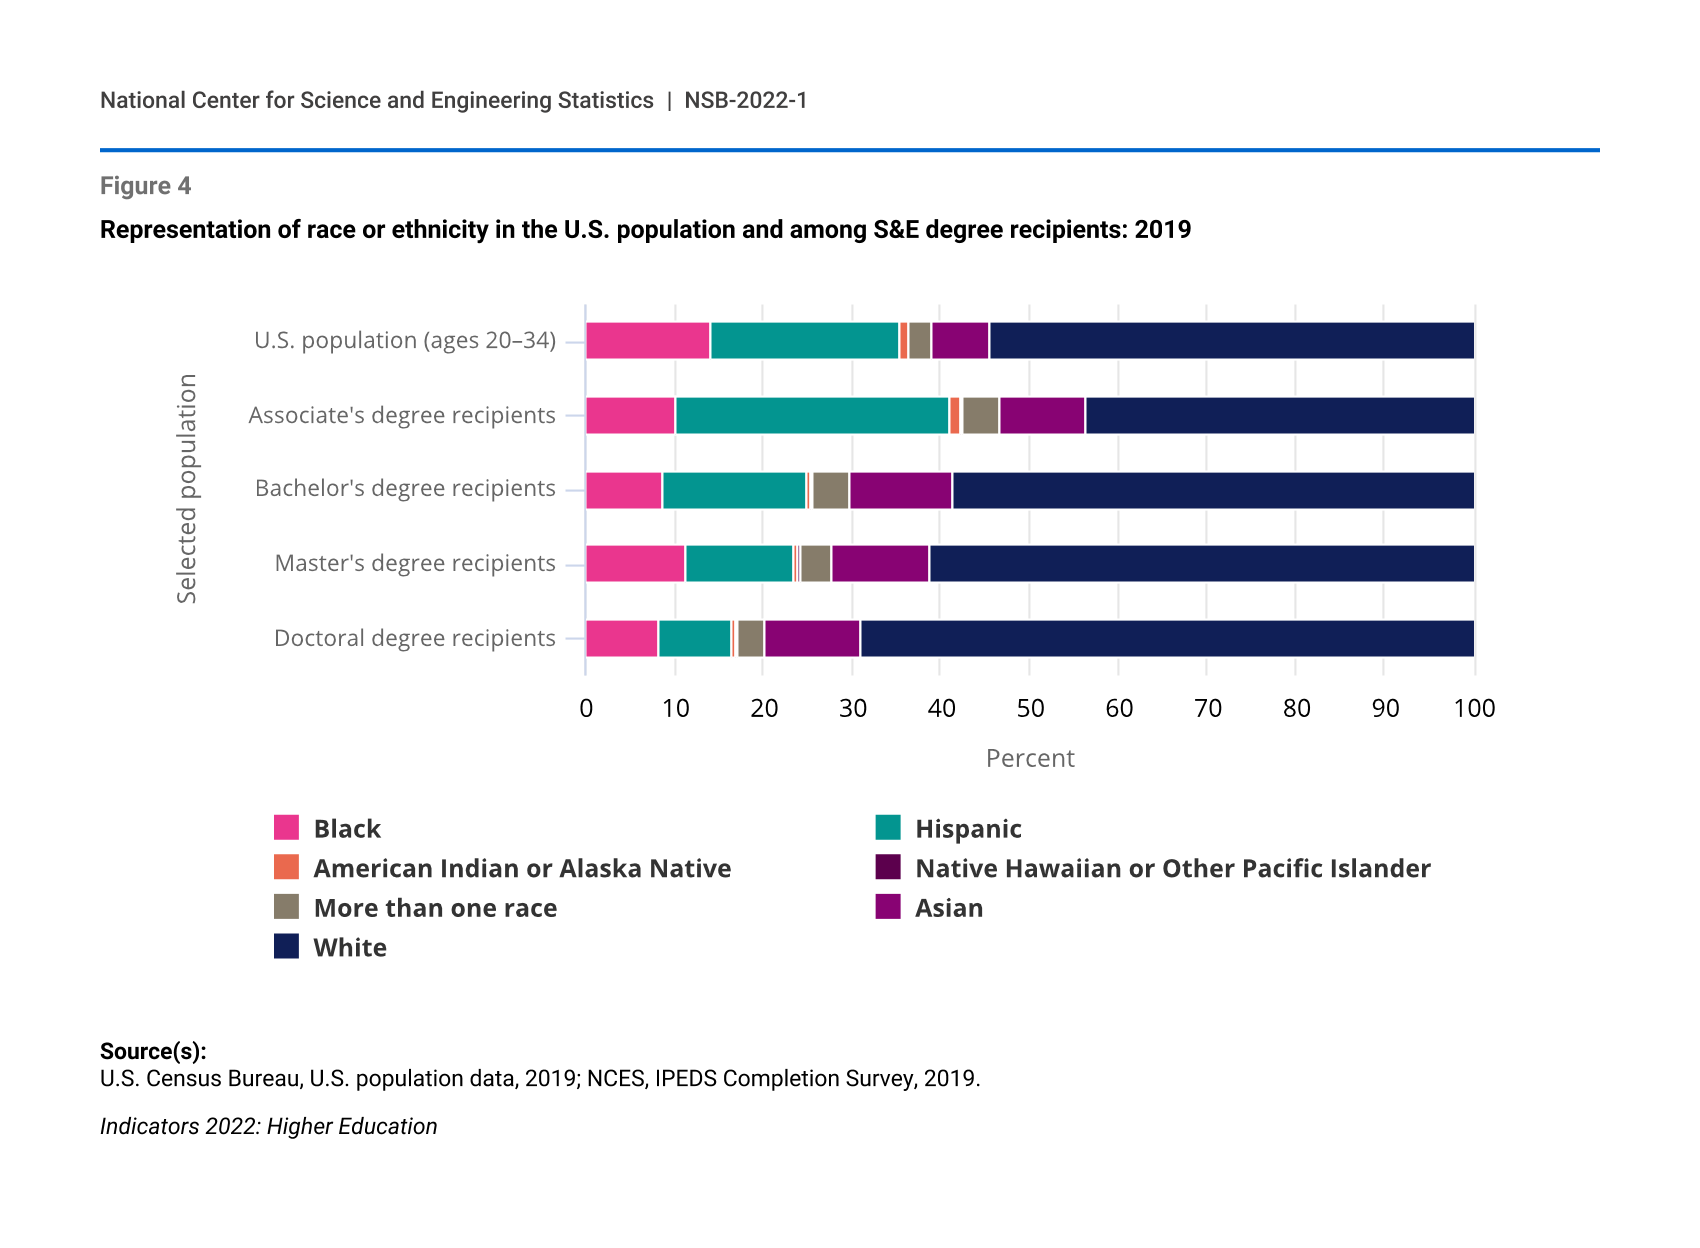
Although some students transition directly from high school to the STEM labor force, the nation’s S&E enterprise depends heavily on recipients of higher education degrees in S&E fields (see Glossary section for list of S&E fields). The number of degrees in S&E fields across all degree levels increased from 561,000 in 2000 to 1,087,000 in 2019, an increase in percentage share of S&E degrees from 24% to 27%. However, many groups of Americans remained underrepresented among S&E degree recipients. Blacks were underrepresented at all degree levels, whereas Hispanics and American Indians and Alaska Natives were underrepresented at all but the associate’s degree level (Figure 4).
Many students and their families invest in higher education, but increases in the cost of undergraduate education have far exceeded inflation or increases in average family income, contributing to concerns about affordability of higher education. The average undergraduate charge at public 4-year institutions as a percentage of per capita disposable personal income increased from around 33% in the early 2000s to 41% in 2019. Since 1994, this measure has increased in every state, and in 2019 ranged from a low of 26% in Wyoming to a high of 58% in Vermont, with eight states over 50%.
Many students enter higher education through the less expensive community college path. Among students who completed high school in 2018 and immediately enrolled in college, approximately two-fifths enrolled in community colleges. Community colleges prepare students to directly enter the workforce with associate’s degrees or non-degree credentials such as certificates or to transition to 4-year institutions. In 2019, the United States awarded 104,000 associate’s degrees in S&E fields and 123,000 in S&E technologies. Degrees in S&E technologies have a more applied focus than S&E degrees and include technician degree programs in engineering, health sciences, and other S&E fields. In addition, students can also earn certificates in S&E technologies. Community colleges awarded most (65%) of the 258,000 certificates awarded in S&E technologies in 2019. Students often earn one or more certificates alongside or instead of a degree.
Bachelor’s degrees account for nearly 70% of all S&E degrees awarded, with the largest numbers awarded in social sciences, followed by biological and agricultural sciences. Master’s degrees either prepare students for some STEM careers or mark a step toward obtaining a doctoral degree. The number of master’s degrees awarded in S&E fields more than doubled from 2000 to 2019. Increases were most pronounced in computer sciences and engineering, largely driven by students on temporary visas. In 2019, S&E fields accounted for 65% of doctorates conferred by U.S. universities, with S&E doctorate awards rising faster since 2000 than total doctorate awards. Across fields, the largest percentage increases since 2000 occurred in engineering, computer sciences, and medical sciences.
Representation of race or ethnicity in the U.S. population and among S&E degree recipients: 2019
| Selected population | Black | Hispanic | American Indian or Alaska Native | Native Hawaiian or Other Pacific Islander | More than one race | Asian | White |
|---|---|---|---|---|---|---|---|
| U.S. population (ages 20–34) | 14.2 | 21.3 | 0.8 | 0.2 | 2.5 | 6.6 | 54.4 |
| Associate's degree recipients | 10.1 | 31.1 | 1.0 | 0.4 | 4.1 | 9.7 | 43.7 |
| Bachelor's degree recipients | 8.7 | 16.3 | 0.4 | 0.2 | 4.3 | 11.3 | 58.8 |
| Master's degree recipients | 11.3 | 12.2 | 0.4 | 0.2 | 3.6 | 11.1 | 61.2 |
| Doctoral degree recipients | 8.1 | 8.4 | 0.4 | 0.2 | 3.2 | 10.6 | 69.1 |
Source(s):
U.S. Census Bureau, U.S. population data, 2019; NCES, IPEDS Completion Survey, 2019.
International S&E Higher Education and Student Mobility
Consistent with their large populations, India and China lead the world in awarding S&E first-university degrees, which are roughly equivalent to bachelor’s degrees (see Glossary section for definition of first-university degrees). The United States is next, followed by Brazil, Mexico, the United Kingdom, Japan, Turkey, Germany, South Korea, and France. The number of first-university degrees awarded has risen since 2000 for all these countries except Japan.
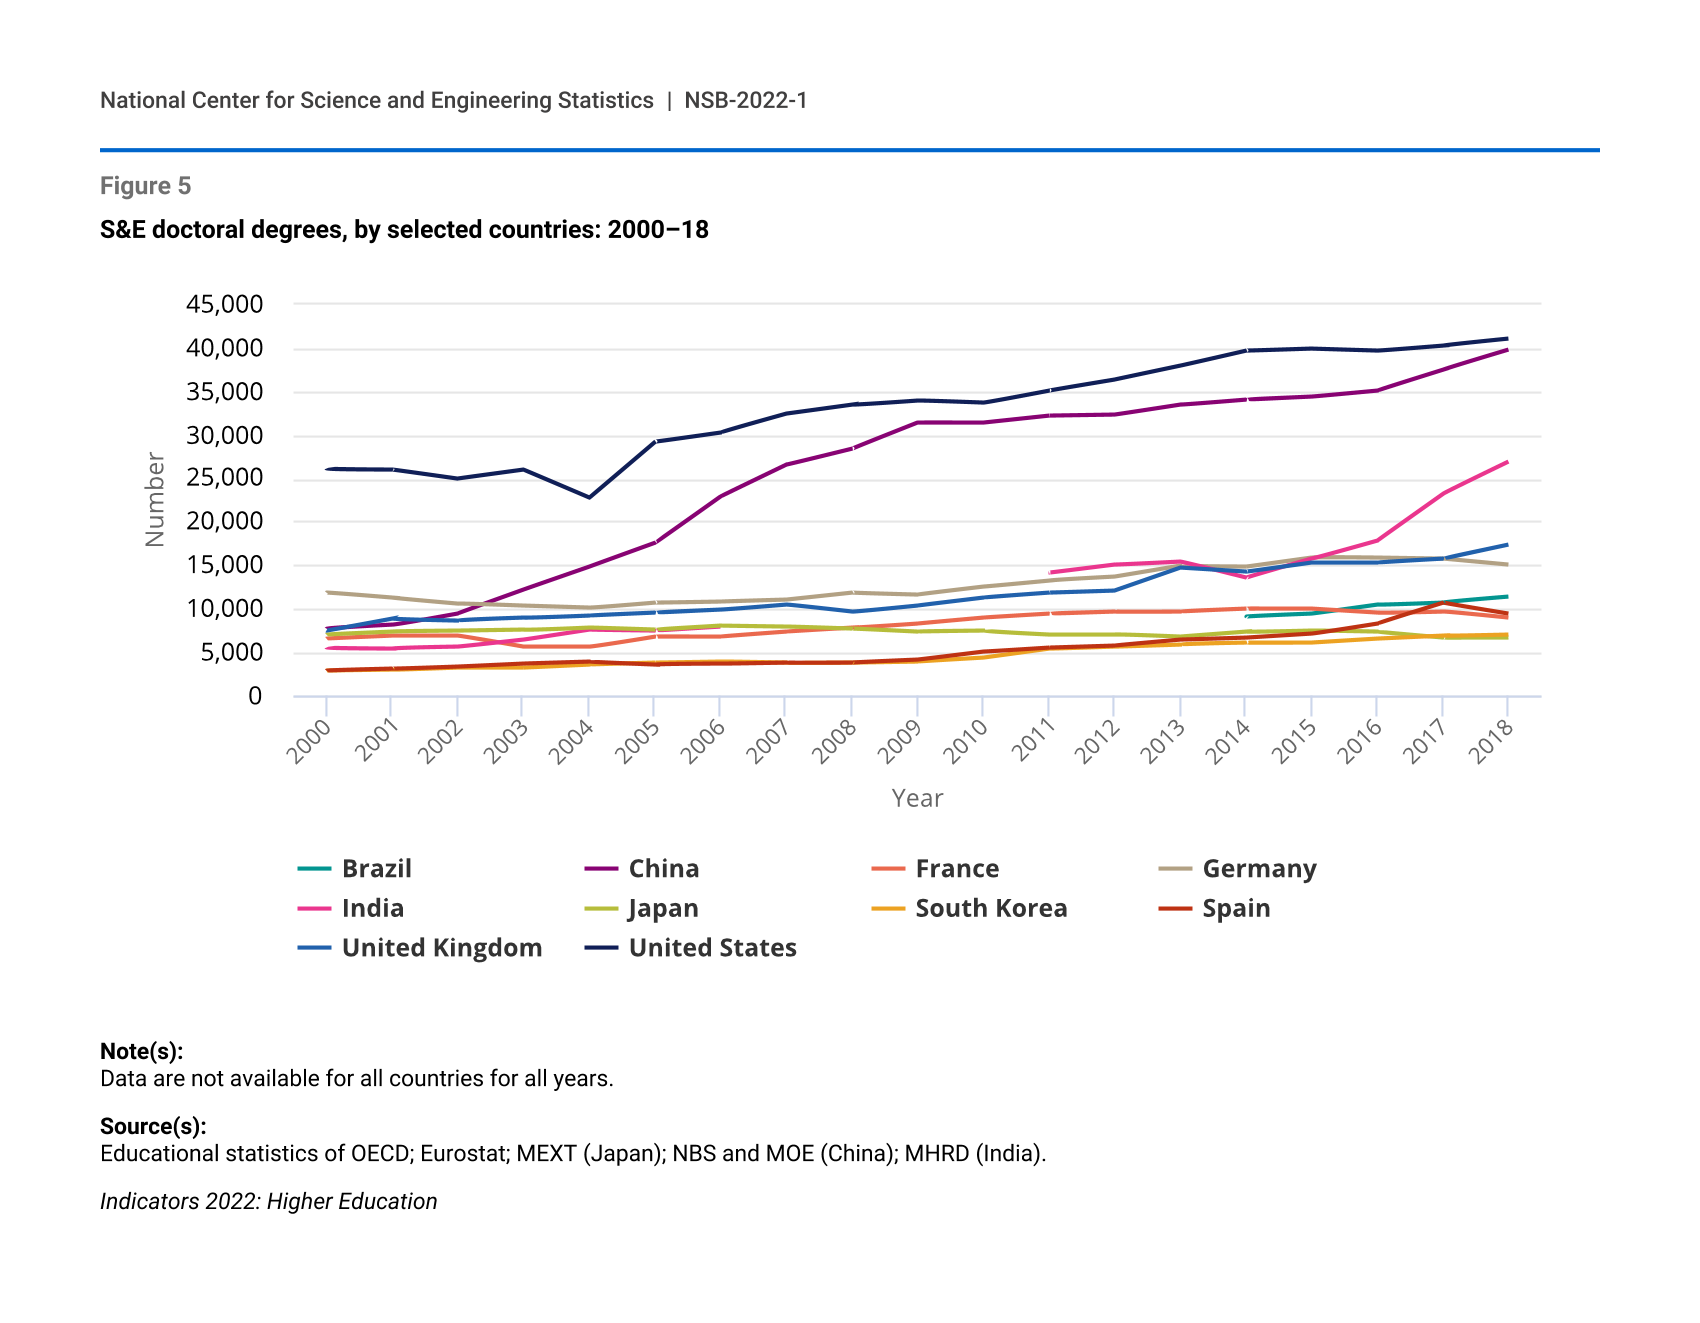
For decades, the United States has led the world in the number of S&E doctorates awarded (41,000 in 2018); however, China is closing the gap (Figure 5). Indeed, as of 2007, China surpassed the United States in awarding the most doctorate degrees in natural sciences and in engineering (excluding social and behavioral sciences; see Glossary section for definition of natural sciences). In 2018, China awarded nearly 38,000 doctorates in natural sciences and in engineering; the United States awarded 31,000. For most of the top countries or nations awarding S&E doctorates, the largest proportion was awarded in physical and biological sciences and mathematics and statistics. However, in China, South Korea, and Japan, engineering students receive the most S&E doctoral degrees.
S&E doctoral degrees, by selected countries: 2000–18
| Year | Brazil | China | France | Germany | India | Japan | South Korea | Spain | United Kingdom | United States |
|---|---|---|---|---|---|---|---|---|---|---|
| 2000 | NA | 7,766 | 6,640 | 11,888 | 5,541 | 7,089 | 2,914 | 2,937 | 7,481 | 26,086 |
| 2001 | NA | 8,153 | 6,957 | 11,271 | 5,504 | 7,401 | 3,013 | 3,124 | 8,878 | 26,060 |
| 2002 | NA | 9,523 | 6,957 | 10,618 | 5,637 | 7,461 | 3,294 | 3,394 | 8,722 | 24,992 |
| 2003 | NA | 12,238 | 5,639 | 10,340 | 6,471 | 7,581 | 3,280 | 3,741 | 8,971 | 26,011 |
| 2004 | NA | 14,858 | 5,639 | 10,107 | 7,636 | 7,912 | 3,629 | 3,965 | 9,267 | 22,797 |
| 2005 | NA | 17,595 | 6,868 | 10,740 | 7,537 | 7,658 | 3,817 | 3,659 | 9,582 | 29,216 |
| 2006 | NA | 22,953 | 6,854 | 10,871 | 7,982 | 8,122 | 3,943 | 3,684 | 9,916 | 30,289 |
| 2007 | NA | 26,582 | 7,402 | 11,084 | NA | 8,017 | 3,796 | 3,825 | 10,524 | 32,394 |
| 2008 | NA | 28,439 | 7,835 | 11,887 | NA | 7,761 | 3,867 | 3,852 | 9,674 | 33,423 |
| 2009 | NA | 31,423 | 8,356 | 11,691 | NA | 7,396 | 3,994 | 4,167 | 10,425 | 33,953 |
| 2010 | NA | 31,410 | 9,025 | 12,576 | NA | 7,470 | 4,421 | 5,101 | 11,322 | 33,672 |
| 2011 | NA | 32,208 | 9,466 | 13,281 | 14,191 | 7,100 | 5,454 | 5,576 | 11,859 | 35,113 |
| 2012 | NA | 32,331 | 9,692 | 13,666 | 15,132 | 7,100 | 5,713 | 5,812 | 12,103 | 36,356 |
| 2013 | NA | 33,490 | 9,731 | 14,936 | 15,500 | 6,791 | 5,963 | 6,474 | 14,732 | 37,951 |
| 2014 | 9,124 | 34,103 | 10,023 | 14,912 | 13,616 | 7,357 | 6,087 | 6,708 | 14,271 | 39,682 |
| 2015 | 9,414 | 34,440 | 10,020 | 15,957 | 15,780 | 7,540 | 6,104 | 7,174 | 15,338 | 39,933 |
| 2016 | 10,469 | 35,147 | 9,564 | 15,871 | 17,905 | 7,391 | 6,557 | 8,373 | 15,338 | 39,710 |
| 2017 | 10,752 | 37,506 | 9,755 | 15,761 | 23,246 | 6,745 | 6,903 | 10,711 | 15,757 | 40,319 |
| 2018 | 11,365 | 39,768 | 8,987 | 15,061 | 26,890 | 6,754 | 7,077 | 9,480 | 17,366 | 41,071 |
Note(s):
Data are not available for all countries for all years.
Source(s):
Educational statistics of OECD; Eurostat; MEXT (Japan); NBS and MOE (China); MHRD (India).
More international students come to the United States than to any other country (18% of international students worldwide). Students on temporary visas studying in the United States earn a small proportion of S&E bachelor’s degrees (7% in 2019, just under 50,000), but they are more likely than U.S. citizens and permanent residents to study S&E (49% of students on temporary visas study S&E versus 35% of U.S. citizens and permanent residents). At the master's level, students on temporary visas are earning increasing shares of S&E degrees: 36% (just under 75,000) in 2019 compared with 26% in 2011. During this period, the greatest increases were in engineering and computer sciences. In 2019, temporary visa holders earned 50% and 57% of total master’s degrees in these fields, respectively. Students on temporary visas earned about one-third of S&E doctorates awarded in 2019, around the same proportion as in 2011. Differences by field also remained stable, regardless of representation of temporary visa holders in those fields. In 2019, temporary visa holders earned over half of U.S. doctoral degrees in economics, computer sciences, engineering, and mathematics and statistics but only around 20% of U.S. doctoral degrees in the social and behavioral sciences.
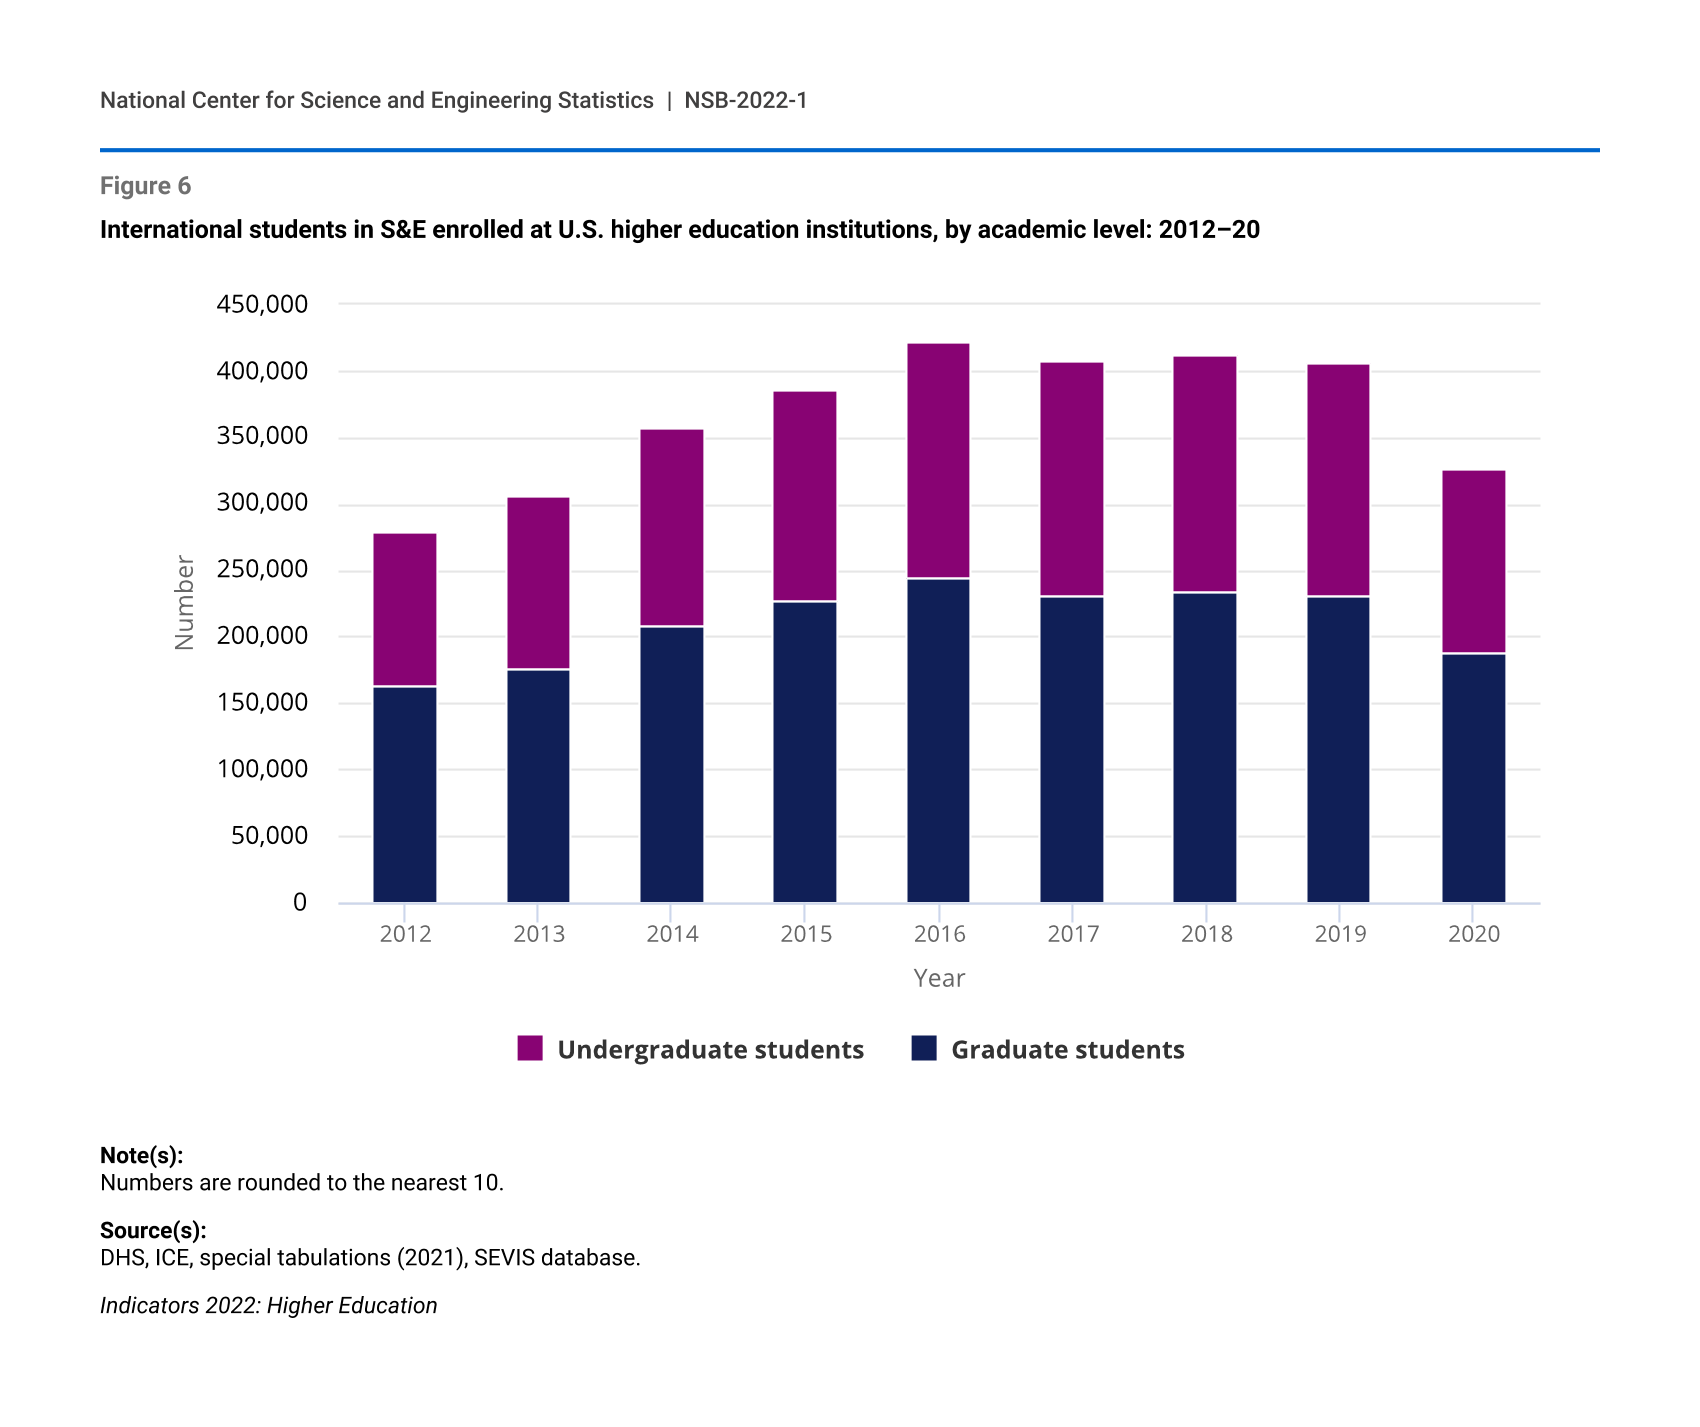
The coronavirus pandemic contributed to the decline of international higher education enrollment worldwide in 2020. The number of international S&E students enrolled at U.S. institutions of higher education declined by about 20% (80,000) from 2019 to 2020 (Figure 6). The proportion of the pandemic-associated decline was larger for undergraduates than for graduate students, and it was larger for students studying non-S&E fields than for those studying S&E fields.
International students in S&E enrolled at U.S. higher education institutions, by academic level: 2012–20
| Year | Graduate students | Undergraduate students |
|---|---|---|
| 2012 | 162,920 | 116,060 |
| 2013 | 176,100 | 130,300 |
| 2014 | 208,630 | 148,100 |
| 2015 | 227,200 | 158,170 |
| 2016 | 244,510 | 176,960 |
| 2017 | 229,770 | 177,380 |
| 2018 | 233,600 | 179,440 |
| 2019 | 230,770 | 174,920 |
| 2020 | 188,200 | 137,620 |
Note(s):
Numbers are rounded to the nearest 10.
Source(s):
DHS, ICE, special tabulations (2021), SEVIS database.
Americans’ Perceptions about Science
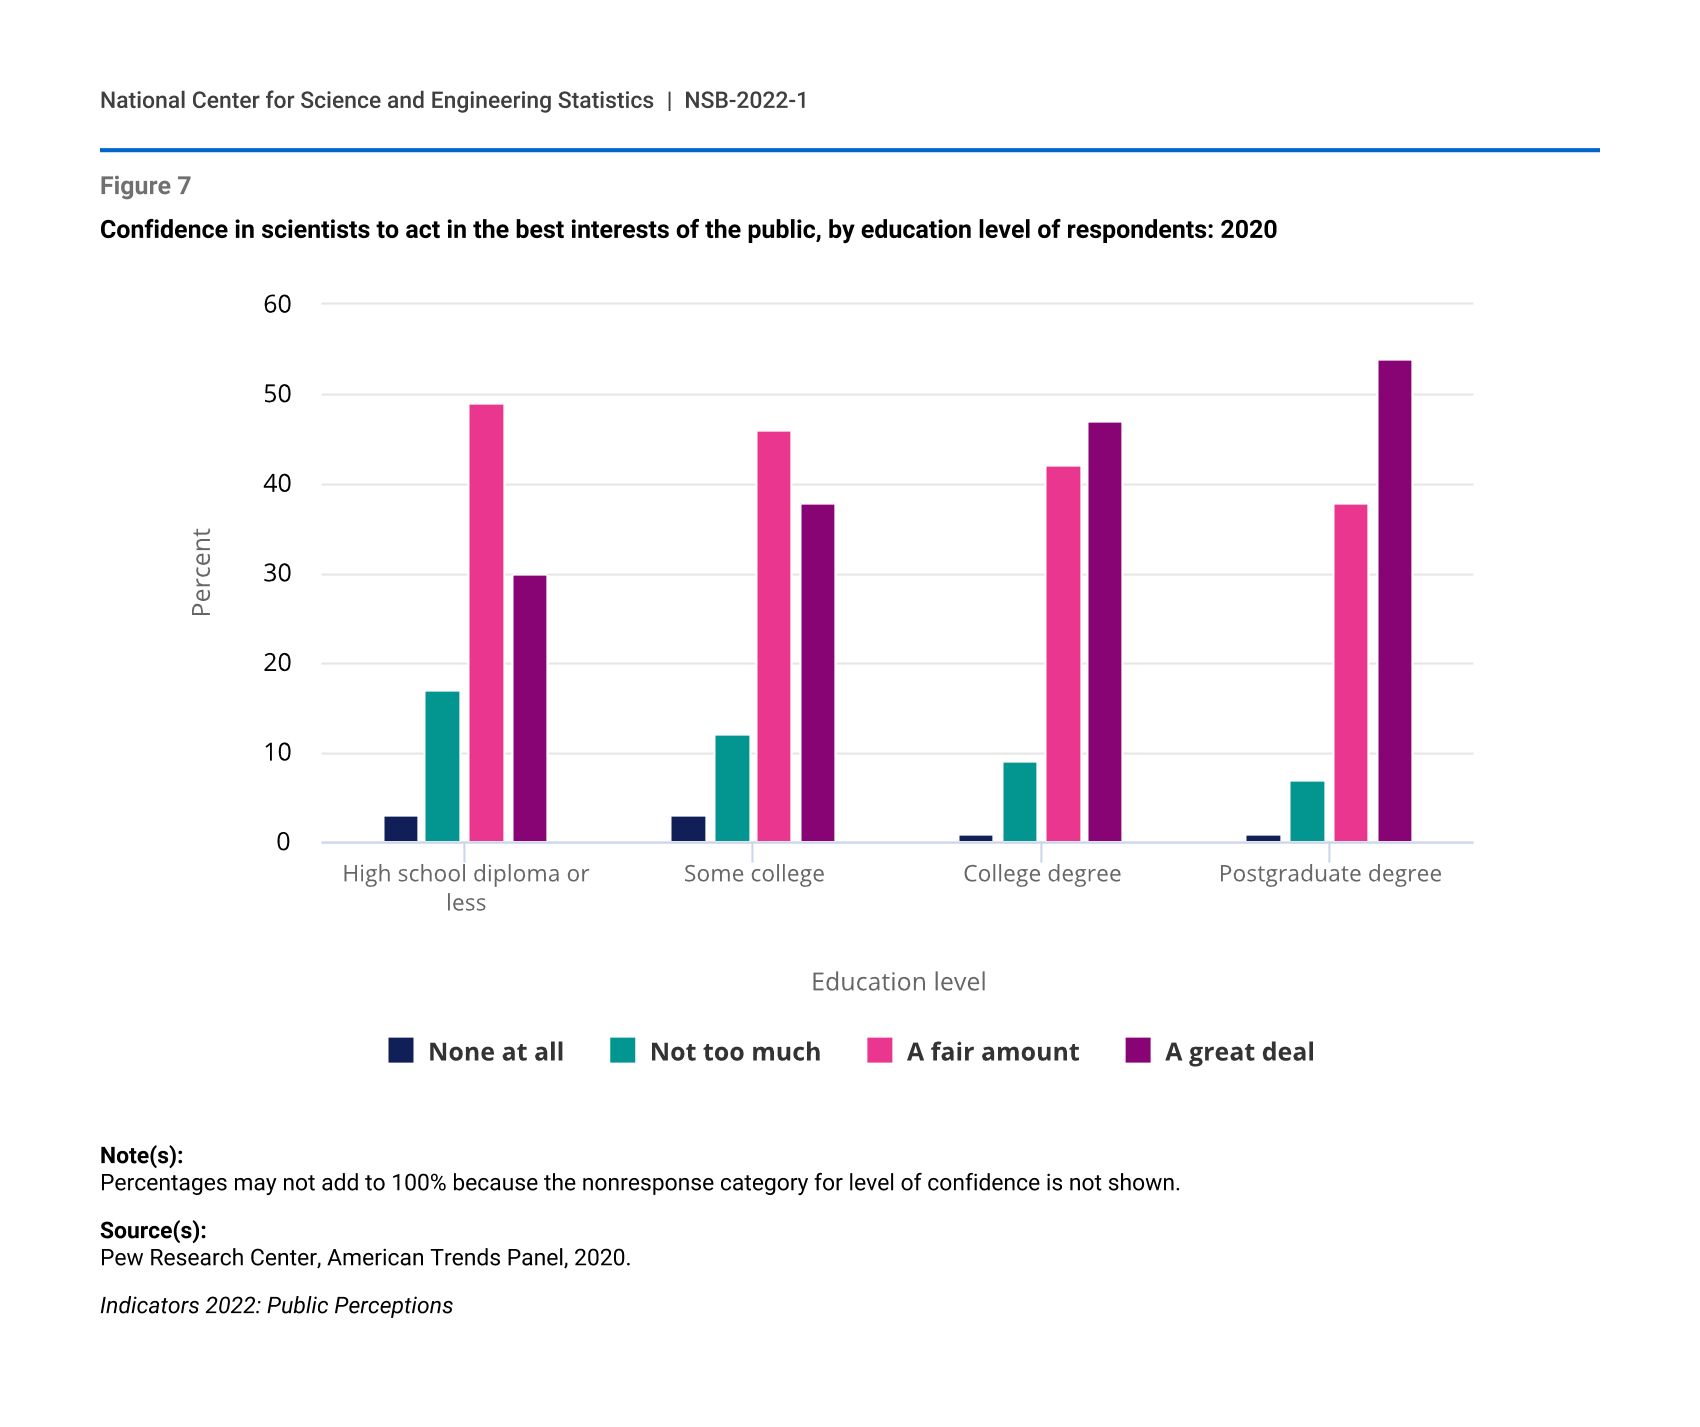
Americans’ expressed trust in scientists varies by level of education. Although 84% of U.S. adults overall expressed “a fair amount” or “a great deal” of confidence in scientists to act in the best interests of the public, this confidence varied slightly by education (Figure 7). For example, 54% of U.S. adults with a postgraduate degree expressed a “great deal” of confidence in scientists, whereas 30% of U.S. adults with a high school diploma or less did. However, nearly half with a high school diploma or less had “a fair amount” of confidence in scientists. A full 20% of those with a high school diploma or less had “not too much” or “none at all” when asked about their level of confidence in scientists. A decline in this percentage was correlated with an increase in educational attainment.
Confidence in scientists to act in the best interests of the public, by education level of respondents: 2020
| Education level | None at all | Not too much | A fair amount | A great deal |
|---|---|---|---|---|
| High school diploma or less | 3 | 17 | 49 | 30 |
| Some college | 3 | 12 | 46 | 38 |
| College degree | 1 | 9 | 42 | 47 |
| Postgraduate degree | 1 | 7 | 38 | 54 |
Note(s):
Percentages may not add to 100% because the nonresponse category for level of confidence is not shown.
Source(s):
Pew Research Center, American Trends Panel, 2020.
The STEM Labor Market and the Economy
The U.S. STEM workforce—comprised of over 36 million people in diverse occupations that require STEM knowledge and expertise—constitutes 23% of the total U.S. workforce (Figure 8)., For this year, Science and Engineering Indicators introduced a new definition of the STEM workforce, which now encompasses all workers who use S&E skills in their jobs rather than defining the workforce mostly based on degree level. This new definition more than doubles the number of individuals classified within the STEM workforce by including 16 million workers with at least a bachelor’s degree and 20 million workers without a bachelor’s degree, also referred to as the STW.
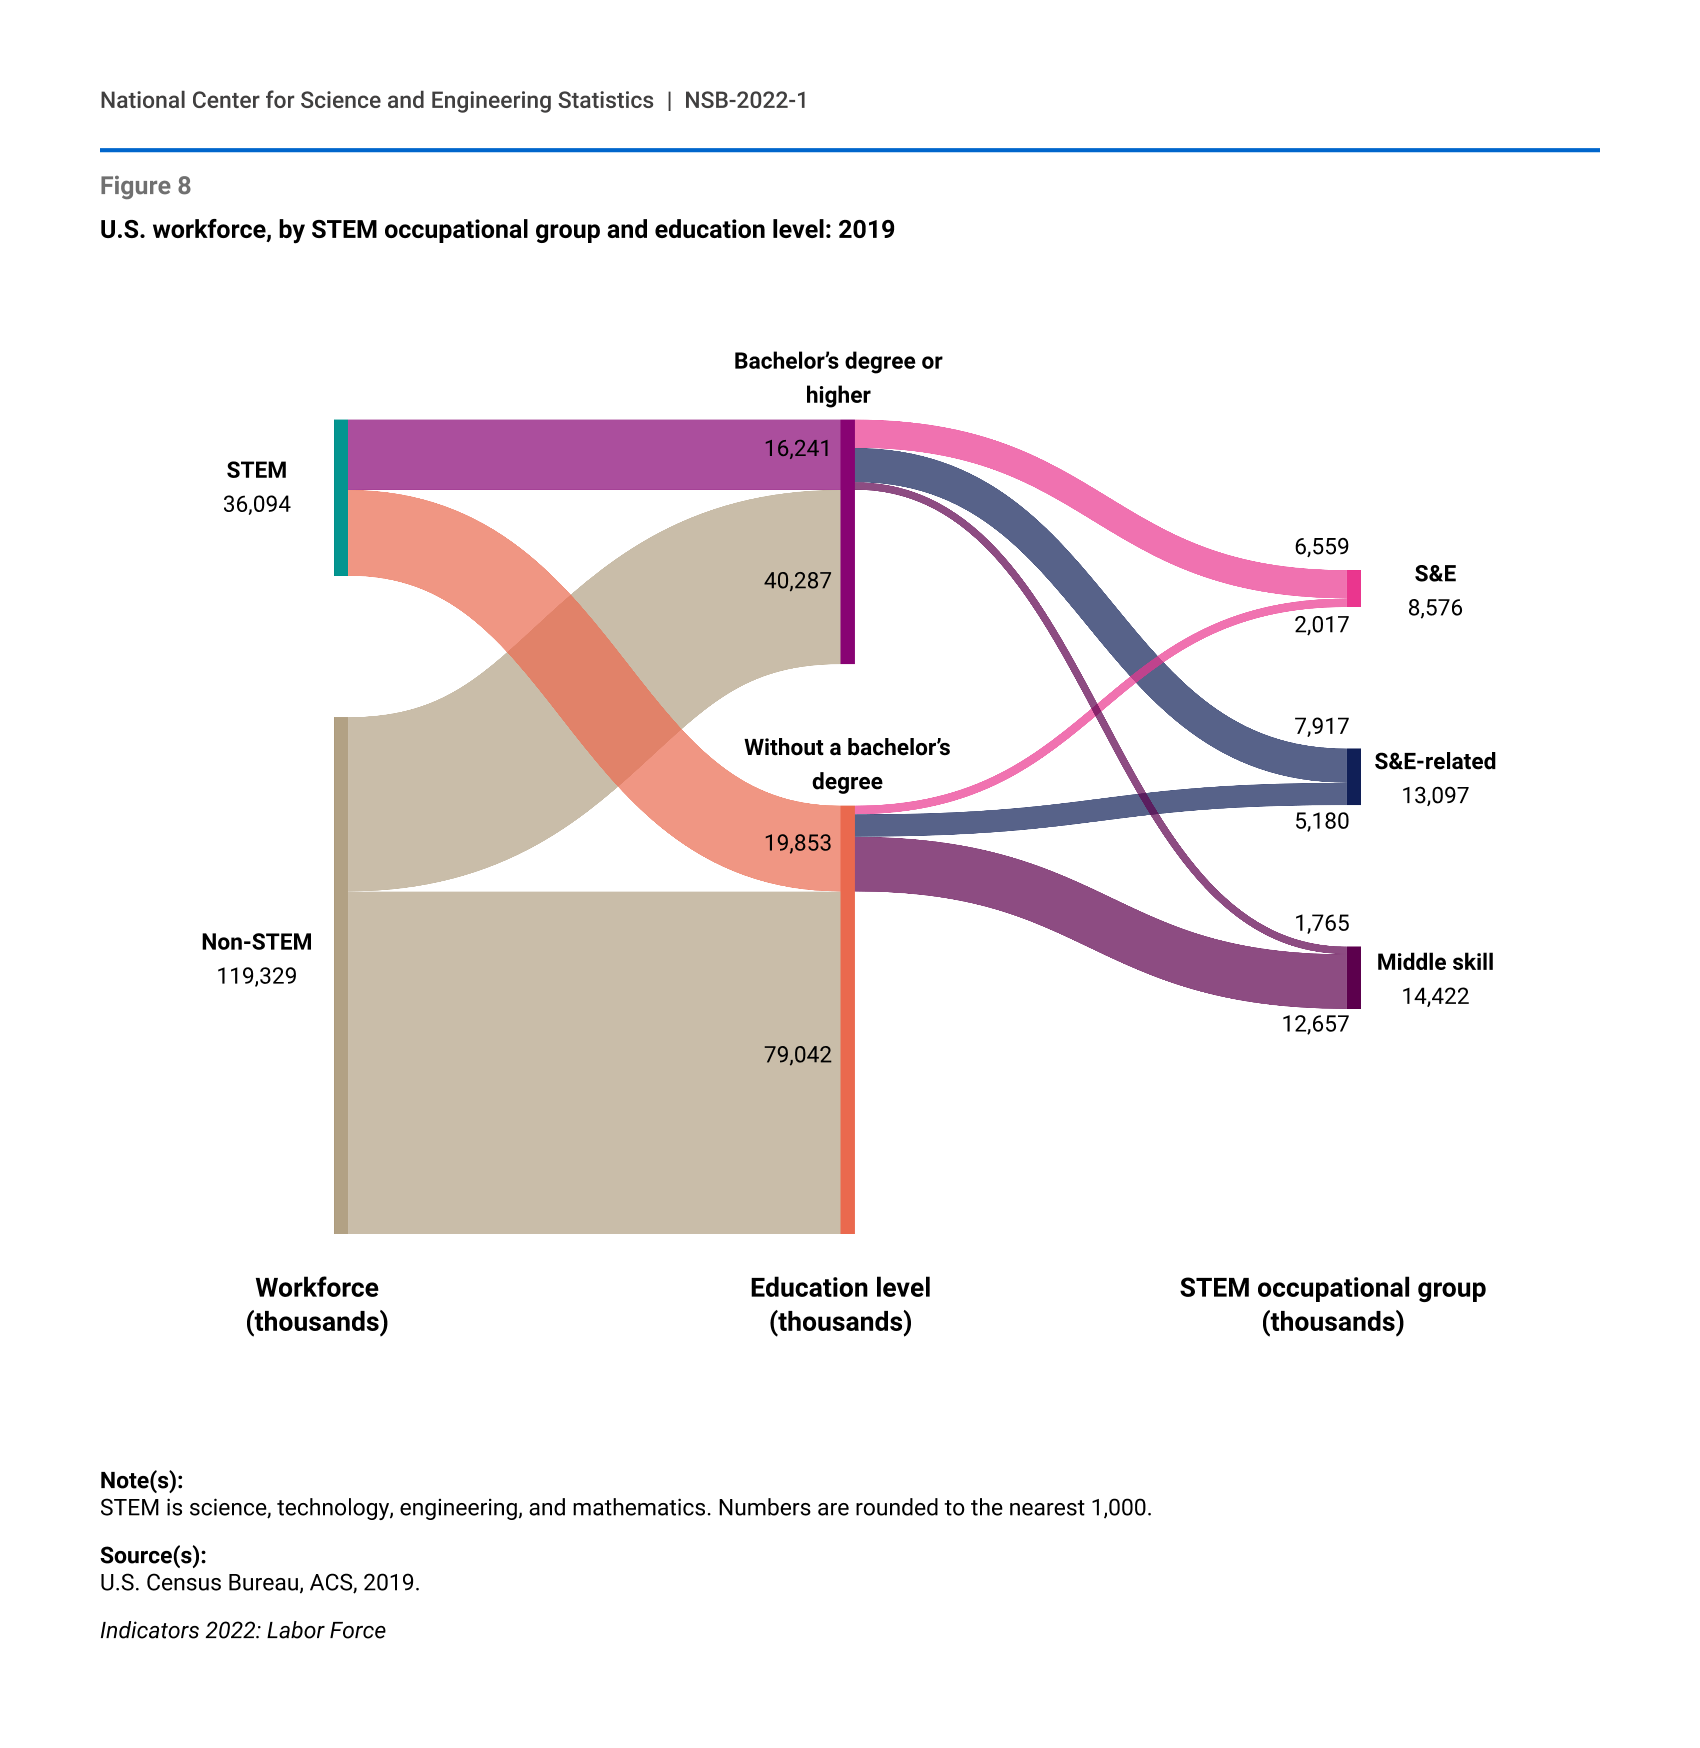
U.S. workforce, by STEM occupational group and education level: 2019
Note(s):
STEM is science, technology, engineering, and mathematics. Numbers are rounded to the nearest 1,000.
Source(s):
U.S. Census Bureau, ACS, 2019.
The STEM workforce includes occupations well understood to require STEM skills and expertise that typically require a bachelor’s degree, referred to as S&E occupations and S&E-related occupations (see Glossary section for definitions of S&E occupations and S&E-related occupations). Of the 8.6 million STEM workers in S&E occupations, 6.6 million (76%) hold at least a bachelor’s degree and 2 million do not have a bachelor’s degree (Figure 8). Similarly, of the 13.1 million STEM workers in S&E-related occupations, 7.9 million (60%) hold at least a bachelor’s degree or higher and 5.2 million do not have a bachelor’s degree. In addition to S&E and S&E-related occupations, the STEM workforce also includes middle-skill occupations that require STEM skills but typically do not require a bachelor’s degree for entry. Middle-skill occupations include those in the areas of installation, maintenance and repair, construction trades, and production. Of the 14.4 million middle-skill workers, 12.7 million (88%) do not have a bachelor’s degree.
Workers in STEM occupations have higher median earnings and lower unemployment than their non-STEM counterparts. In 2019, STEM workers earned a median annual salary of $55,000, and non-STEM workers earned a median annual salary of $33,000. Also in 2019, unemployment was lower among the STEM labor force (2%) than the non-STEM labor force (4%). This pattern held during the economic downturn associated with the coronavirus pandemic (see sidebar Disruptions and Breakthroughs in S&E during the COVID-19 Pandemic).
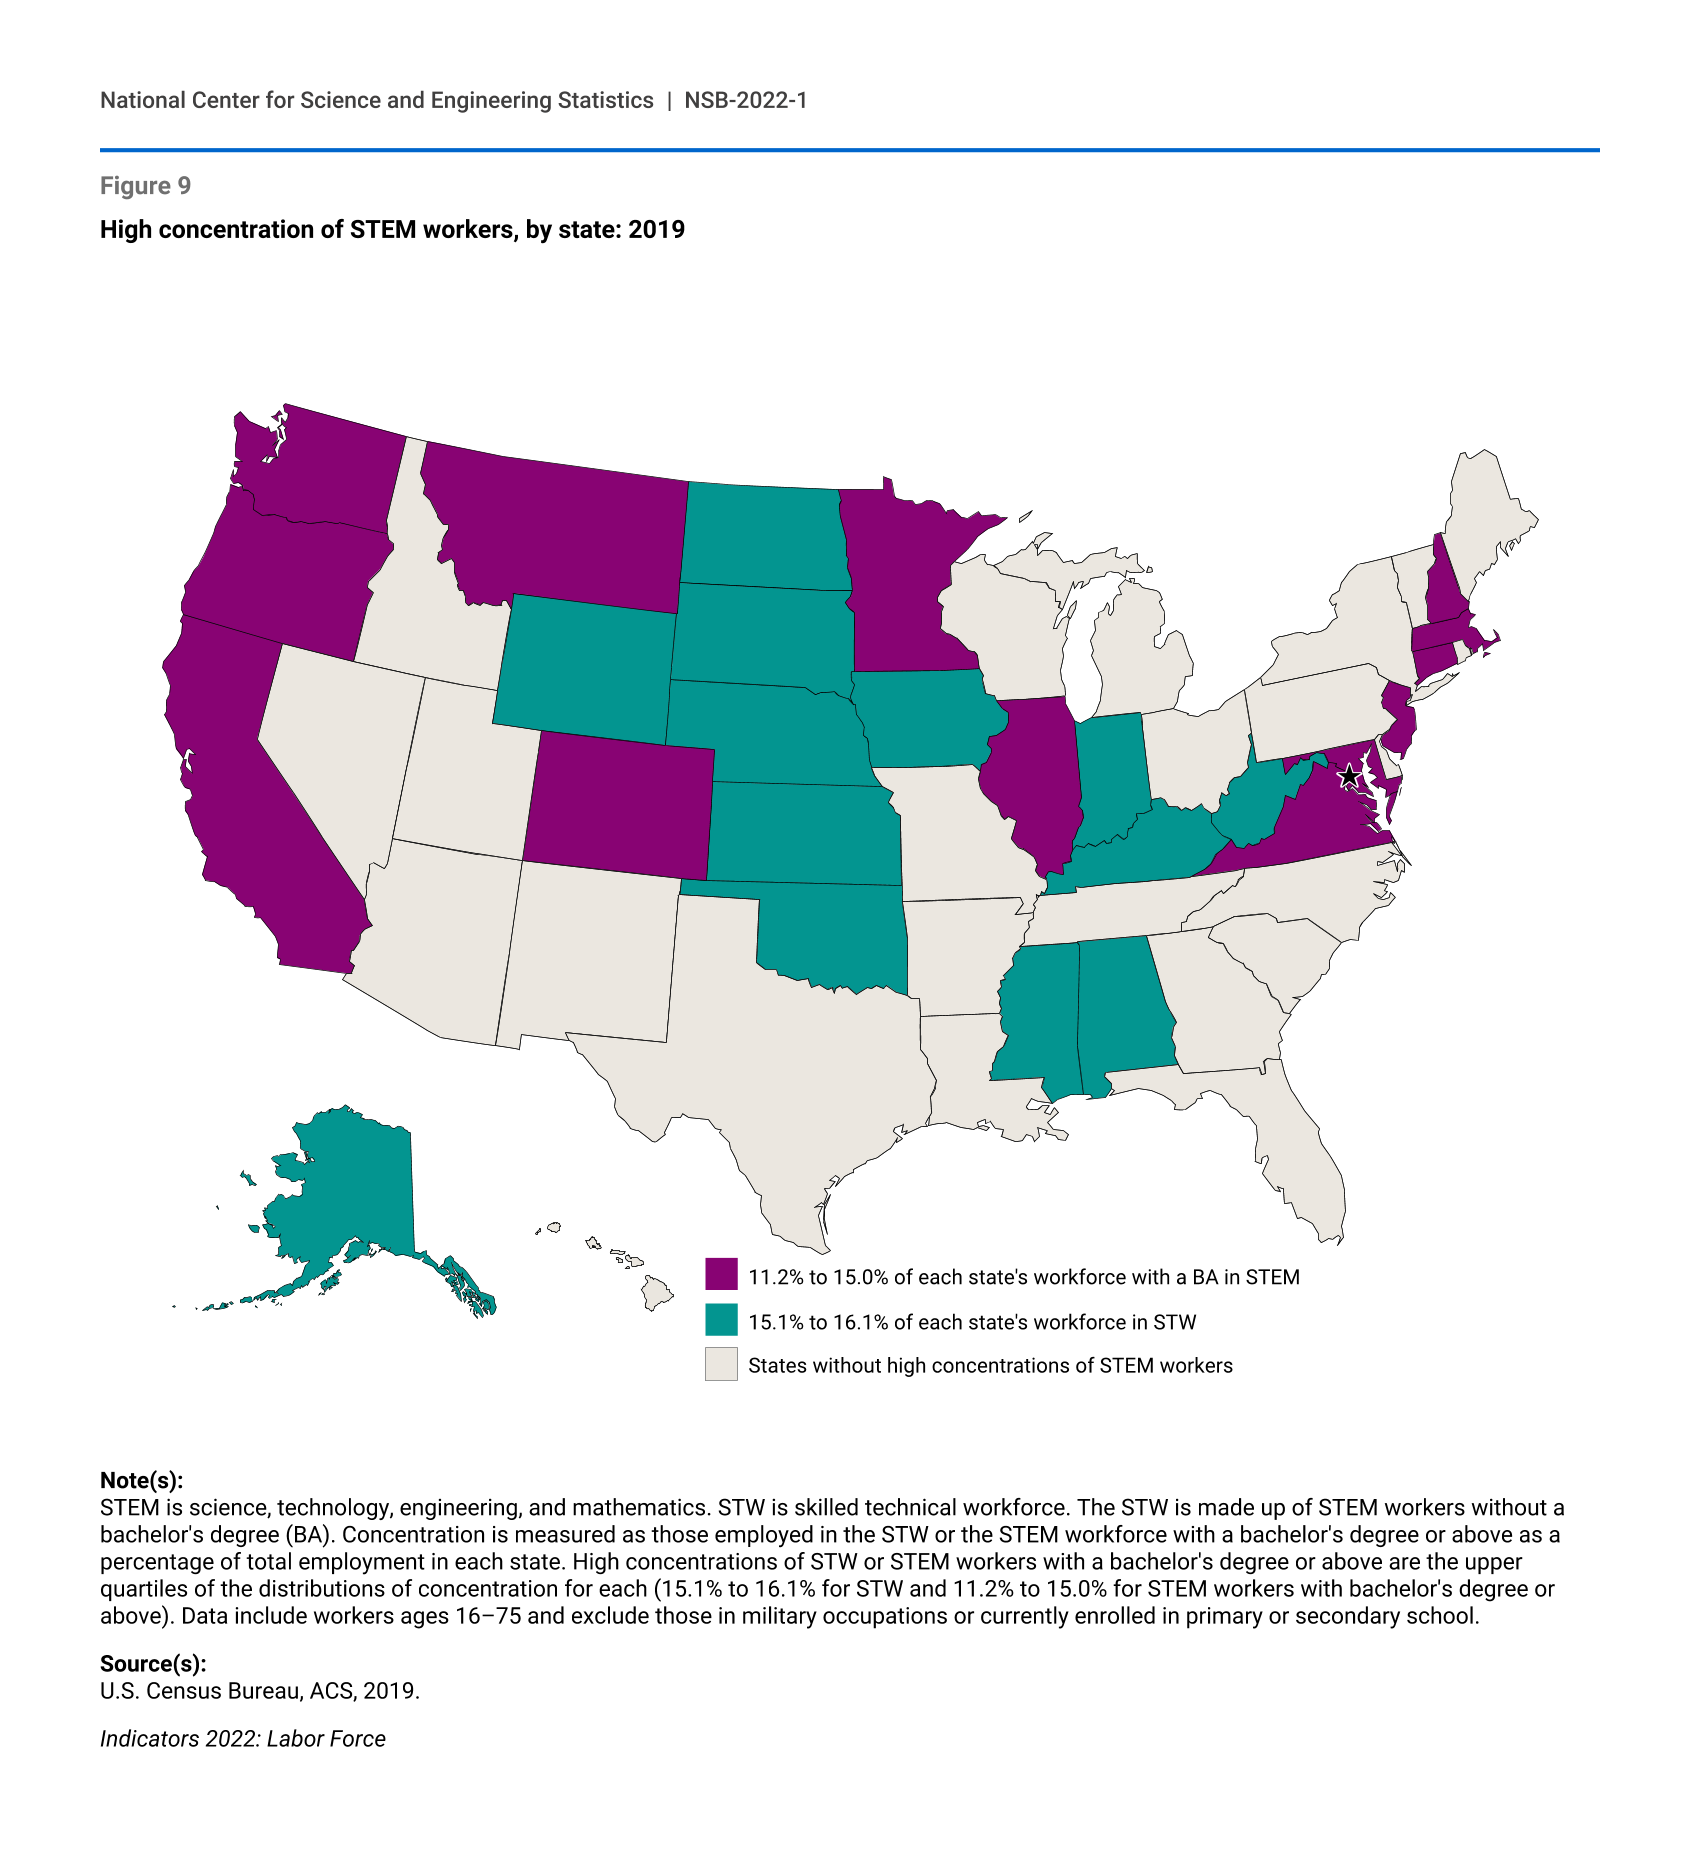
STEM jobs have grown faster than non-STEM jobs since 2010, and many STEM jobs are projected to grow in the future. However, this projected growth may be unevenly distributed across the United States. In 2019, out of the total workforce in each state, a greater proportion of STEM workers with a bachelor’s degree or higher were employed in coastal states and the Midwest region, whereas a greater proportion of the STW were employed in states in the South and the Midwest regions of the United States (Figure 9).
High concentration of STEM workers, by state: 2019
Note(s):
STEM is science, technology, engineering, and mathematics. STW is skilled technical workforce. The STW is made up of STEM workers without a bachelor's degree (BA). Concentration is measured as those employed in the STW or the STEM workforce with a bachelor's degree or above as a percentage of total employment in each state. High concentrations of STW or STEM workers with a bachelor's degree or above are the upper quartiles of the distributions of concentration for each (15.1% to 16.1% for STW and 11.2% to 15.0% for STEM workers with bachelor's degree or above). Data include workers ages 16–75 and exclude those in military occupations or currently enrolled in primary or secondary school.
Source(s):
U.S. Census Bureau, ACS, 2019.
Demographic Composition of the STEM Workforce
Women make up about one-third of the STEM workforce, less than their representation in the employed U.S. population (48%). The share of women in STEM grew from 32% in 2010 to 34% in 2019. However, this growth was due to the increase in the proportion of women with a bachelor’s degree or higher in STEM, growing from 42% (5 million women) in 2010 to 44% (7 million women) in 2019 (Figure 10). The proportion of women in the STW remained unchanged at around 26% in both 2010 and 2019.
Furthermore, the distribution of women with a bachelor’s degree or higher was uneven among the different types of STEM occupations. In 2019, women accounted for 48% of life scientists and 65% of social scientists but only 35% of physical scientists, 26% of computer and mathematical scientists, and 16% of engineers. The distribution of women who earned degrees in S&E fields was similar to their distribution among S&E occupations at the bachelor’s degree level or higher.
Blacks, Hispanics, and American Indians or Alaska Natives collectively represented 30% of the employed U.S. population but 23% of the total STEM workforce in 2019. Consequently, they were underrepresented in STEM, largely driven by their underrepresentation among STEM workers with a bachelor’s degree or higher. The share of Hispanic or Latino workers in the STW (19%) was similar to their share of the U.S. workforce in 2019 (18%). However, they were underrepresented among STEM workers with at least a bachelor’s degree (8%). The share of Blacks in the STEM workforce was similarly distributed with 10% in the STW and 12% in the U.S. working population, compared with 7% among STEM workers with a bachelor’s degree or higher.
Demographic composition of the STEM workforce: 2010 and 2019
| Education and sex or race or ethnicity | 2010 | 2019 |
|---|---|---|
| Bachelor's degree or higher: women | 41.9 | 44.2 |
| Bachelor's degree or higher: Hispanic | 5.5 | 7.7 |
| Bachelor's degree or higher: Black | 6.0 | 7.1 |
| Bachelor's degree or higher: AIAN | 0.2 | 0.2 |
| Without a bachelor's degree: women | 26.1 | 25.8 |
| Without a bachelor's degree: Hispanic | 15.0 | 19.4 |
| Without a bachelor's degree: Black | 8.7 | 9.7 |
| Without a bachelor's degree: AIAN | 0.6 | 0.6 |
Note(s):
AIAN is American Indian or Alaska Native. STEM is science, technology, engineering, and mathematics. Percentages may not add to 100% because of rounding.
Source(s):
U.S. Census Bureau, ACS, 2019.
Among STEM workers with a bachelor’s degree, there was wide variation in the representation of Blacks and Hispanics across S&E occupations and women in S&E-related occupations in 2019. Compared with their share of S&E occupations overall (5%), Black workers were disproportionately higher among postsecondary teachers in the social and related sciences (9%), computer support specialists (10%), network and computer systems administrators (11%), and information security analysts (17%). Hispanics, who were 8% of workers in S&E occupations overall, had a relatively large presence among social scientists (12%). Within S&E-related occupations, women with a bachelor’s degree or higher represented 70% of health care workers, but were disproportionately higher among registered nurses, pharmacists, dieticians, therapists, physical assistants, and nurse practitioners (82%); health technologists and technicians (66%); postsecondary teachers in health and related sciences (70%); and other health workers (70%).
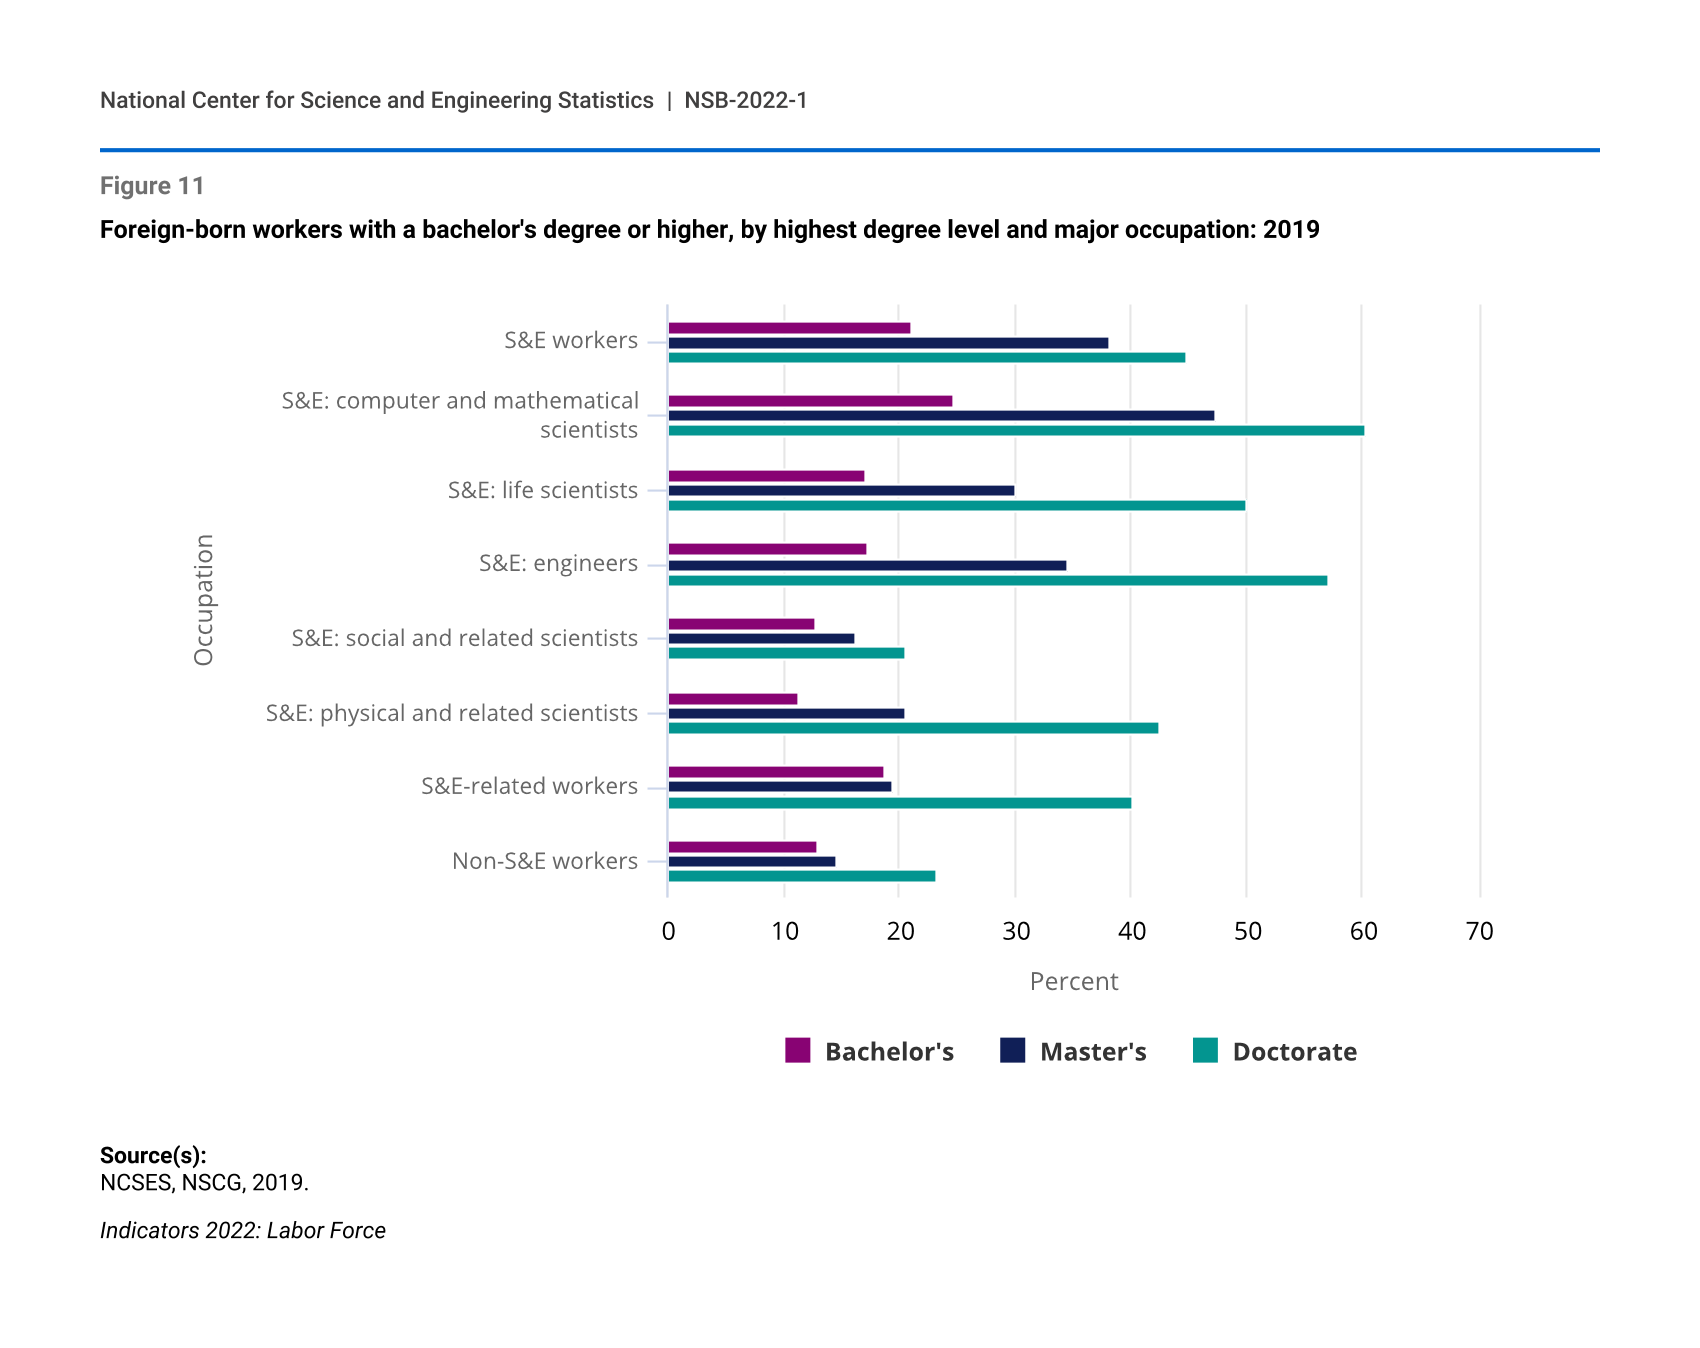
In 2019, foreign-born workers (regardless of citizenship status) accounted for 19% of the STEM workforce, increasing from 17% in 2010. Foreign-born workers with a bachelor’s degree or higher comprise a larger share of the STEM workforce (23%) than do those without a bachelor’s degree (16%). Foreign-born workers with a bachelor’s degree or higher accounted for 21% of workers in S&E occupations at the bachelor’s degree level, 38% at the master’s degree level, and 45% at the doctorate level, with the highest shares as computer and mathematical scientists for all degree levels (Figure 11). Foreign-born workers also make up a substantial portion (26%) of STEM workers at all education levels in knowledge- and technology-intensive (KTI) industries, but they are more concentrated among the pharmaceutical; computer, electronic and optical products; scientific R&D; software publishing; and information technology (IT) service industries. Among foreign-born STEM workers in KTI industries, a little over half of them are U.S. citizens. About 50% of foreign-born workers in the United States whose highest degree was in an S&E field were from Asia, with India (22%) and China (11%) as the leading birthplaces.
Foreign-born workers with a bachelor's degree or higher, by highest degree level and major occupation: 2019
| Occupation | Bachelor's | Master's | Doctorate |
|---|---|---|---|
| S&E workers | 21.0 | 38.2 | 44.8 |
| S&E: computer and mathematical scientists | 24.6 | 47.3 | 60.3 |
| S&E: life scientists | 17.1 | 30.1 | 50.0 |
| S&E: engineers | 17.2 | 34.6 | 57.1 |
| S&E: social and related scientists | 12.8 | 16.2 | 20.6 |
| S&E: physical and related scientists | 11.4 | 20.5 | 42.4 |
| S&E-related workers | 18.7 | 19.4 | 40.2 |
| Non-S&E workers | 12.9 | 14.5 | 23.2 |
Source(s):
NCSES, NSCG, 2019.
Given that foreign-born workers make up 45% of the doctoral workers in S&E occupations, U.S.-trained S&E doctorate recipients who are on temporary visas at the time of graduation are a vital source of STEM workers. Temporary visa holders represented 37% of U.S. S&E doctoral recipients in 2019. For more than a decade, over 75% of these S&E doctorate recipients have stated that they intend to live in the United States in the year after graduation. However, the rate at which these graduates intend to stay in the United States after graduation varies by field of degree. Lower proportions of doctoral recipients in the social sciences (59%) intend to stay relative to those in the life, physical, and computer and mathematical sciences and in engineering (78% to 81%). Place of citizenship also affects intended stay rates (see Glossary section for definition of expected stay rate); students from China and India have relatively high expected stay rates compared with students from Europe and South Korea.