 An official website of the United States government

Job Importance versus Job Satisfaction: A Latent Class Analysis of the 2017 Survey of Doctorate Recipients
Disclaimer
Working papers are intended to report exploratory results of research and analysis undertaken by the National Center for Science and Engineering Statistics (NCSES). Any opinions, findings, conclusions, or recommendations expressed in this working paper do not necessarily reflect the views of the National Science Foundation (NSF). This working paper has been released to inform interested parties of ongoing research or activities and to encourage further discussion of the topic and is not considered to contain official government statistics.
This research was completed while Dr. Fritz was on academic leave from the University of Nebraska–Lincoln and participating in the NCSES Research Ambassador Program (formerly the Data Analysis and Statistics Research Program) administered by the Oak Ridge Institute for Science and Education (ORISE) and Oak Ridge Associate Universities (ORAU). Any opinions, findings, conclusions, or recommendations expressed in this working paper are solely the author’s and do not necessarily reflect the views of NCSES, NSF, ORISE, or ORAU.
Abstract
Person-centered approaches to data analysis can provide valuable information about the science and engineering workforce that cannot be obtained solely by using variable-centered approaches. The purpose of this working paper is to illustrate the use of a specific person-centered method (latent class analysis [LCA]) in a large, nationally representative data set (the 2017 Survey of Doctorate Recipients) to investigate the importance of and satisfaction with nine different job factors, including salary, benefits, and job security. The results of the analyses found that doctorate recipients belonged to one of five job-factor importance classes: (1) all nine job factors are very important; (2) all nine job factors are somewhat important; (3) a job’s benefits, salary, and security are more important than the job’s level of responsibility; (4) a job’s challenge and level of independence are more important than the job’s salary and benefits; and (5) a job’s opportunities for advancement are unimportant. A similar five classes were also found for self-reported satisfaction with each of the same nine job factors. Further analysis found several small, but potentially important, differences in the demographic composition of the importance and satisfaction classes. A congruence analysis showed that while the job factors rated as very important were often the same factors for which doctoral recipients reported the highest satisfaction, this relationship was far from perfect. In addition to discussing modeling assumptions, model selection, and the presentation and interpretation of model results, the paper highlights how the LCA results differ from variable-centered results and relate to existing job satisfaction theories.
Introduction
Background
Identifying differences between groups of individuals is an important aspect of fully documenting the current state of the U.S. science and engineering workforce (SEW). For example, the Women, Minorities, and Persons with Disabilities in Science and Engineering: 2021 special report (NCSES 2021) details differences in a number of SEW-related variables based on an individual’s self-reported gender, race and ethnicity, and physical disability status. Group differences are often tested using variable-centered approaches, such as analysis of variance (ANOVA) and multiple regression, that focus on describing the relationships between specific variables in a population. Variable-centered approaches provide substantial value when groups are based on manifest traits, especially traits that are unidimensional and remain stable across time such as the scientific field in which a degree was earned. When groups are based on latent or multidimensional traits that change over time such as attitudes or beliefs, however, person-centered approaches, which include latent class analysis (LCA) and latent transition analysis (LTA), provide advantages over variable-centered approaches. Specifically, because person-centered approaches focus on discovering and describing unobserved subpopulations of individuals with similar characteristics, they can be used to test for differences between groups defined by complex patterns of responses to large sets of variables and permit individuals to move between groups or for the groups themselves to change over time (Howard and Hoffman 2018). This allows for individuals to be considered holistically, multidimensionally, and longitudinally.
Despite the ability of person-centered approaches to supplement more traditional variable-centered approaches, these analyses remain underutilized to the point that some fields have explicitly called for wider adoption of person-centered methods. For example, in 2011, Organizational Research Methods published two articles on this topic, with the first noting the advantages of using person-centered approaches in organizational research in general (Lawrence and Zyphur 2011) and the second specifying three areas of organizational research where the use of person-centered approaches is especially needed (Wang and Hanges 2011). Given that not all researchers are familiar with person-centered methods and that those who are familiar may not have considered how these methods can be applied to SEW research, the purpose of the current working paper is to illustrate the use of person-centered methods—in this case, LCA—in the context of a large, nationally representative data set. Special attention is given to modeling assumptions, model selection, and the presentation and interpretation of model results.
Science and Engineering Workforce Example
The example selected to illustrate the use of person-centered techniques is motivated by a recent study by Ruiz Castro and colleagues that details the growing trend for early and mid-career science, technology, engineering, and mathematics (STEM) researchers to transition from academic careers to careers outside academia (Ruiz Castro, Van der Heijden, and Henderson 2020). Many reasons are given for these departures, including a decrease in academic job security due to a reduction in the number of tenure-track and tenured positions, a general decrease in public funding for universities, continuously increasing expectations for rapid publishing and research fundraising, and low salaries and benefits relative to nonacademic careers. For example, one survey found that STEM salaries in industry are 30% higher than in academia (Madhusoodanand 2014). As a result, nonacademic careers such as data science—the focus of the Ruiz Castro et al. (2020) study and the so-called “sexiest job of the 21st century” (Davenport and Patil 2012)—that do not have these challenges are increasingly being perceived as more sustainable than academic careers.
An increasing perception that academic careers are unsustainable is of interest to SEW researchers for several reasons. First, a PhD is usually a requirement for an academic position, but many nonacademic jobs do not require a PhD; one job website reported that only about 20% of users who listed their occupation as data scientist also listed a PhD on their resume (Lindner 2018). Some career consulting companies even recommend against getting a PhD unless the goal is an academic position. For example, the first result from a Google search of the query “Should I get a PhD?” on 22 November 2021 is an article that makes the argument that people should not get a PhD if their goal does not involve becoming a university professor (Terry 2019). With some estimates of the current dropout rate for STEM doctoral programs at over 30% (Bostwick and Weinberg 2018), an increased perception that nonacademic careers that do not require PhDs are more sustainable may lead to even more students who leave their PhD program having completed all requirements except the dissertation (i.e., ABD) or who do not enter a doctoral program at all. Second, one of the primary benefits of earning a PhD is an increased salary; the U.S. Bureau of Labor Statistics (BLS) reports that doctoral degree holders have the second highest median salaries and the lowest unemployment rate by educational attainment (BLS 2021). The American Association of University Professors (AAUP) notes, however, that faculty salaries have “barely outpaced inflation” from 2009 through 2020 (AAUP 2020:4) and that the 2020 data were collected before the impact of the COVID-19 pandemic, which may cause some academic institutions to reduce faculty pay and cut academic positions and programs (Flaherty 2020). This may also increase the number of people transitioning to nonacademic careers. Third, university-industry collaborations (UICs) are often cited as a major source of innovation with regard to the development, use, and adaptation of technology; delivery of products and services; administrative and organizational activities; conceptual strategies and objectives; and systematic interaction with other organizations and knowledge bases (Kaloudis et al. 2019). UICs are mutually beneficial because they bring funding to universities in the form of support for students, faculty, and infrastructure projects; see, for example, Boeing’s recent $50 million commitment to the Virginia Polytechnic Institute and State University Innovation Campus (Anderson 2021). But UICs depend on universities having academic researchers to participate in these partnerships.
An obvious place to start investigating what motivates individuals to transition from an academic to a nonacademic career is to look at their level of satisfaction with different factors of their current job and how that satisfaction relates to the relative importance that they give to each of these job factors. There is a substantial body of work on the measurement of job satisfaction and other job attitudes (cf., Dalal and Crede 2013) and on predictors of job satisfaction (e.g., Hoff et al. 2020; Seligman 2012), but studies that have used large, nationally representative samples (e.g., Sabharwal and Corley 2009) have almost exclusively relied on variable-centered approaches. Given that attitudes, beliefs, and intentions are inherently multidimensional; that individuals can hold multiple beliefs simultaneously, including beliefs that are contradictory; and that attitudes and beliefs often change over time, however, the use of solely variable-centered approaches to study job satisfaction is problematic (Howard and Hoffman 2018). Specifically, while individuals can have varying levels of satisfaction with different job factors in their current job and the impact of satisfaction with a specific job factor or set of factors on overall job satisfaction can differ between individuals, variable-centered approaches can only consider each job factor individually or collectively as an overall job satisfaction score. In contrast, LCA, a person-centered approach, can be used to analyze the patterns of importance of and satisfaction with the different job factors and create groups (i.e., latent classes) of individuals based on those potentially complex patterns, which allows for all job factors to be considered individually and simultaneously. Differences in latent class membership can then be explored based on demographics (e.g., gender) and a congruence analysis can be used to determine how job importance class membership relates to job satisfaction class membership.
Methods
Data
The data for the current working paper come from the public use micro data files for the 2017 cycle of the Survey of Doctorate Recipients (SDR) (NCSES 2019). The SDR captures employment and demographic information from individuals with doctoral research degrees in a science, engineering, or health (SEH) field from a U.S. academic institution. As described in the supporting documentation for the public use files—specifically, the survey description document—to participate in the 2017 SDR cycle individuals must have completed a U.S. SEH doctorate prior to 1 July 2015, be less than 76 years of age as of 1 February 2017, and not be institutionalized or terminally ill on 1 February 2017. Approximately 1,103,200 individuals met these criteria, from which a sample of 124,580 was taken using a stratified sample design where the strata represented fields of study. The 2017 sample included all individuals selected for the 2015 SDR cycle who remained eligible and was supplemented by new graduates. The 2017 administration of the SDR utilized three modalities: self-administered paper questionnaire, self-administered online questionnaire, and computer-assisted telephone interview. The response rate was 70%, resulting in a final sample size of 85,739. Sampling weights were created to take into account the stratified sampling design as well as to adjust for unknown eligibility, nonresponse, gender, race and ethnicity, degree year, and degree field. Both logical and statistical (hot-deck) imputation were used on the final data set. Replication weights to improve estimation of standard errors were also created, but these are unavailable in the public use micro data file—and, therefore, are not used in this paper.
Participants
Participants who reported that they had never worked (n = 19) were excluded from all analyses in this paper because they were asked to skip the job importance and job satisfaction survey questions resulting in a final sample size of 85,720. The majority of the final sample identified as male (n = 50,409, or 58.8%), White (n = 53,685, or 62.6%), as not having a physical disability (n = 77,191, or 90.0%), and employed as of 1 February 2017 (n = 74,429, or 86.8%). For those who did report being employed, approximately half (n = 36,677, or 49.3%) worked for an educational institution. The observed sample and SDR sampling-weight corrected population frequencies based on the sample used for the current paper for gender, physical disability, race and ethnicity, age (in 10-year increments), years since award of highest degree (in 10-year increments), degree area, workforce status, employment sector, and whether they were residing in the United States on 1 February 2017 are shown in Table 1.
Survey of Doctorate Recipients participant characteristics: 2017
Note(s):
The population values presented here are provided for reference only because they are based on applying the sampling weights to the reduced sample used for the current project (n = 85,720) and therefore do not match the official values reported by the National Center for Science and Engineering Statistics. All participants who identified as Hispanic were included in the Hispanic category, and only in the Hispanic category, regardless of whether they also identified with one or more of the racial categories. The Other category included individuals who identified as multiracial.
Source(s):
National Center for Science and Engineering Statistics, Survey of Doctorate Recipients, 2017.
Survey Questions
To determine the relative importance of different job factors for each participant the question “C6. When thinking about a job, how important is each of the following factors to you?” was used. Participants were asked to rate nine different job factors, including salary, job security, and opportunity for advancement, on a 4-point scale from “very important” to “not important at all.” A complete list of the nine job factors and the population estimated proportion of individuals who selected each response category based on the sample used for the current paper are shown in Table 2. To capture satisfaction with their current job, participants who reported being employed on 1 February 2017 were asked: “A34. Thinking about your principal job held during the week of February 1, please rate your satisfactions with that job’s….” This job satisfaction question asked about the same nine job factors as the job importance question and used a similar 4-point response scale. Population estimated response proportions by response category for this question based on the sample used for the current paper are also shown in Table 2.
Population estimates of response proportions for importance of and satisfaction with nine job-related factors: 2017
Note(s):
The values presented here are provided for reference only because they are based on applying the sampling weights to the reduced sample used for the current project (n = 85,720) and therefore do not match the official values reported by the National Center for Science and Engineering Statistics. Rows may not sum to 100% due to rounding.
Source(s):
National Center for Science and Engineering Statistics, Survey of Doctorate Recipients, 2017.
Analyses and Software
Latent Class Analyses
The primary form of analysis used in the current paper is LCA. Note that for the LCA part of this working paper, job satisfaction and job importance were modeled separately. Collins and Lanza (2010) give the LCA mathematical model as

(1)
where C is the number of latent classes, J is the number of indicators (here, the indicators are the job factors, so J = 9), Rj is the number of possible responses for indicator j (here, there are 4 response options for each job factor, so Rj = 4), γc is the prevalence of a specific latent class c (i.e., the percentage of participants estimated to belong to class c), ρj,rj|c is the probability of a participant giving response r to indicator j, given membership in class c (e.g., the probability that a participant in Class 1 rated “salary” as “very important”), and I(yj = rj) is a function that is equal to 1 when a participant’s observed response to indicator j, yj, is rj and 0 when the response is something other than rj (e.g., if j = “salary” and rj = “very important,” then I = 1 when a participant rates “salary” as “very important,” but I = 0 when a participant rates “salary” as “somewhat important,” “somewhat unimportant,” or “not important at all”).
Even when the number of latent classes is hypothesized ex ante based on theory, multiple LCA models with differing values of C are typically estimated and then compared to determine the correct number of latent classes to retain based on several measures of model fit. Statistical measures of model fit include the Akaike Information Criterion (AIC), the Bayesian Information Criterion (BIC), the sample-size adjusted BIC (aBIC), and the likelihood-ratio statistic G2, which is distributed as χ2 with (W - P - 1) degrees of freedom, where W is the total number of possible response patterns across the J indicators and P is the number of parameters in the model. Note that lower values of the AIC, BIC, aBIC, and G2 indicate better model fit. Since the statistical significance of G2 is directly related to W and sample size, and χ2 difference tests of nested models using G2 are unidentified for LCA models (Collins and Lanza 2010), Nylund, Asparouhov, and Muthen (2007) and others recommend the use of a parametric bootstrap likelihood ratio test (BLRT) to test for model fit. The BLRT has not been generalized to models with indicators that have more than two response options or models using sampling weights (Dziak and Lanza 2016), however, so the BLRT cannot be used here.
Instead, the correct number of classes to retain will be based on four criteria: an aBIC scree plot, solution stability, model entropy, and interpretability of the latent classes (Foti et al. 2012). First, LCA models with differing numbers of latent classes C will be fitted, and the aBIC values for each model will be plotted against the number of classes to create a scree plot. Then, ideally, an “elbow” that indicates the point at which additional model complexity (i.e., additional classes) has a diminishing effect on the overall model fit will be identified with the number of classes associated with that elbow being the “best” number of classes to retain. Second, LCA models are sensitive to local maxima (Lanza et al. 2015), so the stability of the solution for each LCA model will be inspected by fitting each model a large number of times (i.e., 1,000) with random starting values. The percentage of these random starts that result in the same best-fitting model for a specific value of C based on the aBIC values will then be calculated. While there is not a specific cutoff below which a model is considered unstable, a model with a low stability value compared to other models may indicate that a different model (i.e., a different value of C) should be preferred.
Third, entropy will be examined. Entropy is a summary measure of the quality of latent class assignment based on the model probabilities that can take values from 0 to 1, with higher values indicating more accurate classification. While entropy can be informative, it is important to note that there is an ongoing debate as to whether entropy should be used for model selection as individuals can maintain high class assignment uncertainty even when the entropy is near 1 (Collins and Lanza 2010). Finally, and perhaps most importantly, the interpretation of the retained classes will be examined. An interpretable solution is essential in LCA and at times outweighs statistical measures of model fit in final model selection. Collins and Lanza (2010) state that interpretability is based on simple structure, class separation, within-class homogeneity, and relation to theory. Simple structure is the idea that the most interpretable solution is one in which the values of ρj,rj|c vary between classes, indicators, and response options, with most values being close to 0 or 1 (Tatsuoka 1988). Class separation relates to the idea that in an interpretable solution the classes should be distinct from one another such that each class’s pattern of ρj,rj|c is unique to that class. Within-class homogeneity means that a solution is most interpretable when the variability in observed response patterns between members of the same class are minimized (i.e., members of the same class are more alike than members of different classes). Lastly, a solution is most interpretable when the classes can be related to the original theory and variables—classes that cannot be interpreted in this context may indicate over- or under-extraction of classes.
Modeling Participant Characteristics
Once an optimal number of latent classes has been determined, the relationship of additional variables, such as demographic variables, to latent class membership can be investigated. There are three ways to model these relationships. First, if the additional variable is categorical, then the LCA can be run as a multiple-group model where the class prevalences γc|v and response probabilities ρj,rj|c,v are computed for each group v of the categorical variable V (i.e., conditional on V = v), such that

(2)
Second, continuous and categorical variables X can be added to the LCA model using a standard baseline-category multinomial logistic regression model with latent class as the outcome variable to statistically test whether individual variables can predict class membership, such that

(3)
Finally, the additional variables can be treated as distal outcomes to determine whether participants’ class membership predicts their score on the outcome variable. In principle, this can be achieved by regressing the distal outcome variable on class membership using the appropriate model (e.g., Poisson for count outcomes). Given that the classes are latent instead of observed, however, individuals must be assigned to classes based on the predicted class membership probabilities from the LCA model in Equation 1 (i.e., individuals’ probability of belonging to class c based on their observed responses to the J indicators), which can cause classification errors to occur. Dziak and colleagues (Dziak et al. 2016), among others, recommend the use of the Bolck, Croon, and Hagenaars (BCH) classification error correction (Bolck et al. 2004), which uses the joint probability distribution of the distal outcome Y and the assigned class variable W, such that

(4)
which takes into account the possibility that W ≠ C. In keeping with the congruence analysis (described in the next section), which investigates whether job importance class membership predicts job satisfaction class membership and vice versa, the decision was made to use the distal outcomes approach to investigate the relationship between class membership and participant characteristics. The variables investigated were gender, physical disability, race and ethnicity, age, years since first PhD, degree focus, workforce status, employment sector, and whether the participant was residing in the United States.
Congruence Analysis
To determine how job importance class membership relates to job satisfaction class membership, a congruence analysis was conducted. The simplest form of congruence analysis is to assign individuals to a specific job importance class and a specific job satisfaction class based on their model-estimated class membership probabilities and then compute the resulting contingency table, which contains the joint probability of being in a specific job importance class and a specific job satisfaction class. There are two problems with this approach, however. First, assigning individuals to classes adds error variability, given that class assignment is based on a probability. Second, as noted by Foti et al. (2012), we are more interested in the conditional probabilities than the joint probabilities. That is, given that someone is in a specific job importance class, what is the probability that they are in a specific job satisfaction class (and vice versa)? The simplest way to conceptualize this is within the context of an LTA model, where job satisfaction and job importance are treated as repeated measurements of the same construct and the conditional probabilities are equivalent to the transition probabilities. Collins and Lanza (2010) give the LTA model with two times points as

(5)
where t represents time, δs1 is the probability of membership in class s at t = 1 (note that LTA models historically use the term status instead of class—hence, the use of s in the equation—but class will be used here for consistency), and τs2|s1 is the probability of individuals being in a specific class at t = 2, given their status at t = 1 (i.e., the conditional probability).
Software
All analyses were conducted using SAS 9.4 (SAS 2021). The sample frequencies were computed using PROC FREQ, while the population corrected frequencies were computed using PROC SURVEYFREQ with the WEIGHT option. The LCA models were estimated using PROC LCA (Lanza et al. 2015) with 1,000 random starts (NSTARTS 1000). Potential boundary issues for the indicator-response probabilities (i.e., ρj,rj|c values equal to 0 or 1) were stabilized by using a data-driven prior (RHO PRIOR=1), the SDR sampling weights were used (WEIGHT), and parallel-core processing was utilized (CORE). The distal outcome models were estimated using the LCA_Distal_BCH SAS macro (Dziak, Bray, and Wagner 2017) for dichotomous (METRIC = BINARY) and polytomous (METRIC = CATEGORICAL) outcomes using BCH adjustment (ADJUSTMENT_METHOD = BCH), modal class assignment (ASSIGNMENT = MODAL), and the SDR sample weights (SAMPLING_WEIGHT). The LTA models were estimated with PROC LTA (Lanza et al. 2015) using the data-driven prior and parallel-processing options. The use of sampling weights has not been implemented in PROC LTA, so the sample weights were not used for the congruence analysis models. In addition, PROC LTA does not support the use of multiple random starts at this time, so a SAS macro was written to run each of the congruence LTA models 1,000 times with random starting values and then collate the aBIC values to compute stability.
Results
Latent Classes: Job Importance
When determining the correct number of job importance classes, it is important to compare LCA models with a wide range of values for the latent classes, C. Given that LCAs with social science variables often find between two and five latent classes—for example, Foti and colleagues’ (2012) investigation of leadership characteristics found four latent types—the decision was made to run all LCA models with between one and eight latent classes. All models converged normally; the aBIC, percentage decrease in aBIC between models with C + 1 and C classes, entropy, and stability values for these models are shown in Table 3, and the aBIC scree plot is shown in Figure 1. While the scree plot does not have a pronounced elbow, the percentage decrease in aBIC due to the inclusion of additional classes is 18.8% when adding a fifth class but drops to under 10% when six or more classes are included. In addition, the stability for the five-class model is much higher than for the four-class model, while the entropy is approximately the same, all of which supports retaining five classes.
Model fit indices for job importance latent class analysis models: 2017
na = not applicable.
aBIC = adjusted Bayesian Information Criterion.
Note(s):
Stability is based on 1,000 random starts.
Source(s):
National Center for Science and Engineering Statistics, Survey of Doctorate Recipients, 2017.
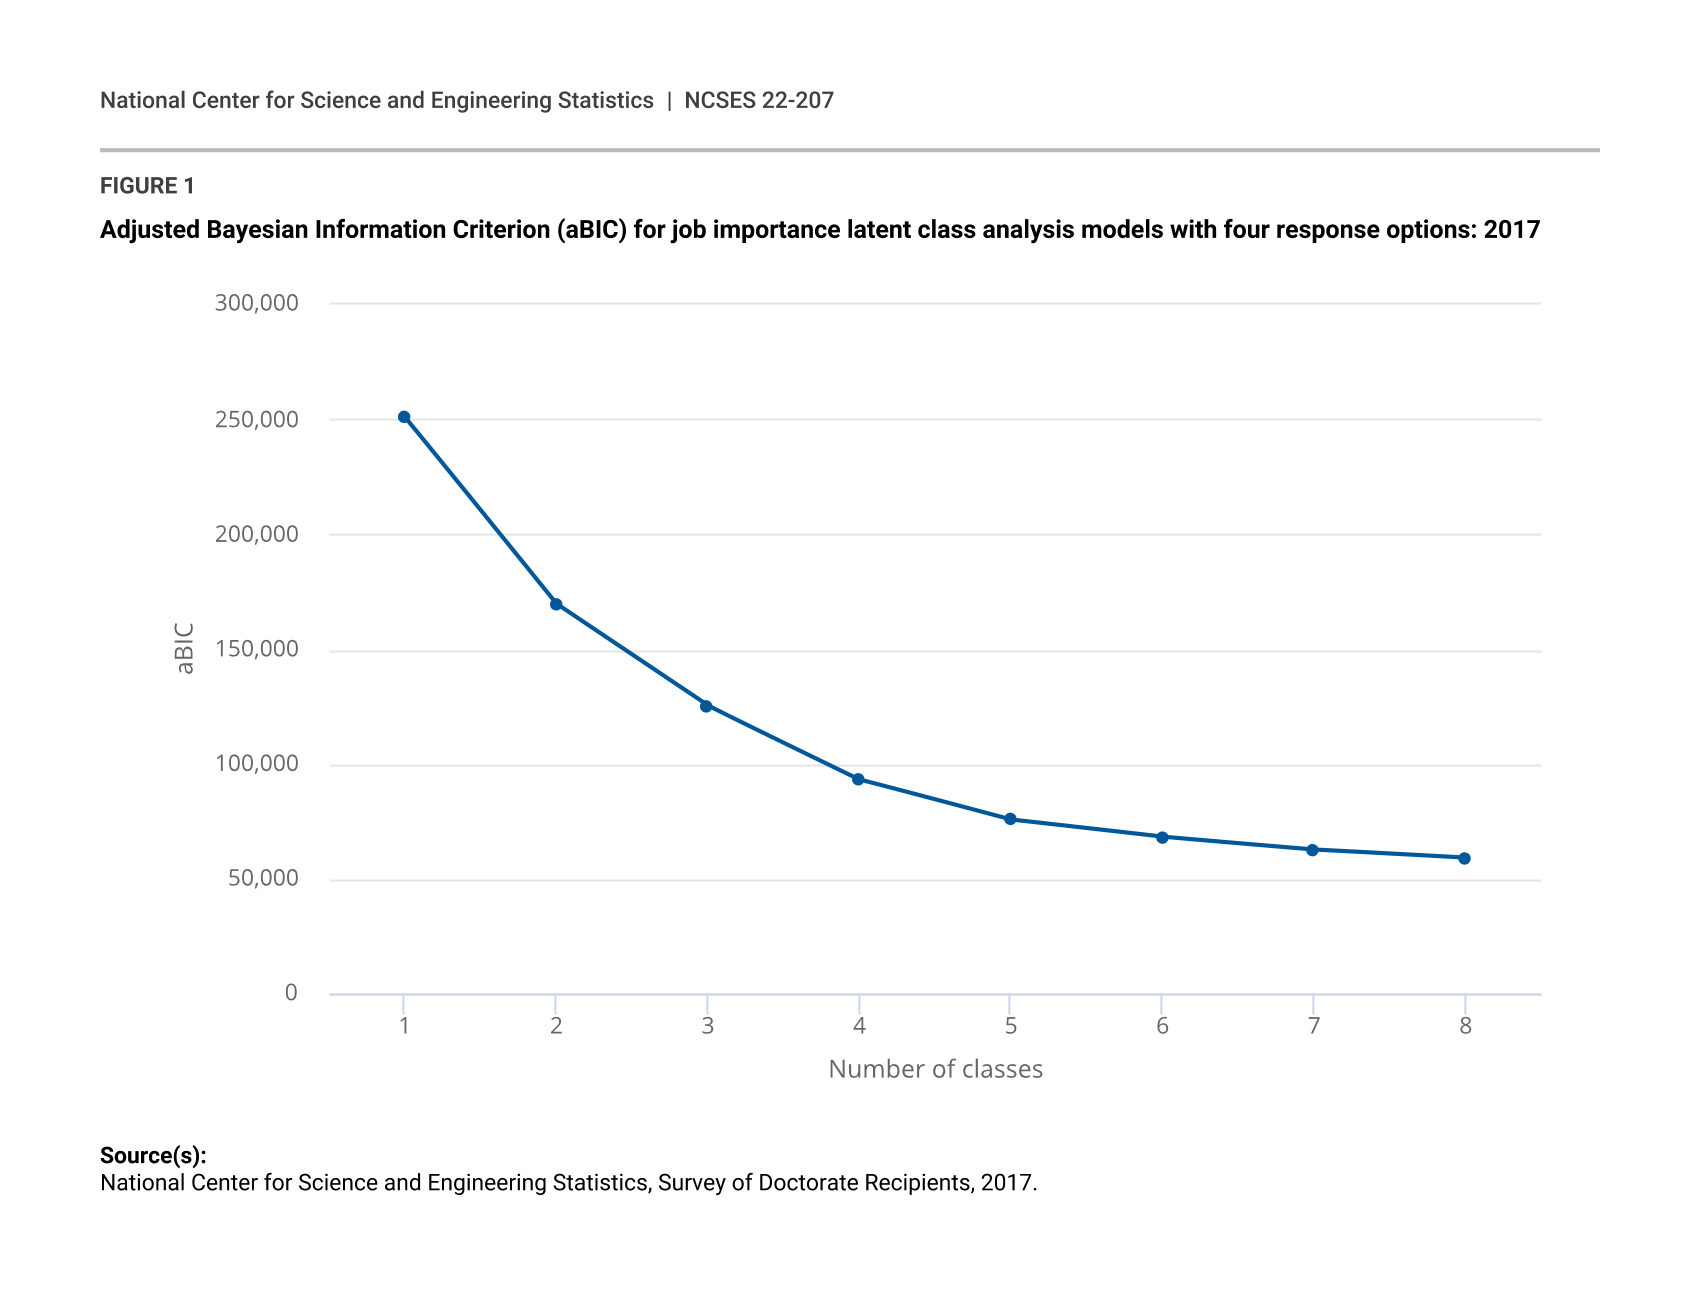
Adjusted Bayesian Information Criterion (aBIC) for job importance latent class analysis models with four response options: 2017
| Number of classes | aBIC |
|---|---|
| 1 | 251,123 |
| 2 | 169,609 |
| 3 | 125,394 |
| 4 | 93,411 |
| 5 | 75,821 |
| 6 | 68,315 |
| 7 | 62,767 |
| 8 | 59,181 |
Source(s):
National Center for Science and Engineering Statistics, Survey of Doctorate Recipients, 2017.
Table 4 contains the prevalences (i.e., percentage of the population in each class) and the response probabilities (i.e., the ρj,rj|c values) for the five-class, four-response model. Applying the concept of salient loadings from exploratory factor analysis, where a minimum value is selected and only estimates larger than that value are considered large enough to be important (Gorsuch 1983), a value of 0.50 was selected as a minimum salient value because that would mean a class member would have a greater than 50% probability of endorsing that response option for that job factor. Based on a salient value of 0.50, the classes are well defined with regard to simple structure (i.e., most job factors have a large probability for one response option, with the rest of the response probabilities for that factor being close to 0) and class separation (i.e., the pattern of large and small response probabilities is unique for each class). In addition, although Class 5’s prevalence is relatively small, it is still larger than the 5% rule of thumb recommended by some researchers for deciding whether a class is large enough to retain (Nasserinejad et al. 2017). To determine whether the five-class model retains too few classes (i.e., under-extraction), the six-class solution was investigated. The six-class solution recovered all five classes found in the five-class solution but added a small sixth class with moderate-to-small probabilities for all response options for all job factors. Classes with very few or no large response probabilities are often called junk classes because they are difficult to distinguish from other classes and are a sign of retaining too many classes (i.e., over-extraction). To determine whether the five-class solution retains too many classes, the four-class solution was also investigated. The four-class solution retained Classes 1, 2, 3, and 5 from the five-class solution, giving further support to the decision to retain Class 5 despite its small size. While Class 4, which is present in the five-class solution but not the four-class solution, may not seem that dissimilar to Class 1, retaining Class 4 serves two important purposes. First, while Class 4 members rate all nine job factors as equally important (like Class 1 members), they are much less likely to endorse the extreme end of the scale. Second, the inclusion of Class 4 generally improves the simple structure for the other classes such that large probabilities are closer to 1 and small probabilities are closer to 0 when Class 4 is retained, meaning that Class 4 is also operating as a residual class that explains variability not captured by the other classes and improves model fit.
Five-class job importance latent class analysis solution with four response options: 2017
Note(s):
Rows may not sum to 1.000 due to rounding. Response probabilities greater than 0.500 are considered salient and are represented in bold.
Source(s):
National Center for Science and Engineering Statistics, Survey of Doctorate Recipients, 2017.
One issue of concern with the five-class, four-response model in Table 4, however, is that the largest response probability for the “somewhat unimportant” option is 0.267, which indicates that this response option does not help distinguish the classes because none of its probabilities reach the level of salience (i.e., 0.50). In addition, the four largest response probabilities for “somewhat unimportant” are for Class 5. Because Class 5 is distinguished from the other classes more by its members responding that advancement, security, and benefits are unimportant instead of degree of unimportance, Class 5 would likely be better captured by having a single “unimportant” response category. This is exactly what was found when the “somewhat unimportant” and “not important at all” response options were collapsed into a single “unimportant” response category and the five-class model was rerun with only three response options. The three-response, five-class LCA model solution (aBIC = 47,380.57, entropy = 0.78, stability = 93.3%) shown in Table 5 recovered the same classes as the four-option model, except Class 5 is now better defined with three response probabilities greater than 0.50 in the “unimportant” category. In addition, while the prevalences for Classes 1–3 are almost identical, the prevalence for Class 5 has increased while the prevalence for Class 4 has decreased, which indicates the three-response model is better able to assign individuals to Class 5, leaving fewer individuals to end up in the residual class. Note that probabilities larger than 0.50 in Table 5 are bolded, and probabilities that are more than twice as large as the next-largest response probability for that job factor (i.e., in a row) are highlighted in blue. Figure 2 presents these probabilities graphically to highlight class differences (Layland 2020).
Five-class job importance latent class analysis solution with three response options: 2017
Note(s):
Rows may not sum to 1.000 due to rounding. Response probabilities greater than 0.500 are considered salient and are represented in bold. Response probabilities more than twice as large as the next-largest probability in a row are highlighted in blue.
Source(s):
National Center for Science and Engineering Statistics, Survey of Doctorate Recipients, 2017.
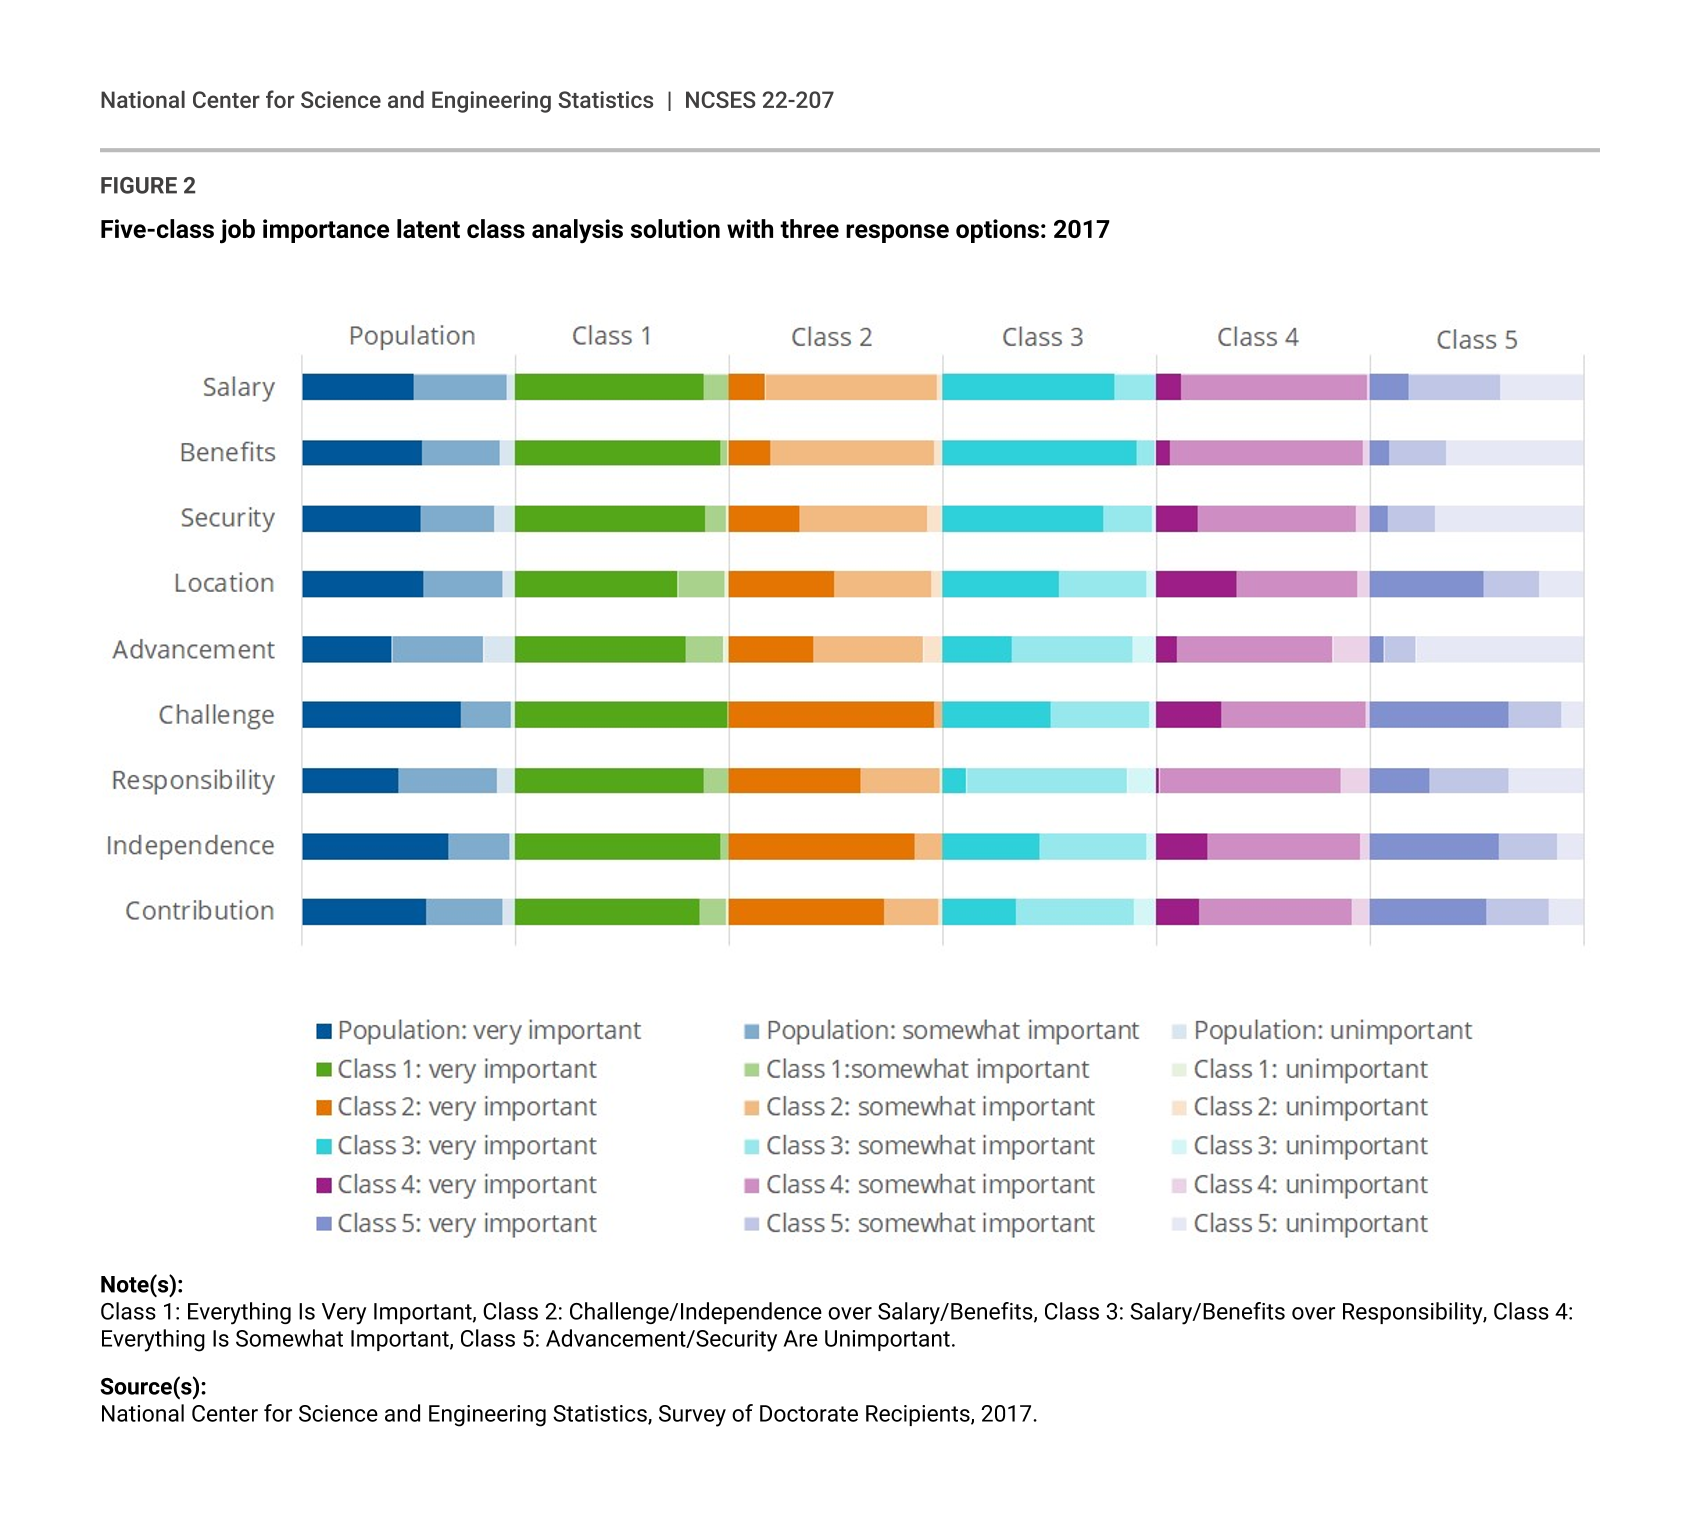
Five-class job importance latent class analysis solution with three response options: 2017
Note(s):
Class 1: Everything Is Very Important, Class 2: Challenge/Independence over Salary/Benefits, Class 3: Salary/Benefits over Responsibility, Class 4: Everything Is Somewhat Important, Class 5: Advancement/Security Are Unimportant.
Source(s):
National Center for Science and Engineering Statistics, Survey of Doctorate Recipients, 2017.
The five-class, three-response model can now be interpreted with regard to the original job factors. Members of the largest class (Class 1: 27.6%) have a very high probability of responding “very important” to all nine job factors. While members of this Everything Is Very Important class generally rate all nine job factors as very important, not all factors are equally important; some factors (such as challenge and benefits) are more likely to be rated as very important than other factors (such as location). It should be noted that it is possible that this class also contains some percentage of rapid responders (Wise 2017) who simply selected “very important” for every job factor without actually taking the time to read and evaluate each factor individually. The issue of rapid responding is also a possibility with the Everything Is Somewhat Important class (Class 4: 12.1%), whose members are also likely to rate each of the nine job factors as important but are differentiated from members of Class 1 by being less likely to rate any of the factors as “very important.” As stated before, Class 4 also serves as a residual class that explains variability in the model while improving the separation of the other classes.
The second-largest class (Class 2: 25.8%) could be called the Challenge and Independence Are More Important than Salary and Benefits class (or, perhaps, the Intangibles over Tangibles class) because while members generally rate all of nine job factors as important, they rate intellectual challenge, degree of independence, and ability to make a contribution to society as more important than a job’s salary or benefits. The Benefits and Salary Are More Important than Responsibility class (Class 3: 25.8%) is almost the reverse of Class 2. While Class 3 is approximately the same size as Class 2 and its members generally rate all nine job factors as important, Class 3 members are much more likely to rate a job’s salary, benefits, and security as more important than the other factors, especially level of responsibility, resulting in a Tangibles over Intangibles class.
In many ways, despite being the smallest class (Class 5: 8.7%), the Advancement, Security, and Benefits Are Unimportant class is the most interesting. Members of Class 5 are still likely to rate most of a job’s factors as important, but they are the only individuals who have a high probability of rating any factors (especially opportunities for advancement) as unimportant. Given that members of Class 5 are also likely to rate opportunities for advancement and job security as unimportant, perhaps a tongue-in-cheek name for this class would be the It’s a Job, Not a Career class. Regardless, this willingness to rate job factors as unimportant distinguishes them from the rest of the population.
Latent Classes: Job Satisfaction
As with the job importance ratings, all LCA models with between one and eight latent classes were estimated for the job satisfaction ratings. All models converged normally; the aBIC, percentage decrease in aBIC between the models with C + 1 and C classes, entropy, and stability values for these models are shown in Table 6, and the aBIC scree plot is shown in Figure 3. Similar to the job importance scree plot, the scree plot for the job satisfaction variables does not have a distinct elbow.
Model fit indices for job satisfaction latent class analysis models: 2017
na = not applicable.
aBIC = adjusted Bayesian Information Criterion.
Note(s):
Stability is based on 1,000 random starts.
Source(s):
National Center for Science and Engineering Statistics, Survey of Doctorate Recipients, 2017.
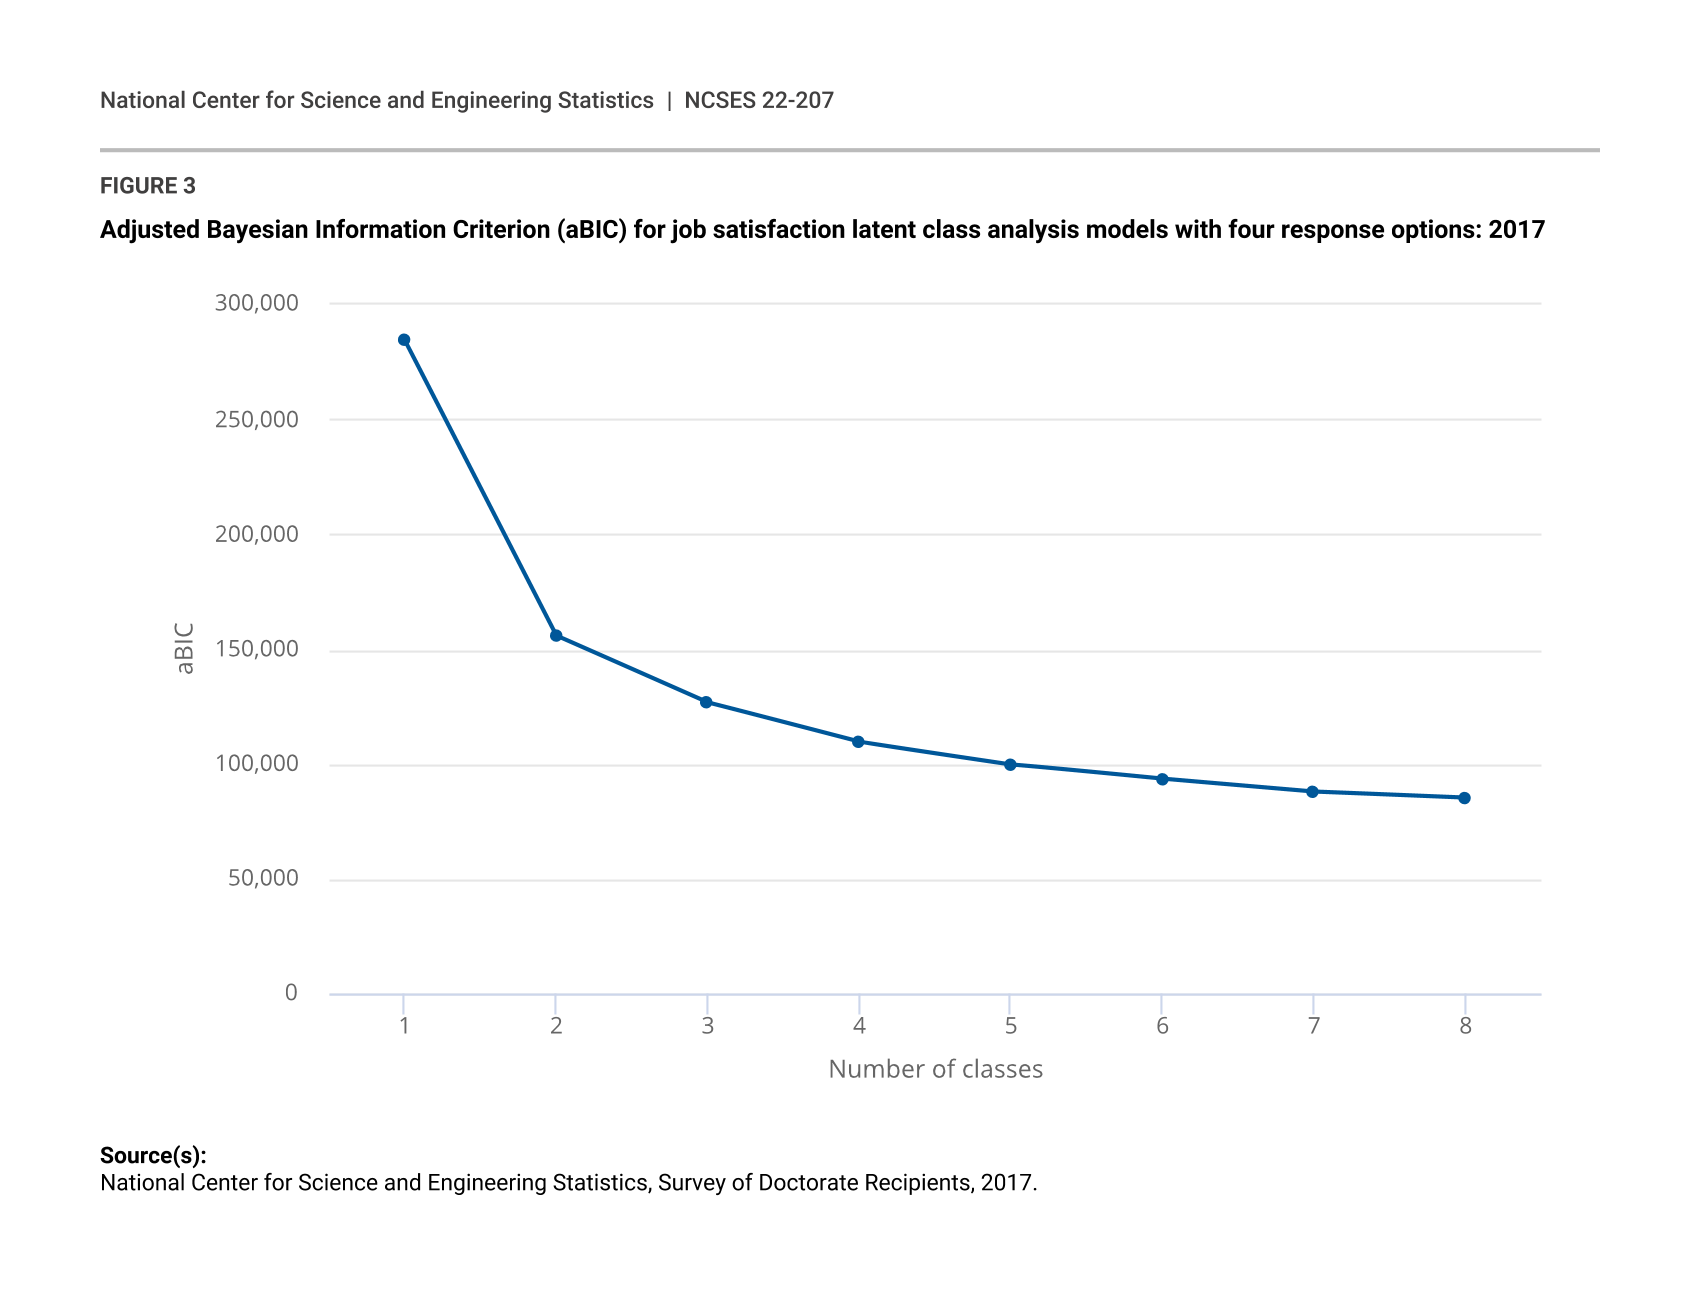
Adjusted Bayesian Information Criterion (aBIC) for job satisfaction latent class analysis models with four response options: 2017
| Number of classes | aBIC |
|---|---|
| 1 | 284,506 |
| 2 | 155,889 |
| 3 | 126,766 |
| 4 | 109,626 |
| 5 | 99,883 |
| 6 | 93,479 |
| 7 | 87,866 |
| 8 | 85,192 |
Source(s):
National Center for Science and Engineering Statistics, Survey of Doctorate Recipients, 2017.
The aBIC values indicate that the improvement in model fit gained by adding additional classes above four drops below 10%. Given the five-class solution retained for job importance, however, the four-, five-, and six-class, four-response solutions were examined for interpretability. This review of the solutions revealed a striking similarity with the LCA models fit to the job importance ratings. Specifically, the five-class job satisfaction solution has a class that was very satisfied with everything, a class that was somewhat satisfied with everything, a class that was very satisfied with benefits but only somewhat satisfied with responsibility, a class that was very satisfied with independence and somewhat satisfied with salary, and a class with members that were generally dissatisfied with their advancement. The four-class solution retained all of the classes from the five-class solution except the class that was somewhat satisfied with everything, again indicating that this class serves at least in part as a residual class that improves model fit in the five-class solution. The six-class solution again contained all of the classes from the five-class solution as well as an additional junk class with small-to-medium response probabilities for all job factors.
In looking at the five-class, four-response solution it was determined that, as with the job importance five-class model, what distinguished the members of the class that was dissatisfied with advancement was less their level of dissatisfaction and more the fact that they were dissatisfied at all. Hence, the “somewhat dissatisfied” and “very dissatisfied” response options were combined into a single “dissatisfied” response category, and the model was rerun. The prevalences and the response probabilities for this three-response, five-class model (aBIC = 48,114.48, entropy = 0.74, stability = 79.0%) are shown in Table 7. It is worth noting that the stability of the five-class model increased from 60.8% for four response options to 79.0% when three response options are used. Probabilities larger than 0.50 in Table 7 are bolded, and probabilities that are more than twice as large as the next-largest response probability for that job factor (i.e., in a row) are highlighted in blue; Figure 4 presents these results graphically.
Five-class job satisfaction latent class analysis solution with three response options: 2017
Note(s):
Rows may not sum to 1.000 due to rounding. Response probabilities greater than 0.500 are considered salient and are represented in bold. Response probabilities more than twice as large as the next-largest probability in a row are highlighted in blue.
Source(s):
National Center for Science and Engineering Statistics, Survey of Doctorate Recipients, 2017.
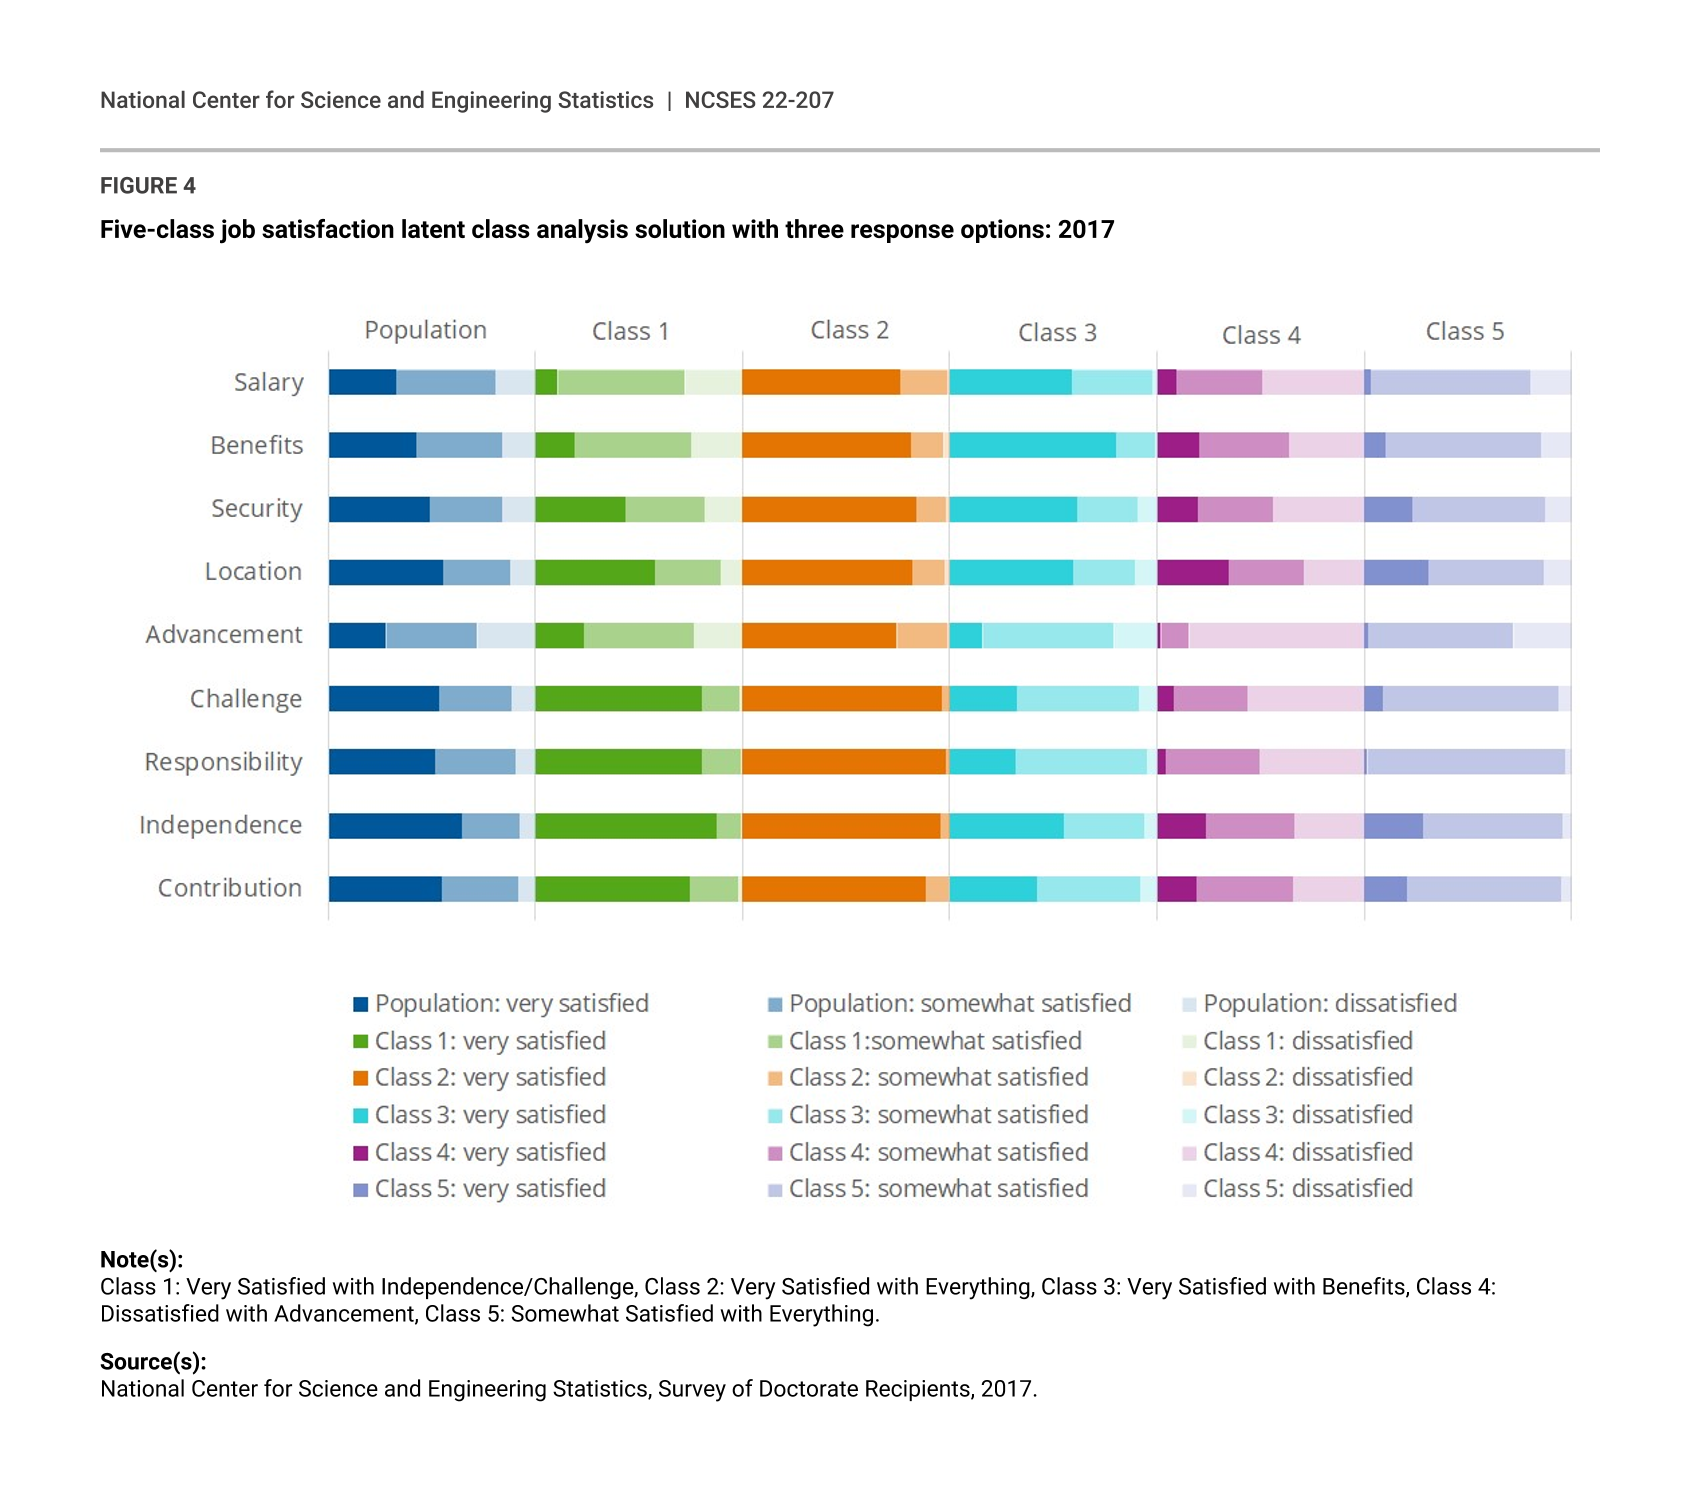
Five-class job satisfaction latent class analysis solution with three response options: 2017
Note(s):
Class 1: Very Satisfied with Independence/Challenge, Class 2: Very Satisfied with Everything, Class 3: Very Satisfied with Benefits, Class 4: Dissatisfied with Advancement, Class 5: Somewhat Satisfied with Everything.
Source(s):
National Center for Science and Engineering Statistics, Survey of Doctorate Recipients, 2017.
The five-class, three-response model can now be interpreted with regard to the original job factors. While the interpretation of the five satisfaction classes is similar to the five importance classes, it is interesting to note the differences in class prevalence order (i.e., the order of the satisfaction classes is different than the importance classes) and that there is generally less within-class homogeneity as evidenced by the presence of more response probabilities in the 0.20 to 0.40 range (i.e., not above the 0.50 cutoff for salience used here but not particularly close to 0 either). The largest satisfaction class (Class 1: 27.8%) could be called the Very Satisfied with Independence, Challenge, and Responsibility class as members are likely to be generally satisfied with all nine job factors in their current job but are especially satisfied with their job’s intellectual challenge, level of responsibility, degree of independence, and their ability to contribute to society, while they are less satisfied with their salary, benefits, and opportunity for advancement. Members of the second-largest class (Class 2: 23.8%), the Very Satisfied with Everything class, are most likely to respond that they are very satisfied with all nine job factors. Again, there is some concern about rapid responders artificially inflating the prevalence of this class. The Very Satisfied with Benefits class (Class 3: 16.2%) is the reverse of Class 1 because members are also generally satisfied with all factors of their current job, but members of this class are most likely to be very satisfied with their job’s benefits package and only be somewhat satisfied with their opportunity for advancement.
Members of the Dissatisfied with Opportunities for Advancement class (Class 4: 16.1%) are unlikely to be very satisfied with any of the nine job factors in their current job but are especially likely to be dissatisfied with their opportunities for advancement as well as with the level of intellectual challenge and their level of responsibility, both of which are likely related to their dissatisfaction with their level of advancement. It is worth noting that only members of Class 2 are likely to report being very satisfied with their opportunity for advancement, but unlike members of Classes 1, 3, and 5 (who are most likely to report that their opportunities for advancement are generally satisfactory but could be improved), the defining characteristic of members of Class 4 is their outright dissatisfaction with their opportunities to advance at their current job. Finally, the Somewhat Satisfied with Everything class (Class 5: 16.1%) members are most likely to be somewhat satisfied with all nine job factors in their current job, indicating that on the whole there is room for improvement across the board in their current job. As with the similar job importance class, Class 5 is also serving, at least in part, as a residual class that explains variability in the model as well as potentially including some rapid responders.
Distal Outcomes: Job Importance
To investigate the relationship between participant characteristics and the latent classes, a series of distal outcome models were estimated. One model was estimated separately for each of the demographic variables in Table 1 with the five-class, three-response solution for job importance as the predictor. The omnibus model test, which tests whether the proportion of individuals with the same value of the outcome variable differs by latent class (e.g., is the proportion of women different in at least one of the classes), was significant at the 0.01 level for all models. For the significant dichotomous variables (i.e., gender, physical disability, and living in the United States), the BCH macro provides pairwise tests to determine whether the proportions for the group coded 1 are equal or different for each pair of classes as shown by the letters in the table; the differences for the group coded 0 may then be inferred. For the polytomous variables (i.e., race and ethnicity, age, years since first PhD, degree area, workforce status, and employment sector), a series of dummy codes were created, and the model was rerun for each level of the outcome variable to get these pairwise tests. Note that these pairwise tests only determine whether the proportion of individuals with the same demographic value are identical between classes (e.g., is the proportion of health PhDs the same in Class 1 and Class 2), not whether the proportion of people with different demographic values are different for the same class (e.g., does not test whether the proportion of health PhDs in Class 1 is different than the proportion of science PhDs in Class 1). The unconditional population estimated proportions from Table 1 are also provided for reference. Note that although the significance of proportions less than 0.05 were included in the tables for completeness, cells with less than 5% of the sample are considered sparse and therefore should be interpreted with caution.
Given the large number of pairwise tests and that the replication weights were not available, an increased risk of making a Type I error is a concern, so a Bonferroni correction was used to set a more conservative 0.005 significance level for the pairwise tests (Keppel and Wickens 2004). A bigger concern, however, is that due to the large sample size, differences that are too small to be meaningful may still reach statistical significance. To address this issue, Cohen’s (1988) h effect size measure for differences in proportions P1 and P2,
|
|

(6)
was used, where h values of 0.2, 0.5, and 0.8 are considered small, medium, and large effects. Converting h into a single minimum difference in proportions, similar to a Tukey’s Honestly Significant Difference value in ANOVA (Keppel and Wickens 2004), is problematic, however, as the relationship between h and the difference in proportions is not constant. Instead, Table 8 gives the difference in proportions necessary for small, medium, and large effects for a range of proportion values. As noted above, interpreting differences between cells with less than 5% of the sample is problematic, so values less than 0.05 are not included in Table 8.Difference in proportions equal to different effect sizes
na = not applicable.
Note(s):
P1 is the smaller of the proportions being compared, and h is how large the difference between P2 and P1 must be for the effect to be considered small (0.2), medium (0.5), or large (0.8).
Source(s):
Cohen J, Statistical Power Analyses for the Behavioral Sciences, 2nd ed., Erlbaum (1988), equation 6.
As indicated by the significant omnibus tests, there is at least one statistically significant difference in proportions between job importance classes for each variable in Table 9. When taking into account the effect size, however, many of these differences fail to reach the level of a small effect and can therefore be considered negligible effects for the purposes of this paper. For example, only the largest difference for gender (0.111; Class 1 vs. Class 4) would be considered a small effect, with an estimated 0.387 of the members of the Everything Is Very Important class identifying as female versus only 0.276 of the Everything Is Somewhat Important class. With only two gender options in the 2017 SDR, there is an opposite but equal effect for participants who identify as male. It should also be noted that none of the class proportions for gender differ from the unconditional population proportions by more than 0.061, again not meeting the criteria for even a small effect. For physical disability status, only the difference between Class 1 and Class 4 of 0.057 reaches the level of a small effect. No differences in proportion for degree focus or living in the United States reached the level of a small effect, suggesting that while the proportions for these variables are not identical in all five classes, the differences are likely negligible. For the rest of the variables (race and ethnicity, age, years since first PhD, and workforce status), while there are some differences between Classes 1, 2, 3, and 4 that are statistically significant and larger than a small effect, the largest differences in proportions occur for Class 5, the Advancement Is Unimportant class. For example, for workforce status the differences between Class 1 and Class 5 for employed and not in the workforce participants are 0.354 and 0.318, respectively, both of which are large effects. Members of Class 5 are also more likely to be over 60 years old, to be farther removed from receiving their first doctorate, and to identify as White (and, less likely, to identify as Asian) than members of the other classes.
Estimated demographic composition of job importance classes: 2017
Note(s):
Class proportions in a row that do not share a letter are statistically different at the 0.005 level. Population proportions are provided for reference only. Class 1: Everything Is Very Important, Class 2: Challenge Is More Important than Salary, Class 3: Benefits Are More Important than Responsibility, Class 4: Everything Is Somewhat Important, Class 5: Advancement Is Unimportant.
Source(s):
National Center for Science and Engineering Statistics, Survey of Doctorate Recipients, 2017.
Distal Outcomes: Job Satisfaction
The omnibus tests were significant for all of the variables in Table 10, meaning that there is at least one statistically significant difference in proportions between job satisfaction classes for each variable. Given the values in Table 8, however, many of these differences are smaller than a small effect and are therefore considered negligible here, even if they reach statistical significance at the 0.005 level. For example, none of the differences in proportions for physical disability reach the level of a small effect. For gender, only the largest difference (0.103; Class 1 vs. Class 3) reaches the level of a small effect with an estimated 0.389 of the Very Satisfied with Independence, Challenge, and Responsibility class identifying as female versus 0.286 of the Very Satisfied with Benefits class—although, as with the job importance classes, none of the job satisfaction proportions for gender differ by more than 0.053 from the unconditional population proportions. For race and ethnicity, none of the differences in proportions for individuals who identified as Black, Hispanic, or Other reach the level of a small effect. For individuals who identified as Asian or White, the differences in proportions between Classes 1, 2, and 3 were negligible, but larger differences existed between Classes 2, 4, and 5. For Asians, the largest difference was between Class 2 and Class 5 (0.280, a medium effect), with the differences between Classes 2 and 4 (0.122) and Classes 4 and 5 (0.158) being small effects such that an estimated 0.475 of the Somewhat Satisfied with Everything class members identifying as Asian compared to 0.317 in the Dissatisfied with Opportunities for Advancement class and only 0.195 of the Very Satisfied with Everything class. There is an approximately equal, but opposite, effect observed for individuals who identify as White.
Estimated demographic composition of job satisfaction classes: 2017
Note(s):
Class proportions in a row that do not share a letter are statistically different at the 0.005 level. Population proportions are provided for reference only. Class 1: Very Satisfied with Independence, Challenge, and Responsibility; Class 2: Very Satisfied with Everything; Class 3: Very Satisfied with Benefits; Class 4: Dissatisfied with Opportunities for Advancement; Class 5: Somewhat Satisfied with Everything.
Source(s):
National Center for Science and Engineering Statistics, Survey of Doctorate Recipients, 2017.
For age and years since first PhD, several of the differences in proportions reach the level of a small effect, but there does not seem to be a consistent difference between classes, which is an indicator that, although statistically significant, a systematic and meaningful relationship between class membership and these variables likely does not exist. For degree focus, none of the differences in class proportions for health were statistically significant. For engineering, however, the differences between Class 5 and Classes 1 and 2 (0.116 and 0.107, respectively) both reached the level of a small effect, with members of the Somewhat Satisfied with Everything class being approximately 1.6 times more likely to have a degree in engineering than members of the Very Satisfied with Independence, Challenge, and Responsibility class or the Very Satisfied with Everything class. An opposite effect is seen for science degree holders. For participants living in the United States, the differences between Class 5 and Classes 2 and 3 (0.080 and 0.086, respectively) also reached the level of small effects, with members of the Somewhat Satisfied with Everything class being less likely to be living in the United States at the time of data collection than members of the Very Satisfied with Benefits or Very Satisfied with Everything classes. Finally, for employment sector, the biggest differences are seen between Classes 1 and 3. Participants working in education were more likely to belong to the Very Satisfied with Independence, Challenge, and Responsibility class than the Very Satisfied with Benefits class (0.222, an almost medium effect), while an opposite effect was seen for participants working in the government and the business and industry sectors, with those individuals being more likely to belong to the Very Satisfied with Benefits class than the Very Satisfied with Independence, Challenge, and Responsibility class (0.148 and 0.074, respectively, both of which are smaller effects).
Congruence Analysis
The results of the LCAs show that job importance and job satisfaction have a high level of similarity—each had five classes that included a class where members rate everything high, a class where members rate everything as somewhat high, a class that rates challenge and independence higher than salary and benefits, a class that rates salary and benefits higher than challenge and independence, and a class that rates advancement very low. The congruence analyses investigate this similarity further by determining the degree to which membership in a specific job importance class predicts membership in the concordant job satisfaction class (and vice versa). For example, are members of the Everything Is Very Important class more likely to be members of the Very Satisfied with Everything class? The conditional probabilities for the LTA model predicting job satisfaction class membership (columns) based on job importance class membership (rows; aBIC = 560,020.70, stability = 76.4%) are shown in Table 11. In a traditional LTA model, the probabilities on the main diagonal of this table would indicate the probability of staying in the same class across time, and the off-diagonal probabilities would give the probability of changing to another class at T2, given membership in a specific class at T1. Here, the classes are based on different constructs, and the order of classes is maintained from the LCA models in Tables 5 and 7, where it was based on class prevalence, so the main diagonal and off-diagonal elements do not have that interpretation. Instead, within a specific row, values of 0.20 mean the probability of belonging to a specific satisfaction class, given membership in that importance class, is exactly equal to chance (i.e., 1 out of 5); values greater than 0.20 indicate an above-chance probability of belonging to a specific satisfaction class, given membership in that importance class; and values below 0.20 indicate a below-chance probability of belonging to a specific satisfaction class, given membership in that importance class (i.e., more likely to not belong compared to chance).
Table 11 illustrates there is a moderate level of congruence between job importance and job satisfaction classes such that the concordant probabilities (highlighted in blue) are also the highest conditional probabilities (in bold) for four of the five job importance classes For example, members of the Everything Is Very Important class have the highest probability of being members of the Very Satisfied with Everything class (0.371), although this value does not approach 1.0, which would indicate perfect congruence. The only class this is not true for is the Advancement, Security, and Benefits Are Unimportant class who are most likely to belong to the Very Satisfied with Independence, Challenge, and Responsibilities class (0.398). It is also interesting that the highest probability to belong to the Dissatisfied with Opportunities for Advancement class was membership in the Everything Is Somewhat Important class (0.237). While PROC LTA does not provide pairwise statistical tests like the distal outcome models, the differences in proportions of effect size values in Table 8 can again be used to compare proportions within a row revealing a mix of negligible, small, and medium differences.
Probability of satisfaction class membership given importance class membership: 2017
Note(s):
Rows sum to 1.000, but columns do not. The largest marginal probability in each row is represented in bold. Concordant cells are highlighted in blue.
Source(s):
National Center for Science and Engineering Statistics, Survey of Doctorate Recipients, 2017.
The conditional probabilities from the LTA model with job satisfaction class membership (row) predicting job importance class membership (column; aBIC = 593,616.99, stability = 78.2%) are shown in Table 12. As with the previous model, the highest conditional probabilities (in bold) for Classes 1, 2, and 3 are with their concordant importance classes (highlighted in blue), whereas members of the Somewhat Satisfied with Everything class are slightly more likely to belong to the Benefits and Salary Are More Important than Responsibility class (0.326) than the Everything Is Somewhat Important class (0.307). Members of the Dissatisfied with Advancement class are most likely to be members of the Benefits and Salary Are More Important than Responsibility (0.322) class. Strikingly, all the conditional probabilities for the Advancement Is Unimportant class are less than 0.10, meaning that job satisfaction class membership does a better job at predicting who is unlikely to rate advancement as unimportant than predicting who is likely to rate advancement as unimportant, although this is likely due to the Advancement Is Unimportant class’s small size compared to the other classes.
Probability of importance class membership given satisfaction class membership: 2017
Note(s):
Rows sum to 1.000, but columns do not. The largest marginal probability in each row is represented in bold. Concordant cells are highlighted in blue.
Source(s):
National Center for Science and Engineering Statistics, Survey of Doctorate Recipients, 2017.
Discussion
The results of the LCAs and congruence analyses of the 2017 SDR data presented here highlight how person-centered approaches can provide information not available from variable-centered analyses. Both start by describing the characteristics of the participants (Table 1) and how they rated the nine job factors in terms of importance and satisfaction (Table 2), but whereas a variable-centered approach would have been limited to focusing solely on the relationships between specific job factors (e.g., the correlation between satisfaction with salary and satisfaction with location) or a composite score (e.g., overall satisfaction), the LCAs revealed five subpopulations of participants based on their responses to all nine job factors simultaneously without losing the unique contribution of each factor. This allows for conclusions about job satisfaction and job importance that would not have been possible if only variable-centered approaches had been used.
For example, the patterns that define the five job importance and five job satisfaction classes match closely with Weiss and colleagues’ (1967) conceptualization of job factors falling into two broader categories: intrinsic and extrinsic. Intrinsic job factors focus on the work itself and include intellectual challenge, level of responsibility, degree of independence, and ability to contribute to society. Extrinsic job factors are aspects of the job other than the work itself, including salary, benefits, security, location, and opportunity for advancement. Reframing the results in these terms, the majority of doctorate recipients are likely to report being satisfied with all areas of their current job but differ in their relative satisfaction with the intrinsic versus extrinsic job factors. Members of the Very Satisfied with Independence, Challenge, and Responsibility class (Class 1; Table 7) are more likely to rate being very satisfied with the intrinsic factors of their current job and only somewhat satisfied with the extrinsic factors, whereas members of the Very Satisfied with Benefits class (Class 3) are more likely to report the opposite. Members of the Very Satisfied with Everything (Class 2) and Somewhat Satisfied with Everything (Class 5) classes are likely to rate their satisfaction with intrinsic and extrinsic job factors as equal, although the overall level of satisfaction is different. Members of the Dissatisfied with Opportunities for Advancement class (Class 4) were most likely to respond that they were dissatisfied with advancement (an extrinsic factor) as well as challenge and responsibility (intrinsic factors), which is unsurprising, given that advancement usually comes with increased responsibility and challenge. Tellingly, members of this class are unlikely to be very satisfied with any of the nine listed job factors in their current job.
The distal outcome analyses provide an examination of the demographic composition of the job importance and job satisfaction classes. For example, doctoral recipients employed in the education sector were 1.71 times more likely to report higher satisfaction with the intrinsic factors of their current job than the extrinsic factors (Class 1 vs. Class 3), whereas individuals in the government and the business and industry sectors were more likely to report higher satisfaction with the extrinsic factors of their current job than the intrinsic factors (Class 3 vs. Class 1; 2.07 times and 1.37 times, respectively). In short, people in educational jobs are more likely to report being more satisfied with their autonomy and less satisfied with their compensation than people in noneducational jobs, which is unsurprising because this is one of the primary reasons given by individuals in Ruiz Castro et al.’s study (2020) for why they were transitioning out of academic research positions. A similar effect is seen for women who are 1.36 times as likely to be very satisfied with autonomy but only somewhat satisfied with compensation (Class 1) as the opposite (Class 3). Interestingly, the demographic composition of the class that is dissatisfied with their opportunities for advancement (Class 4) tracks fairly closely to the estimated population percentages for all of the variables with all differences falling below the magnitude of a small effect. Larger differences are seen between the demographic characteristics of individuals who are dissatisfied with their opportunities for advancement (Class 4) and individuals who are very satisfied with everything (Class 2) with members of the dissatisfied class being more likely to identify as Asian (and less likely to identify as White) or as younger or closer to PhD. One partial explanation could be that women, racial and ethnic minorities, and people with disabilities report holding supervisory roles less frequently (NCSES 2021), although the only difference that reaches the level of a small effect or larger here is for individuals who identify as Asian. Another possible explanation is that individuals who are older or farther from PhD have either already been fully advanced in their jobs or are nearing retirement and are no longer as concerned about advancement. This is corroborated by the results in Table 9 that show members of the Advancement Is Unimportant class are more likely to be over the age of 60 or not in the workforce compared to the other importance classes.
Finally, the congruence analysis presents an opportunity to better understand how doctoral recipients’ satisfaction relates to the level of importance they report for each of these job factors. The prevailing pattern is one of congruence with individuals generally reporting being very satisfied with job factors they rate as being very important. For example, members of the Everything Is Very Important class are most likely to be members of the Very Satisfied with Everything class (and vice versa). The same is true for individuals who rate intrinsic factors as more important than extrinsic factors (challenge over benefits) and for individuals who rate extrinsic factors as more important than intrinsic factors (benefits over independence). Proponents of Positive Organizational Scholarship (Spreitzer and Cameron 2011) might posit that this is because individuals tend to apply for jobs that most closely match their values, so if individuals value independence and intellectual challenge over salary, they would find a job where they had a high degree of independence and intellectual challenge and therefore be more likely to be very satisfied. And the results do support the idea that most individuals’ satisfaction in their current jobs match well with what they rate as most important. The counterpoint to this argument, however, is that if individuals were able to perfectly match their current job to what they valued, then the highest probability for all of the importance classes should be the Very Satisfied with Everything class, which is not supported by the results in Tables 11 and 12. Instead, individuals are generally less satisfied with job factors that they rate as less important. One possible explanation for this is cognitive dissonance, which is the idea that conflicting attitudes, beliefs, and behaviors are uncomfortable so that individuals will change one or more of these in order to lessen the dissonance (Festinger 1957). For example, individuals who are not completely satisfied with their salary might justify staying in their current job by downplaying the importance of salary and highlighting the level of independence the job allows them. That said, there is a limit to how much individuals will change their beliefs to alleviate cognitive dissonance as the Dissatisfied with Advancement class members are not most likely to belong to the Advancement Is Unimportant class, although there is a small group of individuals who report that advancement is unimportant but are still dissatisfied with their opportunities to advance. In addition, it is important to note that the cross-sectional nature of these analyses limits the ability to make statements about the direction of any causal effects.
References
American Association of University Professors (AAUP). 2020. The Annual Report on the Economic Status of the Profession, 2019–20. Washington, DC: AAUP. Available at https://www.aaup.org/sites/default/files/2019-20_ARES.pdf. Accessed 22 November 2021.
Anderson N. 2021. Boeing Is Giving Virginia Tech $50 Million to Help Launch New Campus. Washington Post May 4. Available at https://www.washingtonpost.com/local/education/boeing-virginia-tech-gift/2021/05/03/dd989b7c-ac28-11eb-acd3-24b44a57093a_story.html. Accessed 10 May 2021.
Bolck A, Croon M, Hagenaars J. 2004. Estimating Latent Structure Models with Categorical Variables: One-Step versus Three-Step Estimators. Political Analysis 12:3–27. Available at https://doi.org/10.1093/pan/mph001.
Bostwick VK, Weinberg BA. 2018. Nevertheless She Persisted? Gender Peer Effects in Doctoral STEM Programs. Working Paper NBER 25028. Cambridge, MA: National Bureau of Economic Research. Available at https://www.nber.org/system/files/working_papers/w25028/w25028.pdf. Accessed 10 May 2021.
Bureau of Labor Statistics (BLS). 2021. Education Pays: Earnings and Unemployment Rates by Educational Attainment, 2020. Available at https://www.bls.gov/emp/chart-unemployment-earnings-education.htm. Accessed 22 November 2021.
Cohen J. 1988. Statistical Power Analyses for the Behavioral Sciences. 2nd ed. Mahwah, NJ: Lawrence Erlbaum Associates.
Collins LM, Lanza ST. 2010. Latent Class and Latent Transition Analysis for Applications in the Social, Behavioral, and Health Sciences. Hoboken, NJ: Wiley.
Dalal RS, Crede M. 2013. Job Satisfaction and Other Job Attitudes. In Geisinger KM, Bracken BA, Carlson JF, Hansen J-IC, Kuncel NR, Reise SP, Rodriguez MC, editors, APA Handbook on Testing and Assessment in Psychology. Vol. 1: Test Theory and Testing and Assessment in Industrial and Organizational Psychology, pp. 675–91. Washington, DC: American Psychological Association.
Davenport TH, Patil DJ. 2012. Data Scientist: The Sexiest Job of the 21st Century. Harvard Business Review 90:70–76.
Dziak JJ, Bray BC, Wagner A. 2017. LCA Distal BCH SAS Macro Users’ Guide (Version 1.1). University Park, PA: Pennsylvania State University. Available at https://www.latentclassanalysis.com/models/lca-distal-outcome/.
Dziak JJ, Bray BC, Zhang J, Zhang M, Lanza ST. 2016. Comparing the Performance of Improved Classify-Analyze Approaches for Distal Outcomes in Latent Profile Analysis. Methodology (Gott) 12:107–16. Available at https://doi.org/10.1027/1614-2241/a000114.
Dziak JJ, Lanza ST. 2016. LCA Bootstrap SAS Macro Users’ Guide (Version 4.0). University Park, PA: Methodology Center, Pennsylvania State University. Available at https://www.latentclassanalysis.com/software/proc-lca-proc-lta/.
Festinger L. 1957. A Theory of Cognitive Dissonance. Stanford, CA: Stanford University Press.
Flaherty C. 2020. Professor Pay Is Flat—Again. Inside Higher Ed April 8. Available at https://www.insidehighered.com/news/2020/04/08/professor-pay-flat-again. Accessed 22 November 2021.
Foti RJ, Bray BC, Thompson NJ, Allgood SF. 2012. Know Thy Self, Know Thy Leader: Contributions of a Pattern-Oriented Approach to Leader Perceptions. Leadership Quarterly 23:702–17. Available at https://doi.org/10.1016/j.leaqua.2012.03.007.
Gorsuch RL. 1983. Factor Analysis. 2nd ed. Mahwah, NJ: Lawrence Erlbaum.
Hoff KA, Song QC, Wee CJM, Phan WMJ, Rounds J. 2020. Interest Fit and Job Satisfaction: A Systematic Review and Meta-Analysis. Journal of Vocational Behavior 123:1–16. Available at https://doi.org/10.1016/j.jvb.2020.103503.
Howard MC, Hoffman ME. 2018. Variable-Centered, Person-Centered, and Person-Specific Approaches: Where Theory Meets the Method. Organizational Research Methods 21:846–76.
Kaloudis A, Aspelund A, Koch PM, Lauvas TA, Tuft Mathisen M, Strand O, Sorheim R, Aadland T. 2019. How Universities Contribute to Innovation: A Literature Review-Based Analysis. Trondheim, Norway: Norwegian University of Science and Technology.
Keppel G, Wickens TD. 2004. Design and Analysis. 4th ed. Upper Saddle River, NJ: Pearson.
Lanza ST, Dziak JJ, Huang L, Wagner A, Collins LM. 2015. PROC LCA & PROC LTA (Version 1.3.2). University Park, PA: Methodology Center, Pennsylvania State University. Available at https://www.latentclassanalysis.com/software/proc-lca-proc-lta/.
Lawrence BS, Zyphur MJ. 2011. Identifying Organizational Faultlines with Latent Cluster Analysis. Organizational Research Methods 14:32–57. Available at https://doi.org/10.1177/1094428110376838.
Layland EK. 2020. Leveraging Latent Class Modeling at the Intersection of Racism and Homonegatism Experienced by Black and Latino Sexual Minority Young Men: Identifying Subgroups and Their Links with Substance Use. Unpublished doctoral dissertation. University Park, PA: Pennsylvania State University. Available at https://etda.libraries.psu.edu/files/final_submissions/21929.
Lindner C. 2018. Where Do Data Scientists Come From? Indeed Engineering December 13. Available at https://engineering.indeedblog.com/blog/2018/12/where-do-data-scientists-come-from/. Accessed 11 May 2021.
Madhusoodanan J. 2014. 2014 Life Sciences Salary Survey. The Scientist November 1. Available at https://www.the-scientist.com/features/2014-life-sciences-salary-survey-36509. Accessed 1 February 2022.
Nasserinejad K, van Rosmalen J, de Kort W, Lesaffre E. 2017. Comparison of Criteria for Choosing the Number of Latent Classes in Bayesian Finite Mixture Models. PLoS ONE 12:1–23. Available at https://doi.org/10.1371/journal.pone.0168838.
National Center for Science and Engineering Statistics (NCSES). 2019. Survey of Doctorate Recipients, 2017. Data Tables. Alexandria, VA: National Science Foundation. Available at https://www.nsf.gov/statistics/srvydoctoratework/.
National Center for Science and Engineering Statistics (NCSES). 2021. Women, Minorities, and People with Disabilities in Science and Engineering: 2021. Special Report NSF 21-321. Alexandria, VA: National Science Foundation. Available at https://www.nsf.gov/statistics/wmpd.
National Science Board. (2019, September). The Skilled Technical Workforce: Crafting America’s Science and Engineering Enterprise. NSB-2019-23. Alexandria, VA. Available at https://www.nsf.gov/nsb/publications/2019/nsb201923.pdf. Accessed 11 May 2021.
Nylund KL, Asparouhov T, Muthen BO. 2007. Deciding on the Number of Classes in Latent Class Analysis and Growth Mixture Modeling: A Monte Carlo Simulation Study. Structural Equation Modeling 14:535–69. Available at https://doi.org/10.1080/10705510701575396.
Ruiz Castro M, Van der Heijden B, Henderson EL. 2020. Catalysts in Career Transitions: Academic Researchers Transitioning into Sustainable Careers in Data Science. Journal of Vocational Behavior 122:1–17. Available at https://doi.org/10.1016/j.jvb.2020.103479.
Sabharwal M, Corley EA. 2009. Faculty Job Satisfaction across Gender and Discipline. Social Science Journal 46:539–56. Available at https://doi.org/10.1016/j.soscij.2009.04.015.
SAS. 2021. SAS (Version 9.4). Cary, NC: SAS Inc.
Seligman MEP. 2012. Flourish. New York: Atria Books.
Spreitzer GM, Cameron KS, editors. 2011. The Oxford Handbook of Positive Organizational Scholarship. New York: Oxford University Press.
Tatsuoka MM. 1988. Multivariate Analysis: Techniques for Educational and Psychological Research. 2nd ed. New York: Macmillan Publishing.
Terry C. 2019. Should I Get a PhD? Reasons For Getting a PhD—Or Not. Noodle October 18. Available at https://www.noodle.com/articles/should-i-get-a-phd-reasons-for-getting-a-phd-or-not. Accessed 22 November 2021.
Wang M, Hanges P. 2011. Latent Class Procedures: Applications to Organizational Research. Organizational Research Methods 14:24–31. Available at https://doi.org/10.1177/1094428110383988.
Weiss DJ, Dawis RV, England GW. 1967. Manual for the Minnesota Satisfaction Questionnaire. Minnesota Studies in Vocational Rehabilitation 22:120.
Wise SL. 2017. Rapid-Guessing Behavior: Its Identification, Interpretation, and Implication. Educational Measurement: Issues and Practice 36:52–61.
Suggested Citation
Fritz MS; National Center for Science and Engineering Statistics (NCSES). 2022. Job Importance versus Job Satisfaction: A Latent Class Analysis of the 2017 Survey of Doctorate Recipients. Working Paper NCSES 22-207. Alexandria, VA: National Science Foundation. Available at https://ncses.nsf.gov/pubs/ncses22207.
Contact Us
NCSES
National Center for Science and Engineering Statistics
Directorate for Social, Behavioral and Economic Sciences
National Science Foundation
2415 Eisenhower Avenue, Suite W14200
Alexandria, VA 22314
Tel: (703) 292-8780
FIRS: (800) 877-8339
TDD: (800) 281-8749
E-mail: ncsesweb@nsf.gov