 An official website of the United States government

SED-UMETRICS Linkage Technical Report
Disclaimer
Working papers are intended to report exploratory results of research and analysis undertaken by the National Center for Science and Engineering Statistics within the National Science Foundation (NSF). Any opinions, findings, conclusions, or recommendations expressed in this working paper do not necessarily reflect the views of NSF. This working paper has been released to inform interested parties of ongoing research or activities and to encourage further discussion of the topic.
Abstract
This report documents the methodology and technical approach and summarizes results of linking Survey of Earned Doctorates (SED) data collected by the National Center for Science and Engineering Statistics (NCSES) within the National Science Foundation to a new source of research data (UMETRICS [Universities: Measuring the Impacts of Research on Innovation, Competitiveness, and Science]) processed by the Institute for Research on Innovation and Science (IRIS).
This data linkage research shows it is feasible to combine the two data sources, even though differences exist in coverage of populations and time periods and they have different identifiers. The implementation approach can inform other similar efforts and can inform the implementation of the Foundations for Evidence-Based Policymaking Act of 2018. The data linkage approach, while initially time consuming, is replicable and can scale to additional years and data sets. Measuring linkage quality when combining administrative and survey data requires defining both the relevant population to be matched and the match rate. Those definitions will differ depending on the goal of the linkage. The value of the linkage effort is considerable in terms of (1) expanding understanding of survey responses to key questions of interest, notably using grant funding to enrich understanding of reported sources of graduate school financial support and (2) adding new measures reflecting the dynamics of research experiences of doctorate recipients. There is substantial potential to engage researchers and the academic community to inform the linkage quality results as well as to expand and enhance the value of the data linkage project documented in this report.
Introduction
This report provides the technical documentation for a project linking the Survey of Earned Doctorates (SED) to longitudinal university transaction data (UMETRICS [Universities: Measuring the Impacts of Research on Innovation, Competitiveness, and Science]). The SED is an annual census of research doctorate recipients from U.S. universities. The first goal of the data linkage project is to enhance the value of existing information on the sources and structure (such as timing, level, and duration of funding) of research funding to doctoral training in the United States while minimizing the cost to the taxpayer and without increasing respondent burden. The second goal is to support the implementation of initiatives of the Foundations for Evidence-Based Policymaking Act of 2018 (Public Law No: 115-435) that seek to link administrative and survey data, particularly in its use of privacy preserving technologies (Chang et al. 2022).
In particular, the project demonstrates the technical feasibility of linking restricted survey data from the National Center for Science and Engineering Statistics (NCSES) with complex administrative records. The report shows how the combination of the two data sources can provide new insights into the types and dynamics of research funding. It provides technical documentation on how administrative data can be combined with survey data to create a new linked—and longitudinal—data asset. It identifies the challenges associated with combining a traditional point-in-time survey of individuals with administrative data from a changing population with different units of analysis over varying durations.
The project also provides insights into how to measure linkage quality and provides suggestions about different measures that can be used in future linkages. It discusses the impact of different approaches on subgroups, which can have important implications for the choice of privacy preserving technologies.
The project demonstrates how combining data from multiple sources can add value in two ways. The first is expanding understanding of responses by comparing self-reported information on source of financial support during graduate school with information captured in administrative grant data, paying particular attention to differences for foreign-born persons, underrepresented minorities, and women. It enhances the responses by adding information on the structure of research funding. The second is to create new information by adding new dynamic measures reflecting respondent experiences from the longitudinal data available in the administrative UMETRICS data.
The new data asset will then enable potential uses such as helping policymakers to understand how changes in federal funding affect the composition of the doctoral student pipeline, as well as to understand the role of grant structure and research fields on doctoral degree completion (Chang et al. 2019). All data and codes are available to approved researchers in the secure remote facility—the Administrative Data Research Facility (ADRF)—so that assumptions can be tested for robustness and results are replicable and reproducible. It is also hoped that the work will yield many more uses of the SED by promoting the use of the new linked data asset through training classes, data products, and scientific and technical reports.
Context
“Instability in Federal funding … affects the career trajectories of doctorate students, postdoctoral workers, and researchers whose employment is often supported by federally funded research grants. Recognizing that strong, steady increases in Federal R&D funding may not always be feasible, it is important for Federal agencies, Congress, and research institutions to consider how best to mitigate the adverse effects of budget conditions on career paths” (NSB 2015: 26).
Despite the global importance of the U.S. STEM (science, technology, engineering, and mathematics) ecosystem and the increasing societal importance of STEM research and training, it “is far less effective than it might be at educating graduate students prepared for the wide range of STEM careers in this century’s ever-evolving work environment.” Empirical research is needed, yet current data infrastructures fall short: “While federal funders have spearheaded national efforts and funded pilots to test the efficacy … of programs, the evaluation and assessment outcomes are not yet available. The absence of comprehensive data hampers engagement of key potential advocates” (NSTC 2008). Multiple reports issued in the past decade by the National Academies of Sciences, Engineering, and Medicine, the American Academy of Arts and Sciences, and the executive and the legislative branches of the federal government have called for new data, infrastructure, and stakeholder engagement to address these issues (NASEM 2016, 2018a, 2018b, 2018c; NRC 2014; AAAS 2016).
The SED, while providing rich information about doctorate recipients, does not provide information about the levels or stability of federal funding, even though research experience and funding support are an essential component of STEM graduate education. The SED asks a single, retrospective question about sources of financial support during graduate school. Linking the SED with UMETRICS provides new information about the quality of responses to that question. As such, this work is responsive to the Report of the Commission on Evidence-Based Policy (AAAS 2018). That report recommended government agencies make increased use of data for specific studies, requiring stringent privacy qualifications to ensure that data continued to be effectively protected while improving government officials’ ability to understand the impacts of programs on a wider range of outcomes. In addition, the work presented here is responsive to the Foundations for Evidence-Based Policymaking Act, signed into law January 2019, which requires the federal government to modernize its data management practices, to use data and evidence to inform their work, to build measures to inform the public of data use, and to provide ways for the public to request that specific data assets be prioritized (Brown 2021).
Combining Administrative and Survey Data
Overview
A major challenge with combining administrative and survey data sets is addressing their structural differences. The following is an overview of the differences in key structural features of administrative and survey data (table 1).
Features of UMETRICS and the SED
AY = academic year; SED = Survey of Earned Doctorates; UMETRICS = Universities: Measuring the Impacts of Research on Innovation, Competitiveness, and Science.
Source(s):
National Center for Science and Engineering Statistics, Survey of Earned Doctorates, AYs 2014–17; Institute for Research on Innovation and Science, UMETRICS, 2020 release data.
The linkage effort combines two main data sources. The first is data from the SED, which is an annual census conducted since 1957 of all individuals receiving a research doctorate from an accredited U.S. institution in a given academic year. The SED is sponsored by NCSES within the National Science Foundation (NSF) and by three other federal agencies: the National Institutes of Health, Department of Education, and National Endowment for the Humanities. The SED collects information on the doctorate recipient's educational history, demographic characteristics, and postgraduation plans. Results are used to assess characteristics of the doctoral population and trends in doctoral education and degrees (Chang et al. 2022, 2019).
The second data source is the UMETRICS data submitted to IRIS by IRIS member universities (Nicholls et al. 2020). These longitudinal data files can provide direct information about the levels and stability of research funding at multiple levels—individual, research field, program, department, and institutional. The data files include university financial and personnel administrative data pertaining to sponsored project expenditures at each member university during a given year, drawn directly from sponsored projects, procurement, and human resources data systems on each IRIS university’s campus. Individual campus files are deidentified, cleaned, and aggregated by IRIS to produce the core collection files. The 2020 release (https://iris.isr.umich.edu/research-data/2022datarelease-summarydoc/) includes transactions from about 440,000 unique federal and nonfederal awards, including wage payments to about 700,000 individuals as well as transactions to about 900,000 unique vendors (both organizations and individuals). In addition, about 23,600 unique organizations or institutions received subawards from IRIS universities transferring their prime awards. About 36,000 unique awards were used by IRIS universities as the funding source to transfer subawards to subrecipients. Overall, award direct expenditures total to $100 billion.
The technical challenge lies in the fact that, like many data sets that need to be linked, the overlap between the two allows linkage but differences exist because the two data sets cover different populations, cover different time periods, and have different identifiers. The two data sets also have different confidentiality protocols. Briefly, the SED, as is often the norm with survey data, draws from a fixed cross-sectional frame consisting of PhDs on or about the time that they graduate. Measures such as “funding source” are predefined before the survey is administered. UMETRICS data, as is often the norm with administrative data, are longitudinal, with a frame that varies depending on the number of universities participating and the number of individuals being paid on research grants. In keeping with most administrative data, measures such as “graduate student” or “paid on a research grant” are not predefined and must be characterized by the analysts.
Although this linkage benefits both the SED and UMETRICS, the focus of this report is to determine the extent to which it is possible to enhance SED data with UMETRICS data. Therefore, the SED is used as the frame, and the study determined how many individuals from UMETRICS institutions can be linked to doctorate recipients in the SED. Image 1 provides a schematic of the combined data sets and illustrates the organizing framework for the report. As illustrated in image 1, the linkage between doctorate recipients in the SED and university employees funded by research grants is expected for those who are classified as graduate students in UMETRICS data and received their doctorates in academic years 2014–17.

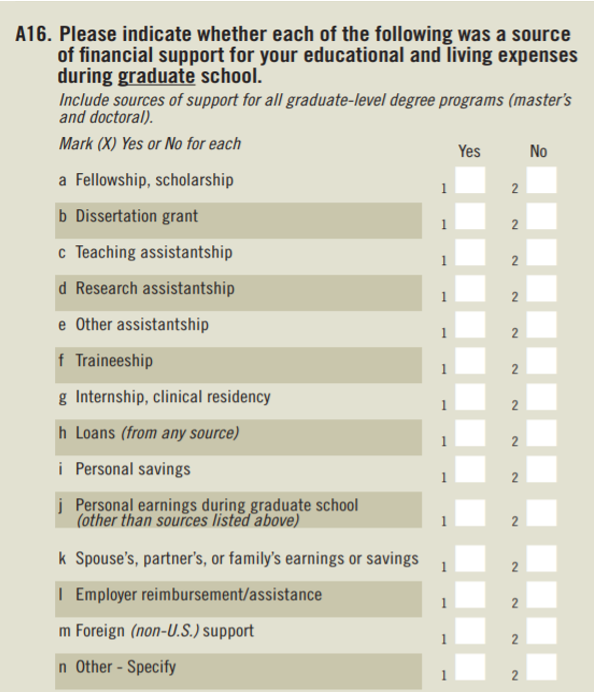
It is important to note that there is no gold standard information on how many doctorate recipients are supported by federal research funding—or indeed, how many individuals in total are supported by federal research funding (Fealing et al. 2011; Marburger 2005, 2011; Reedy, Teitelbaum, Litan 2011). The SED simply asks the source of financial support (image 2). The question does not ask the respondent about federal or nonfederal funding, much less the agency that provided the funding, or the intensity or the stability of funding. The only known characteristic is the proportion of doctorate recipients who reported receiving support for each source of financial support. For example, 64% of doctorate recipients who graduated in academic year 2017 reported receiving a research assistantship.
Confidentiality Protections
SED Confidentiality Protocols
The SED is protected by a number of federal statutes. These include the Privacy Act of 1974, as amended, and the National Science Foundation Act of 1950, as amended, which provide for the security and privacy of personally identifiable statistical data maintained by NSF and the federal government. Sections of these laws make unlawful the disclosure or improper use of restricted use data. Violators are subject to a fine or imprisonment.
UMETRICS Confidentiality Protocols
IRIS has developed the necessary institutional and governance mechanisms necessary to support such data sharing, as well as new linkage tools. In particular, it receives confidential data from its member institutions (depositors). The membership agreement requires that IRIS not disclose identifiable institution materials or identifiable personal materials without a depositor’s permission. IRIS agrees to use reasonable administrative, technical, and physical safeguards to prevent use or disclosure of the data. All data are encrypted in transmission (including via Web interface) and stored at no less than advanced encryption standard 128-bit level encryption, and they will use industry-standard and up-to-date security tools and technologies, such as antivirus protections and intrusion detection methods in performing its obligations. All exports are reviewed for statistical disclosure limitation conformance before approval to release is granted.
Secure Enclave
All work was conducted using state of the art protocols within the Coleridge Initiative’s Administrative Data Research Facility (ADRF). The ADRF is a secure cloud-based environment that was developed initially as a pilot to inform the decision-making of the Commission on Evidence-Based Policymaking and has since grown to be a platform used by multiple agencies (Coleridge Initiative 2021). The ADRF was established using a federally approved and standardized approach for the certification of secure cloud-based platforms called FedRAMP. The authorization to operate certification has been issued to the ADRF by the Department of Agriculture and by the National Science Foundation. It has an authorization to use by the Department of Health and Human Services. The data are hosted in the Amazon Web Services GovCloud, which complies with a wide range of security requirements, such as the Department of Justice’s Criminal Justice Information Systems Security Policy, U.S. International Traffic in Arms Regulations; Export Administration Regulations, and Department of Defense Cloud Computing Security Requirements Guide for Impact Levels 2, 4, and 5.
The operational approach is to apply the “five safes” framework (“safe projects,” “safe people,” “safe settings,” “safe data,” “safe exports”) to data protection (Arbuckle, Ritchie 2019; Desai, Ritchie, Welpton 2016). That framework provides automated and structured workflows, which allow data owners to manage approvals (“safe projects”). It is designed to automate researcher onboarding by streamlining search for and discovery of relevant data and their approvals for access. It tracks data access and use by analysts and researchers through an automated data stewardship application (“safe people”). The FedRAMP approval is the “safe settings.” A collaboration with Amazon Web Services resulted in the development of a stand-alone Windows application to simplify the hashing of data elements—the transformation of direct identifiers like name and social security number to a meaningless string of letters and numbers—prior to being transmitted to the ADRF (“safe data”). That application is open source and is provided free of charge to any interested users. The export module automates the export review process (“safe output”).
The ADRF also has provided a data stewardship application that provides automated and structured workflows. The application allows data owners to manage approvals, track data access, and oversee use by analysts and researchers. It is also designed to automate researcher onboarding by streamlining search and discovery of relevant data and approvals for access. In so doing, the data stewardship app reduces administrative burden, improves resources utilization, and provides stewards with essential reports on data access and usage.
To prevent secondary reidentification, outputs on cells that contain information with fewer than 10 individuals or 3 institutions were suppressed.
SED Data
The SED is an annual census of all individuals receiving a research doctorate from almost all accredited U.S. institutions in a given academic year (Marburger 2005). The survey response rate exceeds 90%. At the end of survey data collection phase, institutional coordinators are contacted to obtain information on a small number of critical SED data items for nonrespondents from their institution. Therefore, the SED data files do contain all individual doctorate recipients. The years used for this report include academic years 2014 through 2017.
Content
The SED collects information on the doctorate recipient's educational history, demographic characteristics, and postgraduation plans. Imputation is not performed for missing survey data items except for the month value used in calculation of the age at doctorate and time to degree variables. No direct question is asked on federal research funding—the level, source, or stability. The question that asks respondents to indicate whether each of the following was a source of financial support for your educational and living expenses during graduate school includes research assistantship as an option.
Link Coverage and Keys
The SED includes information on the name and the year and month of birth for more than 41,000 respondents who received research doctorates from the subset of 21 active IRIS universities and who provided both personally identifiable information (PII) and at least 4 years of data prior to the close of the academic year 2017. The institution was used as a blocking variable.
UMETRICS Data
Institutional Coverage and Temporality
The UMETRICS data comprises administrative records drawn directly from university sponsored projects, procurement, and human resources data systems that track direct cost expenditures at the level of monthly transactions for nearly 450,000 federal and nonfederal sponsored project grants. UMETRICS data include monthly records for more than 720,000 faculty, staff, students, and postdoctoral trainees employed on those grants. Currently, data are available for 75 campuses at 33 universities representing about 41% of total academic R&D spending in the United States (Chang et al. 2022); the time coverage varies across universities and ranges from 3 months to 18 years.
Content
The core data elements for the purpose of this project are data on employees and on research grants (awards). The employee file provides information about the individuals working on research-related grants at IRIS member universities. The employee file has an observation for each employee on each award for every pay period they worked in that award. A pay period is typically 2 weeks but may vary by university. The employee file connects directly with the award file by the grant IDs. Although all individuals who charge time to federal or nonfederal research grants are included in the data, the unit of record is a payment to an individual on an award in a pay period. Thus, individuals routinely appear in multiple periods, on multiple awards. Although each employee should have only one entry per award–account number pairing per month, an employee could work on several awards concurrently or sequentially. An additional file containing the hashed PII for each person in the award file was provided and used for linkage. This file contained the unique ID for each person that linked to the core employee file. Twelve of the 33 IRIS member universities either did not provide PII, did not provide PII on students, or did not have sufficient coverage for linkage; therefore, this linkage was only performed on 21 of the 33 IRIS member universities.
The award file is the centerpiece of the UMETRICS data and directly connects to other files, thus making it a fundamental source for record linkages. This file contains transaction data on every sponsored project that has direct or overhead (commonly referred to as indirect) expenditures during the period covered in the file. This file can be considered an award profile in that types of sponsors can be identified through a federal grant indicator, Catalog of Federal Domestic Assistance number, funding source names, and grant administering suborganization units on campus. The file includes all funded awards that IRIS universities received during a given year. Awards include (but are not limited to) both federal and nonfederal research-related awards and nonresearch-related activities such as work-study programs.
Coverage of Analytical File
The analytical file was constructed to maximize the potential for linkage. The earliest data available begins in 2001; however, the number of reporting universities is sparse in the earlier years, with fewer than half of the universities reporting before 2013. The greatest consistent coverage is for the academic years 2014–17. Only 21 active IRIS universities provide both PII data and have at least 4 years of available data prior to the close of the academic year 2017. As shown in image 3, each of the 21 universities being examined in this pilot project are represented during this time; 19 universities have full coverage, and 2 universities are missing only 1 year of data.

Individual Coverage and Temporality
Because the focus of this project is to link UMETRICS data to SED data, it is useful to construct a measure of each individual’s occupation from the employee file. To construct this variable, a file containing the unique job names and descriptions was extracted from the files submitted from the institutions. An occupation classification was assigned to each job or job description (Ikudo et al. 2020). It is important to note that in order to protect the employee's privacy and confidentiality, this process was applied to the job description, and the data was later joined back with the individuals in the secure environment. This means that none of the personal information on work history was taken into account when assigning the occupation classification and is a possible source of classification noise.
Link Coverage and Keys
As noted above, 21 institutions permitted the use of year of birth and name for linking purposes. The institution name was used as a blocking variable. Although technically only graduate students in UMETRICS should be linked to SED respondents, the noise in the occupational classification meant that it was not a reliable block key.
Measuring Match Rates
In order to measure the match rates resulting from combining two files—file A and file B—it is necessary to define both a numerator (the number of individuals correctly matched between the two files) relative to a denominator (the total number of individuals who could potentially be matched) (Joshua, Stefan 2020) (image 4).
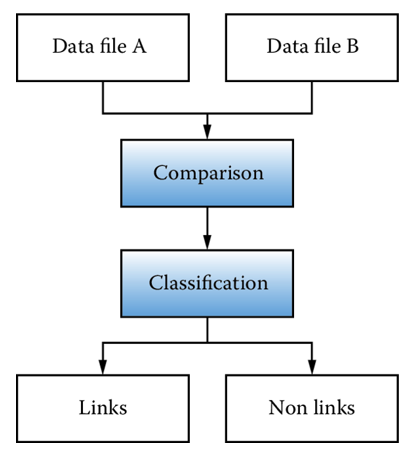
In determining the match rate, it is necessary to determine the structure of data file A and data file B. That determination in this case is not straightforward, both because the population frame differs and because the structure of the two source files differs. So not all individuals in data file A will be in data file B, and not all individuals in data file B will be in data file A.
As noted above, data file A (the SED) is a survey of doctorate recipients covering a point in time with coverage of almost all doctorate granting institutions—approximately 450 institutions in each of the academic years 2014–17. Table A-1 in the appendix shows the counts of doctorate graduates in each academic year from the subset of reporting IRIS institutions in that period: a total of 41,357 respondents. Because the SED does not directly ask whether an individual is supported by research grants, it is not possible to know how many individuals should match UMETRICS data. The maximum, but unlikely, number would be all 41,357 respondents; the minimum number is unknown but could include all individuals who checked box a, b, or d (fellowship, grant, or research assistantship) on question A6 (image 2).
Indeed, of the 14,969 SED respondents who were matched to the UMETRICS data, 10,904 reported receiving research assistantship support. In other words, 4,065 of SED respondents who were indicated by UMETRICS as having received research funding—or almost 30%—reported not having received research assistantship.
Data file B (UMETRICS) is derived from the subset of 21 IRIS member institutions who allowed date of birth and name information to be used for analytical purposes, and it includes all individuals funded by research grants in all the years for which the institution provides data. One of the key research questions that must be addressed in this matching exercise is the incidence and intensity of research funding during the period prior to the individual’s graduation. Therefore, the data file was constructed from the transaction data for the 3 years prior to each of the SED cycles that were used for this project. Table 2 in the appendix shows the number of graduate students in these institutions in each academic year. For example, 28,524 graduate students were supported by research funding in 2017. As with most administrative data, it is difficult to infer occupation from job titles (Ikudo et al. 2020), so this count is likely to be a lower bound of potential doctorate recipients funded by research grants. An upper bound of the total possible number is all employees, which is 120,657 unique individuals in the SED for the 2017 academic year.
Name parsing example when matching names in the SED and UMETRICS
SED = Survey of Earned Doctorates; UMETRICS = Universities: Measuring the Impacts of Research on Innovation, Competitiveness, and Science.
Note(s):
This is an example of how names are parsed and is not a real observation.
It is important to note that determining the match rate is not an indicator of match quality. A failure for a row in file A to match a row in file B could occur for any number of reasons, including the following:
- Scope mismatch: For example, a doctorate recipient did not receive research funding, so would never be found in file B.
- Temporal mismatch: For example, a doctorate recipient received research funding, but received it during a period in which the data were not reported in file B.
- Reporting errors: For example, name and date of birth were reported differently in the two files.
Match rates will differ depending on what assumptions are made in the matching process. These are discussed in the next section.
Technical Documentation of the Linkage Process
This section documents the linkage approach, with particular attention to the data cleaning prior to the linkage, the effects of different linkage procedures on match quality, and the match quality for key subgroups. Protecting the privacy and confidentiality of individuals is paramount for both legal and ethical reasons (Joshua and Stefan 2020; Borgman and Siegfried 1992; Kim, Kim, and Owen-Smith 2021). As a result, all PII was hashed for each data set prior to the data set being transmitted to the ADRF. In order to maximize the match rate, the same standardization techniques were applied to the PII in each data set and the same hashing algorithm and seed were used. The result is that identical cleartext PII strings are transformed into unique, identical hashed strings that can then be used for deidentified linkage to integrate the two data sources.
The consequence of this privacy protection protocol is that only exact matching approaches can be used, not statistical similarity approaches. For this linkage, we used information on each individual month and year of birth when possible. Those fields, rather than complete date of birth information, were selected in concert with university data providers after careful pilot tests of linking procedures that helped determine the highest value assets for improving linkage. Although adding day of birth to these data would offer a minor improvement in linkage quality, that improvement came at the cost of expanded concerns about privacy and risk; therefore, the additional data asset was not pursued.
Because the privacy protocols required hashing of PII prior to transfer from both IRIS and NCSES, the names in UMETRICS and the SED were prepared using the same procedure. First, the characters with known errors were removed (such as mojibake). All names were converted to lowercase, and all brackets within names were removed. Parenthetical references were removed and placed in a separate column. All punctuation marks were removed to standardize name fields. Finally, the common name affixes (i.e., Jr, III, PhD) found in the name fields were removed. Once the names were cleaned, the names were parsed and then hashed using the same algorithm and seed. UMETRICS and SED data were prepared separately. The two files were then matched, and 16,663 potential matches between SED and UMETRICS data were found. Of these, 14,969 were identified as matches with satisfying validation filters. The steps of validation and filtering are described in the section after matching steps. The next section unpacks the matching steps: almost all the matches were achieved from the first two steps—about 60% were identified in step 1, and another 33% were identified in step 2. Steps 3 and 4 recovered under 1%, step 5 identified 5% of matches, and step 6 identified the balance.
Matching Steps
The “exact match” approach was used to match hashed names and hashed birth dates of individuals from the same institution in six sequential steps; each additional step relaxed the previous step’s matching rule restriction. The criteria for the 6 steps are listed below.
Step 1: Full given name, family name, UMETRICS institution ID, year of birth, month of birth.
Step 2: First word in given name, family name, UMETRICS institution ID, year of birth, month of birth.
Step 3: Full given name, family name, UMETRICS institution ID, year of birth (month of birth must be missing from SED or UMETRICS for it to be considered a match).
Step 4: First word in given name, family name, UMETRICS institution ID, year of birth (month of birth must be missing from SED or UMETRICS to be considered a match).
Step 5: Full given name, family name, UMETRICS institution ID (year of birth must be missing from SED or UMETRICS to be considered a match).
Step 6: First word in given name, family name, UMETRICS institution ID (year of birth must be missing from SED or UMETRICS to be considered a match).
For a match to occur in one of the first two steps, the month and year of birth must be the same (and available) in both SED and UMETRICS. The date of birth criterion is consistent in the first two steps. However, the restrictiveness of the name matching criteria is less restrictive in the second step. In the first step, the entire name must match, whereas only the first given name and family name must match in the second step. Thus, in the second step someone is considered a match if the respondent either has a second given name in one data source and not the other or if the respondent has two different second given names in the two data sources. In most cases when the second given name is available in both data sources but does not match, it is due to the second given initial being recorded as the second middle name in one data source and not the other. This is discussed further in the “Robustness Checks” section.
For a match to occur in steps 3–4, the year of birth must be the same (and available) in both data sets, and the month must be missing in one data set. The same variation in name matching criteria from the previous steps applies here.
The pattern continues for steps 5–6, where the year of birth must be missing in one of the data sets. The name variation from the initial steps applies here as well. These steps are for individuals who could not be matched using any date of birth information in the previous steps. The flexibility in the date of birth matching criteria stems from the fact that five institutions in UMETRICS report only the year of birth, and one institution does not report the month or the year of birth. Further, there are observations in the SED with missing date of birth information.
Consider the following example for a fictitious person, Rhea Lynn Garner, assuming her month and year of birth are the same in both data sets, as well as her institution. The different ways this name might show up in the data sets are depicted in table 2.
If her name showed up the same in both data sets as “Rhea Lynn Garner” or “Rhea Garner,” she would be matched in step 1. If her name showed up as “Rhea Lynn Garner” in one data set and “Rhea Garner” in the other, she would not be matched in step 1 but she would be matched in step 2. It is possible that her middle initial shows up as her middle name in one data set; for example, if her name showed up as “Rhea L Garner” in one data set and “Rhea Lynn Garner” in the other, she would be matched in step 2. The name combinations with the corresponding match steps are provided in table 3.
Match steps from example when matching names in the SED and UMETRICS
SED = Survey of Earned Doctorates; UMETRICS = Universities: Measuring the Impacts of Research on Innovation, Competitiveness, and Science.
Note(s):
This is an example of how names are matched and is not a real observation.
Validation and Filtering Steps
One distinct advantage of rich input data is that different types of validation filters can be constructed based on the knowledge of the data. This section describes five such additional filters that can be used to identify the highest-quality matches: this results in 14,969 matches. The first type is standard: multiple rows in one data set matching to a single row in another. The next three types are more nuanced and identify unlikely timing patterns. This is possible by exploiting the temporal richness of the UMETRICS data given the exact graduation date provided in the SED. The last one relies on the richness of the occupational data in UMETRICS and identifies unlikely occupational transitions (e.g., going from faculty to undergraduate student in subsequent periods). Table 4 provides an overview of high-quality match generation and number of matches removed at each filtering step.
Filter summary of SED-UMETRICS linkage
na = not applicable.
AY = academic year; SED = Survey of Earned Doctorates; UMETRICS = Universities: Measuring the Impacts of Research on Innovation, Competitiveness, and Science.
Note(s):
This table reports the number of matches removed by and the number of matches remaining after each filter that was applied.
Source(s):
National Center for Science and Engineering Statistics, Survey of Earned Doctorates, AYs 2014–17; Institute for Research on Innovation and Science, UMETRICS, 2020 release data.
Filter 1: Multiple Matches
The first filter applied is the removal of multiple matches—when one person from one data set is matched to more than one person from the other data set. Out of the 16,663 potential matches, 113 of them were multiple matches. Most of them resulted from one individual from the SED being matched to more than one employee ID from UMETRICS. Note that it is not impossible for the same individual to have more than one employee ID in UMETRICS; this was far less common in the 2020 UMETRICS release than it was in previous releases; however, some of these multiple matches could still correspond to the same person. A few individuals from UMETRICS were also matched to more than one person from the SED. Note, since matched individuals were removed from the pool of potential matches after each step, all of the multimatched persons are matches during the same step. Table 5 shows us how many of these multiple matches were made during each of the six matching steps.
Filter 1: Removal of multiple matches
D = suppressed to avoid disclosure of confidential information.
AY = academic year; UMETRICS = Universities: Measuring the Impacts of Research on Innovation, Competitiveness, and Science.
Note(s):
Column 2 reports the number of matches that were constructed with each matching step before applying any filters. Column 3 reports the number of matches that remain after removing multiple matches (filter 1) while column 4 reports the number of multiple matches that were removed. Column 5 reports the percentage of matches made by each step that were removed.
Source(s):
National Center for Science and Engineering Statistics, Survey of Earned Doctorates, AYs 2014–17; Institute for Research on Innovation and Science, UMETRICS, 2020 release data.
Filter 2: Unlikely Last Transactions
Transactions were deemed to be unlikely if the last transaction in UMETRICS occurred before the reported PhD start date in the SED. As in table 6, 100 of the 14,963 SED survey respondents who reported a start date had transaction data in UMETRICS prior to that date. These matches were removed from our final reported statistics.
Filter 2: Removal of unlikely last transitions
AY = academic year; UMETRICS = Universities: Measuring the Impacts of Research on Innovation, Competitiveness, and Science.
Source(s):
National Center for Science and Engineering Statistics, Survey of Earned Doctorates, AYs 2014–17; Institute for Research on Innovation and Science, UMETRICS, 2020 release data.
Filter 3: Unlikely First Transactions
Transactions were also deemed to be unlikely if the first transaction in UMETRICS was observed after the graduation date. Because the purpose of this matching process is to match PhD recipients in the SED with UMETRICS data to identify their funding sources while earning their PhD, matches that only show up in UMETRICS after respondents have completed their PhD were removed. A total of 491 such matches were removed from our final reported statistics (table 7).
Filter 3: Removal of unlikely first transitions
AY = academic year; UMETRICS = Universities: Measuring the Impacts of Research on Innovation, Competitiveness, and Science.
Note(s):
Steps 3 through 6 were aggregated for disclosure purposes.
Source(s):
National Center for Science and Engineering Statistics, Survey of Earned Doctorates, AYs 2014–17; Institute for Research on Innovation and Science, UMETRICS, 2020 release data.
Filter 4: Unlikely Duration of Time
After applying the first three filters, 4,103 matches showed a portion of their records in UMETRICS after the recorded date of earning their doctoral degree in the SED, with over half of them being in UMETRICS less than a year after earning their PhD.
In considering the implications of this evidence for match quality, it is not unreasonable to see data for many doctorate graduates in UMETRICS after these graduates earn their degrees. Many students who are working on a grant will continue working on that grant until they finish their work or until they can effectively hand their work off to another individual. Further, it is important to keep in mind that the universities that participate in UMETRICS institutions are R1 research institutions (very high research activity), and many of the students stay on to do a postdoc at the same institution. Indeed, 1,583 of these 4,103 individuals who have the modal occupation of graduate student before their reported graduation in the SED have the modal occupation of postgraduate researcher after their reported graduation. Modal occupation classification means the occupation they had for the longest amount of time, not necessarily the one that appeared most often.
However, it seems reasonable to filter out matches that were not in UMETRICS for a sufficient amount of time pregraduation relative to postgraduation. As a result, all matches that were in UMETRICS up to 2 years postgraduation but did not appear in UMETRICS at least the same amount of time pregraduation were removed. For example, an individual was filtered out if they appeared in UMETRICS 12 months after graduation and appeared in UMETRICS 11 months before their graduation. Similarly, a match was removed if an individual appeared in UMETRICS more than 2 years after graduation, but less than 2 years pregraduation. These filtering rules resulted in the removal of 237 matches of the remaining 15,959 matches subsequent to the application of the first 3 filtering rules (table 8).
Filter 4: Removal of unlikely duration of time
AY = academic year; UMETRICS = Universities: Measuring the Impacts of Research on Innovation, Competitiveness, and Science.
Note(s):
Steps 3 through 6 were aggregated for disclosure purposes.
Source(s):
National Center for Science and Engineering Statistics, Survey of Earned Doctorates, AYs 2014–17; Institute for Research on Innovation and Science, UMETRICS, 2020 release data.
Filter 5: Unlikely Occupation Transitions
Occupation classifications were used to restrict our sample of matches further, filtering out unlikely occupation transitions. IRIS conducts the occupation classifications after the information is transferred to them by the universities. Each job description that was associated with a grant was removed from the secure data. Then a list of the unique job descriptions is assigned a specific job classification by hand.
These classification processes are completely removed from the individuals, so none of their information was considered when assigning a job classification. Job descriptions vary from university to university, with some universities having a small number of general job descriptions that cover many employees. In contrast, some universities have many job descriptions that cover few employees (Ikudo et al. 2020).
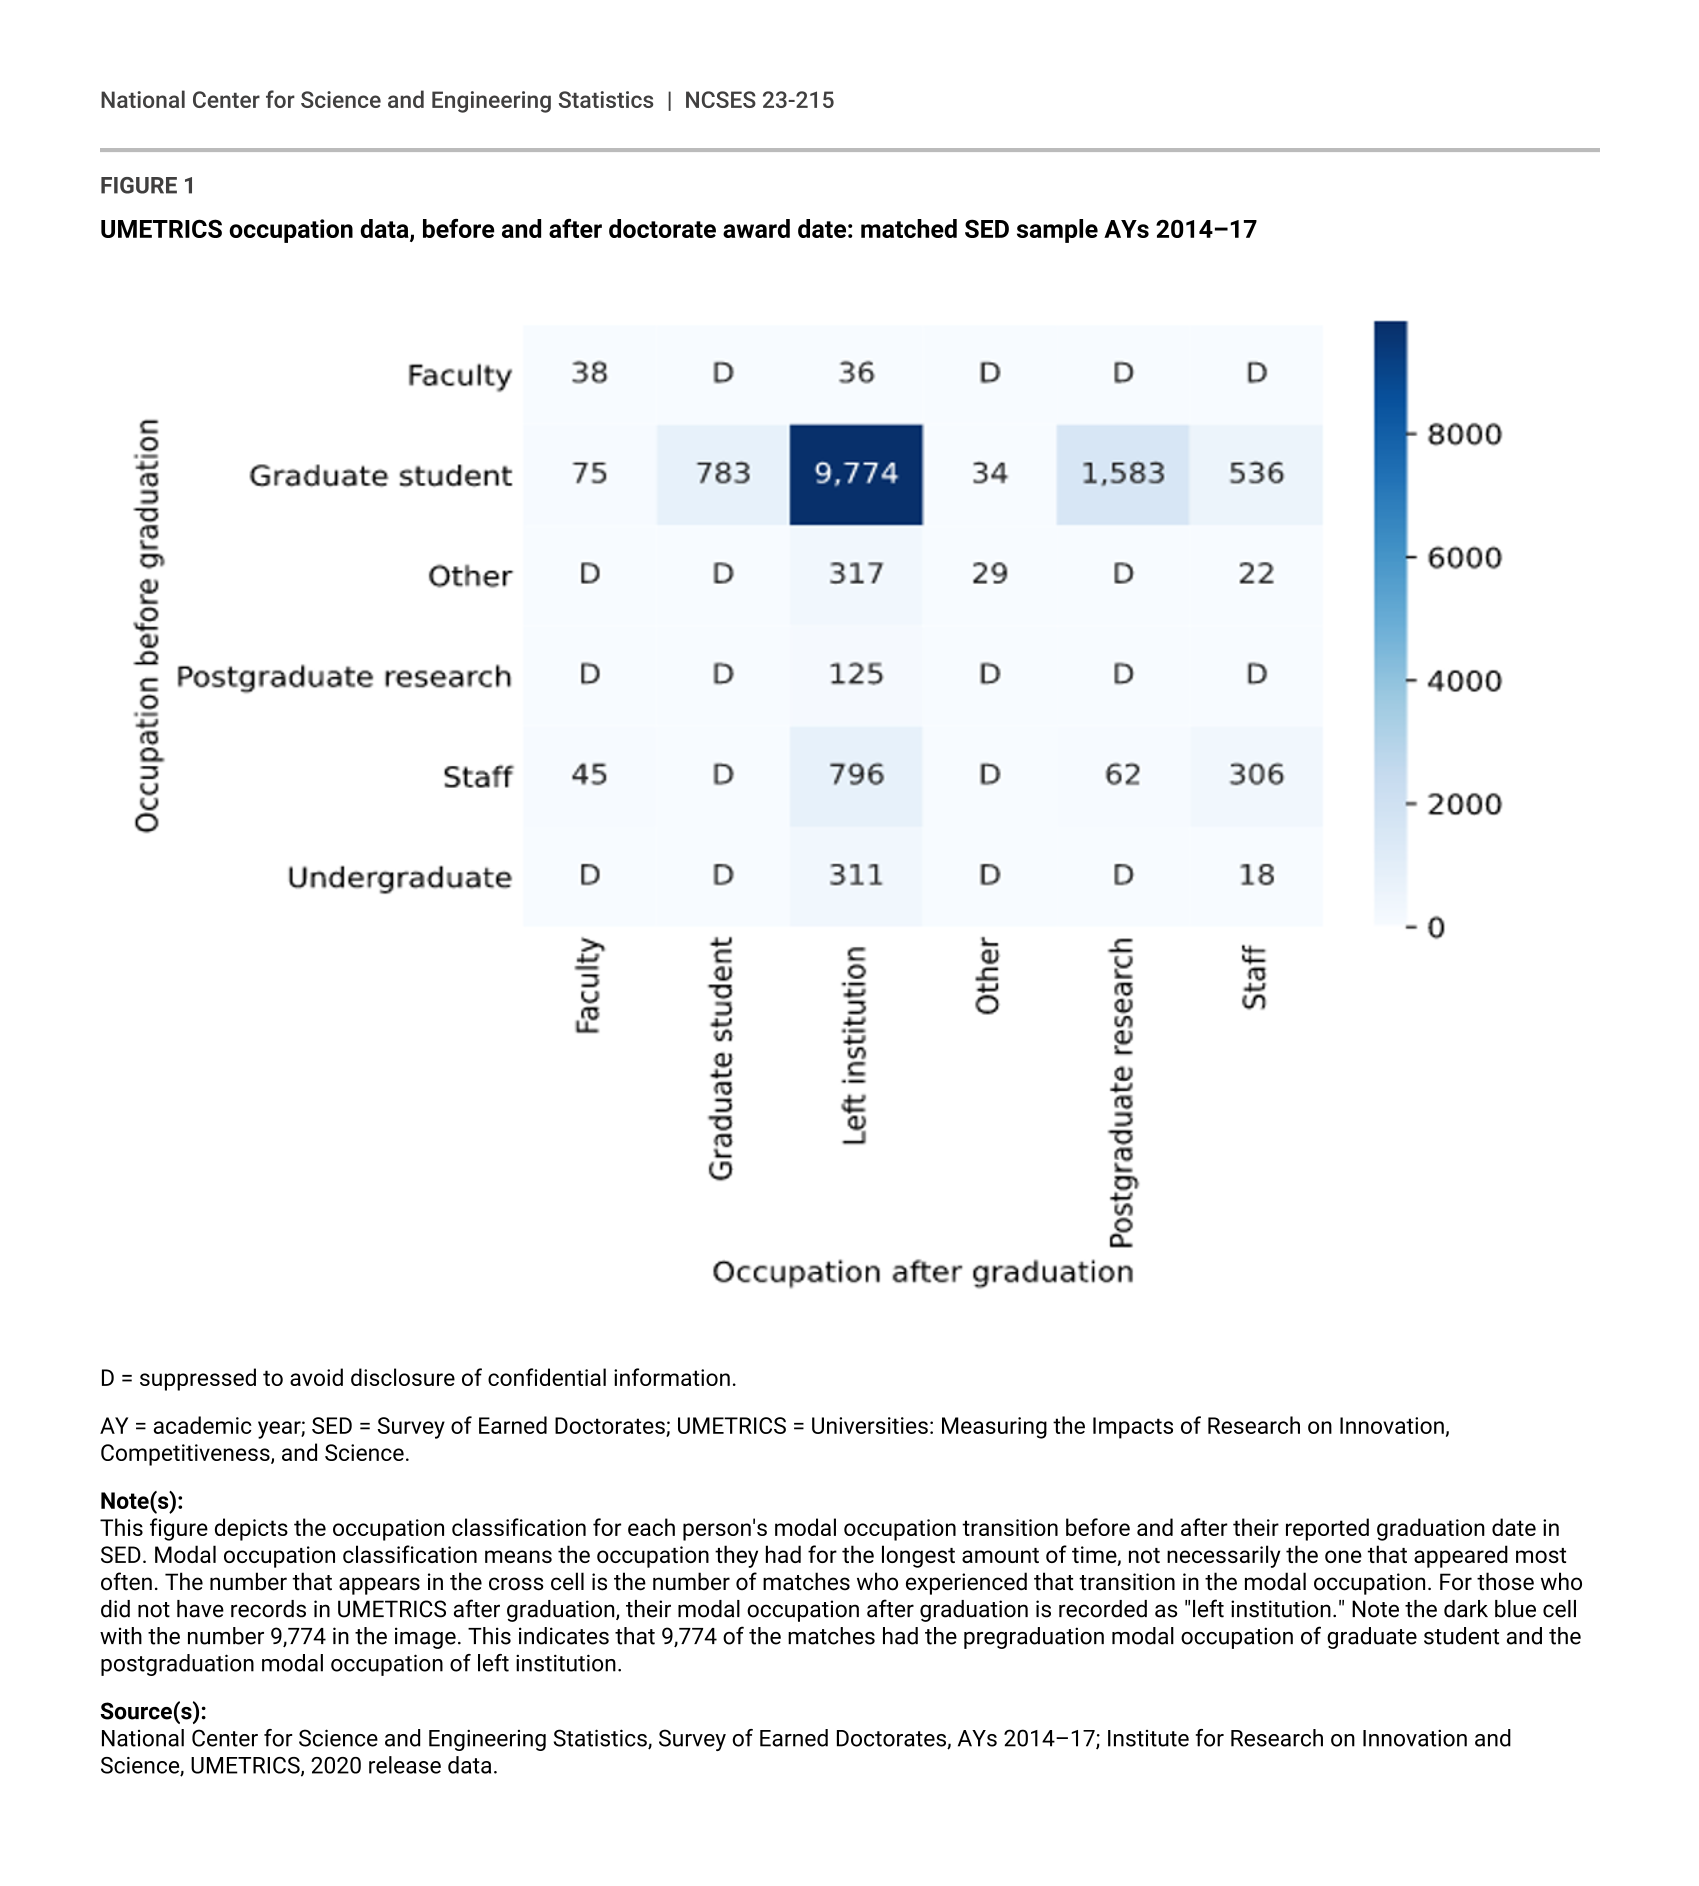
Figure 1 depicts the occupation classification for each person's modal occupation transition before and after their reported graduation date in the SED. To read this figure, the classifications of occupations before graduation are indicated on the vertical axis and the classifications of occupations after graduation are indicated on the horizontal axis. The number that appears in the cross cell is the number of matches who experienced that transition in modal occupation. For those who did not have records in UMETRICS after graduation, their modal occupation after graduation is recorded as “left institution.” Note the cell with the number 9,774. This indicates that 9,774 of the matches had the pregraduation modal occupation transition of “graduate student” and the postgraduation modal occupation of “left institution.” The results of applying filter 5 are summarized in table 9.
UMETRICS occupation data, before and after doctorate award date: matched SED sample AYs 2014–17
D = suppressed to avoid disclosure of confidential information.
AY = academic year; SED = Survey of Earned Doctorates; UMETRICS = Universities: Measuring the Impacts of Research on Innovation, Competitiveness, and Science.
Note(s):
This figure depicts the occupation classification for each person's modal occupation transition before and after their reported graduation date in SED. Modal occupation classification means the occupation they had for the longest amount of time, not necessarily the one that appeared most often. The number that appears in the cross cell is the number of matches who experienced that transition in the modal occupation. For those who did not have records in UMETRICS after graduation, their modal occupation after graduation is recorded as "left institution." Note the dark blue cell with the number 9,774 in the image. This indicates that 9,774 of the matches had the pregraduation modal occupation of graduate student and the postgraduation modal occupation of left institution.
Source(s):
National Center for Science and Engineering Statistics, Survey of Earned Doctorates, AYs 2014–17; Institute for Research on Innovation and Science, UMETRICS, 2020 release data.
Filter 5: Removal of unlikely occupation transitions
AY = academic year; UMETRICS = Universities: Measuring the Impacts of Research on Innovation, Competitiveness, and Science.
Note(s):
Steps 3 through 6 were aggregated for disclosure purposes.
Source(s):
National Center for Science and Engineering Statistics, Survey of Earned Doctorates, AYs 2014–17; Institute for Research on Innovation and Science, UMETRICS, 2020 release data.
Robustness Checks
Each linkage step reduces the stringency of the matching criteria. Steps 3–4 include matches that do not match on the month of birth as long as the month of birth is missing in at least one data set; steps 5–6 do not require any date of birth information as long as the year of birth is missing in at least one data source. The reduction in stringency increases the likelihood of false positives: incorrectly identifying individuals as matched when they are not the same individual.
The false positive match rate is estimated by linking the entire sample using the step 3 and step 4 criteria but removing the requirement that month of birth had to be missing in one data set. A total of 41,795 matches were constructed, of which 41,485 had a month and year of birth in both data sets. For those who had the month and year of birth available, 8,946 had a different month or year of birth in one of the data sets. The expected accuracy loss was thus 21.56% for matches conducted during steps 3–4, compared with matches made during steps 1–2 before applying any filters. The application of the five filters resulted in 24,120 matches with the month and year of birth in both data set; 5,001 had a different month or year of birth in one of the data sets, resulting in an expected loss of accuracy of 20.73%.
The same approach was applied for steps 5–6 where linkages were not performed with any date of birth information (again removing the requirement that year of birth be missing in at least one data set). The expected accuracy loss was 32.16% for matches conducted during steps 5–6 before applying any filters. After the filters were applied, the expected accuracy loss was 23.31% (table 10).
Loss of accuracy in matching if date of birth information was available and was not taken into account
AY = academic year; UMETRICS = Universities: Measuring the Impacts of Research on Innovation, Competitiveness, and Science.
Source(s):
National Center for Science and Engineering Statistics, Survey of Earned Doctorates, AYs 2014–17; Institute for Research on Innovation and Science, UMETRICS, 2020 release data.
Linkages that were made using only the first given name and family name and not the full given name were examined. First, 41.61% of these linkages have a middle name recorded in either the SED or UMETRICS but not in both. This is like “Rhea Lynn Garner” matching with “Rhea Garner” from our example. These results, along with the by step break down, are provided in table 11.
Loss of accuracy in matching when there is name ambiguity
AY = academic year; UMETRICS = Universities: Measuring the Impacts of Research on Innovation, Competitiveness, and Science.
Note(s):
This table represents matches after applying the validation and filtering steps.
Source(s):
National Center for Science and Engineering Statistics, Survey of Earned Doctorates, AYs 2014–17; Institute for Research on Innovation and Science, UMETRICS, 2020 release data.
For the 3,046 linkages from steps 2, 4, and 6 where an individual had a middle name in both data sets, 98.92% of them had the same middle initial and 95.14% had the same middle initial and had a recorded middle name the same as their recorded middle initial. This is the same as “Rhea L Garner” having the reported middle name of “L” and matching with “Rhea Lynn Garner” from our example.
Although it is possible for a person to have three recorded given names, such as “Rhea Lynn Hatherill,” so the same person can show up with two different middle names or middle initials (i.e., “Rhea Lynn Garner” as recorded in the SED and “Rhea Hatherill Garner” as recorded in UMETRICS) and then link in steps 2, 4, and 6. However, such linkages were not common, accounting for only just over 3,000 individuals.
Common Names
Matched common names by matching step
AY = academic year; UMETRICS = Universities: Measuring the Impacts of Research on Innovation, Competitiveness, and Science.
Note(s):
Steps 3–6 were aggregated for disclosure reasons.
Source(s):
National Center for Science and Engineering Statistics, Survey of Earned Doctorates, AYs 2014–17; Institute for Research on Innovation and Science, UMETRICS, 2020 release data.
Match Rates by Field of Study, and Demographic Characteristics
The new linked SED-UMETRICS data product opens the door for researchers to examine the differences in research funding by gender, race, foreign-born status, and field of study. This section examines the possibility that linkage rates will differ for technical reasons due to the matching procedures that were used, which would affect the matching quality for certain subgroups. The match rate is defined as the proportion of SED doctoral graduates included for linking and that were matched to records in the UMETRICS. It does not find evidence of technical differences.
Match Rates by Sex
We found that overall the linkage rate for female doctorate graduates from the subset of SED was 7% less than the linkage rate for males. Two mechanisms can drive the difference in linkage rate. Women are funded at lower rates, or the matching process was biased. Using a name-matching algorithm may be less effective at matching women than men, because women may change their names upon marriage. This possible source of bias was explored to see whether it contributed to the gender match bias.
Name Changes
It is possible that sex differences in linkage rates could result from women changing their name when they get married. An examination of matching rates of married women vs. unmarried women relative to matching rates of married men vs. unmarried men indicated that was not the case (table 13). Married women had a lower linkage rate than unmarried women; however, married men and women had a lower linkage rate in general. Importantly, the difference in linkage rate between married and unmarried women is statistically less than the difference in the match rate for married and unmarried men. Thus, the difference in linkage rate by sex did not appear to be driven by a systematic error in the matching procedure that affects the ability to match women after they are married.
Match rates for married and nonmarried doctorate recipients, by sex
* p < 0.1; ** p < 0.05, *** p < 0.01.
AY = academic year; SED = Survey of Earned Doctorates; UMETRICS = Universities: Measuring the Impacts of Research on Innovation, Competitiveness, and Science.
Note(s):
This table represents matches after applying the validation and filtering steps. There are a few matches who did not have a reported gender in the SED, they were assigned the gender male for this analysis. The p values were calculated using the t-test. The match rate is defined as the proportion of SED doctorate recipients who were included for matching and who were matched to UMETRICS.
Source(s):
National Center for Science and Engineering Statistics, Survey of Earned Doctorates, AYs 2014–17; Institute for Research on Innovation and Science, UMETRICS, 2020 release data.
Field of Study
Because grant funding differs substantially by field, the sex difference in funding rates could be driven by differences in field of study. To better understand the funding differences, the linkage rates were compared by field (table 14). The linkage rates for women were lower than the linkage rates for men in three of the nine fields; the only higher linkage rate for women is in the fields not elsewhere classified category, which includes all fields except those in science, mathematics, health, and engineering.
Match rates for sex, by field
* p < 0.1; ** p < 0.05, *** p < 0.01.
AY = academic year; SED = Survey of Earned Doctorates; UMETRICS = Universities: Measuring the Impacts of Research on Innovation, Competitiveness, and Science.
Note(s):
This table represents matches after applying the five filtering steps. There are a few matches who did not have a reported gender in the SED, they were assigned the gender male for this analysis.
Source(s):
National Center for Science and Engineering Statistics, Survey of Earned Doctorates, AYs 2014–17; Institute for Research on Innovation and Science, UMETRICS, 2020 release data.
Linkage Rates by Race and Ethnicity
Substantial evidence shows that some ethnic name groups, such as East Asian names, are more difficult to disambiguate than others (Borgman and Siegfried 1992). This implies that disambiguation approaches might be improved if ethnic name groups are distinguished before disambiguation. In work exploring the potential of ethnic name partitioning by comparing performance of four machine learning algorithms trained and tested on the entire data or specifically on individual name groups, it has been shown that ethnicity-based name partitioning can substantially improve disambiguation performance because the individual models are better suited for their respective name group. The improvements occur across all ethnic name groups with different magnitudes (Kim, Kim, and Owen-Smith 2021).
Evidence also shows some substantial differences in overall linkage rate by race and ethnicity, as seen in table 15. However, one of the factors contributing to the lower linkage rate for Black or African American and Hispanic or Latino students is that they are selecting into fields that are less likely to receive grant funding. Physical and geosciences has the highest linkage rate of 56%, whereas social sciences has the lowest linkage rate of 18%. Black or African American individuals had the highest rate of attainment for a doctorate in social sciences (SED 2017: table 23)—which has the lowest linkage rate of the nine broad field categories (table 16).
Match rates, by race and ethnicity
AY = academic year; SED = Survey of Earned Doctorates; UMETRICS = Universities: Measuring the Impacts of Research on Innovation, Competitiveness, and Science.
Note(s):
Race and ethnicity are self-reported and comes from the SED; American Indian or Alaska Native and Native Hawaiian or Other Pacific Islander are very small categories (less than 10 individuals by type of funding); therefore, these groups are included in the other race or race not reported category. The match rate is defined as the proportion of SED doctorate recipients included for matching and were matched to UMETRICS.
Source(s):
National Center for Science and Engineering Statistics, Survey of Earned Doctorates, AYs 2014–17; Institute for Research on Innovation and Science, UMETRICS, 2020 release data.
Match rates, by race, ethnicity, and field
D = suppressed to avoid disclosure of confidential information.
AY = academic year; SED = Survey of Earned Doctorates; UMETRICS = Universities: Measuring the Impacts of Research on Innovation, Competitiveness, and Science.
Note(s):
Race and ethnicity are self-reported and comes from the SED; American Indian or Alaska Native and Native Hawaiian or Other Pacific Islander are very small categories (less than 10 individuals by type of funding); therefore, these groups are included in the other race or race not reported category. The match rate is defined as the proportion of SED doctorate recpients included for matching and were matched to UMETRICS.
Source(s):
National Center for Science and Engineering Statistics, Survey of Earned Doctorates, AYs 2014–17; Institute for Research on Innovation and Science, UMETRICS, 2020 release data.
Research Responses on the Survey of Earned Doctorates
An important part of the value of linking administrative and survey data is to shed additional light into the responses provided in surveys (Meyer, Mok, and Sullivan 2015). Meyer has used matched administrative and survey data to decompose total survey error into three components: generalized coverage error, item nonresponse error, and measurement error (Meyer and Mittag 2021). These studies found that although total survey error is large and varies in its size and composition, “measurement error is always by far the largest source of error.” The information found here suggests that is the case. As indicated in table 17a and table 17b, only 42% of SED graduates who reported receiving support through research assistantships match to the UMETRICS data.
The match rate is only slightly higher for those who report a research assistantship or traineeship as their primary source of support, ranging from 38% for academic year 2014 graduates to 51% for academic years 2016 and 2017 graduates, as reported in table 17b. Respondents may be funded from internal funds or from their home country, or it is possible that a research assistantship may not be the primary source of funding—however, it might be worth delving into the results more closely.
Match rates, by source of financial support reported in the SED
AY = academic year; IRIS = Institute for Research on Innovation and Science; SED = Survey of Earned Doctorates; UMETRICS = Universities: Measuring the Impacts of Research on Innovation, Competitiveness, and Science.
Note(s):
Other source of support includes source of support from an internship or clinical residency, other source of support, nonresponse. These items were combined to prevent disclosing information on fewer than 10 individuals. SED respondents could select more than one source of support.
Source(s):
National Center for Science and Engineering Statistics, Survey of Earned Doctorates, AYs 2014–17; Institute for Research on Innovation and Science, UMETRICS, 2020 release data.
Match rates, by primary source of financial support reported in the SED
AY = academic year; SED = Survey of Earned Doctorates; UMETRICS = Universities: Measuring the Impacts of Research on Innovation, Competitiveness, and Science.
Note(s):
The match rate is defined as the proportion of SED doctorate recipients included for matching and were matched to UMETRICS.
Source(s):
National Center for Science and Engineering Statistics, Survey of Earned Doctorates, AYs 2014–17; Institute for Research on Innovation and Science, UMETRICS, 2020 release data.
This section uses the rich UMETRICS administrative records to first uncover the degree to which there are differences between administrative records and survey responses. It then uses UMETRICS data to uncover whether the responses are affected by the intensity of the funding or by how recently the funding was received.
Table 18 shows that there were also reporting discrepancies in the other direction. About one in five who did not report receiving research assistantship as a source of support in the SED were reported by their institution as having received research funding.
Match rates, by reporting research assistantship
AY = academic year; SED = Survey of Earned Doctorates; UMETRICS = Universities: Measuring the Impacts of Research on Innovation, Competitiveness, and Science.
Note(s):
To calculate the match rate, the denominator is the number of people in the SED (for the 21 UMETRICS institutions) who reported or did not report receiving research funding for the given year.
Source(s):
National Center for Science and Engineering Statistics, Survey of Earned Doctorates, AYs 2014–17; Institute for Research on Innovation and Science, UMETRICS, 2020 release data.
Although there are high proportions of doctorate graduates from all fields of study who did not report receiving research assistantship as a source of support while they were paid on a research grant, the order of magnitude of the difference is substantial (table 19).
Match rates, by field of study and reporting research assistantship
AY = academic year; UMETRICS = Universities: Measuring the Impacts of Research on Innovation, Competitiveness, and Science.
Note(s):
The match rate is defined as the proportion of SED doctorate recipients included for matching and were matched to UMETRICS.
Source(s):
National Center for Science and Engineering Statistics, Survey of Earned Doctorates, AYs 2014–17; Institute for Research on Innovation and Science, UMETRICS, 2020 release data.
There is some indication that the differences are due to recall bias—a well known challenge with surveys. The longer a doctorate graduate was working on a grant, the more likely they are to report receiving research assistantship funding in the SED. Table 20 reports whether a student reported receiving research assistantship funding in the SED broken down by the duration of funding, which is the amount of time a graduate was actively working on one or more grants. Because we have only the month and year for graduation dates, a graduation date of the first of the month was imputed. This means if a graduate was actively working on a grant at the time of graduation, their duration could be underestimated, but never by more than a month.
Reporting research statesmanship among the matched cases, by duration of funding
AY = academic year; SED = Survey of Earned Doctorates; UMETRICS = Universities: Measuring the Impacts of Research on Innovation, Competitiveness, and Science.
Source(s):
National Center for Science and Engineering Statistics, Survey of Earned Doctorates, AYs 2014–17; Institute for Research on Innovation and Science, UMETRICS, 2020 release data.
The results show that the greater the amount of funding, the more likely the respondent was to report having received it.
Recall bias may also be affected by how recently a student received funding, which would be consistent with the findings in other comparisons of administrative data with survey data (Myers and Mittag, 2021). Table 21 reports whether a student reported receiving research funding broken down by the time between their reported graduation date in the SED and the last time they received grant funding. A graduation date of the first of the month was imputed, which means that the calculation of the time since each graduate last received research funding may be underestimated but by no more than a month.
The results show a marked decrease in the reporting of research support as the length of time increases.
Reporting research assistantship among the matched cases, by time of last research funding
AY = academic year; SED = Survey of Earned Doctorates; UMETRICS = Universities: Measuring the Impacts of Research on Innovation, Competitiveness, and Science.
Source(s):
National Center for Science and Engineering Statistics, Survey of Earned Doctorates, AYs 2014–17; Institute for Research on Innovation and Science, UMETRICS, 2020 release data.
Broader Implications
The core findings of this data linkage research have broader implications, which are listed below.
It is feasible to link the two data sets, even though differences exist in coverage of populations and time periods and they have different identifiers. The combination offers potential low cost and low burden solutions relative to survey data collection.
The linking implementation approach can inform other, similar efforts and can support the implementation of the Foundations for Evidence-Based Policymaking Act. Technical documentation has been a key part of the linkage research.
The approach, while initially time consuming, is replicable and can scale to additional years and data sets.
Measuring match quality when combining administrative and survey data requires defining both the relevant population to be matched (the denominator) and the match rate (the numerator). Those definitions will differ depending on the goal of the linkage. Future work should identify standard methodologies in the spirit of the response rate measures developed by AAPOR (2016).
Manual evaluation was not conducted for this study but should be considered because it would further the understanding of the quality of linkage results. The manual evaluation typically requires access to raw PII and eliminates the privacy preserving aspects of encrypting the identifiers. Consequently, it is essential to bring the two data sets together in a secure environment; alternative techniques such as secure multiparty computation and homomorphic encryption are unlikely to be successful.
Because linkage rates vary substantially by race, sex, and institution, particular care needs to be paid to ensure that match quality is maximized for key population subgroups.
The value of the linkage effort is considerable in terms of:
- Expanding understanding of responses to key questions in the SED, notably using grant funding to enrich understanding of reported sources of financial support for educational and living expenses while in graduate school; identifying possible sources of response error.
- Adding new measures reflecting the dynamics of respondent experiences. There are many possibilities, but this report highlights both the stability of research funding and the intensity of research funding.
There is substantial potential to engage researchers and the academic community to inform the match quality results, as well as to expand and enhance the value documented in this report.
Notes
1For security purposes, like with the data used for this report, personally identifiable information will be hashed.
2The questionnaire for the 2017 SED is available at the SED survey website at https://www.nsf.gov/statistics/srvydoctorates/surveys/srvydoctorates-2017.pdf.
3The NCSES restricted use data procedures guide is available at https://nsf.gov/statistics/license/forms/pdf/ncses_license_guide_august_2011.pdf.
4The IRIS membership and data transfer agreement is available at https://iris.isr.umich.edu/wp-content/uploads/2021/08/IRIS-New-Membership-and-DUA-v.-5.0-August-2021.pdf.
5Information on ADRF is available at https://coleridgeinitiative.org/administrative-data-research-facility.
6These data are deidentified using a hashing algorithm, and access is restricted to authorized and indemnified individuals.
7Brackets often appear when names with accents are converted from LaTeX documents.
8Nickname or maiden names are often included parenthetically.
9Each filter is flagged in the linked data, so analysts and researchers can choose which to apply.
10A total of 1,587 of the SED respondents, or 0.60% of the matched sample, did not report a start date.
References
American Academy of Arts and Sciences (AAAS). 2016. Public Research Universities. Recommitting to Lincoln’s Vision: An Educational Compact for the 21st Century. Washington, DC: American Academy of Arts and Sciences.
American Association for Public Opinion Research (AAPOR). 2016. Standard Definitions: Final Dispositions Of Case Codes and Outcome Rates For Surveys. Alexandria, VA: AAPOR.
American Association for the Advancement of Science (AAAS). 2018. Recommendations of the U.S. Commission on Evidence-Based Policymaking. Hart N, organizer. Scientific Session in the AAAS Annual Meeting. Austin, TX, 15–18 Feb.
Arbuckle L, Ritchie F. 2019. The Five Safes of Risk-Based Anonymization. IEEE Security & Privacy 17(5):84–9.
Borgman CL, Siegfried SL. 1992. Getty's Synoname™ and Its Cousins: A Survey of Applications of Personal Name‐Matching Algorithms. Journal of the American Society for Information Science 43(7):459–76.
Brown O. 2021. Scientific Data and the Evidence Act. Presentation at the Bureau of Economic Analysis, Suitland, MD. Available at https://www.bea.gov/system/files/2021-04/Brown-ACDEB-April-2020.pdf.
Chang, W.-Y., Cheng W, Lane J, Weinberg B. 2019. Federal Funding of Doctoral Recipients: What Can Be Learned from Linked Data. Research Policy 48(6):1487–92. Available at https://www.sciencedirect.com/science/article/abs/pii/S0048733319300629.
Chang W-Y, Maryah G, Basner J, Weinberg B, Owen-Smith J. 2022. A Linked Data Mosaic or Policy-Relevant Research on Science and Innovation: Value, Transparency, Rigor, and Community. Harvard Data Science Review 4(2). Available at https://hdsr.mitpress.mit.edu/pub/u073rjxs/release/2.
Coleridge Initiative. 2021. ADRF User Guide. Chevy Chase, MD: Coleridge Initiative.
Desai T, Ritchie F, Welpton R. 2016. Five Safes: Designing Data Access for Research. Economics Working Paper Series. University of the West of England. Available at https://www2.uwe.ac.uk/faculties/bbs/Documents/1601.pdf. Accessed 2023 April 6.
Fealing KH, Lane JI, Marburger III JH, Shipp SS, editors. 2011. The Science of Science Policy: A Handbook. Stanford, CA: Stanford University Press.
Ikudo A, Lane JI, Staudt J, Weinberg BA. 2020. Occupational Classifications: A Machine Learning Approach. Journal of Economic and Social Measurement 44(2–3)57–87.
Joshua T, Stefan B. 2020. Record Linkage, In Foster I, Ghani R, Jarmin RS, Kreuter F, Lane J, editors. Big Data and Social Science. pp. 43–65. New York: Chapman and Hall/CRC.
Kim J, Kim J, Owen‐Smith J. 2021. Ethnicity‐Based Name Partitioning for Author Name Disambiguation Using Supervised Machine Learning. Journal of the Association for Information Science and Technology 72(8)979–94.
Myers BD, Mittag N. 2021. An Empirical Total Survey Error Decomposition Using Data Combination. Journal of Econometrics 224(2):286–305.
National Academies of Sciences, Engineering, and Medicine (NASEM). 2016. Promising Practices for Strengthening the Regional STEM Workforce Development Ecosystem. Washington, DC: The National Academies Press.
National Academies of Sciences, Engineering, and Medicine (NASEM). 2018a. Envisioning the Data Science Discipline: The Undergraduate Perspective: Interim Report. Washington, DC: The National Academies Press.
National Academies of Sciences, Engineering, and Medicine (NASEM). 2018b. Measuring the 21st Century Science and Engineering Workforce Population: Evolving Needs. Washington, DC: The National Academies Press.
National Academies of Sciences, Engineering, and Medicine (NASEM). 2018c. The Next Generation of Biomedical and Behavioral Sciences Researchers: Breaking Through. Washington, DC: The National Academies Press.
National Research Council (NRC). (2014). Furthering America's Research Enterprise. Celeste RF, Griswold A, Straf ML, editors. Washington, DC: The National Academies Press.
National Science and Technology Council (NSTC). 2008. The Science of Science Policy: A Federal Research Roadmap. Washington, DC: Subcommittee on Social, Behavioral and Economic Sciences.
National Science Board (NSB). 2015. Revisiting the STEM Workforce: A Companion to Science and Engineering Indicators 2014. Arlington, VA: National Science Foundation. Available at https://nsf.gov/pubs/2015/nsb201510/nsb201510.pdf.
Nicholls N, Ku R, VanEseltine M, Owen-Smith J. 2020. Summary Documentation for the IRIS UMETRICS 2020 Data Release. Ann Arbor, MI: The Institute for Research on Innovation and Science.
Marburger III JH. 2005. Wanted: Better Benchmarks. Science 308(5725):1087–88.
Marburger III JH. 2011. Why Policy Implementation Needs a Science of Science Policy, In Fealing KH, Lane JI, Marburger III JH, Shipp SS, editors. The Science of Science Policy: A Handbook. pp. 9–22. Stanford, CA: Stanford University Press.
Meyer BD, Mittag N. 2021. An Empirical Total Survey Error Decomposition Using Data Combination. Journal of Econometrics 224(2):286–305.
Meyer BD, Mok WK, Sullivan JX. 2015. Household Surveys in Crisis. Journal of Economic Perspectives 29(4):199–226.
Reedy E, Teitelbaum MS, Litan RE. 2011. The Current State of Data on the Science and Engineering Workforce, Entrepreneurship, and Innovation in the United States, In Fealing KH, Lane JI, Marburger III JH, Shipp SS, editors. The Science of Science Policy: A Handbook. pp. 208–231. Stanford, CA: Stanford University Press.
Appendix
The Survey of Earned Doctorates (SED) collects information at the level of the individual campus, while UMETRICS (Universities: Measuring the Impacts of Research on Innovation, Competitiveness, and Science) is reported at the university level. The 21 universities represent 24 campuses, so a crosswalk to aggregate campuses up to the institution level was constructed.
Given the variation in UMETRICS data available, some of the doctoral graduates who are not matched, could have received grant funding before their institution started participating in UMETRICS. After narrowing in the pool of doctoral graduates in SED for whom we have full coverage from their institution at their reported graduation date 43% of these graduates are matched to UMETRICS. Institutions are considered to have full coverage if they are active in UMETRICS at their reported graduation date and have been active for at least three years before that.
Appendix tables
Suggested Citation
Garner M, Levitskaya E, Owen-Smith J, Lane J, Chang W-Y; National Center for Science and Engineering Statistics (NCSES). 2023. SED-UMETRICS Linkage Technical Report. Working Paper NCSES 23-215. Alexandria, VA: National Science Foundation. Available at http://ncses.nsf.gov/pubs/ncses23215/.
Contact Us
NCSES
National Center for Science and Engineering Statistics
Directorate for Social, Behavioral and Economic Sciences
National Science Foundation
2415 Eisenhower Avenue, Suite W14200
Alexandria, VA 22314
Tel: (703) 292-8780
FIRS: (800) 877-8339
TDD: (800) 281-8749
E-mail: ncsesweb@nsf.gov