


Overview
Ready access to accurate and timely state-level information is an important tool for formulating effective science and technology (S&T) policies at both the state and national levels. By studying the performance of their peers, state policymakers may be better able to assess their own programs and performance. In addition, data on variations in state S&T activities may alert national policymakers to variations in state and regional needs and circumstances. Corporations and other organizations considering investments at the state level may also benefit from this information. To address the interest of these communities in the role of S&T in state and regional economic development, the Science and Engineering Indicators State Indicators data tool presents findings on state trends in S&T education, the employed workforce, research and development (R&D), patents and publications, and knowledge- and technology-intensive industries.
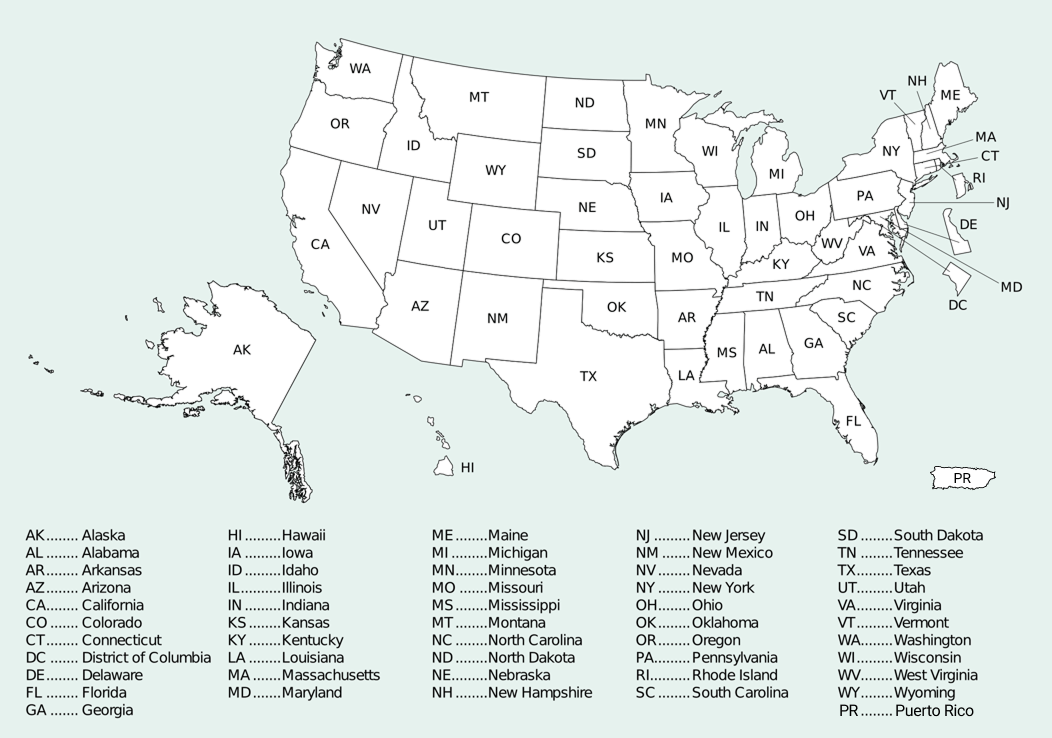
The State Indicators data tool includes over 50 principal indicators for the United States, individual states, the District of Columbia, and Puerto Rico (when available). Figure S-A below shows the geography of U.S. states and territories that are included in the State Indicators data tool. Certain indicators are also available by county. The data used to calculate the indicators are gathered from public and private sources. State Indicators are updated periodically, as new data become available.
Types of Indicators
The indicators are divided into six categories.
1. Elementary and Secondary Education
Indicators in this area cover two topics:
- Student achievement at elementary and secondary levels¹
- Persons with high school credentials
Student achievement is expressed in terms of performance, which refers to the average state score on a standardized test, and proficiency, which is expressed as the percentage of students who have achieved at least an expected level of competence on the test.
2. Higher Education
Indicators in this area cover three topics:
- Degrees awarded in science, engineering, and technology
- Persons with higher education credentials
- State and student resources supporting higher education
These indicators shed light on the higher education different states provide, the level of educational attainment in states’ populations, the cost of college attendance at the undergraduate level, and state support for public universities.
3. Workforce
Indicators in this area cover two topics:
- Higher education credentials of the workforce
- Science and engineering (S&E) workers in the labor force
Workforce indicators focus on the level of S&E training and on occupations of the employed labor force. These indicators reflect the higher education level of a state’s labor force, extent of S&E employment, and national origin of S&E workers.
4. Financial Research and Development Inputs
Indicators in this area cover two topics:
- Level of R&D performed by businesses, universities, and other performers
- Public-sector support for R&D activities
Financial indicators present the sources and level of funding for R&D. The indicators show how much R&D is being performed relative to the size of a state’s economy and workforce. They also present the extent to which R&D is conducted by industrial and academic performers.
5. Research and Development Outputs
Indicators in this area cover three topics:
- Human capital outputs
- Research-based outputs
- Trademarking activity
These indicators show the number of new doctorates conferred, the publication of academic articles, the level of patent activity from the academic community and from all sources in the state (also available by county), and Patent and Trademark Office trademarks registered (also available by county). Outputs are measured relative to states’ S&E workforces, academic workforces, population, and financial R&D inputs.
6. Science and Technology in the Economy
Indicators in this area cover two topics:
- Business activity in industries with high employment in knowledge- and technology-intensive fields
- Early-stage, high-risk capital investments
These indicators include venture capital activity, Small Business Innovation Research awards and Small Business Technology Transfer awards, and business activity in industries with high employment in knowledge- and technology-intensive fields.
Unlike the main Science and Engineering Indicators analyses, the State Indicators data tool presents indicators individually. Indicators are normalized to enable comparisons among states of different sizes, but indicators are presented discretely rather than in a form that describes the relationships among them. Because these indicators span a broad range of topics across the entire S&E landscape—inputs and outputs, people and dollars, businesses and universities, R&D and education—a validated model synthesizing interrelationships among these specific indicators does not exist. Moreover, states are both heterogeneous, with hubs of intense S&E activity alongside areas without substantial S&E infrastructure, and porous, with limited control over movements of people and funds across state borders. Consequently, other regions that form more tightly coupled economic systems or that create stronger barriers to movement may be preferred by some researchers as units of analysis for studying geographic variation in S&E activity.
Nonetheless, state governments and other state-based actors have significant leverage and can affect S&T-related economic development in their states and regions. The data in the State Indicators data tool offer ample opportunities for exploratory analysis of variations among states and the interplay of education, R&D, and economic activity. The State Indicators data tool enables users to examine the relationships among the different indicators.
Some examples of issues that could be explored with the current set of indicators include the following:
- What is the relationship between K–12 student achievement and the S&E workforce within a state?
- How do state commitments of resources for higher education relate to R&D performance?
- Do states whose universities provide advanced S&E training to large numbers of students have correspondingly large segments of their workforces in S&E occupations?
- How do indicators of educational attainment within a state’s population relate to R&D performance and high-technology business activity?
- What state characteristics are associated with relatively high investments of tax dollars in S&E?
- Are states whose universities produce more articles and patents also involved in more high-technology business activity?
The data in the State Indicators data tool cannot be expected to provide definitive answers to any of these questions. Additional data, well-defined models, and more refined geographical comparisons will be required as social scientists grapple with these complex relationships. But exploring relationships in the existing data via the State Indicators data tool can stimulate policymakers and other stakeholders to think more broadly and deeply about the possible implications of strategies used to address state-level S&E policy topics.
The State Indicators data tool offers users the following capabilities:
- Long-term trend data on each indicator are available for review and download, giving users the option to combine data from existing indicators to produce new indicators. Visualizations of the trend data—such as quartile maps, histograms, and charts—are also available for state-level indicators.
- Standard errors for each indicator, with sample-based data, are available for download where standard error data were available from the data source.
- Financial information can be converted from current into inflation-adjusted dollars.
Data Sources and Considerations
Within the State Indicators data tool, the data tables present the values for the components that make up each indicator. Each table provides a national total, labeled “United States.” A few indicators have data that could not be assigned to a specific state but are included in the U.S. total. In addition, some national totals include data for U.S. territories where available. In other indicators, data may not be available at the state level, because of confidentiality reasons, but they are included in the total. Users are cautioned that due to these factors, the national totals may not match a mathematical sum of the displayed values.
The values for most indicators are expressed as ratios or percentages to facilitate comparison between states that differ substantially in size. For example, an indicator of higher education achievement is not defined as the absolute number of degrees conferred in a state because less populous states are unlikely to have or need as extensive a higher education system as states with larger populations. Instead, the indicator is defined as the number of degrees per number of residents in the college-age cohort, which measures the intensity of educational attainment relative to the size of the resident population.
Although data for Puerto Rico are reported whenever available, they were sometimes collected by a different source, making it unclear whether the methodology used for data collection and analysis is comparable to that used for the states. In those cases, comparisons should be made with caution. Data for U.S. territories and protectorates—such as American Samoa, Guam, Northern Mariana Islands, and U.S. Virgin Islands—are included in the U.S. total where available but are not reported separately.
Users must exercise caution when evaluating the indicator values for the District of Columbia. Frequently, the indicator value for the District of Columbia is appreciably different from the indicator values for any of the states. The District of Columbia is unique because it is an urban region with a large federal presence and many universities. In addition, it has a large student population and provides employment for many individuals who live in neighboring states. Indicator values can be quite different depending on whether data attributed to the District of Columbia are based on where people live or where they work.
Key Elements for Indicators
Data, text, and visual elements are presented in the tool for each indicator. The data table view presents the data back to 1990, if available, for each state, the District of Columbia, and Puerto Rico.
The indicator text presents a description of the data series used to develop each indicator and includes information pertaining to the underlying data and source. Some indicators are also accompanied by a Quick Tip that is intended to help users understand unique qualities of the data.
The map view provides a geographic view of the indicator for the selected year of data. The map is color coded to show the quartile in which each state placed on that indicator. This visualization helps the user quickly grasp geographic patterns. On the indicator maps, the darkest color indicates states that rank in the first or highest quartile, and the lightest color indicates states that rank in the fourth or lowest quartile. Gray indicates states for which no data are available. The values of the indicators may be viewed on the state map by placing the cursor over the state. All the indicators are broad measures, and several rely on sample estimates that have a margin of error. Small differences between state values generally carry little useful information.
For county-level indicators, quartiles are determined for a given year after excluding any counties and county equivalents that either have no data available or have a value of 0 for the given year. As in the state-level maps, the darkest color in the county-level maps indicates counties that rank in the first or highest quartile, and gray indicates counties for which no data are available. The lightest color indicates counties with a data value of 0, and the second-lightest color indicates counties in the fourth or lowest quartile.
The charts view is a representation of each indicator over the years for all states. These mini graphs show the trend over time for each state alongside the United States trend. The charts are presented in relative geographic distribution. This order can be re-sorted alphabetically by state abbreviation or by highest value for the most recent year of data.
The bar chart view presents a state distribution of each indicator for the selected year of data. States are listed in ascending order according to the indicator value, with the state with the highest value at the right. State quartile ranks are indicated by the same coloring pattern used in the map view. The national average for the indicator is shown in a dashed horizontal line for reference.
For indicators derived from sample-based data, the number of states with statistically significant differences will be different than a simple analysis of the data. Standard error data for such indicators are available for download where standard error data were available from the data source.
Users can view the indicators containing financial information in inflation-adjusted dollars by checking the tick mark labeled “Adjust values for inflation.” The inflation-adjustment feature is not added to ratios or percentages where both numerator and denominator are expressed in dollar units.
Historical data from the June 2021 version of State Indicators to present is available for download in the Export Data page. Users can select the data release version from the drop-down menu underneath the Downloads header. Once the data release version is selected, the full description and figures, data tables, and standard error tables (if applicable) for that version of the indicators will become available for download. The archive will be updated with every new version of data release. For many indicators, the data source releases revisions to historical data. This leads to revisions of prior years of data for affected indicators beyond the years of new data added to an indicator in a given data update. For this reason, it is recommended that indicator data should not be compared between different data versions exported from the data archive.
Figure S-A
U.S. map and list of abbreviations
Acknowledgements
Michael Lee, Emma Rose, Richard Campo, Rayshon Knight, and Claire Lecornu from SRI, under direction from the National Center for Science and Engineering Statistics (NCSES), led the data collection process. The following individuals also provided data review and quality assurance:
- Luc Olivier
- Sofia Hutton
- Mary Beth Kelly
- Rayelene Covelle
- Nathan Harsono
The current version of State Indicators was developed by the data team at Alley, under direction from NCSES:
- David Herrera
- Eric Fuller
- John Ragozzine
- Julio Braña
- Kaitlin Bolling
- Kevin Fodness
- Matt Nadolny
- Scott Nellé
Additional Alley team members provided quality assurance and code review support.
This project was supported by the following individuals at NCSES:
- Marie Rush
- Benjamin Schneider
- Tiffany Julian
- Derek Hill
Notes
¹ The indicators provide data on fourth grade and eighth grade science and mathematics performance and proficiency.