 An official website of the United States government
 Academic R&D in the U.S. R&D Enterprise
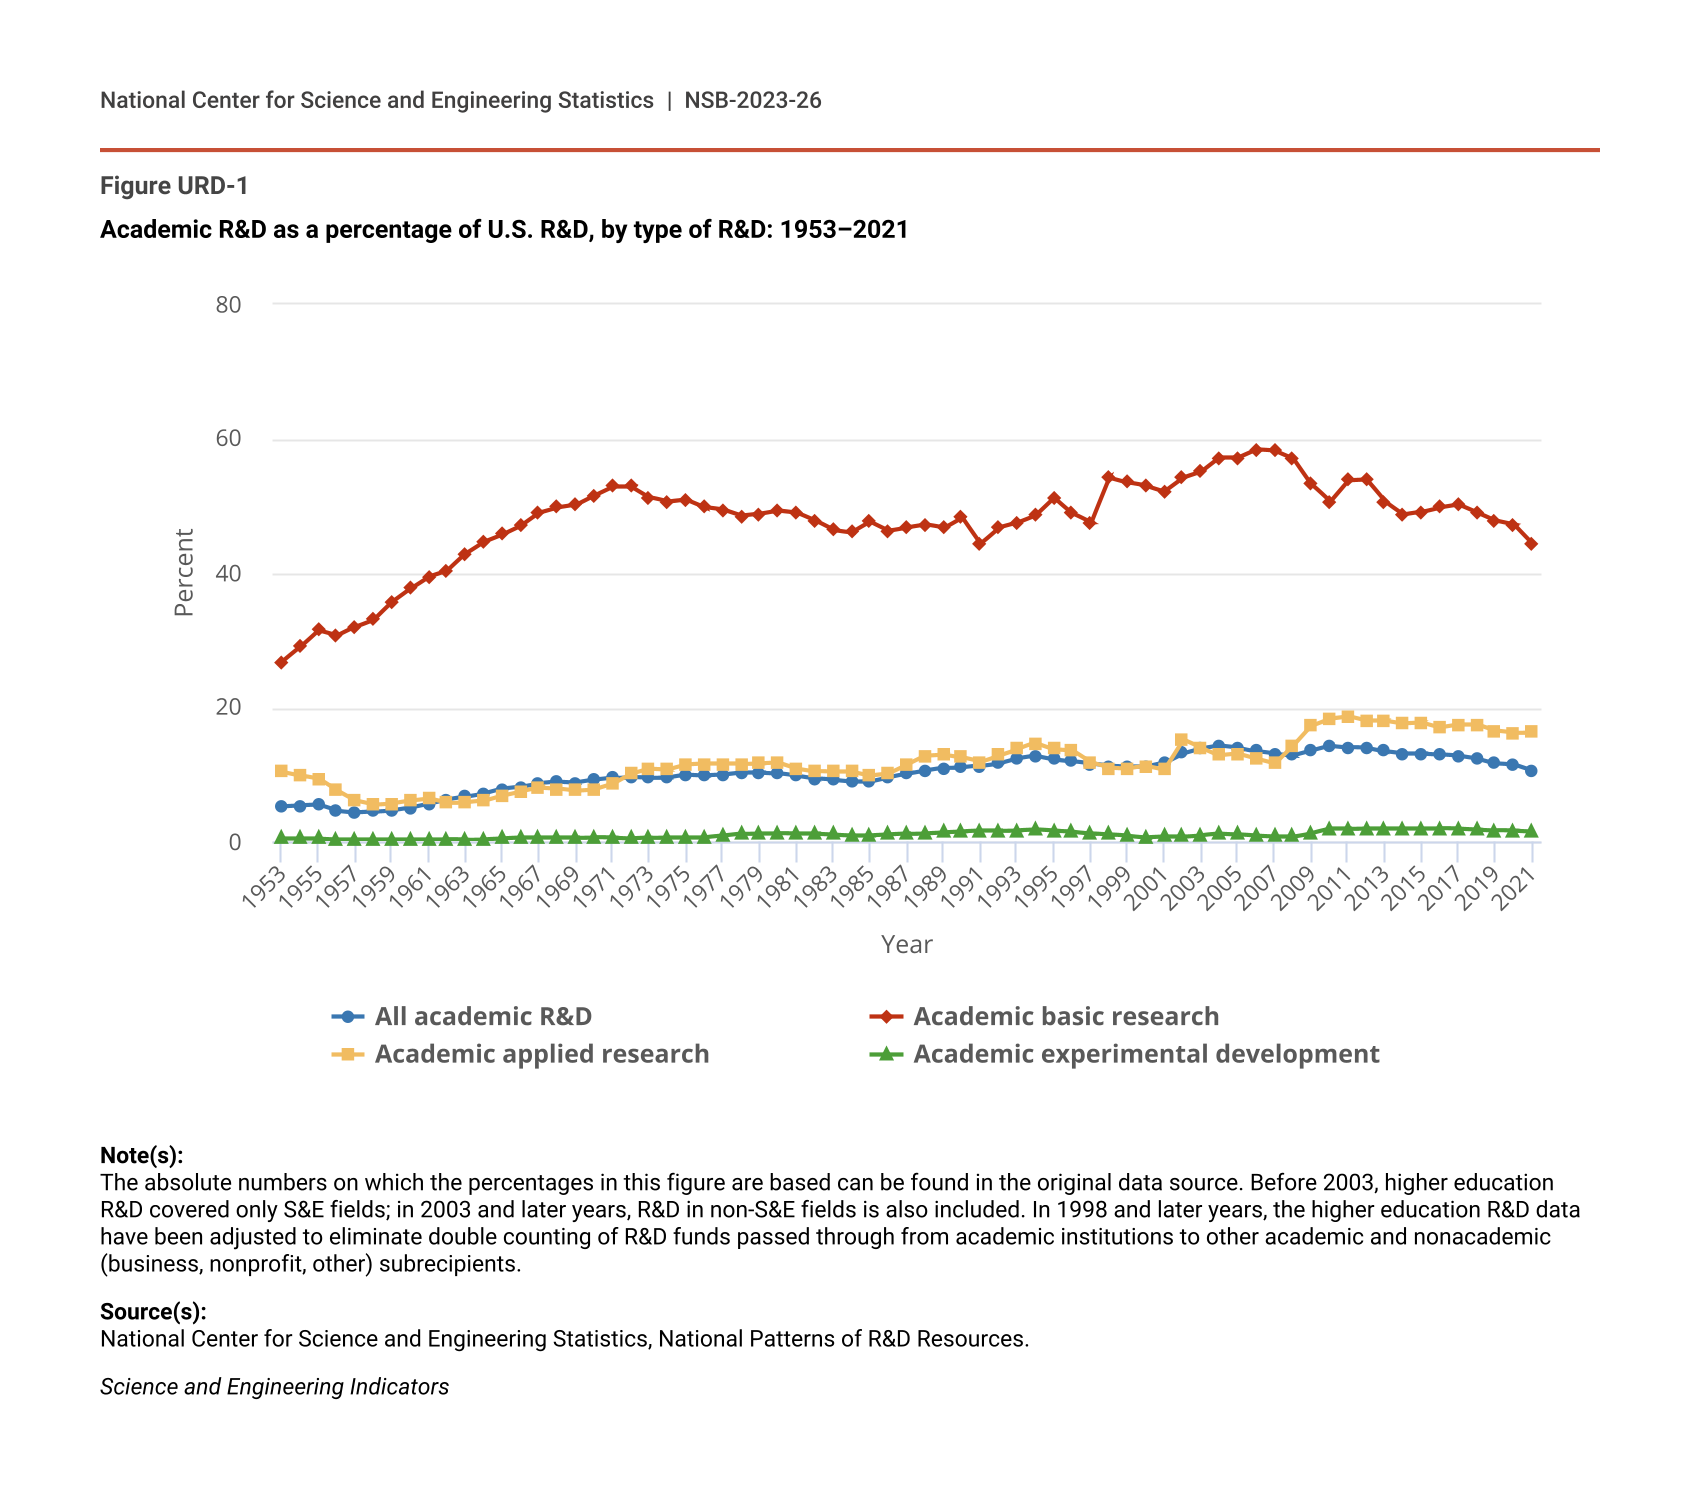
In the years during and after World War II, the federal government recognized that university-based research contributed directly to societal priorities such as defense and health and devoted more resources to support that work (Nichols 1993). Federal investments in academic R&D contributed to a rapid growth in the share of U.S. R&D performed in higher education, which nearly doubled between 1953 and 1979. Academia’s share of U.S. R&D began trending upward again in 1986, exceeding 14% in 2004 (NCSES NP 2021: Table 2). Although the amount of academic R&D rose after 2004, it represented 11% of national R&D spending in 2021, continuing a decline in share that began in 2010 (Figure URD-1).
Academic R&D as a percentage of U.S. R&D, by type of R&D: 1953–2021
| Year | All academic R&D | Academic basic research | Academic applied research | Academic experimental development |
|---|---|---|---|---|
| 1953 | 5.3 | 26.8 | 10.4 | 0.5 |
| 1954 | 5.4 | 29.0 | 9.9 | 0.5 |
| 1955 | 5.5 | 31.5 | 9.4 | 0.5 |
| 1956 | 4.6 | 30.7 | 7.6 | 0.4 |
| 1957 | 4.4 | 32.0 | 6.1 | 0.4 |
| 1958 | 4.5 | 33.1 | 5.5 | 0.4 |
| 1959 | 4.7 | 35.7 | 5.7 | 0.4 |
| 1960 | 5.1 | 37.7 | 6.1 | 0.4 |
| 1961 | 5.7 | 39.5 | 6.4 | 0.4 |
| 1962 | 6.3 | 40.4 | 5.8 | 0.4 |
| 1963 | 6.7 | 42.9 | 5.9 | 0.3 |
| 1964 | 7.2 | 44.7 | 6.1 | 0.4 |
| 1965 | 7.9 | 45.8 | 6.9 | 0.5 |
| 1966 | 8.2 | 47.1 | 7.5 | 0.6 |
| 1967 | 8.7 | 49.0 | 8.0 | 0.6 |
| 1968 | 8.9 | 49.8 | 7.9 | 0.6 |
| 1969 | 8.8 | 50.2 | 7.6 | 0.6 |
| 1970 | 9.2 | 51.6 | 7.8 | 0.7 |
| 1971 | 9.5 | 52.9 | 8.6 | 0.6 |
| 1972 | 9.6 | 52.9 | 10.1 | 0.5 |
| 1973 | 9.5 | 51.3 | 10.9 | 0.6 |
| 1974 | 9.6 | 50.6 | 10.8 | 0.7 |
| 1975 | 10.0 | 50.9 | 11.5 | 0.7 |
| 1976 | 9.9 | 49.8 | 11.6 | 0.7 |
| 1977 | 10.0 | 49.4 | 11.6 | 0.9 |
| 1978 | 10.3 | 48.5 | 11.6 | 1.2 |
| 1979 | 10.3 | 48.8 | 11.7 | 1.3 |
| 1980 | 10.2 | 49.3 | 11.8 | 1.3 |
| 1981 | 9.8 | 49.0 | 10.9 | 1.2 |
| 1982 | 9.4 | 47.8 | 10.5 | 1.2 |
| 1983 | 9.2 | 46.4 | 10.4 | 1.1 |
| 1984 | 9.0 | 46.1 | 10.4 | 1.0 |
| 1985 | 9.0 | 47.6 | 9.9 | 1.0 |
| 1986 | 9.6 | 46.3 | 10.2 | 1.1 |
| 1987 | 10.1 | 46.8 | 11.5 | 1.2 |
| 1988 | 10.6 | 47.2 | 12.8 | 1.3 |
| 1989 | 11.0 | 46.7 | 13.0 | 1.4 |
| 1990 | 11.1 | 48.3 | 12.6 | 1.5 |
| 1991 | 11.3 | 44.4 | 11.9 | 1.6 |
| 1992 | 11.7 | 46.8 | 12.9 | 1.6 |
| 1993 | 12.4 | 47.5 | 13.8 | 1.7 |
| 1994 | 12.8 | 48.6 | 14.7 | 1.8 |
| 1995 | 12.3 | 51.2 | 13.8 | 1.6 |
| 1996 | 12.0 | 48.9 | 13.6 | 1.5 |
| 1997 | 11.6 | 47.5 | 11.8 | 1.3 |
| 1998 | 11.3 | 54.2 | 11.0 | 1.1 |
| 1999 | 11.2 | 53.5 | 10.9 | 0.9 |
| 2000 | 11.2 | 53.0 | 11.3 | 0.7 |
| 2001 | 11.8 | 52.2 | 10.8 | 0.8 |
| 2002 | 13.2 | 54.2 | 15.2 | 0.8 |
| 2003 | 13.9 | 55.1 | 14.0 | 1.0 |
| 2004 | 14.3 | 57.2 | 12.9 | 1.2 |
| 2005 | 14.0 | 57.2 | 13.1 | 1.1 |
| 2006 | 13.5 | 58.4 | 12.4 | 0.9 |
| 2007 | 13.1 | 58.2 | 11.7 | 0.8 |
| 2008 | 12.9 | 57.1 | 14.3 | 0.8 |
| 2009 | 13.6 | 53.2 | 17.3 | 1.3 |
| 2010 | 14.3 | 50.6 | 18.4 | 1.9 |
| 2011 | 14.1 | 53.8 | 18.7 | 1.9 |
| 2012 | 14.0 | 53.9 | 18.0 | 2.0 |
| 2013 | 13.5 | 50.6 | 18.0 | 2.0 |
| 2014 | 13.1 | 48.7 | 17.6 | 2.0 |
| 2015 | 13.1 | 49.1 | 17.7 | 2.0 |
| 2016 | 13.0 | 49.8 | 17.0 | 2.0 |
| 2017 | 12.8 | 50.2 | 17.4 | 1.9 |
| 2018 | 12.4 | 49.0 | 17.4 | 1.8 |
| 2019 | 11.7 | 47.8 | 16.5 | 1.7 |
| 2020 | 11.5 | 47.2 | 16.2 | 1.6 |
| 2021 | 10.6 | 44.4 | 16.3 | 1.5 |
Note(s):
The absolute numbers on which the percentages in this figure are based can be found in the original data source. Before 2003, higher education R&D covered only S&E fields; in 2003 and later years, R&D in non-S&E fields is also included. In 1998 and later years, the higher education R&D data have been adjusted to eliminate double counting of R&D funds passed through from academic institutions to other academic and nonacademic (business, nonprofit, other) subrecipients.
Source(s):
National Center for Science and Engineering Statistics, National Patterns of R&D Resources.
Science and Engineering Indicators
R&D conducted in academia is concentrated on basic research (experimental or theoretical work undertaken primarily to acquire new knowledge of the underlying foundations of phenomena and observable facts, without any particular application or use in view) rather than on applied research (original investigation undertaken to acquire new knowledge but directed primarily toward a specific, practical aim or objective) or experimental development (systematic work, drawing on knowledge gained from research and practical experience and producing additional knowledge, which is directed to producing new products or processes or to improving existing products or processes). Consequently, R&D at higher education institutions contributes primarily to total U.S. basic research. From 1972 to 2011, the share of U.S. basic research performed by academia fluctuated between 44% and 58%. This share has declined in recent years, from 54% in 2012 to 44% in 2021. In contrast, academic R&D accounted for 16% of U.S. applied research performed in 2021, down from a peak of 19% in 2011. Historically, academia has accounted for 2% or less of U.S. experimental development (Figure URD-1).
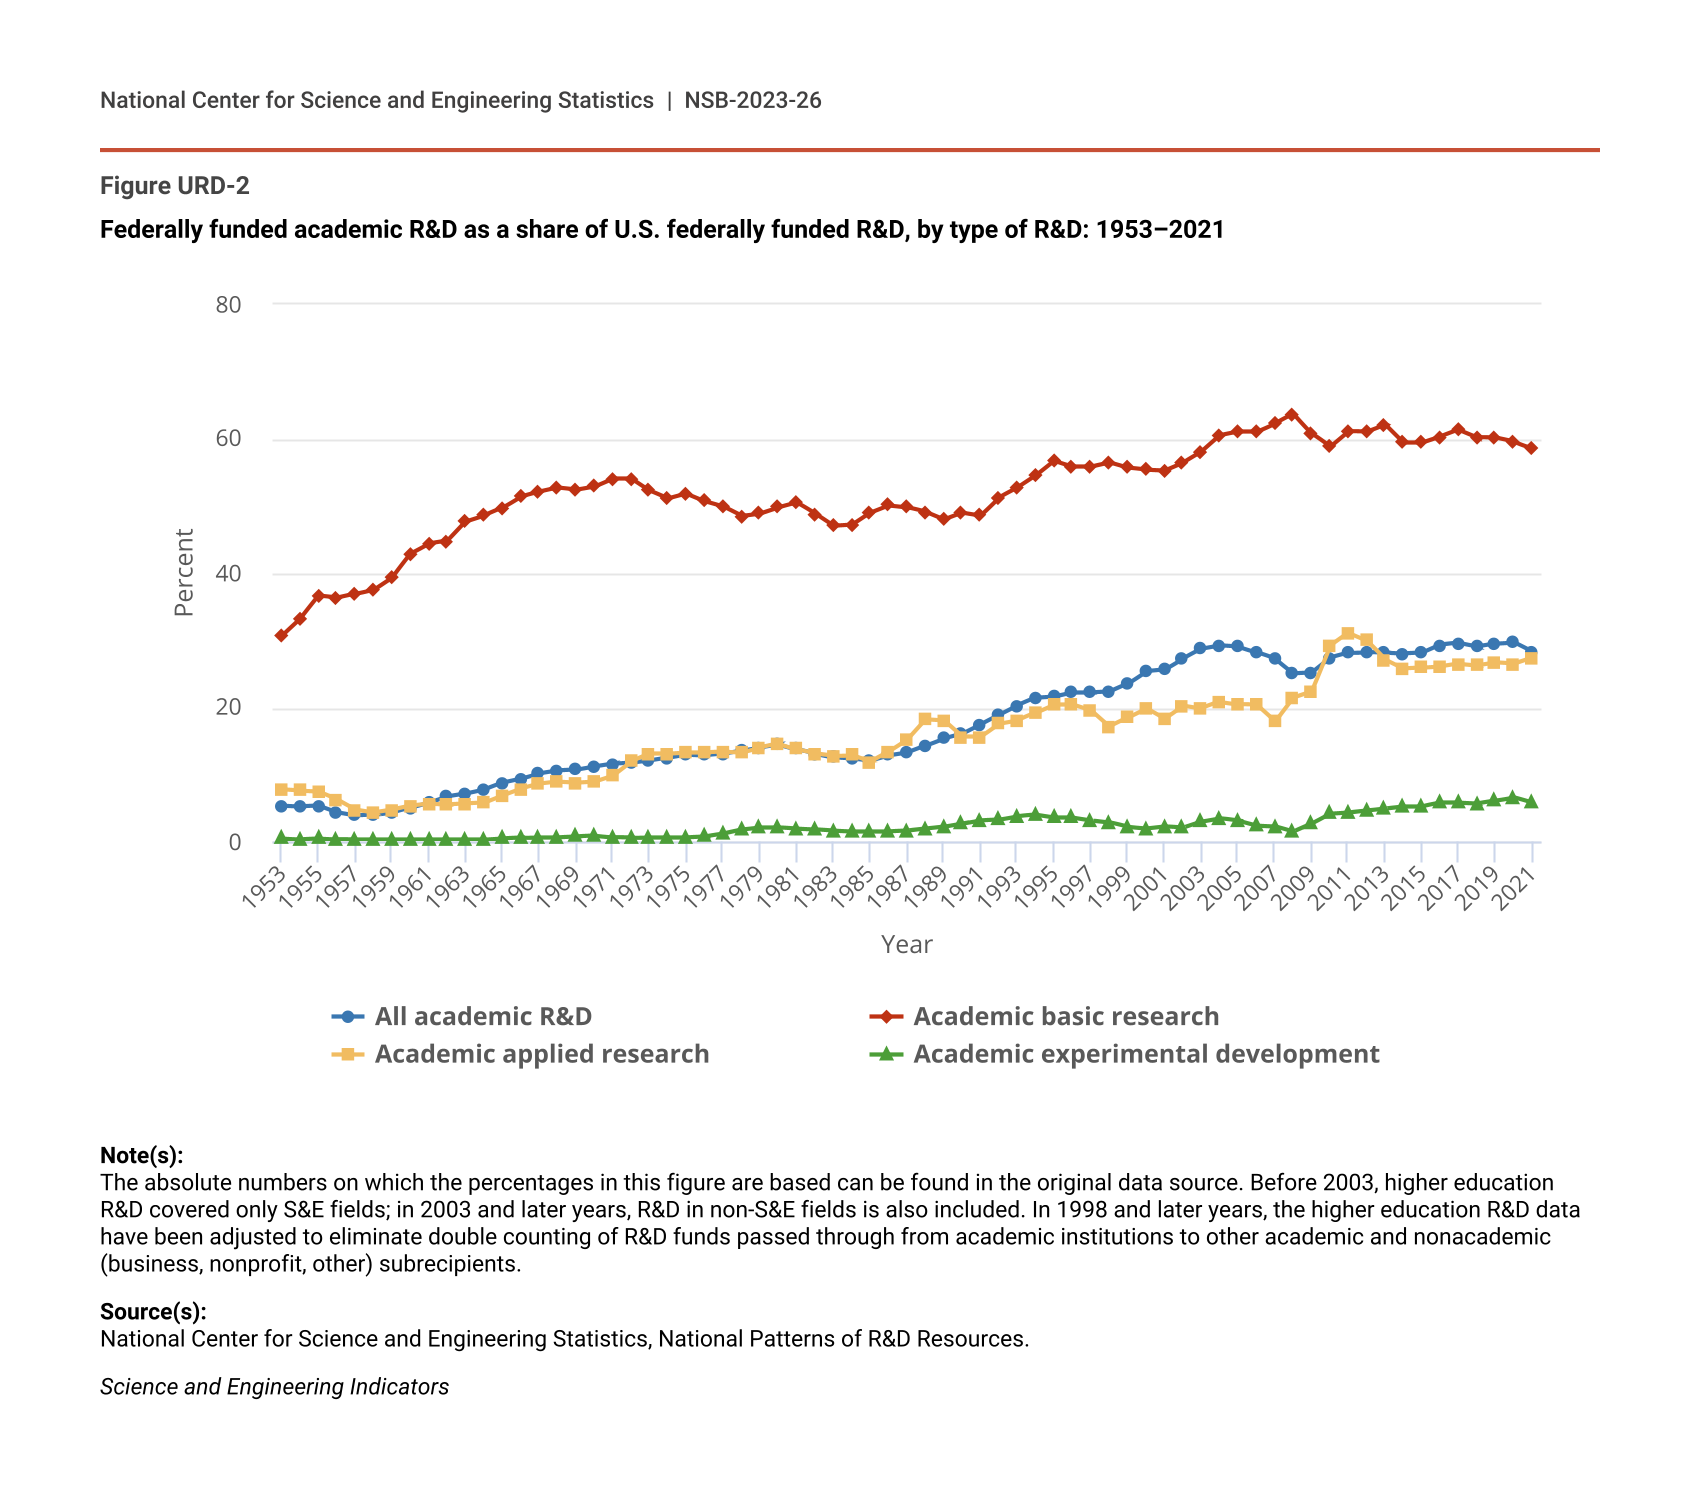
In 2021, U.S. academic R&D constituted a greater share of U.S. R&D funded by the federal government—about 28%—than its 11% share of overall national R&D (Figure URD-1 and Figure URD-2). In 2021, academia accounted for nearly 60% of federal funding for basic research, 27% for applied research, and nearly 6% for experimental development (NCSES NP 2021: Table 7, Table 8, and Table 9).
Federally funded academic R&D as a share of U.S. federally funded R&D, by type of R&D: 1953–2021
| Year | All academic R&D | Academic basic research | Academic applied research | Academic experimental development |
|---|---|---|---|---|
| 1953 | 5.4 | 30.7 | 7.8 | 0.5 |
| 1954 | 5.3 | 33.2 | 7.6 | 0.4 |
| 1955 | 5.4 | 36.6 | 7.5 | 0.5 |
| 1956 | 4.4 | 36.3 | 6.3 | 0.4 |
| 1957 | 3.9 | 36.9 | 4.8 | 0.3 |
| 1958 | 4.0 | 37.6 | 4.4 | 0.3 |
| 1959 | 4.4 | 39.4 | 4.8 | 0.3 |
| 1960 | 5.1 | 42.9 | 5.4 | 0.3 |
| 1961 | 5.9 | 44.4 | 5.7 | 0.3 |
| 1962 | 6.8 | 44.8 | 5.6 | 0.3 |
| 1963 | 7.2 | 47.7 | 5.7 | 0.3 |
| 1964 | 7.8 | 48.6 | 5.8 | 0.3 |
| 1965 | 8.8 | 49.7 | 6.9 | 0.5 |
| 1966 | 9.4 | 51.4 | 7.9 | 0.6 |
| 1967 | 10.2 | 52.1 | 8.6 | 0.7 |
| 1968 | 10.6 | 52.7 | 8.9 | 0.7 |
| 1969 | 10.7 | 52.4 | 8.8 | 0.8 |
| 1970 | 11.2 | 52.9 | 9.0 | 0.9 |
| 1971 | 11.6 | 54.1 | 9.9 | 0.7 |
| 1972 | 11.8 | 54.1 | 12.0 | 0.6 |
| 1973 | 12.1 | 52.3 | 13.1 | 0.7 |
| 1974 | 12.5 | 51.1 | 13.1 | 0.7 |
| 1975 | 13.0 | 51.8 | 13.3 | 0.7 |
| 1976 | 12.9 | 50.7 | 13.3 | 0.8 |
| 1977 | 13.1 | 49.9 | 13.4 | 1.2 |
| 1978 | 13.6 | 48.5 | 13.3 | 1.8 |
| 1979 | 14.1 | 48.9 | 14.1 | 2.1 |
| 1980 | 14.5 | 49.8 | 14.6 | 2.1 |
| 1981 | 13.8 | 50.5 | 13.8 | 1.9 |
| 1982 | 13.1 | 48.8 | 13.1 | 1.8 |
| 1983 | 12.6 | 47.0 | 12.8 | 1.6 |
| 1984 | 12.4 | 47.2 | 12.9 | 1.5 |
| 1985 | 12.1 | 49.0 | 11.9 | 1.5 |
| 1986 | 12.9 | 50.1 | 13.4 | 1.5 |
| 1987 | 13.3 | 49.8 | 15.2 | 1.6 |
| 1988 | 14.3 | 49.1 | 18.2 | 1.9 |
| 1989 | 15.4 | 48.0 | 18.0 | 2.2 |
| 1990 | 16.1 | 49.0 | 15.6 | 2.7 |
| 1991 | 17.5 | 48.6 | 15.6 | 3.2 |
| 1992 | 18.9 | 51.3 | 17.6 | 3.3 |
| 1993 | 20.3 | 52.7 | 18.1 | 3.8 |
| 1994 | 21.4 | 54.5 | 19.2 | 4.0 |
| 1995 | 21.6 | 56.7 | 20.5 | 3.6 |
| 1996 | 22.2 | 55.9 | 20.5 | 3.6 |
| 1997 | 22.2 | 55.9 | 19.6 | 3.2 |
| 1998 | 22.3 | 56.5 | 17.2 | 2.9 |
| 1999 | 23.5 | 55.7 | 18.5 | 2.2 |
| 2000 | 25.4 | 55.4 | 19.9 | 2.0 |
| 2001 | 25.6 | 55.3 | 18.3 | 2.3 |
| 2002 | 27.3 | 56.5 | 20.3 | 2.1 |
| 2003 | 28.7 | 58.1 | 19.9 | 3.0 |
| 2004 | 29.2 | 60.5 | 20.8 | 3.5 |
| 2005 | 29.0 | 61.0 | 20.5 | 3.1 |
| 2006 | 28.2 | 61.0 | 20.4 | 2.4 |
| 2007 | 27.2 | 62.3 | 17.9 | 2.3 |
| 2008 | 25.1 | 63.7 | 21.5 | 1.5 |
| 2009 | 25.2 | 60.8 | 22.4 | 2.7 |
| 2010 | 27.4 | 58.8 | 29.2 | 4.2 |
| 2011 | 28.1 | 61.1 | 31.1 | 4.4 |
| 2012 | 28.2 | 61.0 | 30.0 | 4.7 |
| 2013 | 28.1 | 62.1 | 27.1 | 5.0 |
| 2014 | 28.0 | 59.4 | 25.8 | 5.3 |
| 2015 | 28.1 | 59.4 | 25.9 | 5.3 |
| 2016 | 29.3 | 60.3 | 26.1 | 5.8 |
| 2017 | 29.6 | 61.3 | 26.5 | 5.8 |
| 2018 | 29.1 | 60.2 | 26.3 | 5.7 |
| 2019 | 29.5 | 60.1 | 26.7 | 6.1 |
| 2020 | 29.7 | 59.5 | 26.5 | 6.6 |
| 2021 | 28.3 | 58.6 | 27.4 | 5.8 |
Note(s):
The absolute numbers on which the percentages in this figure are based can be found in the original data source. Before 2003, higher education R&D covered only S&E fields; in 2003 and later years, R&D in non-S&E fields is also included. In 1998 and later years, the higher education R&D data have been adjusted to eliminate double counting of R&D funds passed through from academic institutions to other academic and nonacademic (business, nonprofit, other) subrecipients.
Source(s):
National Center for Science and Engineering Statistics, National Patterns of R&D Resources.
Science and Engineering Indicators