 An official website of the United States government
 Funding Sources of Academic R&D
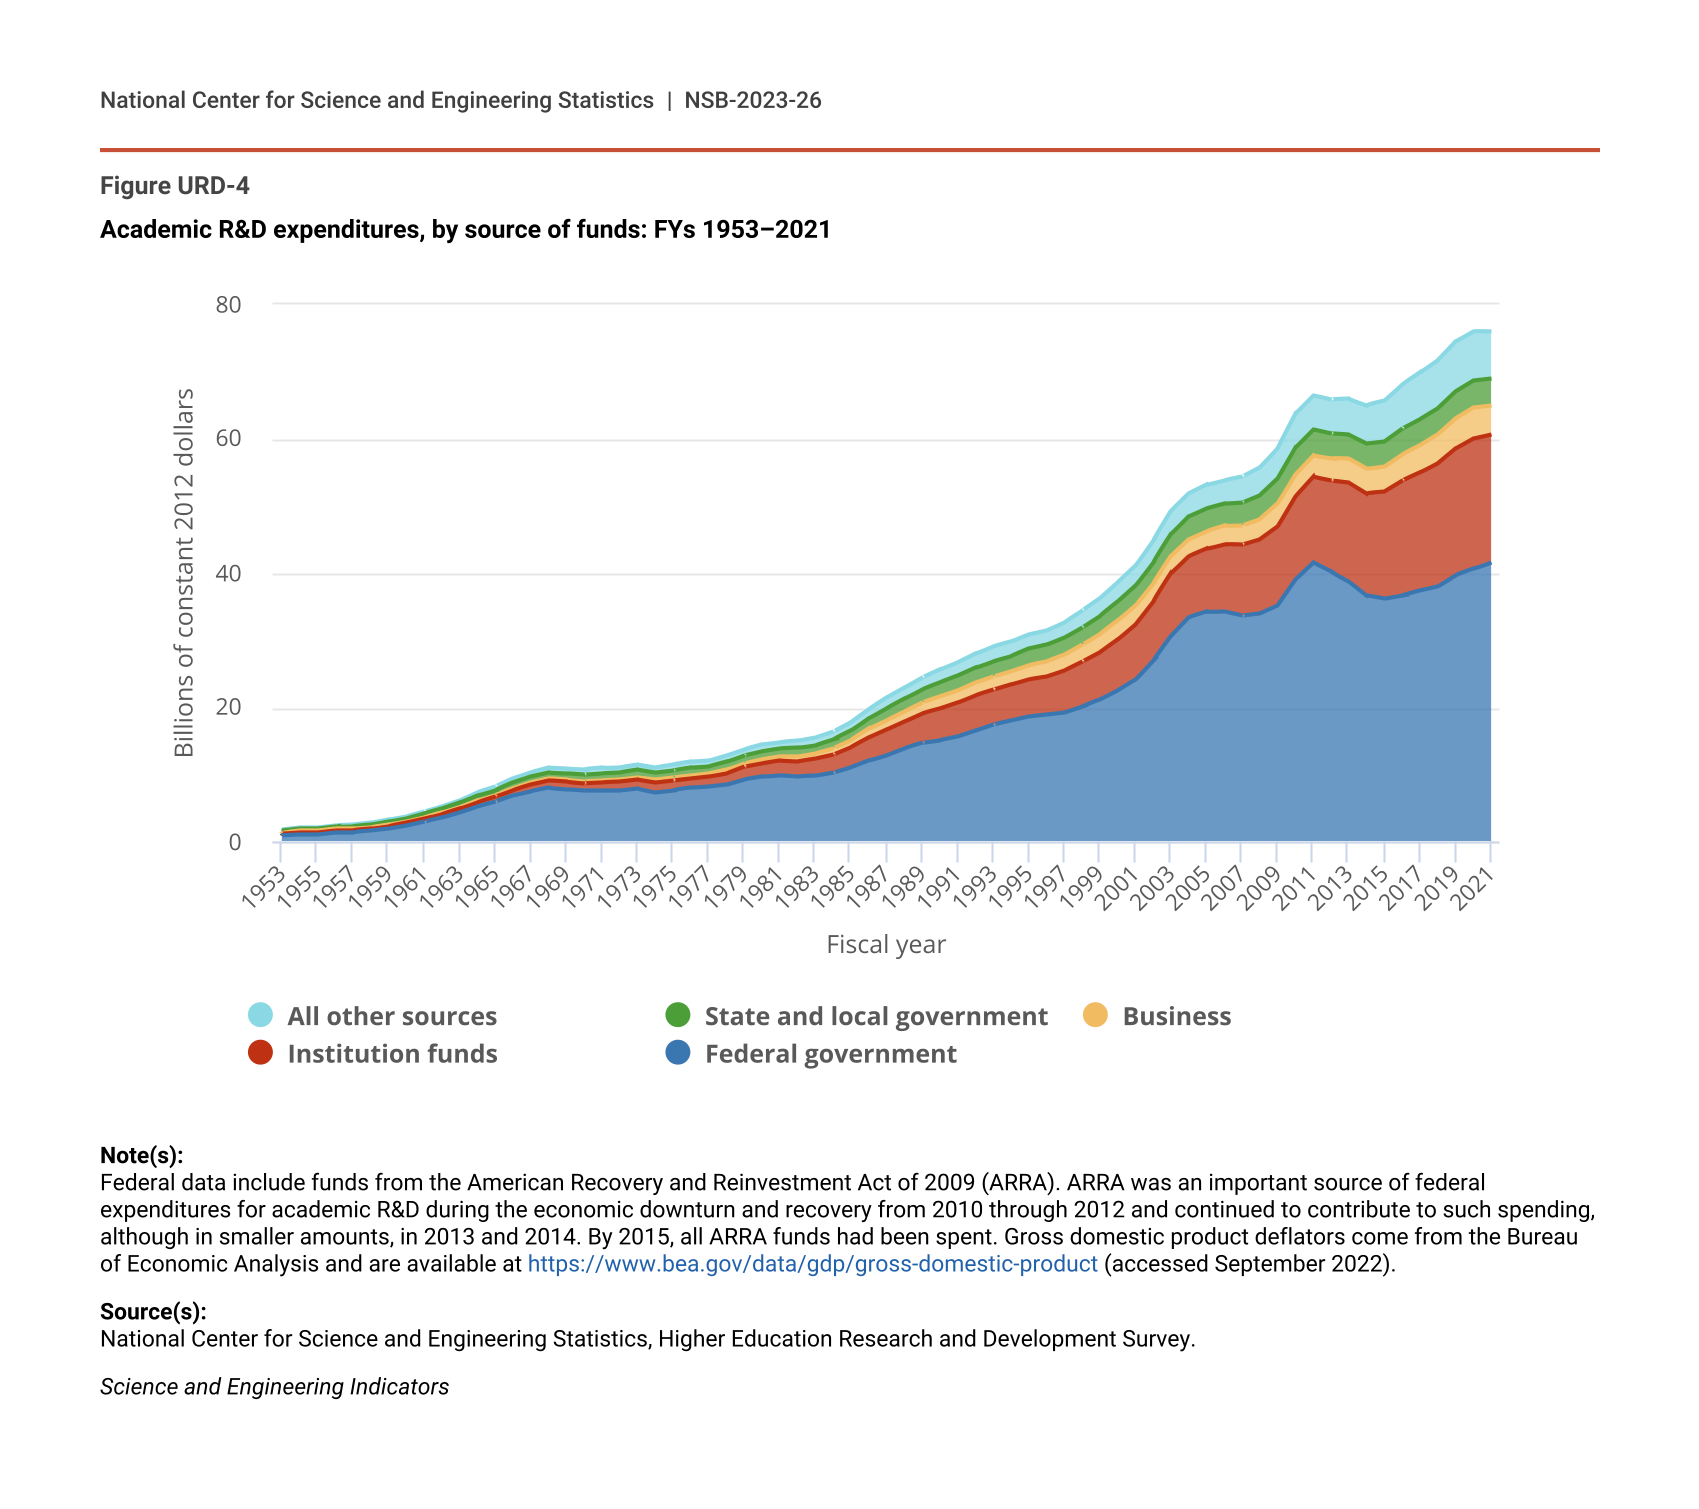
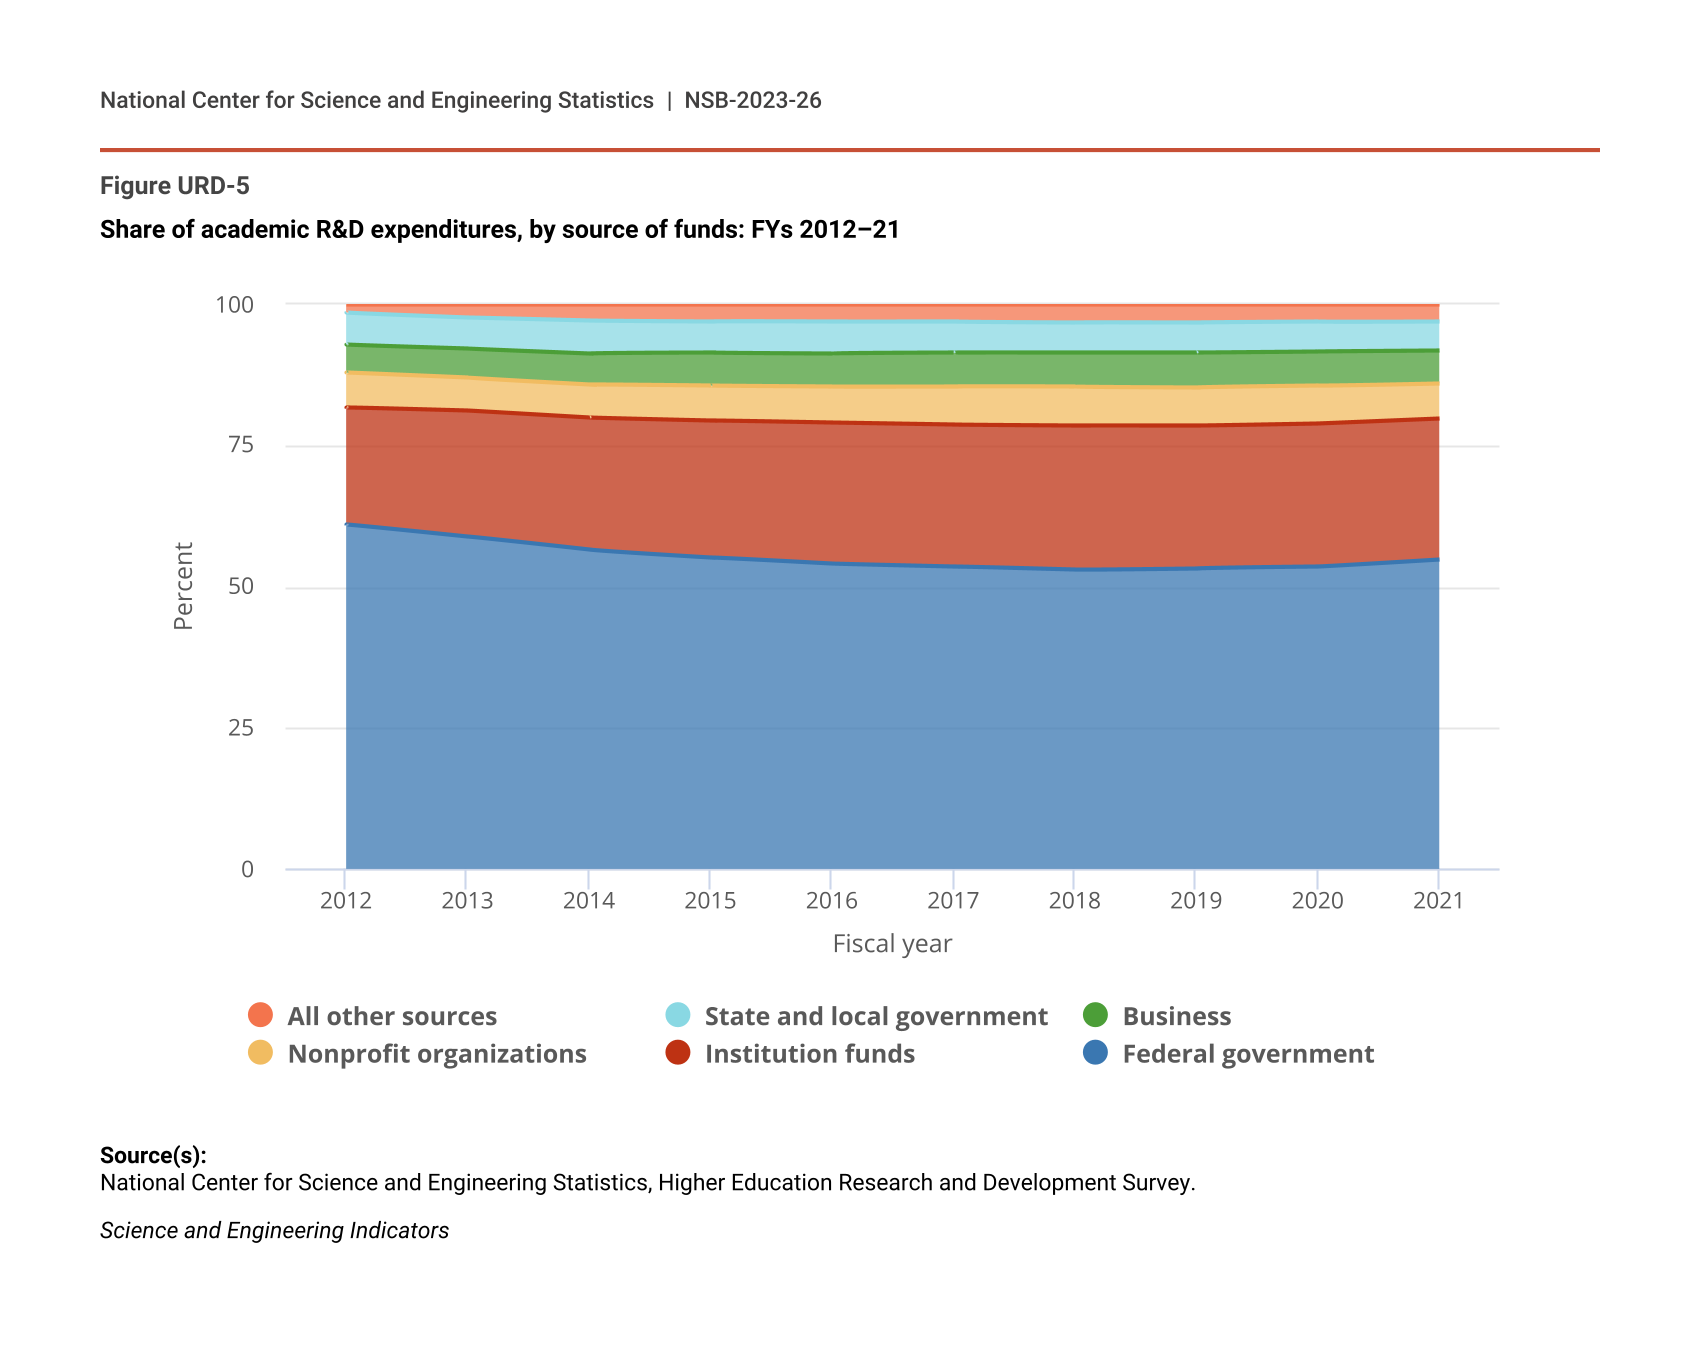
Academic R&D spending has grown significantly over the past half century, reaching nearly $90 billion in 2021 compared with $255 million in 1953 (not adjusting for inflation) (NCSES HERD 2021: Table 1). The federal government has been the largest funder of academic R&D since 1953; in 2021, federal funding supported 55% of academic R&D spending. Academic institutions were the second largest source of funding for academic R&D, contributing 25% of the funds. The remainder was funded by businesses, nonprofit organizations, state and local governments, and other sources, such as overseas funding (Figure URD-4). The shares of funding provided by different sources have shifted gradually over time. The share contributed by the federal government has declined from 61% in 2012 to 55% in 2021 (Figure URD-5). The federal government’s emergency funding for academic R&D during the COVID-19 pandemic in 2020 and 2021 did not reverse this trend. Although the federal government overall contributes the greatest share of funds spent on academic R&D each year, in 2021, six agencies provided more than 90% of the federal funds spent in academic R&D (Table URD-1). The Department of Health and Human Services (HHS), largely through the National Institutes of Health (NIH), has provided more than half of federal support over that period.
Academic R&D expenditures, by source of funds: FYs 1953–2021
| Fiscal year | Federal government | Institution funds | Business | State and local government | All other sources |
|---|---|---|---|---|---|
| 1953 | 1.0 | 0.2 | 0.1 | 0.3 | 0.2 |
| 1954 | 1.1 | 0.3 | 0.2 | 0.3 | 0.2 |
| 1955 | 1.1 | 0.3 | 0.2 | 0.3 | 0.2 |
| 1956 | 1.4 | 0.3 | 0.2 | 0.3 | 0.2 |
| 1957 | 1.4 | 0.3 | 0.2 | 0.4 | 0.2 |
| 1958 | 1.6 | 0.3 | 0.2 | 0.4 | 0.3 |
| 1959 | 1.9 | 0.4 | 0.2 | 0.5 | 0.3 |
| 1960 | 2.4 | 0.4 | 0.2 | 0.5 | 0.3 |
| 1961 | 3.0 | 0.4 | 0.2 | 0.6 | 0.3 |
| 1962 | 3.6 | 0.5 | 0.2 | 0.6 | 0.4 |
| 1963 | 4.4 | 0.5 | 0.2 | 0.7 | 0.4 |
| 1964 | 5.3 | 0.6 | 0.2 | 0.8 | 0.5 |
| 1965 | 6.0 | 0.7 | 0.2 | 0.8 | 0.5 |
| 1966 | 6.9 | 0.8 | 0.2 | 0.9 | 0.6 |
| 1967 | 7.5 | 1.0 | 0.3 | 0.9 | 0.6 |
| 1968 | 8.0 | 1.1 | 0.3 | 0.9 | 0.7 |
| 1969 | 7.8 | 1.1 | 0.3 | 1.0 | 0.7 |
| 1970 | 7.6 | 1.1 | 0.3 | 1.0 | 0.8 |
| 1971 | 7.6 | 1.2 | 0.3 | 1.1 | 0.8 |
| 1972 | 7.6 | 1.3 | 0.3 | 1.1 | 0.8 |
| 1973 | 7.9 | 1.3 | 0.3 | 1.2 | 0.8 |
| 1974 | 7.4 | 1.4 | 0.4 | 1.1 | 0.8 |
| 1975 | 7.7 | 1.4 | 0.4 | 1.1 | 0.9 |
| 1976 | 8.0 | 1.4 | 0.4 | 1.2 | 0.9 |
| 1977 | 8.2 | 1.5 | 0.4 | 1.1 | 0.9 |
| 1978 | 8.5 | 1.7 | 0.5 | 1.2 | 1.0 |
| 1979 | 9.3 | 1.9 | 0.5 | 1.2 | 0.9 |
| 1980 | 9.7 | 2.0 | 0.6 | 1.2 | 1.0 |
| 1981 | 9.9 | 2.2 | 0.6 | 1.2 | 0.9 |
| 1982 | 9.7 | 2.3 | 0.7 | 1.3 | 1.0 |
| 1983 | 9.8 | 2.6 | 0.8 | 1.2 | 1.1 |
| 1984 | 10.3 | 2.7 | 0.9 | 1.3 | 1.2 |
| 1985 | 11.1 | 3.0 | 1.0 | 1.4 | 1.3 |
| 1986 | 12.1 | 3.4 | 1.3 | 1.6 | 1.3 |
| 1987 | 12.9 | 3.8 | 1.4 | 1.8 | 1.5 |
| 1988 | 13.9 | 4.0 | 1.5 | 1.9 | 1.6 |
| 1989 | 14.7 | 4.4 | 1.6 | 2.0 | 1.7 |
| 1990 | 15.1 | 4.7 | 1.8 | 2.1 | 1.9 |
| 1991 | 15.6 | 5.1 | 1.8 | 2.2 | 2.0 |
| 1992 | 16.5 | 5.3 | 1.9 | 2.2 | 2.1 |
| 1993 | 17.4 | 5.2 | 2.0 | 2.3 | 2.2 |
| 1994 | 18.0 | 5.4 | 2.0 | 2.2 | 2.2 |
| 1995 | 18.6 | 5.6 | 2.1 | 2.4 | 2.2 |
| 1996 | 18.9 | 5.7 | 2.2 | 2.5 | 2.2 |
| 1997 | 19.2 | 6.3 | 2.3 | 2.6 | 2.3 |
| 1998 | 20.1 | 6.7 | 2.5 | 2.6 | 2.5 |
| 1999 | 21.1 | 7.1 | 2.7 | 2.7 | 2.6 |
| 2000 | 22.5 | 7.6 | 2.8 | 2.8 | 2.9 |
| 2001 | 24.1 | 8.3 | 2.8 | 2.9 | 3.0 |
| 2002 | 27.0 | 8.8 | 2.7 | 3.1 | 3.3 |
| 2003 | 30.6 | 9.3 | 2.6 | 3.2 | 3.5 |
| 2004 | 33.4 | 9.1 | 2.5 | 3.4 | 3.4 |
| 2005 | 34.2 | 9.4 | 2.6 | 3.4 | 3.5 |
| 2006 | 34.3 | 10.0 | 2.7 | 3.3 | 3.5 |
| 2007 | 33.7 | 10.5 | 2.9 | 3.4 | 3.8 |
| 2008 | 34.0 | 11.0 | 3.0 | 3.6 | 4.1 |
| 2009 | 35.2 | 11.7 | 3.4 | 3.8 | 4.5 |
| 2010 | 39.0 | 12.4 | 3.3 | 4.0 | 5.0 |
| 2011 | 41.5 | 12.8 | 3.2 | 3.9 | 5.0 |
| 2012 | 40.2 | 13.6 | 3.3 | 3.7 | 5.0 |
| 2013 | 38.8 | 14.7 | 3.5 | 3.6 | 5.3 |
| 2014 | 36.7 | 15.2 | 3.6 | 3.8 | 5.7 |
| 2015 | 36.2 | 15.9 | 3.8 | 3.7 | 6.0 |
| 2016 | 36.7 | 17.0 | 4.0 | 3.8 | 6.5 |
| 2017 | 37.4 | 17.5 | 4.1 | 3.9 | 6.9 |
| 2018 | 38.0 | 18.3 | 4.3 | 3.9 | 7.2 |
| 2019 | 39.7 | 18.8 | 4.5 | 4.0 | 7.5 |
| 2020 | 40.6 | 19.4 | 4.6 | 4.0 | 7.4 |
| 2021 | 41.6 | 19.0 | 4.3 | 4.0 | 7.0 |
Note(s):
Federal data include funds from the American Recovery and Reinvestment Act of 2009 (ARRA). ARRA was an important source of federal expenditures for academic R&D during the economic downturn and recovery from 2010 through 2012 and continued to contribute to such spending, although in smaller amounts, in 2013 and 2014. By 2015, all ARRA funds had been spent. Gross domestic product deflators come from the Bureau of Economic Analysis and are available at https://www.bea.gov/data/gdp/gross-domestic-product (accessed September 2022).
Source(s):
National Center for Science and Engineering Statistics, Higher Education Research and Development Survey.
Science and Engineering Indicators
Share of academic R&D expenditures, by source of funds: FYs 2012–21
| Fiscal year | Federal government | Institution funds | Nonprofit organizations | Business | State and local government | All other sources |
|---|---|---|---|---|---|---|
| 2012 | 61.07 | 20.67 | 6.12 | 4.98 | 5.68 | 1.47 |
| 2013 | 58.86 | 22.29 | 5.80 | 5.24 | 5.52 | 2.29 |
| 2014 | 56.49 | 23.42 | 5.90 | 5.55 | 5.81 | 2.84 |
| 2015 | 55.21 | 24.20 | 6.16 | 5.84 | 5.62 | 2.97 |
| 2016 | 54.05 | 24.95 | 6.43 | 5.87 | 5.63 | 3.07 |
| 2017 | 53.56 | 25.08 | 6.84 | 5.90 | 5.56 | 3.06 |
| 2018 | 52.97 | 25.53 | 6.89 | 5.97 | 5.46 | 3.17 |
| 2019 | 53.25 | 25.25 | 6.81 | 6.06 | 5.40 | 3.23 |
| 2020 | 53.47 | 25.43 | 6.66 | 6.01 | 5.33 | 3.10 |
| 2021 | 54.77 | 25.02 | 6.23 | 5.70 | 5.28 | 3.00 |
Source(s):
National Center for Science and Engineering Statistics, Higher Education Research and Development Survey.
Science and Engineering Indicators
Federal agency support of academic R&D spending: FYs 2012, 2017, and 2021
DOD = Department of Defense; DOE = Department of Energy; HHS = Department of Health and Human Services; NASA = National Aeronautics and Space Administration; NSF = National Science Foundation; USDA = Department of Agriculture.
Note(s):
Gross domestic product deflators come from the Bureau of Economic Analysis and are available at https://www.bea.gov/data/gdp/gross-domestic-product (accessed September 2022).
Source(s):
National Center for Science and Engineering Statistics, Higher Education Research and Development Survey.
Science and Engineering Indicators
The share of R&D spending funded by the academic institutions themselves rose concurrently with the decrease in the share funded by the federal government, increasing from 21% in 2012 to 25% in 2021 (Figure URD-5). Between 2012 and 2021, spending funded by institutional support increased by nearly 40% (Figure URD-4). Nonprofit organizations funded about 6% of academic R&D spending in 2021, representing an increase of about 17% between 2012 and 2021 in constant dollars (NCSES HERD 2021: Table 2). Business also funded around 6% of academic R&D spending in 2021 (Figure URD-5), increasing by about 30% between 2012 and 2021 in constant 2012 dollars (Figure URD-4), reflecting in part industry’s growing reliance on research results flowing from academia. State and local governments funded around 5% of academic R&D spending in 2021 (Figure URD-5), which, in constant dollars, reflected an increase of approximately 8% since 2012 (Figure URD-4).
All other sources of support for academic R&D—such as foreign governments, other universities, or gifts from individual donors directed to research funding—provided a relatively small share of funding for U.S. academic R&D. In 2021, those sources supported 3% of academic R&D spending (Figure URD-5), compared with 1.5% of all academic R&D spending in 2012. Overall, support from foreign sources (firms, universities, governments, nonprofits, and others) amounted to approximately 1.5% of academic R&D spending in 2021 (NCSES HERD 2021: Table 1 and Table 15).