 An official website of the United States government
 Human Resources and Academic R&D
Academic R&D activity employs large numbers of people in diverse roles, including faculty researchers, nonfaculty researchers, students at all levels, postdocs, and support staff ranging from custodial workers to senior professionals. In addition to producing new knowledge disseminated through publications, presentations, and various forms of intellectual property, academic R&D activity contributes to the education and training of graduates at all levels, many of whom go on to careers as academic scientists and engineers. In its Vision 2030, NSB noted that talent is one of four elements of S&E leadership that the United States must maintain if it is to continue leading the world in innovation in 2030 (NSB 2020).
This section presents an overview of the people engaged in academic R&D in U.S. institutions, with a focus on faculty, graduate students, and postdocs. For graduate students and postdocs, this section also provides detailed data on sources of financial support for their research and education. Ensuring financial support for students, postdocs, and researchers in S&E and S&E-related fields is essential to developing and retaining the talent needed for the nation to lead global innovation.
Academic Employment
The higher education sector is a large employer of individuals holding research doctorates in S&E fields. The doctoral academic workforce trains the next generation of scientists and engineers and advances the nation’s R&D enterprise, especially basic research. In 2021, about 347,000 members of the doctoral academic workforce received an S&E doctorate in the United States (Table SURD-1).
In the last 30 years, S&E doctorate holders made an employment shift from the academic to the for-profit business sector. In 1993, nearly half of S&E doctorate holders (45%) were employed by universities and 4-year colleges, whereas 31% were employed by private, for-profit businesses (NSF 1996: Table 20). By 2021, these percentages shifted, with 39% in 4-year educational institutions and 37% in for-profit businesses (NCSES SDR 2021: Table 42). As a proportion of all academically employed S&E doctorate holders, however, the number employed as full-time faculty declined since at least 2003 to about 70% in 2021.
In 2021, 39% of U.S.-trained S&E doctorate holders working in academia reported that research was their primary work activity, and 41% reported being engaged primarily in teaching (Table SURD-2). In 2021, about 40% of academically employed S&E doctorate holders had received federal research support in the previous year (Table SURD-3).
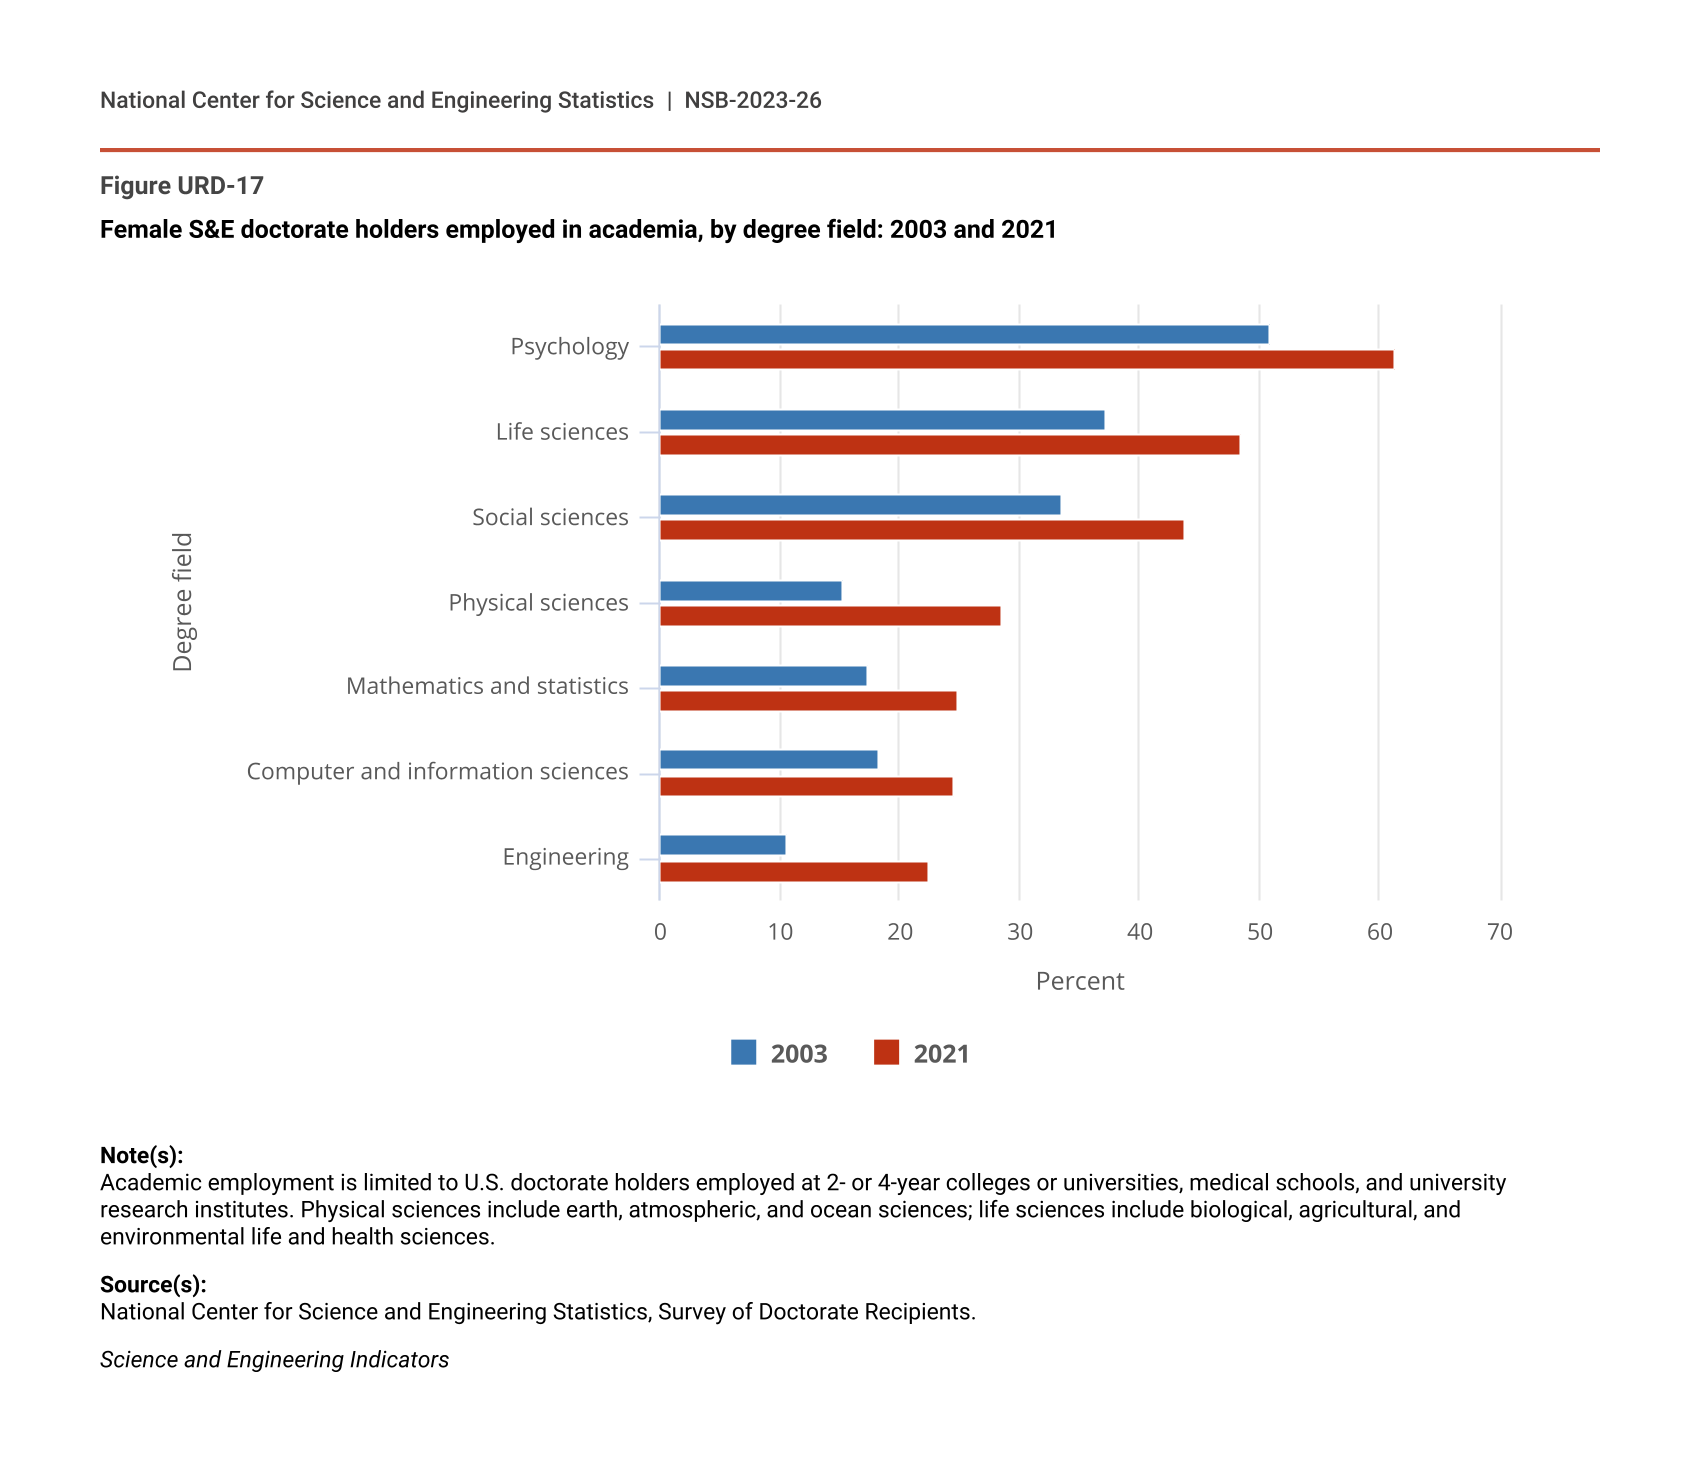
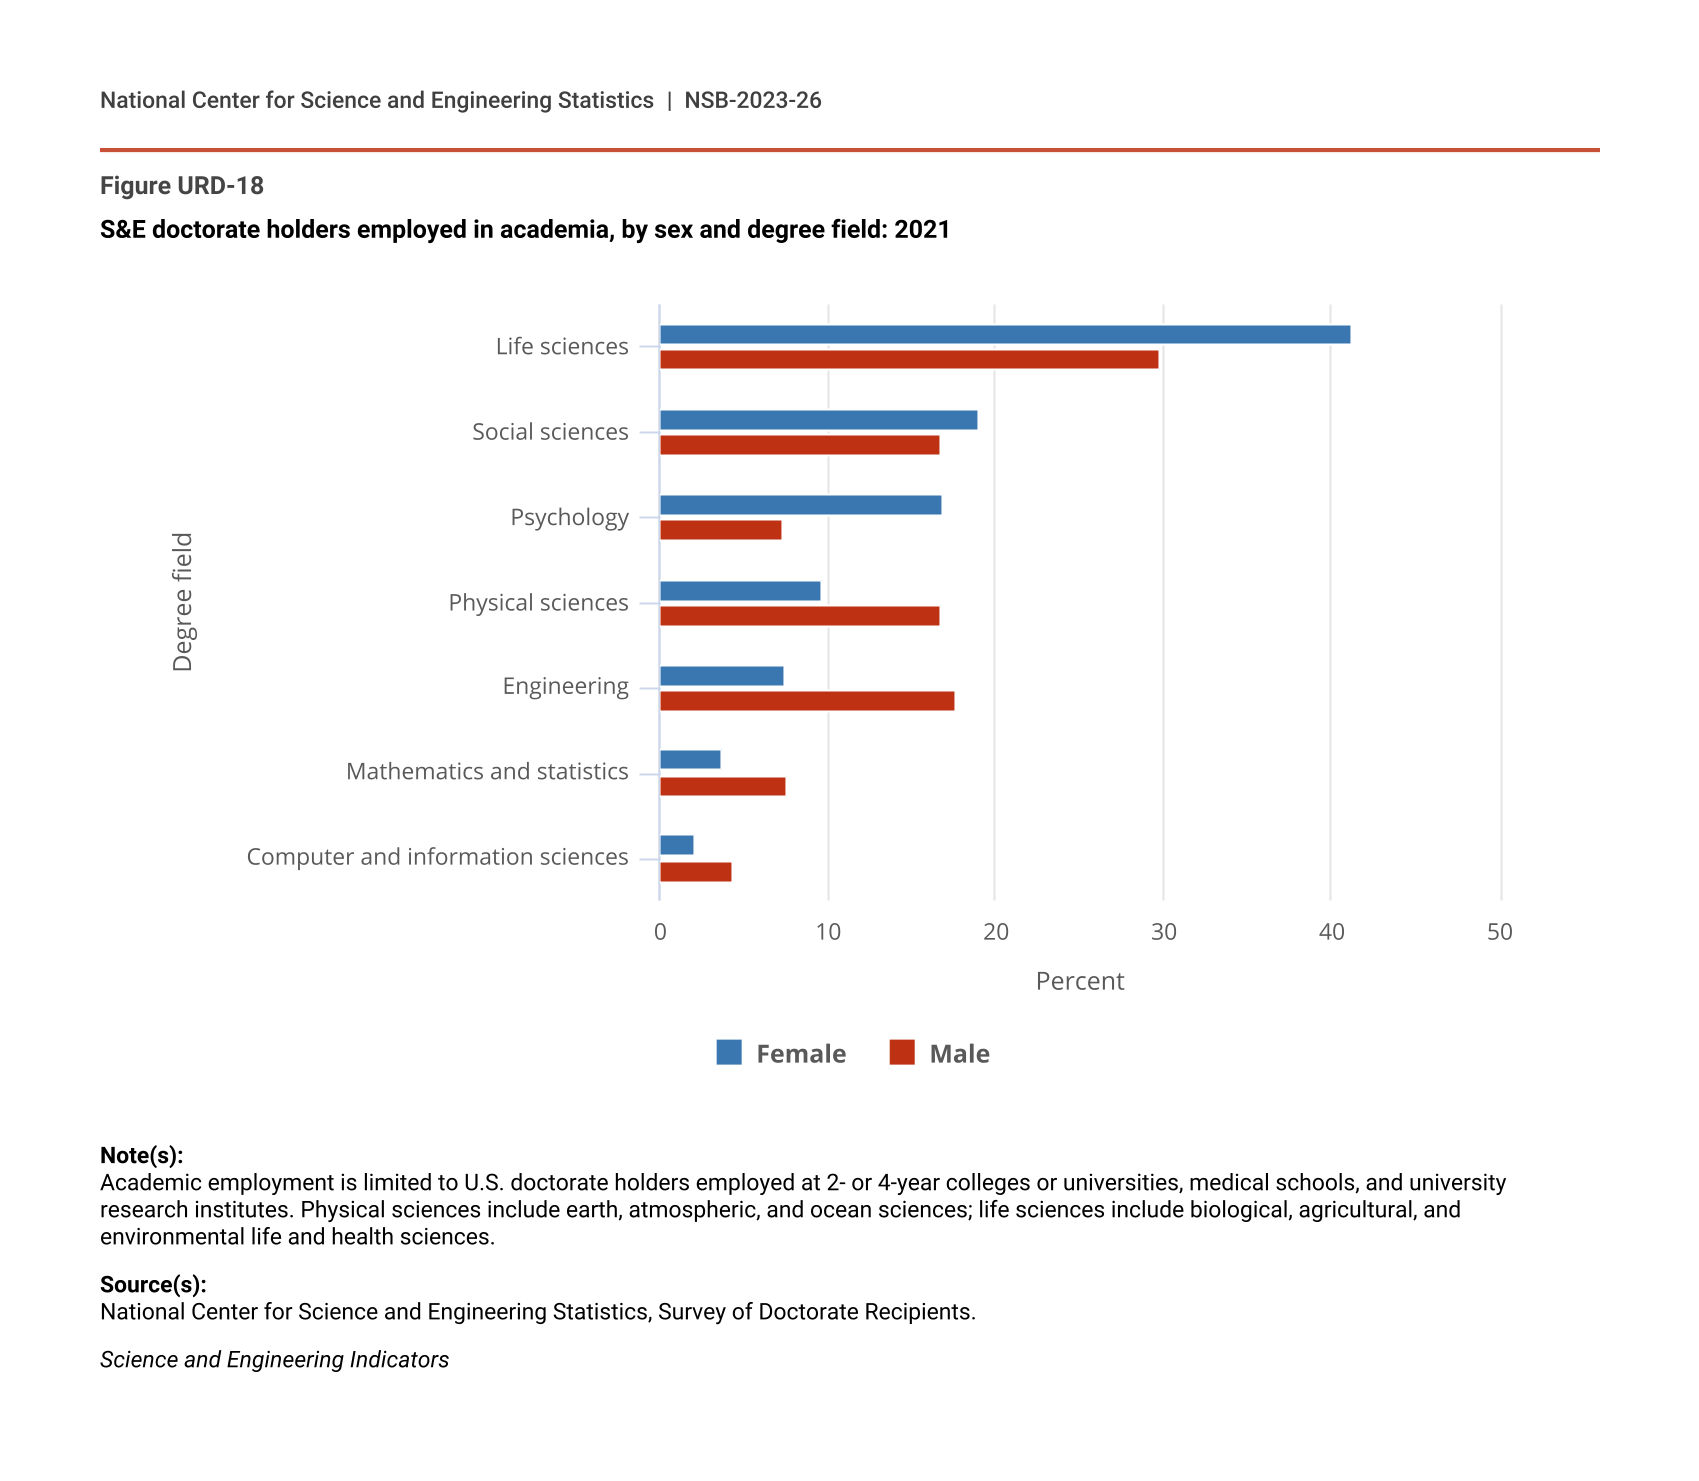
The number of women in the S&E doctoral academic workforce increased from about 78,700 to about 140,800 between 2003 and 2021, while the number of men grew from about 180,700 to about 206,400 (Table SURD-4). In 2021, women accounted for about 41% of S&E doctorate holders employed in academia, up from 30% in 2003, and they accounted for 35% of full-time senior faculty (including full professors and associate professors) in 2021, up from 23% in 2003. During this period, the proportion of female S&E doctorate holders in academic positions increased in all fields (Figure URD-17). The proportion of women in the doctoral academic workforce varied across disciplines (Figure URD-18). In 2021, the proportion of female S&E doctorate holders was larger than that of men in the life sciences, the social sciences, and psychology; in contrast, a smaller proportion of women than men were employed in engineering, physical sciences, mathematics and statistics, and computer and information sciences. (For data on degree awards by sex at the bachelor’s, master’s, and doctoral levels, see the Indicators 2024 report “Higher Education in Science and Engineering.”)
Female S&E doctorate holders employed in academia, by degree field: 2003 and 2021
| Degree field | 2003 | 2021 |
|---|---|---|
| Psychology | 50.9 | 61.3 |
| Life sciences | 37.1 | 48.5 |
| Social sciences | 33.6 | 43.7 |
| Physical sciences | 15.3 | 28.4 |
| Mathematics and statistics | 17.4 | 24.9 |
| Computer and information sciences | 18.3 | 24.5 |
| Engineering | 10.6 | 22.4 |
Note(s):
Academic employment is limited to U.S. doctorate holders employed at 2- or 4-year colleges or universities, medical schools, and university research institutes. Physical sciences include earth, atmospheric, and ocean sciences; life sciences include biological, agricultural, and environmental life and health sciences.
Source(s):
National Center for Science and Engineering Statistics, Survey of Doctorate Recipients.
Science and Engineering Indicators
S&E doctorate holders employed in academia, by sex and degree field: 2021
| Degree field | Female | Male |
|---|---|---|
| Life sciences | 41.2 | 29.8 |
| Social sciences | 19.0 | 16.7 |
| Psychology | 16.9 | 7.3 |
| Physical sciences | 9.7 | 16.7 |
| Engineering | 7.5 | 17.6 |
| Mathematics and statistics | 3.7 | 7.6 |
| Computer and information sciences | 2.1 | 4.3 |
Note(s):
Academic employment is limited to U.S. doctorate holders employed at 2- or 4-year colleges or universities, medical schools, and university research institutes. Physical sciences include earth, atmospheric, and ocean sciences; life sciences include biological, agricultural, and environmental life and health sciences.
Source(s):
National Center for Science and Engineering Statistics, Survey of Doctorate Recipients.
Science and Engineering Indicators
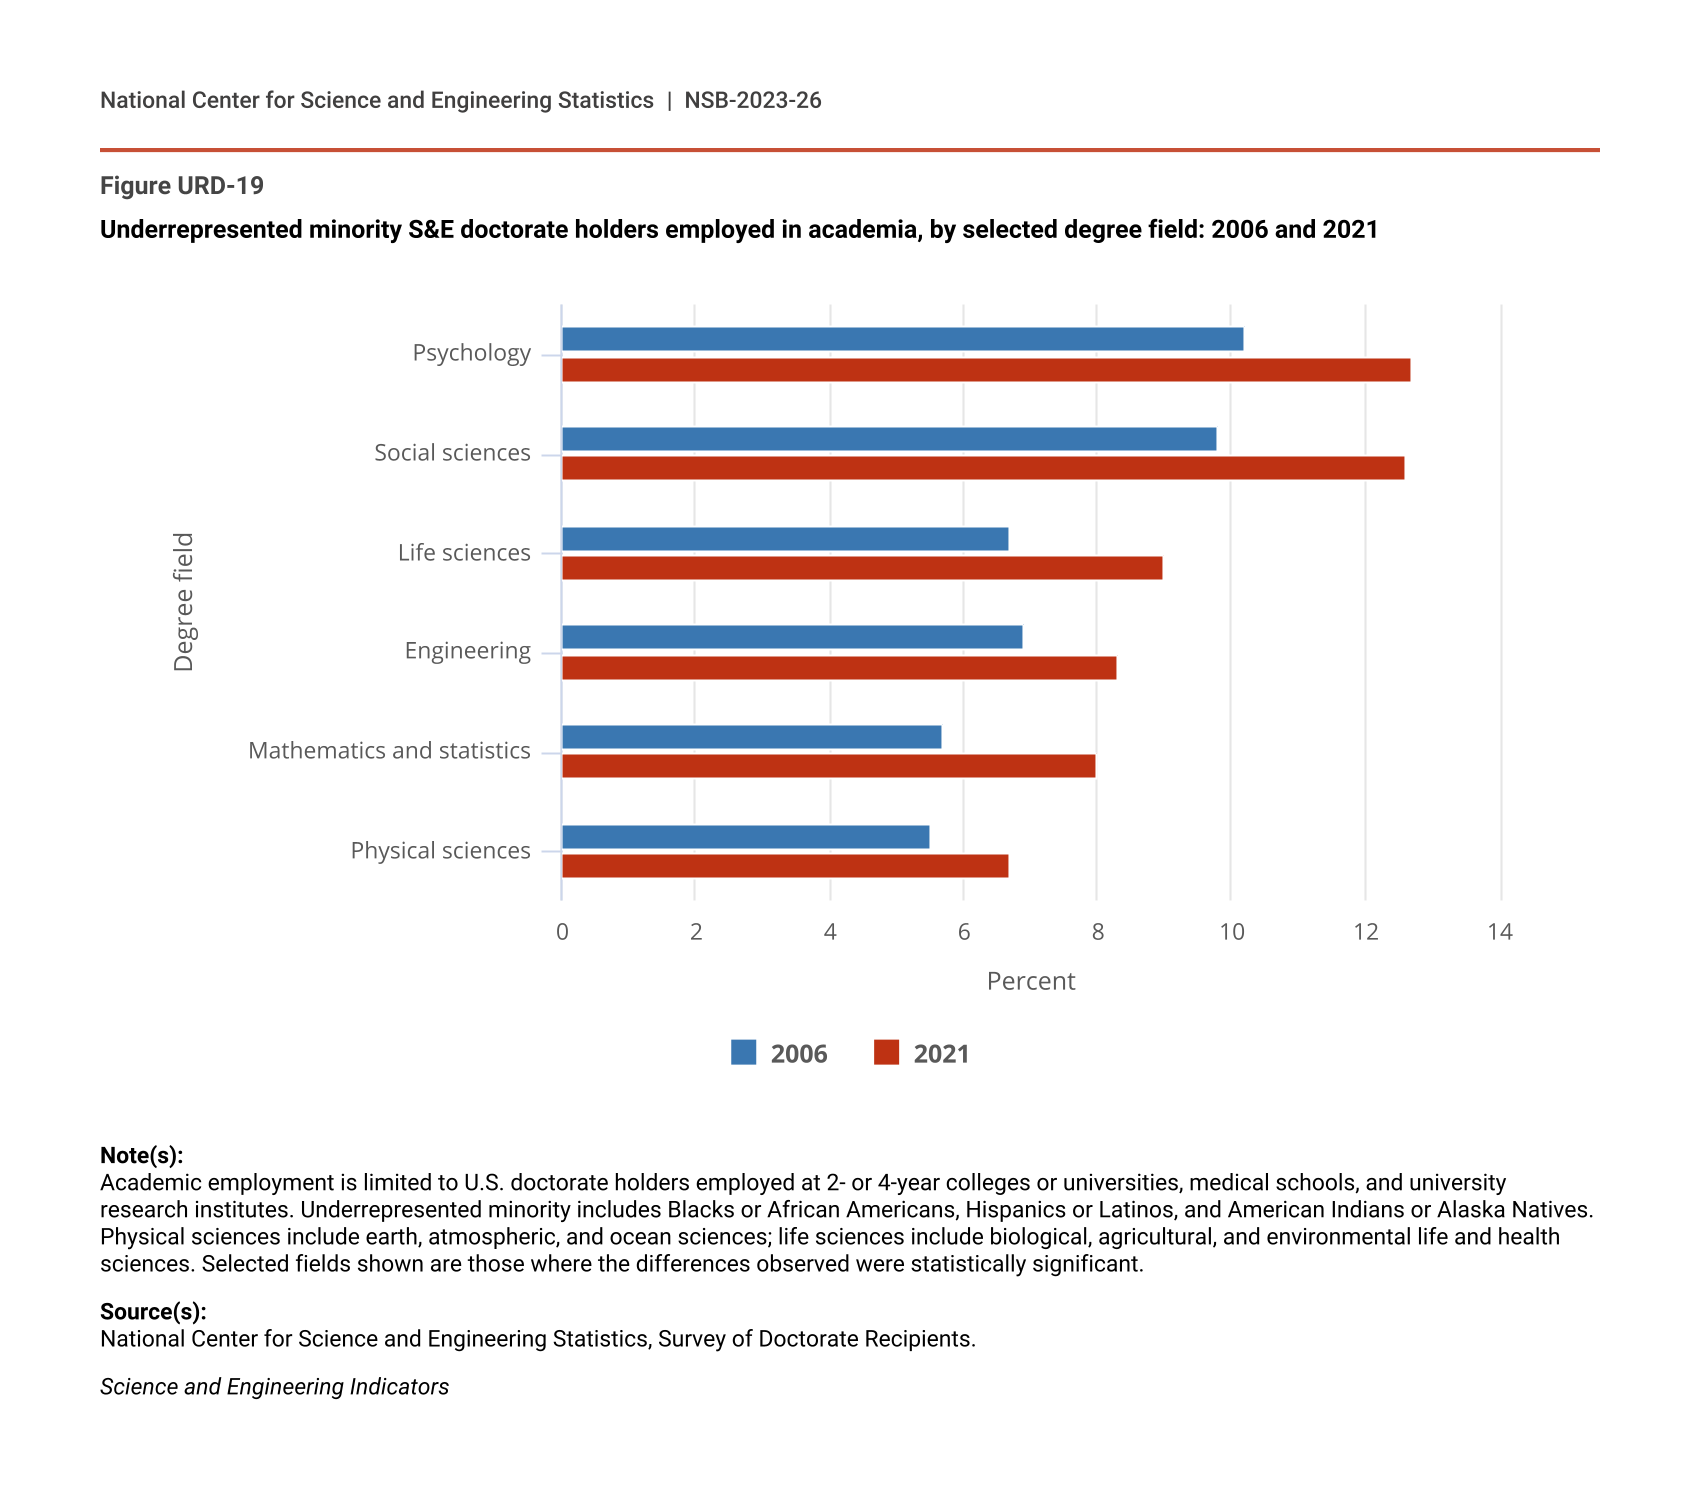
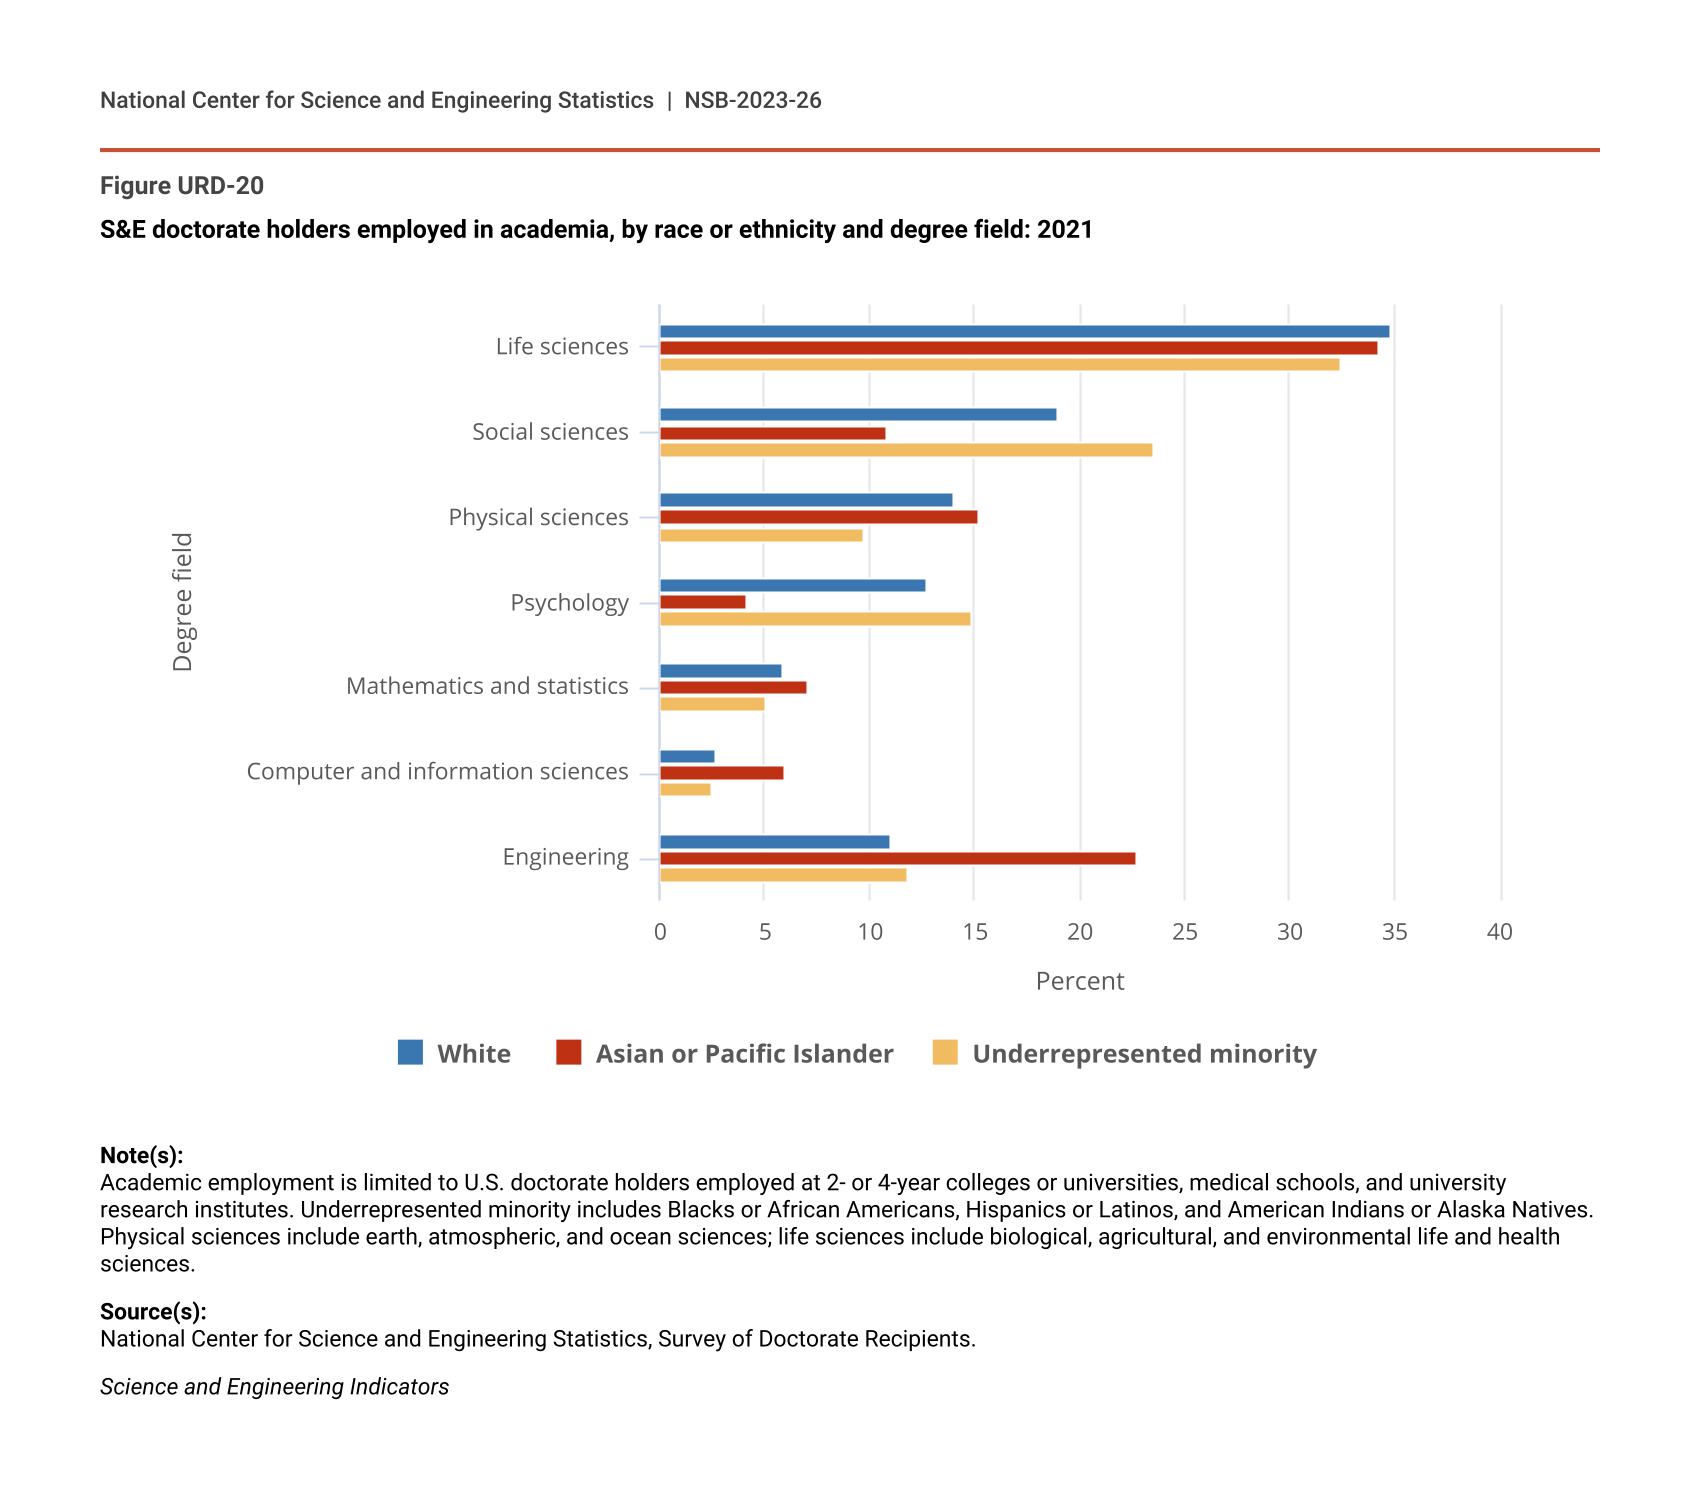
The proportion of individuals who identified as Hispanic or Latino, Black or African American, or American Indian or Alaska Native (underrepresented minorities, or URMs) in all academic positions increased from about 7% in 2006 to 10% in 2021 and from 7% to 9% among full-time faculty (Table SURD-5). Among all academic positions in the S&E doctoral workforce (including full-time faculty, postdocs, and other positions) during this period, the proportion of URMs grew in all S&E fields except for computer and information sciences (Figure URD-19). In 2021, the proportions of URM psychology and social sciences doctorate holders employed in academia were larger than those of their White and Asian or Pacific Islander counterparts, and the proportions of URM doctorate holders in mathematics and statistics and the physical sciences employed in academia were lower (Figure URD-20). (For data on degree awards by race and ethnicity at the bachelor’s, master’s, and doctoral levels, see the Indicators 2024 report “Higher Education in Science and Engineering.”)
Underrepresented minority S&E doctorate holders employed in academia, by selected degree field: 2006 and 2021
| Degree field | 2006 | 2021 |
|---|---|---|
| Psychology | 10.2 | 12.7 |
| Social sciences | 9.8 | 12.6 |
| Life sciences | 6.7 | 9.0 |
| Engineering | 6.9 | 8.3 |
| Mathematics and statistics | 5.7 | 8.0 |
| Physical sciences | 5.5 | 6.7 |
Note(s):
Academic employment is limited to U.S. doctorate holders employed at 2- or 4-year colleges or universities, medical schools, and university research institutes. Underrepresented minority includes Blacks or African Americans, Hispanics or Latinos, and American Indians or Alaska Natives. Physical sciences include earth, atmospheric, and ocean sciences; life sciences include biological, agricultural, and environmental life and health sciences. Selected fields shown are those where the differences observed were statistically significant.
Source(s):
National Center for Science and Engineering Statistics, Survey of Doctorate Recipients.
Science and Engineering Indicators
S&E doctorate holders employed in academia, by race or ethnicity and degree field: 2021
| Degree field | White | Asian or Pacific Islander | Underrepresented minority |
|---|---|---|---|
| Life sciences | 34.8 | 34.2 | 32.5 |
| Social sciences | 19.0 | 10.8 | 23.5 |
| Physical sciences | 14.0 | 15.2 | 9.7 |
| Psychology | 12.7 | 4.2 | 14.9 |
| Mathematics and statistics | 5.9 | 7.0 | 5.1 |
| Computer and information sciences | 2.7 | 6.0 | 2.5 |
| Engineering | 11.0 | 22.7 | 11.8 |
Note(s):
Academic employment is limited to U.S. doctorate holders employed at 2- or 4-year colleges or universities, medical schools, and university research institutes. Underrepresented minority includes Blacks or African Americans, Hispanics or Latinos, and American Indians or Alaska Natives. Physical sciences include earth, atmospheric, and ocean sciences; life sciences include biological, agricultural, and environmental life and health sciences.
Source(s):
National Center for Science and Engineering Statistics, Survey of Doctorate Recipients.
Science and Engineering Indicators
Graduate students and postdocs are also members of the academic research workforce, often running experiments and conducting studies under faculty supervision. In the United States, doctoral universities with the highest research activity enroll the majority of S&E graduate students and appoint most of the postdocs (NCSES GSS 2021: Table 5-3). For example, in 2021, 56% of master’s students and 81% of doctoral students were enrolled at very high research doctoral universities, and 83% of S&E postdocs had appointments in these institutions.
Financial Support for S&E Graduate Students and Postdocs
Advanced education and research are tightly coupled in academia. This is especially true for graduate students and postdocs in S&E. Engagement in research is a principal mechanism through which students learn how to conduct research and to develop in-depth knowledge of their fields of specialization. To ensure that graduate students or postdocs have the resources to pursue their studies and complete their training, the institutions that enroll or appoint them often provide financial support. This support may take the form of research assistantships (RAs), typically funded by research grants or contracts; teaching assistantships (TAs), typically funded by the institution; and fellowships, paid directly to the individual students by government agencies and other sources. Many full-time graduate RAs, fellowships, and postdoc appointments are supported with funding from research grants and contracts awarded by federal agencies. In addition, some graduate students are self-supported or receive support from family, employers, their home countries, or student loans (or a mix of such sources).
Financial Support for S&E Graduate Students
The availability of institutional or federal support for graduate students may affect how much students pay out of pocket and how much education-related debt they incur (NCSES 2019a). Graduate students in S&E fields receive support through various mechanisms, including RAs, TAs, and fellowships. Of the full-time S&E graduate students supported by the federal government in 2021, 69% received RAs funded from research grants. TAs and fellowships were funded most frequently by the student’s institution, whereas nearly half of RAs were funded through federal academic research grants (NCSES GSS 2021: Special tabulation).
Graduate students’ sources of financial support depend on their level of study. In 2021, around 71% of S&E master’s students paid for their graduate program using personal sources (NCSES GSS 2021: Table 3-1); by contrast, 9% of doctoral students did so. These differences generally held across all S&E fields. Academic institutions were the primary source of support, including tuition waivers and stipends, for 22% of master’s students and 58% of doctoral students. The federal government was the primary source of support for 5% of master’s students and 26% of doctoral students. Federal support includes financial support provided by federal agencies but excludes federally guaranteed student loans.
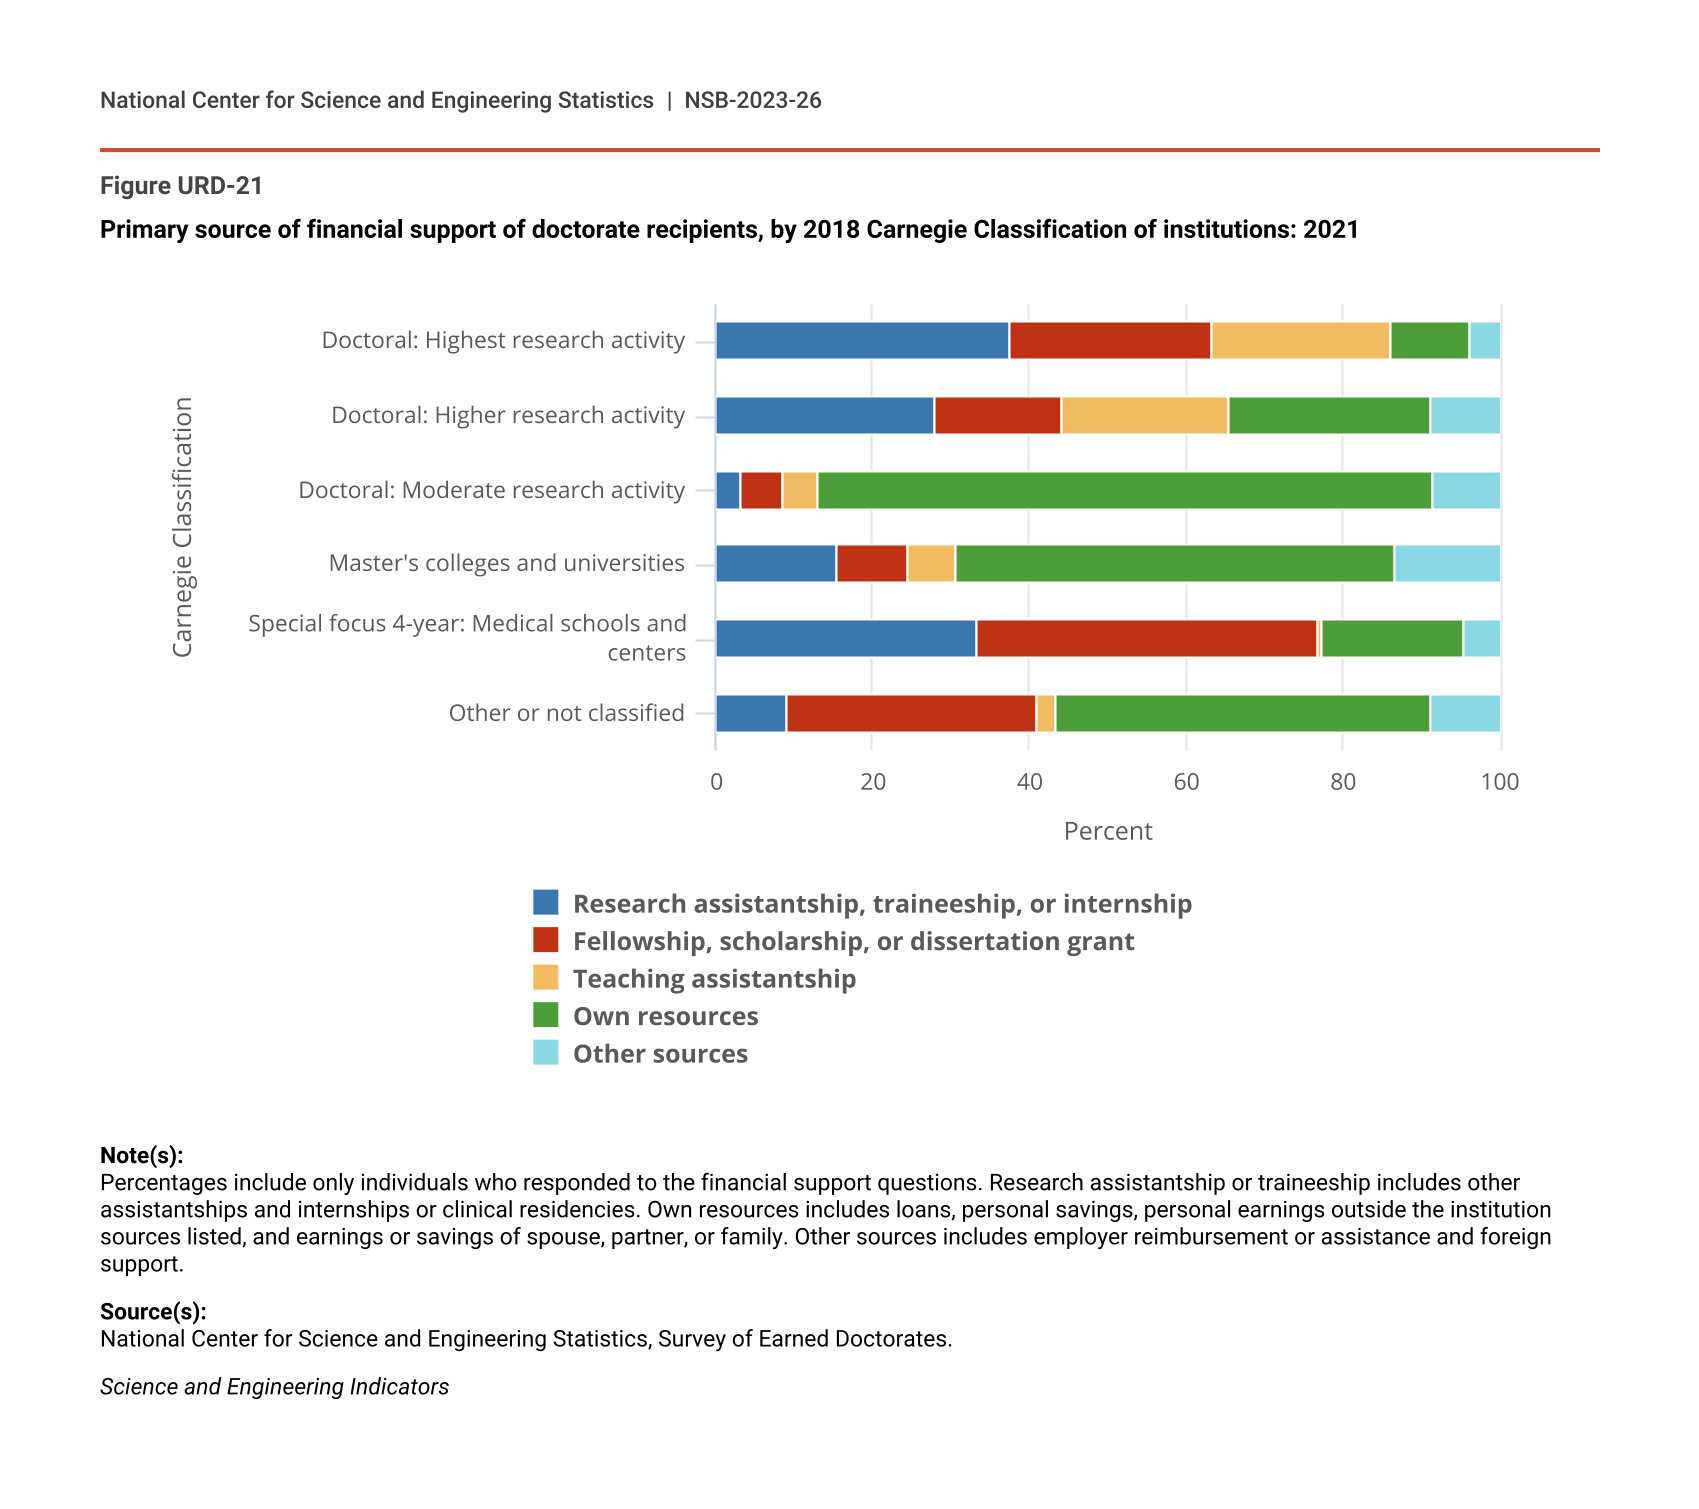
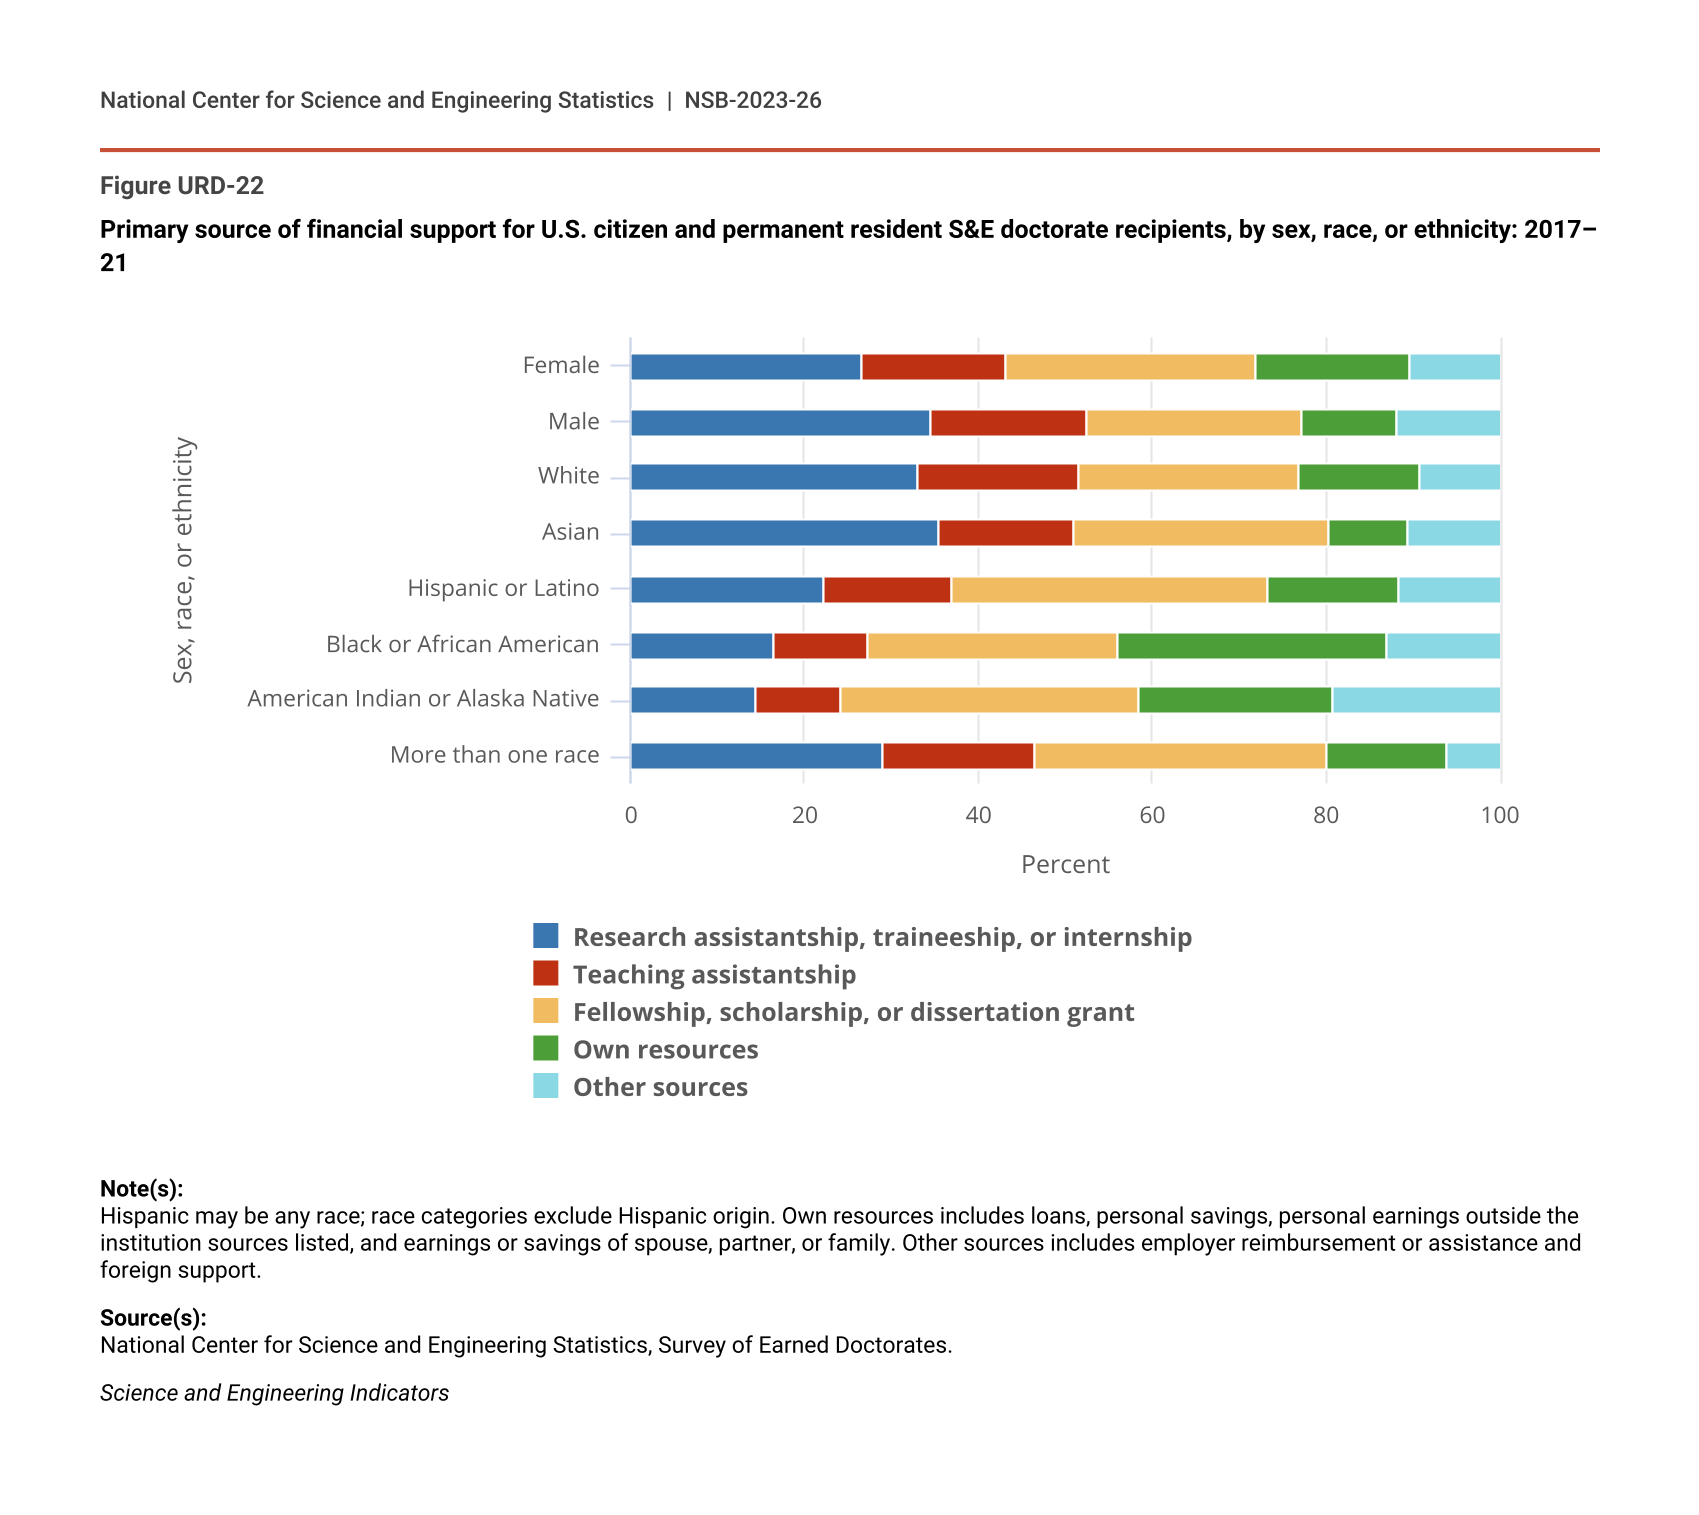
Most doctoral students are supported by multiple sources or mechanisms during graduate school, even in a single academic year. Patterns of support vary by field and the type of institution attended. For example, in 2021, RAs were the most common primary source of financial support for doctorate recipients in engineering, computer and information sciences, physical sciences, and agricultural sciences and natural resources; in mathematics and statistics, TAs were most common (NCSES SED 2021: Figure 16). In 2021, the institutions that most frequently supported doctoral students with RAs and TAs, traineeships, fellowships, scholarships, or dissertation grants were doctoral institutions with the highest research activity and those with medical schools and centers (Figure URD-21). In contrast, 79% of doctorate recipients in doctoral institutions with moderate research activity and 56% of those in master’s colleges and universities used their own resources as their primary source of financial support. Funding mechanisms also varied by demographic groups (Figure URD-22).
Primary source of financial support of doctorate recipients, by 2018 Carnegie Classification of institutions: 2021
| Carnegie Classification | Research assistantship, traineeship, or internship | Fellowship, scholarship, or dissertation grant | Teaching assistantship | Own resources | Other sources |
|---|---|---|---|---|---|
| Doctoral: Highest research activity | 37.6 | 25.7 | 22.9 | 10.2 | 3.6 |
| Doctoral: Higher research activity | 28.0 | 16.2 | 21.2 | 25.8 | 8.8 |
| Doctoral: Moderate research activity | 3.2 | 5.3 | 4.4 | 78.6 | 8.5 |
| Master's colleges and universities | 15.3 | 9.3 | 6.0 | 56.0 | 13.4 |
| Special focus 4-year: Medical schools and centers | 33.2 | 43.6 | 0.6 | 18.2 | 4.4 |
| Other or not classified | 9.1 | 31.8 | 2.5 | 47.7 | 8.9 |
Note(s):
Percentages include only individuals who responded to the financial support questions. Research assistantship or traineeship includes other assistantships and internships or clinical residencies. Own resources includes loans, personal savings, personal earnings outside the institution sources listed, and earnings or savings of spouse, partner, or family. Other sources includes employer reimbursement or assistance and foreign support.
Source(s):
National Center for Science and Engineering Statistics, Survey of Earned Doctorates.
Science and Engineering Indicators
Primary source of financial support for U.S. citizen and permanent resident S&E doctorate recipients, by sex, race, or ethnicity: 2017–21
| Sex, race, or ethnicity | Research assistantship, traineeship, or internship | Teaching assistantship | Fellowship, scholarship, or dissertation grant | Own resources | Other sources |
|---|---|---|---|---|---|
| Female | 26.7 | 16.5 | 28.7 | 17.8 | 10.4 |
| Male | 34.6 | 17.9 | 24.9 | 11.0 | 11.7 |
| White | 33.0 | 18.6 | 25.3 | 13.8 | 9.2 |
| Asian | 35.5 | 15.6 | 29.3 | 9.1 | 10.5 |
| Hispanic or Latino | 22.4 | 14.6 | 36.3 | 15.3 | 11.4 |
| Black or African American | 16.5 | 10.9 | 28.8 | 30.8 | 13.0 |
| American Indian or Alaska Native | 14.5 | 9.7 | 34.2 | 22.4 | 19.2 |
| More than one race | 28.9 | 17.6 | 33.6 | 14.0 | 5.9 |
Note(s):
Hispanic may be any race; race categories exclude Hispanic origin. Own resources includes loans, personal savings, personal earnings outside the institution sources listed, and earnings or savings of spouse, partner, or family. Other sources includes employer reimbursement or assistance and foreign support.
Source(s):
National Center for Science and Engineering Statistics, Survey of Earned Doctorates.
Science and Engineering Indicators
Overall, among U.S. citizens and permanent residents who earned S&E doctorates between 2017 and 2021, a larger proportion of men (35%) than women (27%) were supported by RAs, whereas a larger proportion of women (18%) than men (11%) supported themselves through personal or family funds (Table SURD-6). Similar proportions of women and men (16% and 18%, respectively) were supported by TAs. Larger proportions of Asian (36%) and White (33%) doctorate recipients than doctorate recipients from URM groups reported RAs, traineeships, or internships as their primary source of support. Twenty-two percent of Hispanics, 17% of Blacks, and 14% of American Indians or Alaska Natives who earned S&E doctorates between 2017 and 2021 had RAs, traineeships, or internships as their primary source of financial support. To some extent, these differences may reflect differences across demographic groups in doctorate recipients’ fields and the types of institutions they attended. However, certain patterns held across fields. For example, larger proportions of Black doctorate recipients than those from other groups used personal sources of funding in almost every S&E field.
The primary sources of financial support of S&E doctorate recipients varied by citizenship status. Overall, a larger proportion of S&E doctorate recipients who were temporary visa holders than those who were U.S. citizens or permanent residents reported RAs or traineeships as their primary source of support (52% vs. 34%) (NCSES SED 2021: Table 4-1). In contrast, a larger proportion of S&E doctorate recipients who were U.S. citizens and permanent residents than those who were temporary visa holders reported support from fellowships, scholarships, dissertation grants, and their own sources. Patterns of primary financial support also varied by field of study.
Financial Support for S&E Postdocs
In 2021, most S&E postdocs (61%) were funded through research grants (NCSES GSS 2021: Table 3-6). Postdocs were also funded through fellowships (10%), traineeships (6%), and other mechanisms of support (23%). The proportion of postdocs funded through research grants was higher among those who were supported by federal funding (81%). In 2021, the federal government funded 51% of S&E postdocs (down from around 60% in 2009) (NCSES GSS 2009: Table 70; GSS 2021: Table 3-2). The federal government funded 40% or more of postdocs in all fields except civil, environmental, transportation, and related engineering (38%); industrial, manufacturing, systems engineering, and operations research (32%); mathematics and statistics (30%); and social sciences (21%). In 2021, institutions funded between 17% and 32% of all postdocs in most fields other than mathematics and statistics (49%); social sciences (47%); and industrial, manufacturing, systems engineering, and operations research (41%). Other nonfederal domestic sources funded 15% of postdocs, and foreign sources funded around 2%.
Almost all U.S. academic postdoctoral appointments were located at very high research doctoral universities (83%), high research doctoral universities (5%), and medical schools and centers (10%) (NCSES GSS 2021: Table 5-3). Just over half of postdocs (53%) were located at public institutions (NCSES GSS 2021: Table 5-1). Postdoctoral appointments were concentrated in the biological and biomedical sciences and in health sciences in 2021 (60% in these two fields combined in 2021; NCSES GSS 2021: Table 3-2 and Table 5-1). Physical sciences (11%) and engineering (13%) constituted most of the remainder.
Financial Support for S&E Graduate Students and Postdocs, by Source
Federal Support
Federal agencies support S&E graduate students and postdocs in different numbers and proportions because of practices within the disciplines supported by those agencies. For example, in 2021, NIH supported 59% of all postdocs in academic R&D (NCSES GSS 2021: Table 3-4). Much of the NIH spending on academic R&D was concentrated in the biological and biomedical sciences, the field with the largest share of postdocs (32% in 2021) (NCSES GSS 2021: Table 4-1). NSF, which distributes its academic R&D funding across a broad range of fields, supported a larger share of graduate students (26% of all S&E graduate students) than postdocs (12% of all postdocs) in 2021 (NCSES GSS 2021: Table 3-3 and Table 3-4).
Graduate Students
The federal government supported around 15% of full-time S&E graduate students (82,588 of 543,823) in 2021 (NCSES GSS 2021: Table 1-6), down from 21% (83,816 of 402,573) in 2004. The proportion of doctoral students supported by the federal government (26%) was higher than the proportion of the master’s students supported (5%). Put another way, in 2021, 82% of S&E graduate students supported by the federal government were doctoral students (NCSES GSS 2021: Table 1-6). In all S&E fields, the federal government supported a higher percentage of doctoral students than master’s students (NCSES GSS 2021: Table 3-1).
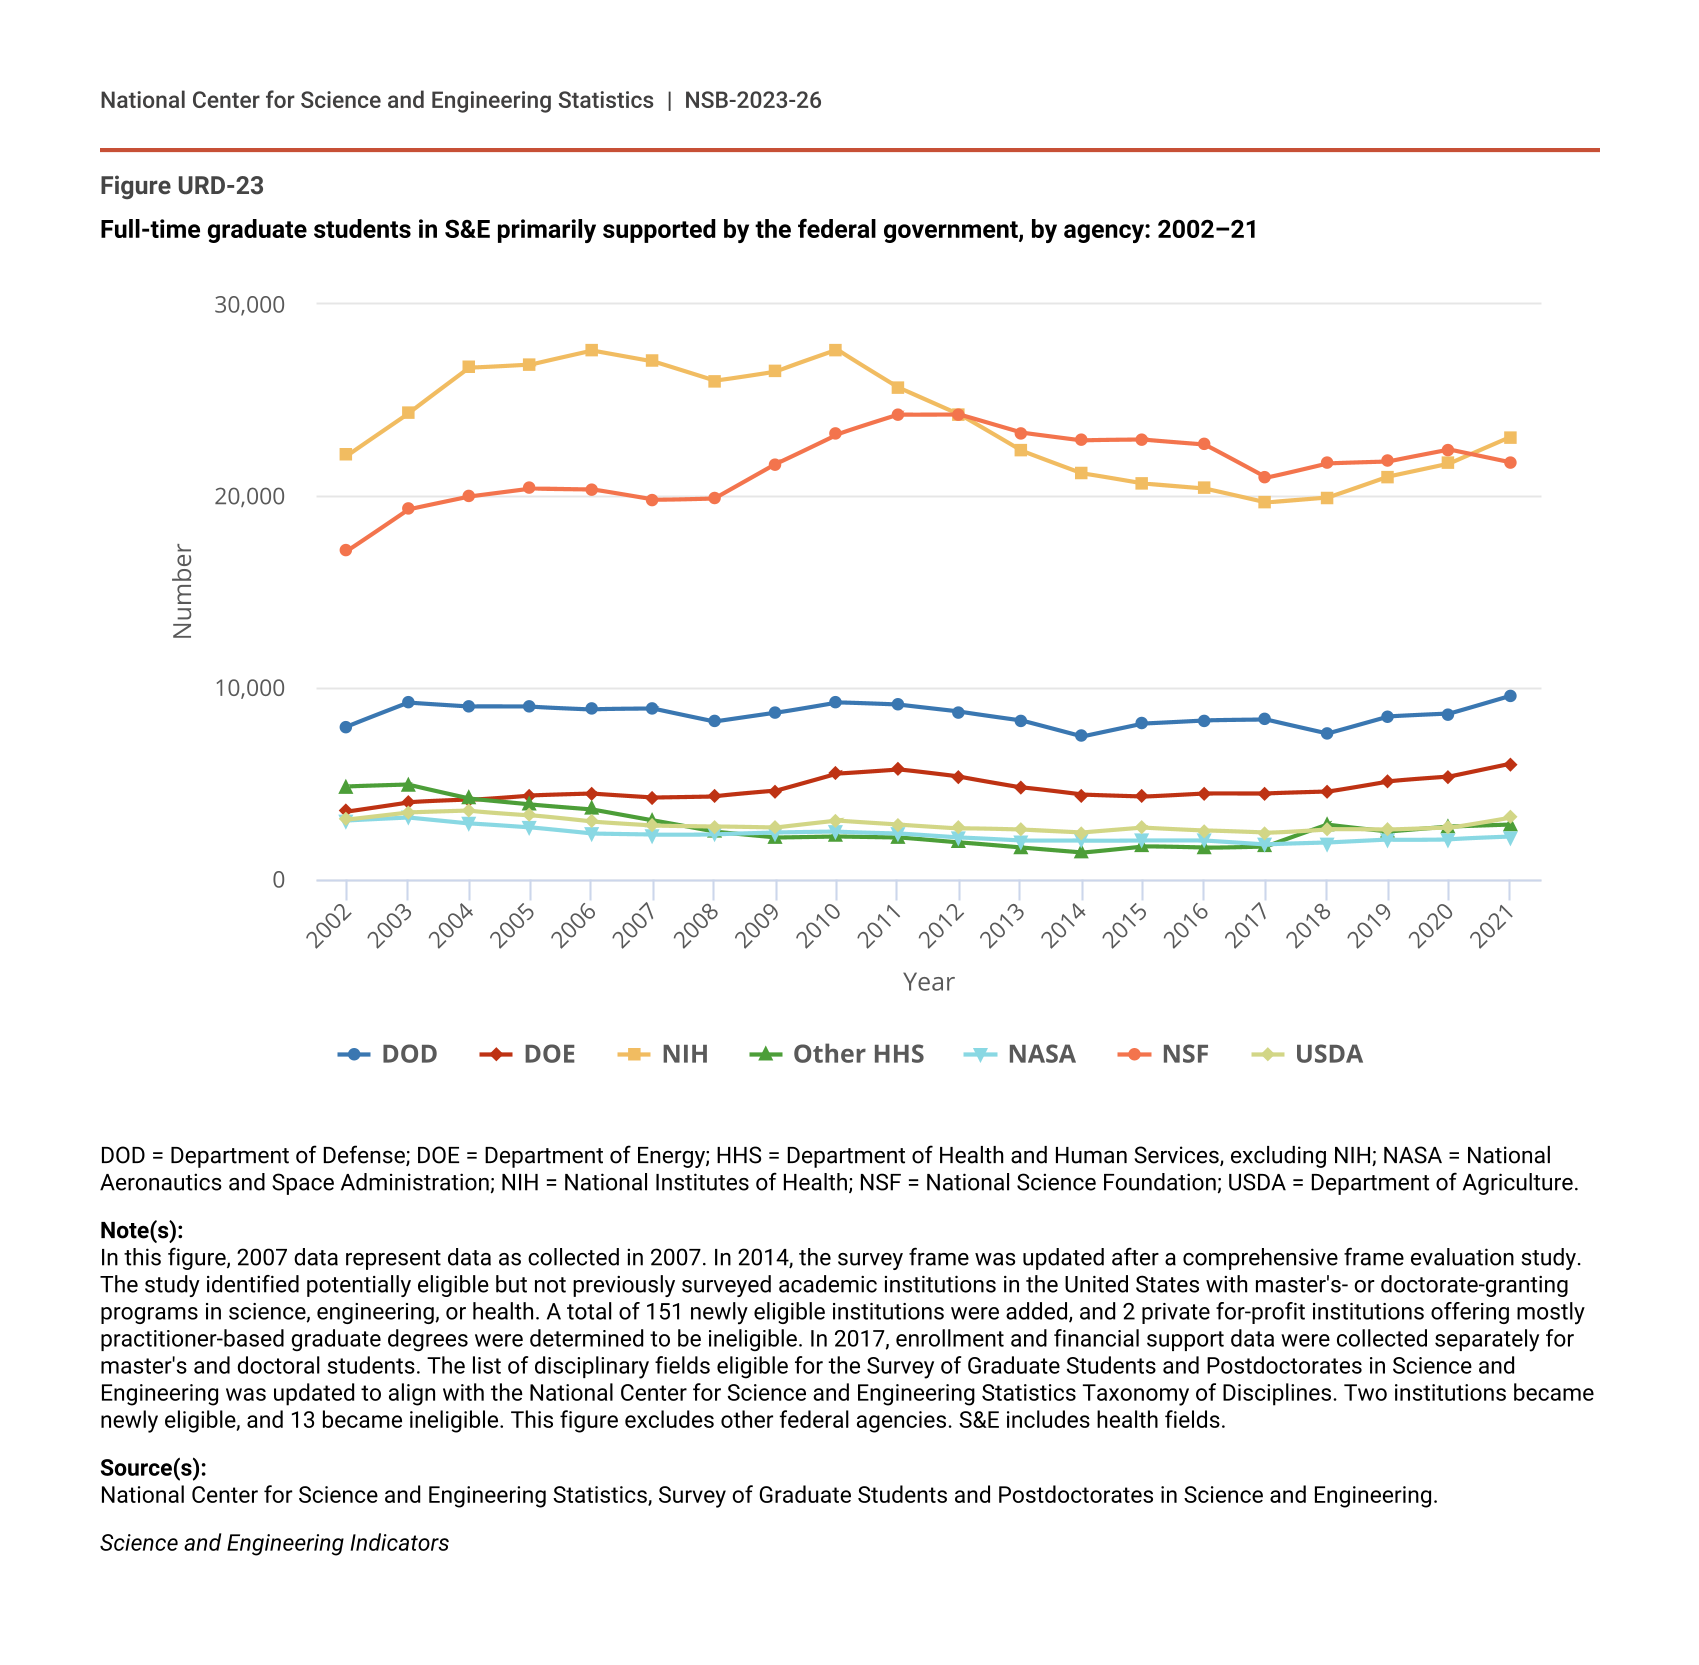
NSF (21,743) and NIH (23,088) supported the most graduate students in 2021. Together, these two agencies supported 54% of federally supported graduate students (NCSES GSS 2021: Table 1-7 and Table 3-3). Other agencies supporting significant numbers of S&E graduate students in 2021 were DOD (9,575), the Department of Energy (DOE) (6,016), and USDA (3,244); other agencies were HHS (excluding NIH) (2,866) and the National Aeronautics and Space Administration (NASA) (2,211) (Figure URD-23). RAs were the primary mechanism that the federal government used to fund graduate students. Among full-time S&E graduate students primarily funded by the federal government in 2021, 69% received RAs, followed by fellowships (13%) and traineeships (7%).
Full-time graduate students in S&E primarily supported by the federal government, by agency: 2002–21
| Year | DOD | DOE | NIH | Other HHS | NASA | NSF | USDA |
|---|---|---|---|---|---|---|---|
| 2002 | 7,977 | 3,548 | 22,129 | 4,830 | 3,082 | 17,135 | 3,100 |
| 2003 | 9,204 | 4,024 | 24,309 | 4,922 | 3,230 | 19,308 | 3,468 |
| 2004 | 9,007 | 4,135 | 26,689 | 4,211 | 2,916 | 19,975 | 3,563 |
| 2005 | 8,993 | 4,392 | 26,868 | 3,912 | 2,691 | 20,387 | 3,351 |
| 2006 | 8,867 | 4,480 | 27,587 | 3,662 | 2,364 | 20,339 | 3,000 |
| 2007 | 8,885 | 4,284 | 27,015 | 3,086 | 2,317 | 19,792 | 2,810 |
| 2008 | 8,219 | 4,341 | 26,003 | 2,496 | 2,344 | 19,882 | 2,770 |
| 2009 | 8,683 | 4,608 | 26,506 | 2,200 | 2,426 | 21,682 | 2,706 |
| 2010 | 9,233 | 5,512 | 27,615 | 2,255 | 2,472 | 23,226 | 3,061 |
| 2011 | 9,107 | 5,738 | 25,670 | 2,201 | 2,394 | 24,226 | 2,862 |
| 2012 | 8,748 | 5,343 | 24,256 | 1,921 | 2,173 | 24,243 | 2,664 |
| 2013 | 8,304 | 4,803 | 22,372 | 1,642 | 2,006 | 23,307 | 2,577 |
| 2014 | 7,454 | 4,401 | 21,191 | 1,382 | 2,013 | 22,899 | 2,420 |
| 2015 | 8,127 | 4,309 | 20,641 | 1,715 | 2,036 | 22,924 | 2,676 |
| 2016 | 8,291 | 4,482 | 20,381 | 1,635 | 2,025 | 22,677 | 2,535 |
| 2017 | 8,323 | 4,480 | 19,645 | 1,719 | 1,818 | 20,946 | 2,415 |
| 2018 | 7,600 | 4,568 | 19,903 | 2,842 | 1,899 | 21,711 | 2,619 |
| 2019 | 8,495 | 5,119 | 21,025 | 2,498 | 2,057 | 21,801 | 2,580 |
| 2020 | 8,635 | 5,344 | 21,708 | 2,761 | 2,096 | 22,413 | 2,689 |
| 2021 | 9,575 | 6,016 | 23,088 | 2,866 | 2,211 | 21,743 | 3,244 |
DOD = Department of Defense; DOE = Department of Energy; HHS = Department of Health and Human Services, excluding NIH; NASA = National Aeronautics and Space Administration; NIH = National Institutes of Health; NSF = National Science Foundation; USDA = Department of Agriculture.
Note(s):
In this figure, 2007 data represent data as collected in 2007. In 2014, the survey frame was updated after a comprehensive frame evaluation study. The study identified potentially eligible but not previously surveyed academic institutions in the United States with master's- or doctorate-granting programs in science, engineering, or health. A total of 151 newly eligible institutions were added, and 2 private for-profit institutions offering mostly practitioner-based graduate degrees were determined to be ineligible. In 2017, enrollment and financial support data were collected separately for master's and doctoral students. The list of disciplinary fields eligible for the Survey of Graduate Students and Postdoctorates in Science and Engineering was updated to align with the National Center for Science and Engineering Statistics Taxonomy of Disciplines. Two institutions became newly eligible, and 13 became ineligible. This figure excludes other federal agencies. S&E includes health fields.
Source(s):
National Center for Science and Engineering Statistics, Survey of Graduate Students and Postdoctorates in Science and Engineering.
Science and Engineering Indicators
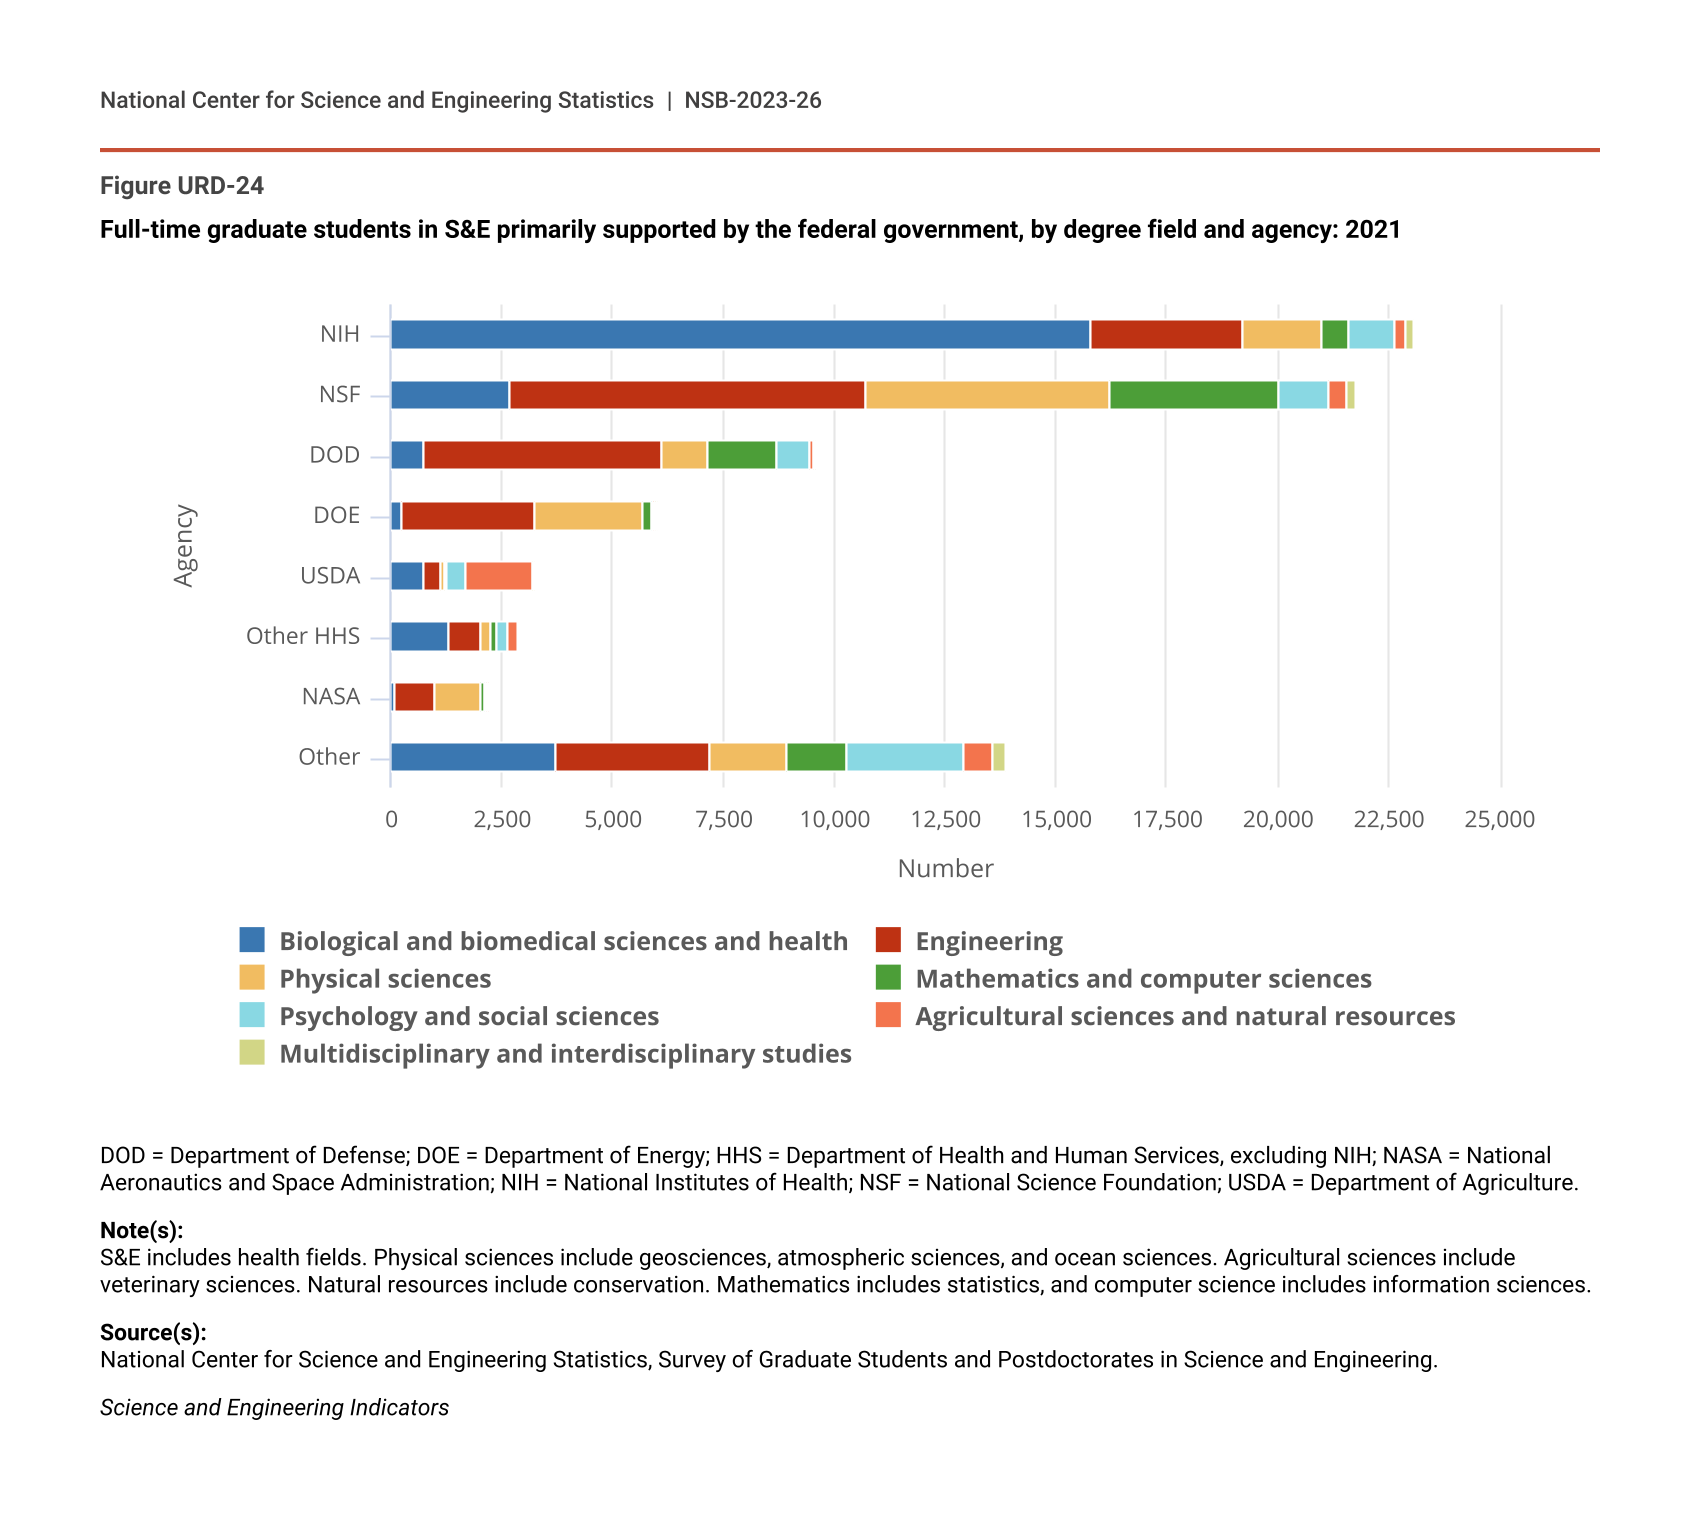
The largest numbers of federally supported S&E graduate students were in engineering (25,302), biological and biomedical sciences (20,832), and physical sciences (11,216). Together, these fields contained around 45% of total S&E graduate students but 69% of federally supported students (NCSES GSS 2021: Table 3-1). NSF supported substantial numbers of full-time graduate students across different fields, whereas over 68% of those supported by NIH were in biological and biomedical sciences and health. Of the full-time graduate students funded by DOD, 56% studied engineering, and more than 90% funded by DOE were in physical sciences and engineering (Figure URD-24).
Full-time graduate students in S&E primarily supported by the federal government, by degree field and agency: 2021
| Agency | Biological and biomedical sciences and health | Engineering | Physical sciences | Mathematics and computer sciences | Psychology and social sciences | Agricultural sciences and natural resources | Multidisciplinary and interdisciplinary studies |
|---|---|---|---|---|---|---|---|
| NIH | 15,811 | 3,416 | 1,794 | 586 | 1,051 | 233 | 197 |
| NSF | 2,671 | 8,027 | 5,528 | 3,809 | 1,112 | 440 | 156 |
| DOD | 746 | 5,358 | 1,032 | 1,538 | 778 | 69 | 54 |
| DOE | 214 | 3,017 | 2,457 | 178 | 40 | 72 | 38 |
| USDA | 763 | 384 | 54 | 87 | 382 | 1,535 | 39 |
| Other HHS | 1,329 | 714 | 212 | 154 | 245 | 196 | 16 |
| NASA | 83 | 898 | 1,060 | 69 | 43 | 49 | 9 |
| Other | 3,700 | 3,488 | 1,730 | 1,364 | 2,620 | 692 | 251 |
DOD = Department of Defense; DOE = Department of Energy; HHS = Department of Health and Human Services, excluding NIH; NASA = National Aeronautics and Space Administration; NIH = National Institutes of Health; NSF = National Science Foundation; USDA = Department of Agriculture.
Note(s):
S&E includes health fields. Physical sciences include geosciences, atmospheric sciences, and ocean sciences. Agricultural sciences include veterinary sciences. Natural resources include conservation. Mathematics includes statistics, and computer science includes information sciences.
Source(s):
National Center for Science and Engineering Statistics, Survey of Graduate Students and Postdoctorates in Science and Engineering.
Science and Engineering Indicators
Postdocs
The federal government supported more than half (51%, or 32,429) of S&E postdocs in 2021 (NCSES GSS 2021: Table 3-2). Research grants and contracts continue to be the primary mechanisms the federal government uses to fund postdocs. Among postdocs primarily funded by the federal government in 2021, 81% were funded by research grants, followed by traineeships (8%) and fellowships (7%), with the remainder funded by other mechanisms. The largest numbers of federally supported postdocs were in biological and biomedical sciences (11,372), clinical medicine (7,529), and engineering (4,235). These fields contained around 70% of total postdocs and around the same proportion of those funded by the federal government (NCSES GSS 2021: Table 3-2).
NIH supported the most postdocs of any federal agency (19,079) in 2021 (NCSES GSS 2021: Table 3-4). Other agencies supporting considerable numbers of postdocs included NSF (3,820), DOD (2,344), and DOE (2,228). In total, these four agencies accounted for 85% of federally supported postdocs. Federal agencies funded postdocs across fields in a manner consistent with their missions (NCSES GSS 2021: Table 3-4). NSF supported postdocs across numerous fields. The majority (80%) of postdocs supported by NIH were in biological and biomedical sciences or in clinical medicine. DOD funded postdocs primarily in engineering (40%) and physical sciences (17%), as did DOE (32% in engineering, 49% in physical sciences).
Institutional Support
Graduate Students
In 2021, institutions supported 39% of full-time S&E graduate students (212,869), more than any other source except self-support (NCSES GSS 2021: Table 3-1). Institutions supported 22% of master’s students (63,468) and 58% of doctoral students (149,401). Thus, around 70% of S&E graduate students supported by institutions were doctoral students. Institutions mainly used TAs to support graduate students; 38% of institutionally funded graduate students in 2021 had TAs. RAs (25%) and fellowships (17%) accounted for most of the rest.
The largest numbers of institutionally supported full-time graduate students were in engineering (44,890), biological and biomedical sciences (36,255), and social sciences (31,570). Across all fields and levels, institutions supported more students than the federal government did. For full-time S&E doctoral students, institutions supported higher numbers than any other source across fields (NCSES GSS 2021: Table 3-1). The percentage of full-time doctoral students supported by institutions varied from just under half for engineering to 80% for mathematics and statistics.
Postdocs
Institutions funded 22% of academic postdocs (13,633) in 2021 (NCSES GSS 2021: Table 3-2). The largest numbers of institutionally funded postdocs were in biological and biomedical sciences (3,408), clinical medicine (3,210), and engineering (1,923). In all broad fields except mathematics and statistics and social sciences, fewer postdocs received institutional support than federal support. In 2021, 37% of postdocs supported by institutions were funded from research grants, 13% were funded from fellowships, and 50% received support from traineeships and other sources.
Nonfederal Domestic Support
Various nonfederal domestic sources, including businesses and nonprofits, supported around 4% of S&E graduate students in 2021, including about 2% of master’s students (4,908) and 6% of doctoral students (14,107) (NCSES GSS 2021: Table 3-1). These sources supported the largest numbers of graduate students in engineering (6,841), biological and biomedical sciences (3,519), physical sciences (1,540), and computer and information sciences (1,510). The proportion of graduate students primarily supported by nonfederal domestic sources was largest in agricultural sciences (10%).
Nonfederal domestic sources supported 15% of total S&E postdocs (9,537) and between 10% and 21% of postdocs across fields (NCSES GSS 2021: Table 3-2). These sources funded the most postdocs in biological and biomedical sciences (2,925), clinical medicine (2,507), and engineering (1,352).
Foreign Support
In 2021, no more than 1% of S&E graduate students were supported by foreign sources, including around 1,000 master’s students (0.3%) and 2,580 doctoral students (1%). Foreign sources supported the most students in engineering (1,483) (NCSES GSS 2021: Table 3-1). They also supported around 2% of academic postdocs (1,354). Most of these postdocs were in clinical medicine (420), biological and biomedical sciences (380), and engineering (262) (NCSES GSS 2021: Table 3-2).