Institutions in S&E Higher Education

A variety of institutions provide the education necessary to maintain and enhance the U.S. S&E enterprise. Different types of institutions offer access to S&E education for students with varying resources and needs. Open access institutions that offer certificates and degrees below the bachelor’s degree are more available to students with limited financial resources or limited geographic mobility due to family obligations, for example. Four-year institutions include small, liberal arts colleges, which are largely private, nonprofit institutions; broad access public and for-profit universities focused largely on teaching; and selective public and private nonprofit universities that have significant research activity as well as teaching. Moreover, these institutions are interdependent: community colleges train the skilled technical workforce (STW)—people who work in occupations that require specific STEM knowledge and skills but do not require a bachelor’s degree—and research careers begin in these institutions as well. Research universities train community college faculty as well as the scientists and engineers who develop technologies used by skilled technical workers.

In academic year 2021–22, about 6,000 U.S. institutions conferred postsecondary education awards, including certificates and associate’s, bachelor’s, master’s, and doctoral degrees (Table HED-1). In addition to the level of awards they confer, institutions vary by control (e.g., whether they are public or private entities and, among private institutions, whether they are for-profit or nonprofit). About a third of all institutions offered awards that required less than 2 years to complete but were not degrees, and most of these (1,600 out of 2,000) were for-profit institutions. In contrast, 60% of doctoral institutions were private nonprofit.

Institutions, by control and highest award conferred: 2021–22

(Number)
Highest award conferredAll institutionsPublicPrivate nonprofitPrivate for profit
All institutions6,0451,9741,7922,279
Certificates1,9853031151,567
Associate's degrees1,31185085376
Bachelor's degrees687229321137
Master's degrees836168534134
Doctoral degrees1,22642473765
Note(s):

Data are based on institutions eligible to participate in Title IV federal financial aid programs. Certificates include only awards of less than 2 academic years below the associate's degree level. Control refers to whether an institution is operated by publicly elected or appointed officials (public control) or by privately elected or appointed officials and derives its major source of funds from private sources (private control).

Source(s):

National Center for Education Statistics, Integrated Postsecondary Education Data System (IPEDS), Institutional Characteristics Survey.

Science and Engineering Indicators

Institutions’ contributions to S&E and S&E-related knowledge and skill development vary by level and control. Training that leads to employment in the STW, which includes education in both S&E and S&E-related fields, is usually available at certificate- and associate’s-level institutions. Doctoral-level institutions train scientists and college and university faculty to lead S&E and S&E-related research and to teach undergraduates and graduate students. These institutions also provide infrastructure for research and development (R&D) by faculty and students. Associate’s-, bachelor’s-, and master’s-level institutions train students for specific occupations, educate them in the S&E disciplines and research methods necessary for careers in S&E research and teaching at the elementary and secondary levels, and also conduct and support original R&D. S&E degree holders find employment across all sectors of the economy, with most individuals with an S&E bachelor’s degree or higher working at for-profit businesses (see forthcoming Indicators 2024 report “The STEM Labor Force: Scientists, Engineers, and Skilled Technical Workers”).

Minority-Serving Institutions

Relative to all postsecondary institutions, MSIs serve larger proportions of students from specific racial and ethnic groups. The 35 American Indian tribally controlled colleges and universities (TCCUs) and 100 historically Black colleges and universities (HBCUs) extant in 2021 were defined as such by the Higher Education Act based on the populations of students they have served since their founding (Table SHED-1). Other types of MSIs—including Alaska Native and Native Hawaiian–serving institutions (ANNHSIs, 16 institutions), Asian American and Native American Pacific Islander–serving institutions (AANAPISIs, 191 institutions), Hispanic-serving institutions (HSIs, 516 institutions), Native American–serving nontribal institutions (NASNTIs, 30 institutions), and predominantly Black institutions (PBIs, 64 institutions)—are defined by the racial and ethnic distribution of their students; designation as one of these institutions can vary from year to year, depending on enrollment. In 2021, there were 811 MSI institutions in the United States, 139 of which had more than one MSI designation. All ANNHSIs, for example, have at least one other MSI designation as well.

In 2021, half of HBCUs were public institutions, and at least two-thirds of the institutions in each of the other MSI categories were also public; the remainder were private nonprofit. None of the MSIs in these categories grant only certificates, but all MSI categories had institutions at the associate’s level or above, with the exception of TCCUs, which had no doctoral institution.

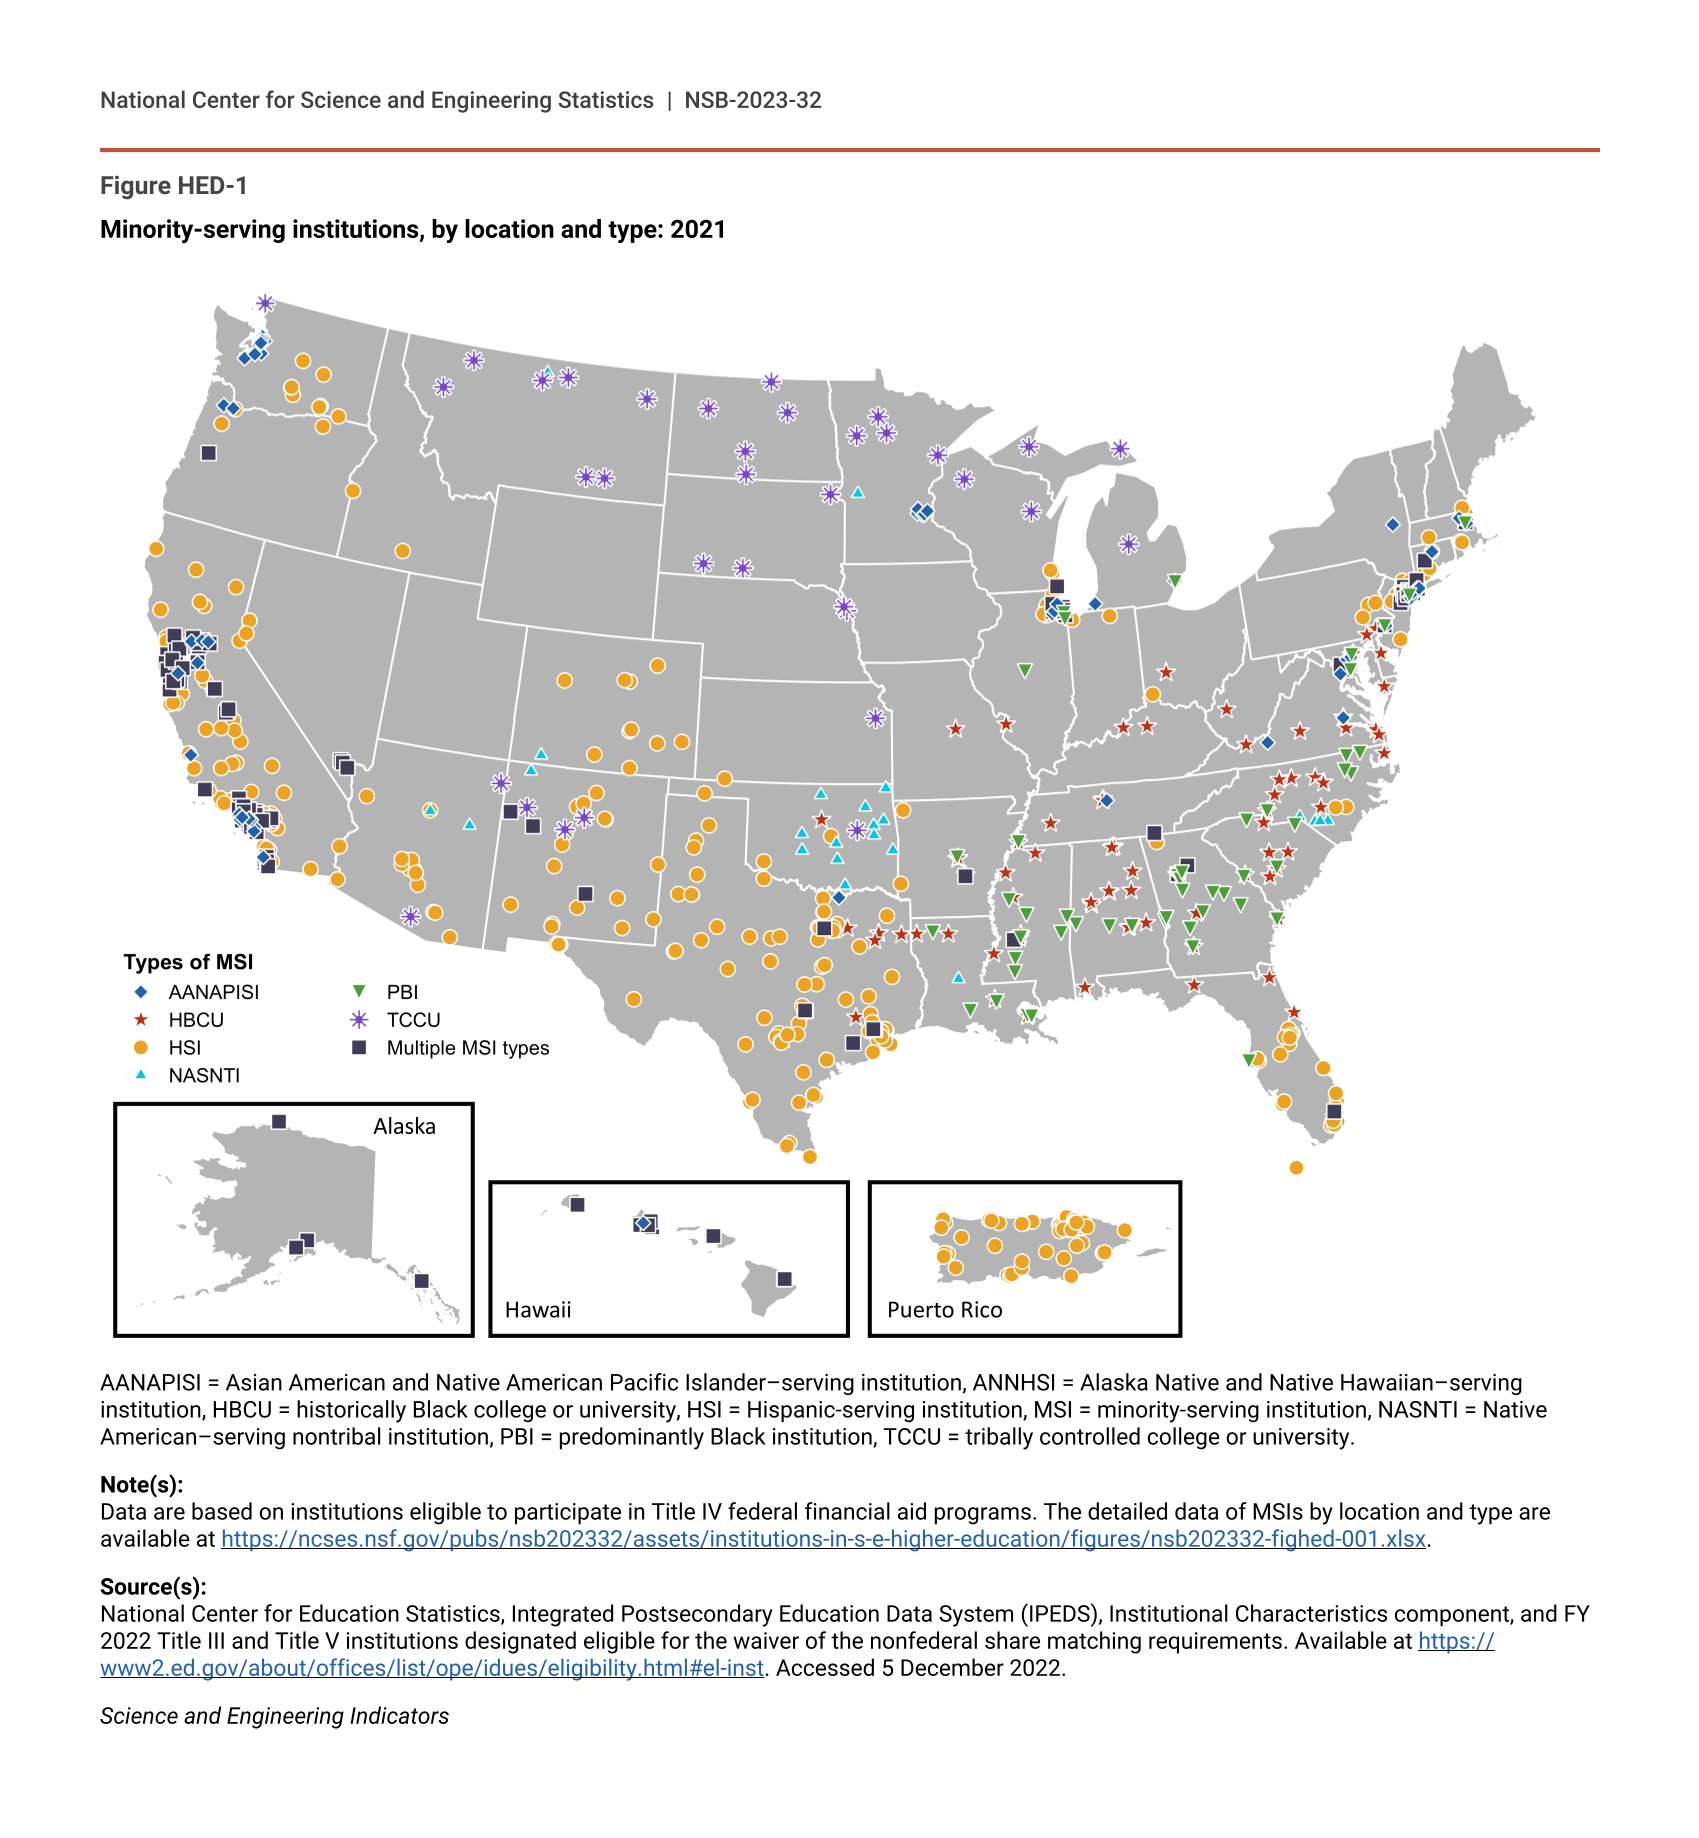
Reflecting the geographic distribution of the racial and ethnic groups they serve, different categories of MSIs cluster in different areas of the country (Figure HED-1). HBCUs and PBIs, for example, cluster in Southeastern states; NASNTIs tend to be in Oklahoma and the Southwest; and TCCUs are found largely in the upper Midwest and northern Plains states.

Minority-serving institutions, by location and type: 2021

Figure HED-1. Minority-serving institutions, by location and type: 2021.
(Location and type)
(Location and type)
Institution nameCityStateANNHSIsAANAPISIsHSIsHBCUsNASNTIsPBIsTCCUsNumber of MSI designationsLongitudeLatitudeUNITID
Alaska Christian C.SoldotnaAK10001002-15160442523
Alaska Pacific U.AnchorageAK10001002-15061102669
Ilisagvik C.BarrowAK11000013-15771434584
U. Alaska SoutheastJuneauAK10001002-13558102632
Alabama A&M U.NormalAL00010001-8735100654
Alabama State U.MontgomeryAL00010001-8632100724
Auburn U. MontgomeryMontgomeryAL00000101-8632100830
Bishop State Community C.MobileAL00010001-8831102030
Chattahoochee Valley Community C.Phenix CityAL00000101-8532101028
Faulkner U.MontgomeryAL00000101-8632101189
Gadsden State Community C.GadsdenAL00010001-8634101240
George C. Wallace State Community C.-SelmaSelmaAL00000101-8732101301
H. Councill Trenholm State Community C.MontgomeryAL00010001-8632102313
J. F. Drake State Community and Technical C.HuntsvilleAL00010001-8735101462
Lawson State Community C.BirminghamAL00010001-8733101569
Miles C.FairfieldAL00010001-8733101675
Oakwood U.HuntsvilleAL00010001-8735101912
Shelton State Community C.TuscaloosaAL00010001-8833102067
Stillman C.TuscaloosaAL00010001-8833102270
Talladega C.TalladegaAL00010001-8633102298
Tuskegee U.TuskegeeAL00010001-8632102377
U. West AlabamaLivingstonAL00000101-8833101587
Arkansas Baptist C.Little RockAR00010001-9235106306
Cossatot Community C. U. ArkansasDe QueenAR00100001-9434106795
Ecclesia C.SpringdaleAR00100001-9436446233
Philander Smith C.Little RockAR00010001-9235107600
Shorter C.North Little RockAR00010001-9235107840
Southeast Arkansas C.Pine BluffAR00100102-9234107637
U. Arkansas at Pine BluffPine BluffAR00010001-9234106412
U. Arkansas-Pulaski Technical C.North Little RockAR00000101-9235107664
American Samoa Community C.Pago PagoAS01000001-171-14240736
Arizona Christian U.GlendaleAZ00100001-11234105899
Arizona Western C.YumaAZ00100001-11433104160
Central Arizona C.CoolidgeAZ00100001-11233104346
Chandler-Gilbert Community C.ChandlerAZ00100001-11233364025
Cochise County Community C. DistrictSierra VistaAZ00100001-11032104425
Coconino Community C.FlagstaffAZ00001001-11235404426
Dine C.TsaileAZ00000011-10936105297
Estrella Mountain Community C.AvondaleAZ00100001-11233384333
GateWay Community C.PhoenixAZ00100001-11233105145
Glendale Community C.GlendaleAZ00100001-11234104708
Mesa Community C.MesaAZ00100001-11233105154
Mohave Community C.KingmanAZ00100001-11435105206
Northern Arizona U.FlagstaffAZ00100001-11235105330
Northland Pioneer C.HolbrookAZ00001001-11035105349
Ottawa U.-PhoenixPhoenixAZ00100001-11234105367
Ottawa U.-SurpriseSurpriseAZ00100001-11234464226
Paradise Valley Community C.PhoenixAZ00100001-11234364016
Phoenix C.PhoenixAZ00100001-11233105428
Pima Community C.TucsonAZ00100001-11132105525
Rio Salado C.TempeAZ00100001-11233105668
South Mountain Community C.PhoenixAZ00100001-11233105792
Tohono O'odham Community C.SellsAZ00000011-11232442781
U. ArizonaTucsonAZ00100001-11132104179
Allan Hancock C.Santa MariaCA00100001-12035108807
America Evangelical U.GardenaCA01000001-11834490081
American River C.SacramentoCA01100002-12139109208
Antelope Valley Community C. DistrictLancasterCA00100001-11835109350
Antioch U.-Santa BarbaraSanta BarbaraCA00100001-12034245847
Azusa Pacific U.AzusaCA01100002-11834109785
Bakersfield C.BakersfieldCA00100001-11935109819
Barstow Community C.BarstowCA00100001-11735109907
Berkeley City C.BerkeleyCA01100002-12238125170
Biola U.La MiradaCA01000001-11834110097
Butte C.OrovilleCA00100001-12240110246
C. AlamedaAlamedaCA01100002-12238108667
C. CanyonsSanta ClaritaCA01100002-11934111461
C. San MateoSan MateoCA01100002-12238122791
C. SequoiasVisaliaCA00100001-11936123217
Cabrillo C.AptosCA00100001-12237110334
California Baptist U.RiversideCA00100001-11734110361
California Christian C.FresnoCA00100001-12037110918
California Lutheran U.Thousand OaksCA00100001-11934110413
California Polytechnic State U.-San Luis ObispoSan Luis ObispoCA01000001-12135110422
California State Polytechnic U.-HumboldtArcataCA00100001-12441115755
California State Polytechnic U.-PomonaPomonaCA01100002-11834110529
California State U.-BakersfieldBakersfieldCA00100001-11935110486
California State U.-Channel IslandsCamarilloCA00100001-11934441937
California State U.-ChicoChicoCA00100001-12240110538
California State U.-Dominguez HillsCarsonCA00100001-11834110547
California State U.-East BayHaywardCA01100002-12238110574
California State U.-FresnoFresnoCA01100002-12037110556
California State U.-FullertonFullertonCA01100002-11834110565
California State U.-Long BeachLong BeachCA01100002-11834110583
California State U.-Los AngelesLos AngelesCA01100002-11834110592
California State U.-Monterey BaySeasideCA00100001-12237409698
California State U.-NorthridgeNorthridgeCA00100001-11934110608
California State U.-SacramentoSacramentoCA01100002-12139110617
California State U.-San BernardinoSan BernardinoCA00100001-11734110510
California State U.-San MarcosSan MarcosCA00100001-11733366711
California State U.-StanislausTurlockCA00100001-12138110495
Canada C.Redwood CityCA01100002-12237111434
Casa Loma C.-Van NuysVan NuysCA01100002-11834111638
Cerritos C.NorwalkCA00100001-11834111887
Cerro Coso Community C.RidgecrestCA00100001-11836111896
Chaffey C.Rancho CucamongaCA00100001-11834111939
Charles R. Drew U. Medicine and ScienceLos AngelesCA00010001-11834111966
Chicago School of Professional Psychology at Los AngelesLos AngelesCA00100001-11834455664
Citrus C.GlendoraCA00100001-11834112172
Clovis Community C.FresnoCA01100002-12037489201
Coastline Community C.Fountain ValleyCA01100002-11834112385
Compton C.ComptonCA00100001-11834112686
Concordia U.-IrvineIrvineCA01100002-11834112075
Cosumnes River C.SacramentoCA01100002-12138113096
Cuesta C.San Luis ObispoCA00100001-12135113193
Cuyamaca C.El CajonCA00100001-11733113218
Cypress C.CypressCA01100002-11834113236
Dominican U. CaliforniaSan RafaelCA01100002-12338113698
El Camino Community C. DistrictTorranceCA01100002-11834113980
Epic Bible C. and Graduate SchoolSacramentoCA01000001-12139124487
Evergreen Valley C.San JoseCA01100002-12237114266
Folsom Lake C.FolsomCA01000001-12139444219
Fresno City C.FresnoCA01100002-12037114789
Fresno Pacific U.FresnoCA00100001-12037114813
Fullerton C.FullertonCA01100002-11834114859
Gavilan C.GilroyCA00100001-12237114938
Glendale Community C.GlendaleCA00100001-11834115001
Golden West C.Huntington BeachCA01100002-11834115126
Grace Mission U.FullertonCA01000001-11834481058
Grossmont C.El CajonCA00100001-11733115296
Hartnell C.SalinasCA00100001-12237115393
Holy Names U.OaklandCA01100002-12238115728
Homestead SchoolsTorranceCA01000001-11834457086
Hope International U.FullertonCA00100001-11834120537
Humphreys U.-Stockton and Modesto CampusesStocktonCA01100002-12138115773
Imperial Valley C.ImperialCA00100001-11633115861
Irvine Valley C.IrvineCA01000001-11834116439
John Paul the Great Catholic U.EscondidoCA00100001-11733462354
La Sierra U.RiversideCA01100002-11834117627
Laguna C. Art and DesignLaguna BeachCA01000001-11834117168
Lake Tahoe Community C.South Lake TahoeCA00100001-12039117195
Las Positas C.LivermoreCA01100002-12238366401
Lassen Community C.SusanvilleCA00100001-12140117274
Life Pacific U.San DimasCA00100001-11834117104
Loma Linda U.Loma LindaCA01100002-11734117636
Long Beach City C.Long BeachCA01100002-11834117645
Los Angeles City C.Los AngelesCA01100002-11834117788
Los Angeles Harbor C.WilmingtonCA01100002-11834117690
Los Angeles Mission C.SylmarCA00100001-11834117867
Los Angeles Pacific U.San DimasCA00100001-11834474863
Los Angeles Pierce C.Woodland HillsCA00100001-11934117706
Los Angeles Southwest C.Los AngelesCA00100102-11834117715
Los Angeles Trade Technical C.Los AngelesCA00100001-11834117724
Los Angeles Valley C.Valley GlenCA00100001-11834117733
Marymount California U.Rancho Palos VerdesCA00100001-11834118541
Mendocino C.UkiahCA00100001-12339118684
Merced C.MercedCA00100001-12037118718
Merritt C.OaklandCA01100002-12238118772
MiraCosta C.OceansideCA00100001-11733118912
Mission C.Santa ClaraCA01100002-12237118930
Modesto Junior C.ModestoCA00100001-12138118976
Monterey Peninsula C.MontereyCA00100001-12237119067
Moorpark C.MoorparkCA00100001-11934119137
Moreno Valley C.Moreno ValleyCA00100001-11734460394
Mount Saint Mary's U.Los AngelesCA01100002-11834119173
Mt. San Antonio C.WalnutCA01100002-11834119164
Mt. San Jacinto Community C. DistrictSan JacintoCA00100001-11734119216
Napa Valley C.NapaCA01100002-12238119331
National U.La JollaCA00100001-11733119605
Norco C.NorcoCA01100002-11834460464
Notre Dame de Namur U.BelmontCA01100002-12238120184
Ohlone C.FremontCA01000001-12238120290
Orange Coast C.Costa MesaCA01100002-11834120342
Otis C. Art and DesignLos AngelesCA01000001-11834120403
Oxnard C.OxnardCA00100001-11934120421
Pacific Oaks C.PasadenaCA00100001-11834120768
Pacific Union C.AngwinCA01100002-12239120865
Palo Alto U.Palo AltoCA01100002-12237120698
Palo Verde C.BlytheCA00100001-11534120953
Palomar C.San MarcosCA00100001-11733120971
Pasadena City C.PasadenaCA01100002-11834121044
Porterville C.PortervilleCA00100001-11936121363
Presbyterian Theological Seminary in AmericaSanta Fe SpringsCA01000001-11834490045
Providence Christian C.PasadenaCA00100001-11834455770
Reedley C.ReedleyCA00100001-11937117052
Rio Hondo C.WhittierCA00100001-11834121886
Riverside City C.RiversideCA00100001-11734121901
Sacramento City C.SacramentoCA01100002-12139122180
Saddleback C.Mission ViejoCA01100002-11834122205
Saint Mary's C. CaliforniaMoragaCA01100002-12238123554
San Bernardino Valley C.San BernardinoCA00100001-11734123527
San Diego Christian C.SanteeCA00100001-11733112084
San Diego City C.San DiegoCA01100002-11733122339
San Diego Mesa C.San DiegoCA01100002-11733122375
San Diego Miramar C.San DiegoCA01100002-11733122384
San Diego State U.San DiegoCA01100002-11733122409
San Francisco State U.San FranciscoCA01100002-12238122597
San Joaquin Delta C.StocktonCA01100002-12138122658
San Jose City C.San JoseCA01100002-12237122746
San Jose State U.San JoseCA01100002-12237122755
Santa Ana C.Santa AnaCA00100001-11834121619
Santa Barbara City C.Santa BarbaraCA00100001-12034122889
Santa Monica C.Santa MonicaCA00100001-11834122977
Santa Rosa Junior C.Santa RosaCA00100001-12338123013
Santiago Canyon C.OrangeCA00100001-11834399212
Simpson U.ReddingCA00100001-12241123457
Solano Community C.FairfieldCA01100002-12238123563
Sonoma State U.Rohnert ParkCA00100001-12338123572
Southern California SeminaryEl CajonCA00100001-11733117575
Southwestern C.Chula VistaCA01100002-11733123800
SUM Bible C. and Theological SeminaryEl Dorado HillsCA01100002-12139447953
Taft C.TaftCA00100001-11935124113
U. California-DavisDavisCA01000001-12239110644
U. California-IrvineIrvineCA01100002-11834110653
U. California-MercedMercedCA01100002-12037445188
U. California-RiversideRiversideCA01100002-11734110671
U. California-San DiegoLa JollaCA01000001-11733110680
U. California-Santa BarbaraSanta BarbaraCA01100002-12034110705
U. California-Santa CruzSanta CruzCA01100002-12237110714
U. La VerneLa VerneCA00100001-11834117140
U. PacificStocktonCA01000001-12138120883
U. RedlandsRedlandsCA00100001-11734121691
U. Saint KatherineSan MarcosCA00100001-11733488785
U. WestRosemeadCA00100001-11834449870
Vanguard U. Southern CaliforniaCosta MesaCA00100001-11834123651
Ventura C.VenturaCA00100001-11934125028
West Hills C.-CoalingaCoalingaCA00100001-12036125462
West Hills C.-LemooreLemooreCA00100001-12036448594
West Los Angeles C.Culver CityCA00100001-11834125471
West Valley C.SaratogaCA01100002-12237125499
Whittier C.WhittierCA00100001-11834125763
Woodbury U.BurbankCA01100002-11834125897
Woodland Community C.WoodlandCA01100002-12239455512
World Mission U.Los AngelesCA01100002-11834401223
Adams State U.AlamosaCO00100001-10637126182
Colorado Mountain C.Glenwood SpringsCO00100001-10740126711
Colorado State U. PuebloPuebloCO00100001-10538128106
Community C. AuroraAuroraCO00100001-10540126863
Community C. DenverDenverCO00100001-10540126942
Fort Lewis C.DurangoCO00001001-10837127185
Lamar Community C.LamarCO00100001-10338127389
Metropolitan State U. DenverDenverCO00100001-10540127565
Morgan Community C.Fort MorganCO00100001-10440127617
Otero Junior C.La JuntaCO00100001-10438127778
Pueblo Community C.PuebloCO00100001-10538127884
Trinidad State C.TrinidadCO00100001-10537128258
Capital Community C.HartfordCT00100001-7342129367
Gateway Community C.New HavenCT00100001-7341130396
Housatonic Community C.BridgeportCT00100001-7341129543
U. BridgeportBridgeportCT00100001-7341128744
U. Connecticut-Hartford CampusHartfordCT01000001-7342463056
U. Connecticut-StamfordStamfordCT01100002-7441436836
U. Connecticut-Waterbury CampusWaterburyCT01100002-7342436818
Howard U.WashingtonDC00010001-7739131520
Trinity Washington U.WashingtonDC00100102-7739131876
U. District of ColumbiaWashingtonDC00010001-7739131399
Delaware State U.DoverDE00010001-7639130934
AdventHealth U.OrlandoFL00100001-8129133872
Albizu U.-MiamiMiamiFL00100001-8026132842
Altierus Career C.-TampaTampaFL00100001-8228137801
Ana G. Mendez U.OrlandoFL00100001-8128483595
Barry U.MiamiFL00100001-8026132471
Bethune-Cookman U.Daytona BeachFL00010001-8129132602
Broward C.Fort LauderdaleFL00100001-8026132709
C. Florida KeysKey WestFL00100001-8225133960
City C.-MiamiMiamiFL00100001-8026434539
Edward Waters U.JacksonvilleFL00010001-8230133526
Florida Agricultural and Mechanical U.TallahasseeFL00010001-8430133650
Florida Atlantic U.Boca RatonFL00100001-8026133669
Florida International U.MiamiFL00100001-8026133951
Florida Memorial U.Miami GardensFL00010001-8026133979
Florida SouthWestern State C.Fort MyersFL00100001-8227133508
Hillsborough Community C.TampaFL00100001-8228134495
Hodges U.Fort MyersFL00100001-8227367884
Indian River State C.Fort PierceFL00100001-8027134608
Johnson U. FloridaKissimmeeFL00100001-8128132879
Keiser U.-Ft. LauderdaleFort LauderdaleFL00100001-8026135081
Miami Dade C.MiamiFL00100001-8026135717
Nova Southeastern U.Fort LauderdaleFL01100002-8026136215
Palm Beach State C.Lake WorthFL00100001-8027136358
Polk State C.Winter HavenFL00100001-8228136516
Polytechnic U. Puerto Rico-MiamiMiamiFL00100001-8026456481
Polytechnic U. Puerto Rico-OrlandoOrlandoFL00100001-8129456490
Seminole State C. FloridaSanfordFL00100001-8129137209
St. Thomas U.Miami GardensFL00100001-8026137476
Trinity International U.-FloridaMiamiFL00100001-8026135610
U. Central FloridaOrlandoFL00100001-8129132903
Ultimate Medical AcademyClearwaterFL00000101-8328441371
Valencia C.OrlandoFL00100001-8129138187
C. Micronesia-FSMPohnpeiFM010000011587243638
Albany State U.AlbanyGA00010001-8432138716
Albany Technical C.AlbanyGA00000101-8432138682
Atlanta Metropolitan State C.AtlantaGA00000101-8434138901
Atlanta Technical C.AtlantaGA00000101-8434138840
Augusta Technical C.AugustaGA00000101-8233138956
Beulah Heights U.AtlantaGA01000001-8434139153
Central Georgia Technical C.Warner RobinsGA00000101-8433483045
Clark Atlanta U.AtlantaGA00010001-8434138947
Clayton State U.MorrowGA00000101-8434139311
Columbus Technical C.ColumbusGA00000101-8533139357
Dalton State C.DaltonGA00100001-8535139463
East Georgia State C.SwainsboroGA00000101-8233139621
Fort Valley State U.Fort ValleyGA00010001-8433139719
Georgia Gwinnett C.LawrencevilleGA01100002-8434447689
Georgia Military C.MilledgevilleGA00000101-8333485111
Georgia Piedmont Technical C.ClarkstonGA00000101-8434244446
Georgia State U.AtlantaGA01000102-8434139940
Georgia State U.-Perimeter C.AtlantaGA01000102-8434244437
Morehouse C.AtlantaGA00010001-8434140553
Morehouse School of MedicineAtlantaGA00010001-8434140562
Oconee Fall Line Technical C.SandersvilleGA00000101-8333420431
Paine C.AugustaGA00010001-8233140720
Savannah State U.SavannahGA00010001-8132140960
Savannah Technical C.SavannahGA00000101-8132140942
South Georgia Technical C.AmericusGA00000101-8432141006
Southern Crescent Technical C.GriffinGA00000101-8433139986
Spelman C.AtlantaGA00010001-8434141060
Guam Community C.MangilaoGU0100000114513240745
Pacific Islands U.MangilaoGU0100000114513439862
U. GuamMangilaoGU0100000114513240754
Chaminade U. HonoluluHonoluluHI11000002-15821141486
Hawaii Community C.HiloHI11000002-15520383190
Hawaii Pacific U.HonoluluHI11000002-15821141644
Honolulu Community C.HonoluluHI11000002-15821141680
Kapiolani Community C.HonoluluHI11000002-15821141796
Kauai Community C.LihueHI11000002-15922141802
Leeward Community C.Pearl CityHI01000001-15821141811
Pacific Rim Christian U.HonoluluHI11000002-15821457484
U. Hawaii at HiloHiloHI11000002-15520141565
U. Hawaii at ManoaHonoluluHI11000002-15821141574
U. Hawaii Maui C.KahuluiHI11000002-15621141839
U. Hawaii-West OahuKapoleiHI11000002-15821141981
Windward Community C.KaneoheHI11000002-15821141990
C. Southern IdahoTwin FallsID00100001-11443142559
Aurora U.AuroraIL00100001-8842143118
Benedictine U.LisleIL01000001-8842145619
C. DuPageGlen EllynIL01100002-8842144865
C. Lake CountyGrayslakeIL00100001-8842146472
Chicago School of Professional Psychology at ChicagoChicagoIL00100001-8842143978
Chicago State U.ChicagoIL00000101-8842144005
City C. Chicago-Harry S Truman C.ChicagoIL01100002-8842144184
City C. Chicago-Kennedy-King C.ChicagoIL00000101-8842144157
City C. Chicago-Malcolm X C.ChicagoIL00100102-8842144166
City C. Chicago-Olive-Harvey C.ChicagoIL00100102-8842144175
City C. Chicago-Richard J Daley C.ChicagoIL00100001-8842144193
City C. Chicago-Wilbur Wright C.ChicagoIL00100001-8842144218
City C. of Chicago-Harold Washington C.ChicagoIL00100001-8842144209
Concordia U.-ChicagoRiver ForestIL00100001-8842144351
Dominican U.River ForestIL00100001-8842148496
Elgin Community C.ElginIL00100001-8842144944
Elmhurst U.ElmhurstIL00100001-8842144962
Judson U.ElginIL00100001-8842146339
Lincoln C.LincolnIL00000101-8940146676
Morton C.CiceroIL00100001-8842147411
National Louis U.ChicagoIL00100001-8842147536
National U. Health SciencesLombardIL01000001-8842147590
North Park U.ChicagoIL00100001-8842147679
Northeastern Illinois U.ChicagoIL00100001-8842147776
Oak Point U.Oak BrookIL01100002-8842149763
Oakton Community C.Des PlainesIL01000001-8842147800
Roosevelt U.ChicagoIL00100001-8842148487
Saint Xavier U.ChicagoIL00100001-8842148627
South Suburban C.South HollandIL00000101-8842149365
St. Augustine C.ChicagoIL00100001-8842148876
U. Illinois ChicagoChicagoIL01100002-8842145600
Waubonsee Community C.Sugar GroveIL00100001-8842149727
William Rainey Harper C.PalatineIL01100002-8842149842
Calumet C. Saint JosephWhitingIN00100001-8742150172
Goshen C.GoshenIN00100001-8642150668
Indiana U.-NorthwestGaryIN00100001-8742151360
Haskell Indian Nations U.LawrenceKS00000011-9539155140
Seward County Community C.LiberalKS00100001-10137155858
Kentucky State U.FrankfortKY00010001-8538157058
Simmons C. KentuckyLouisvilleKY00010001-8638461759
Baton Rouge Community C.Baton RougeLA00000101-9130437103
Delgado Community C.New OrleansLA00000101-9030158662
Dillard U.New OrleansLA00010001-9030158802
Grambling State U.GramblingLA00010001-9333159009
Louisiana State U.-AlexandriaAlexandriaLA00001001-9231159382
Northwest Louisiana Technical Community C.MindenLA00000101-9333160010
Nunez Community C.ChalmetteLA00000101-9030158884
South Louisiana Community C.LafayetteLA00000101-9230434061
Southern U. and A&M C.Baton RougeLA00010001-9131160621
Southern U. New OrleansNew OrleansLA00010001-9030160630
Southern U. ShreveportShreveportLA00010001-9433160649
Xavier U. LouisianaNew OrleansLA00010001-9030160904
Benjamin Franklin Institute of TechnologyBostonMA00100001-7142165884
Bunker Hill Community C.BostonMA01100002-7142165112
Cambridge C.BostonMA01100002-7142165167
Holyoke Community C.HolyokeMA00100001-7342166133
Middlesex Community C.BedfordMA01000001-7143166887
North Shore Community C.DanversMA00100001-7143167312
Northern Essex Community C.HaverhillMA00100001-7143167376
Roxbury Community C.Roxbury CrossingMA00000101-7142167631
U. Massachusetts-BostonBostonMA01000001-7142166638
Urban C. BostonBostonMA01100002-7142429128
Baltimore City Community C.BaltimoreMD00000101-7739161864
Bowie State U.BowieMD00010001-7739162007
Coppin State U.BaltimoreMD00010001-7739162283
Howard Community C.ColumbiaMD01000001-7739162779
Montgomery C.RockvilleMD01100002-7739163426
Morgan State U.BaltimoreMD00010001-7739163453
Prince George's Community C.LargoMD00000101-7739163657
U. Maryland Eastern ShorePrincess AnneMD00010001-7638163338
U. Maryland-Baltimore CountyBaltimoreMD01000001-7739163268
C. Marshall IslandsMajuroMH010000011717376695
Andrews U.Berrien SpringsMI01000001-8642168740
Bay Mills Community C.BrimleyMI00000011-8546380359
Keweenaw Bay Ojibwa Community C.BaragaMI00000011-8947461315
Saginaw Chippewa Tribal C.Mount PleasantMI00000011-8544441070
Wayne County Community C. DistrictDetroitMI00000101-8342172635
Wayne State U.DetroitMI01000001-8342172644
Augsburg U.MinneapolisMN01000001-9345173045
Century C.White Bear LakeMN01000001-9345175315
Concordia U.-Saint PaulSaint PaulMN01000001-9345173328
Fond du Lac Tribal and Community C.CloquetMN00000011-9247380368
Herzing U.-MinneapolisSt. Louis ParkMN01000001-9345174154
Leech Lake Tribal C.Cass LakeMN00000011-9547413626
Metropolitan State U.Saint PaulMN01000001-9345174020
North Hennepin Community C.Brooklyn ParkMN01000001-9345174376
Red Lake Nation C.Red LakeMN00000011-9548491844
Saint Paul C.Saint PaulMN01000001-9345175041
St. Catherine U.Saint PaulMN01000001-9345175005
U. Minnesota-MorrisMorrisMN00001001-9646174251
White Earth Tribal and Community C.MahnomenMN00000011-9647434751
Harris-Stowe State U.Saint LouisMO00010001-9039177551
Lincoln U.Jefferson CityMO00010001-9239177940
Northern Marianas C.SaipanMP0100000114615240790
Alcorn State U.Alcorn StateMS00010001-9132175342
Belhaven U.JacksonMS00000101-9032175421
Coahoma Community C.ClarksdaleMS00010001-9134175519
Copiah-Lincoln Community C.WessonMS00000101-9032175573
East Mississippi Community C.ScoobaMS00000101-8833175652
Hinds Community C.RaymondMS00010102-9032175786
Holmes Community C.GoodmanMS00000101-9033175810
Jackson State U.JacksonMS00010001-9032175856
Meridian Community C.MeridianMS00000101-8932175935
Mississippi Delta Community C.MoorheadMS00000101-9133176008
Mississippi Valley State U.Itta BenaMS00010001-9034176044
Rust C.Holly SpringsMS00010001-8935176318
Southwest Mississippi Community C.SummitMS00000101-9031176354
Tougaloo C.TougalooMS00010001-9032176406
Aaniiih Nakoda C.HarlemMT00000011-10948180203
Blackfeet Community C.BrowningMT00000011-11349180054
Chief Dull Knife C.Lame DeerMT00000011-10746180160
Fort Peck Community C.PoplarMT00000011-10548180212
Little Big Horn C.Crow AgencyMT00000011-10746180328
Montana State U.-NorthernHavreMT00001001-11049180522
Salish Kootenai C.PabloMT00000011-11448180647
Stone Child C.Box ElderMT00000011-11048366340
Bennett C.GreensboroNC00010001-8036197993
Bladen Community C.DublinNC00001001-7935198011
Chowan U.MurfreesboroNC00000101-7736198303
Edgecombe Community C.TarboroNC00000101-7836198491
Elizabeth City State U.Elizabeth CityNC00010001-7636198507
Fayetteville State U.FayettevilleNC00010001-7935198543
Halifax Community C.WeldonNC00000101-7836198640
James Sprunt Community C.KenansvilleNC00100001-7835198729
Johnson & Wales U.-CharlotteCharlotteNC00000101-8135445708
Johnson C. Smith U.CharlotteNC00010001-8135198756
Livingstone C.SalisburyNC00010001-8036198862
North Carolina A&T State U.GreensboroNC00010001-8036199102
North Carolina Central U.DurhamNC00010001-7936199157
North Carolina Wesleyan C.Rocky MountNC00000101-7836199209
Richmond Community C.HamletNC00001001-8035199449
Robeson Community C.LumbertonNC00001001-7935199476
Saint Augustine's U.RaleighNC00010001-7936199582
Sampson Community C.ClintonNC00100001-7835199625
Shaw U.RaleighNC00010001-7936199643
U. North Carolina at PembrokePembrokeNC00001001-7935199281
Winston-Salem State U.Winston-SalemNC00010001-8036199999
Cankdeska Cikana Community C.Fort TottenND00000011-9948200208
Nueta Hidatsa Sahnish C.New TownND00000011-10248200086
Sitting Bull C.Fort YatesND00000011-10146200466
Turtle Mountain Community C.BelcourtND00000011-10049200527
United Tribes Technical C.BismarckND00000011-10147200554
Little Priest Tribal C.WinnebagoNE00000011-9642434016
Nebraska Indian Community C.MacyNE00000011-9642181419
Atlantic Cape Community C.Mays LandingNJ00100001-7539183655
Bergen Community C.ParamusNJ01100002-7441183743
Bloomfield C.BloomfieldNJ00100102-7441183822
Caldwell U.CaldwellNJ00100001-7441183910
Essex County C.NewarkNJ00100102-7441184481
Fairleigh Dickinson U.-Metropolitan CampusTeaneckNJ00100001-7441184603
Felician U.LodiNJ00100001-7441184612
Hudson County Community C.Jersey CityNJ00100001-7441184995
Kean U.UnionNJ00100001-7441185262
Middlesex C.EdisonNJ01100002-7441185536
Montclair State U.MontclairNJ00100001-7441185590
New Jersey City U.Jersey CityNJ00100001-7441185129
Passaic County Community C.PatersonNJ00100001-7441186034
Pillar C.NewarkNJ00100001-7441440794
Raritan Valley Community C.BranchburgNJ00100001-7541186645
Rutgers U.-CamdenCamdenNJ01000001-7540186371
Rutgers U.-NewarkNewarkNJ01100002-7441186399
Saint Elizabeth U.MorristownNJ00100001-7441186618
Saint Peter's U.Jersey CityNJ00100001-7441186432
Union County C.CranfordNJ00100001-7441187198
William Paterson U. New JerseyWayneNJ00100001-7441187444
Central New Mexico Community C.AlbuquerqueNM00100001-10735187532
Clovis Community C.ClovisNM00100001-10334187639
Eastern New Mexico U. Ruidoso Branch Community C.RuidosoNM00101002-10633383996
Eastern New Mexico U.-Roswell CampusRoswellNM00100001-10533187666
Institute of American Indian and Alaska Native Culture and Arts DevelopmentSanta FeNM00000011-10636187745
Luna Community C.Las VegasNM00100001-10536363633
Navajo Technical U.CrownpointNM00000011-10836187596
New Mexico Highlands U.Las VegasNM00100001-10536187897
New Mexico Institute of Mining and TechnologySocorroNM00100001-10734187967
New Mexico State U.-AlamogordoAlamogordoNM00100001-10633187994
New Mexico State U.-Dona AnaLas CrucesNM00100001-10732187620
New Mexico State U.-GrantsGrantsNM00101002-10835188021
New Mexico State U.-Main CampusLas CrucesNM00100001-10732188030
Northern New Mexico C.EspanolaNM00100001-10636188058
San Juan C.FarmingtonNM00001001-10837188100
Santa Fe Community C.Santa FeNM00100001-10636188137
Southeast New Mexico C.CarlsbadNM00100001-10432188003
Southwestern Indian Polytechnic InstituteAlbuquerqueNM00000011-10735188216
U. New Mexico-Gallup CampusGallupNM00101002-10936187958
U. New Mexico-Los Alamos CampusLos AlamosNM00100001-10636187976
U. New Mexico-Main CampusAlbuquerqueNM00100001-10735187985
U. New Mexico-Taos CampusRanchos de TaosNM00100001-10636188225
U. New Mexico-Valencia County CampusLos LunasNM00100001-10735188049
U. SouthwestHobbsNM00100001-10333188182
Western New Mexico U.Silver CityNM00100001-10833188304
C. Southern NevadaLas VegasNV01100002-11536182005
Nevada State C.HendersonNV01100002-11536441900
Truckee Meadows Community C.RenoNV00100001-12040182500
U. Nevada-Las VegasLas VegasNV01100002-11536182281
Western Nevada C.Carson CityNV00100001-12039182564
Adelphi U.Garden CityNY01000001-7441188429
American Academy McAllister Institute of Funeral ServiceNew YorkNY00100001-7441188687
Boricua C.New YorkNY00100001-7441189413
C. Mount Saint VincentBronxNY00100001-7441193399
C. Staten Island CUNYStaten IslandNY01100002-7441190558
CUNY Bernard M. Baruch C.New YorkNY01100002-7441190512
CUNY Bronx Community C.BronxNY00100001-7441190530
CUNY Brooklyn C.BrooklynNY01000001-7441190549
CUNY City C.New YorkNY01100002-7441190567
CUNY Hostos Community C.BronxNY00100001-7441190585
CUNY Hunter C.New YorkNY01100002-7441190594
CUNY John Jay C. Criminal JusticeNew YorkNY01100002-7441190600
CUNY Kingsborough Community C.BrooklynNY01000001-7441190619
CUNY LaGuardia Community C.Long Island CityNY01100002-7441190628
CUNY Lehman C.BronxNY00100001-7441190637
CUNY Medgar Evers C.BrooklynNY00000101-7441190646
CUNY New York City C. TechnologyBrooklynNY01100002-7441190655
CUNY Queens C.QueensNY01100002-7441190664
CUNY Queensborough Community C.BaysideNY01100002-7441190673
CUNY Stella and Charles Guttman Community C.New YorkNY00100001-7441475565
CUNY York C.JamaicaNY01100103-7441190691
Dominican C. BlauveltOrangeburgNY00100001-7441190761
Long Island U.BrookvilleNY01000001-7441192448
Manhattanville C.PurchaseNY00100001-7441192749
Mercy C.Dobbs FerryNY00100001-7441193016
Metropolitan C. New YorkNew YorkNY00100001-7441190114
Nassau Community C.Garden CityNY00100001-7441193478
New York C. Health ProfessionsSyossetNY01000001-7441418126
New York Institute of TechnologyOld WestburyNY01000001-7441194091
Nyack C.New YorkNY00100001-7441194161
Rockland Community C.SuffernNY00100001-7441195058
Schenectady County Community C.SchenectadyNY01000001-7443195322
St. Francis C.Brooklyn HeightsNY00100001-7441195173
St. John's U.-New YorkQueensNY01000001-7441195809
SUNY at Purchase C.PurchaseNY00100001-7441196219
SUNY C. at Old WestburyOld WestburyNY01100002-7441196237
SUNY Westchester Community C.ValhallaNY00100001-7441197294
Vaughn C. Aeronautics and TechnologyFlushingNY01100002-7441188340
Central State U.WilberforceOH00010001-8440201690
Union Institute & U.CincinnatiOH00100001-8439206279
Wilberforce U.WilberforceOH00010001-8440206491
Bacone C.MuskogeeOK00001001-9536206817
C. Muscogee NationOkmulgeeOK00000011-9636480967
Carl Albert State C.PoteauOK00001001-9535206923
Connors State C.WarnerOK00001001-9535206996
East Central U.AdaOK00001001-9735207041
Family of Faith Christian U.ShawneeOK00100001-9735443058
Langston U.LangstonOK00010001-9736207209
Northeastern Oklahoma A&M C.MiamiOK00001001-9537207290
Northeastern State U.TahlequahOK00001001-9536207263
Northern Oklahoma C.TonkawaOK00001001-9737207281
Oklahoma Panhandle State U.GoodwellOK00100001-10237207351
Oklahoma State U. Institute of TechnologyOkmulgeeOK00001001-9636207564
Redlands Community C.El RenoOK00001001-9836207069
Rogers State U.ClaremoreOK00001001-9636207661
Seminole State C.SeminoleOK00001001-9735207740
Southeastern Oklahoma State U.DurantOK00001001-9634207847
U. Science and Arts of OklahomaChickashaOK00001001-9835207722
Western Oklahoma State C.AltusOK00100001-9935208035
Blue Mountain Community C.PendletonOR00100001-11946208275
Chemeketa Community C.SalemOR00100001-12345208390
New Hope Christian C.-EugeneEugeneOR01100002-12344208725
Pacific U.Forest GroveOR01000001-12346209612
Portland State U.PortlandOR01000001-12346209807
Treasure Valley Community C.OntarioOR00100001-11744210234
Warner Pacific U.PortlandOR00100001-12346210304
Cheyney U. PennsylvaniaCheyneyPA00010001-7640211608
Community C. PhiladelphiaPhiladelphiaPA01000102-7540215239
Lehigh Carbon Community C.SchnecksvillePA00100001-7641213525
Lincoln U.Lincoln U.PA00010001-7640213598
Northampton County Area Community C.BethlehemPA00100001-7541214379
Peirce C.PhiladelphiaPA00000101-7540214883
Reading Area Community C.ReadingPA00100001-7640215585
Albizu U.-San JuanSan JuanPR00100001-6618241331
American U. Puerto RicoBayamonPR00100001-6618241100
American U. Puerto RicoManatiPR00100001-6618241128
Atenas C.ManatiPR00100001-6618440651
Atlantic U. C.GuaynaboPR00100001-6618241216
Caribbean U.-BayamonBayamonPR00100001-6618241377
Caribbean U.-CarolinaCarolinaPR00100001-6618241386
Caribbean U.-PoncePoncePR00100001-6718363907
Caribbean U.-Vega BajaVega BajaPR00100001-6618363916
Colegio Universitario de San JuanSan JuanPR00100001-6618241720
Conservatory of Music of Puerto RicoSan JuanPR00100001-6618241766
Dewey U.-CarolinaCarolinaPR00100001-6618434900
Dewey U.-Hato ReyHato ReyPR00100001-6618443562
Dewey U.-Juana DíazJuana DiazPR00100001-6718449135
Dewey U.-ManatiManatiPR00100001-6618469416
EDP U. Puerto Rico Inc-San JuanSan JuanPR00100001-6618243832
EDP U. Puerto Rico Inc-San SebastianSan SebastianPR00100001-6718241836
EDP U. Puerto Rico-HumacaoHumacaoPR00100001-6618494278
EDP U. Puerto Rico-ManatiManatiPR00100001-6618494287
EDP U. Puerto Rico-VillalbaVillalbaPR00100001-6718492476
Escuela de Artes Plasticas y Diseno de Puerto RicoSan JuanPR00100001-6618241951
Humacao Community C.HumacaoPR00100001-6618242121
Instituto Tecnologico de Puerto Rico-Recinto de ManatiManatiPR00100001-6618242042
Instituto Tecnologico de Puerto Rico-Recinto de PoncePoncePR00100001-6718242565
Instituto Tecnologico de Puerto Rico-Recinto de San JuanSan JuanPR00100001-6618242583
Inter American U. Puerto Rico-AguadillaAguadillaPR00100001-6718242626
Inter American U. Puerto Rico-AreciboAreciboPR00100001-6718242635
Inter American U. Puerto Rico-BarranquitasBarranquitasPR00100001-6618242644
Inter American U. Puerto Rico-BayamonBayamonPR00100001-6618242705
Inter American U. Puerto Rico-FajardoFajardoPR00100001-6618242680
Inter American U. Puerto Rico-GuayamaGuayamaPR00100001-6618242699
Inter American U. Puerto Rico-MetroSan JuanPR00100001-6618242653
Inter American U. Puerto Rico-PonceMerceditaPR00100001-6718242662
Inter American U. Puerto Rico-San GermanSan GermanPR00100001-6718242617
Pontifical Catholic U. Puerto Rico-AreciboAreciboPR00100001-6718241395
Pontifical Catholic U. Puerto Rico-MayaguezMayaguezPR00100001-6718243586
Pontifical Catholic U. Puerto Rico-PoncePoncePR00100001-6718241410
San Juan Bautista School of MedicineCaguasPR00100001-6618430670
U. Puerto Rico at PoncePoncePR00100001-6718243212
U. Puerto Rico-AguadillaAguadillaPR00100001-6718243106
U. Puerto Rico-AreciboAreciboPR00100001-6718243115
U. Puerto Rico-BayamonBayamonPR00100001-6618243133
U. Puerto Rico-CarolinaCarolinaPR00100001-6618243142
U. Puerto Rico-CayeyCayeyPR00100001-6618243151
U. Puerto Rico-HumacaoHumacaoPR00100001-6618243179
U. Puerto Rico-MayaguezMayaguezPR00100001-6718243197
U. Puerto Rico-Medical SciencesSan JuanPR00100001-6618243203
U. Puerto Rico-Rio PiedrasSan JuanPR00100001-6618243221
U. Puerto Rico-UtuadoUtuadoPR00100001-6718243188
Universal Technology C. Puerto RicoAguadillaPR00100001-6718376385
Universidad Adventista de las AntillasMayaguezPR00100001-6718241191
Universidad Ana G. Mendez-Carolina CampusCarolinaPR00100001-6618243346
Universidad Ana G. Mendez-Cupey CampusSan JuanPR00100001-6618241739
Universidad Ana G. Mendez-Gurabo CampusGuraboPR00100001-6618243601
Universidad Central de BayamonBayamónPR00100001-6618241225
Universidad Central del CaribeBayamonPR00100001-6618243568
Universidad del Sagrado CorazonSanturcePR00100001-6618243443
Universidad Pentecostal MizpaRio PiedrasPR00100001-6618441690
Universidad Politecnica de Puerto RicoHato ReyPR00100001-6618243577
Universidad Teologica del CaribeTrujillo AltoPR00100001-6618241614
Palau Community C.KororPW010000011347243647
C. UnboundProvidenceRI00100001-7142493822
Rhode Island C.ProvidenceRI00100001-7142217420
Allen U.ColumbiaSC00010001-8134217624
Benedict C.ColumbiaSC00010001-8134217721
Claflin U.OrangeburgSC00010001-8133217873
Clinton C.Rock HillSC00010001-8135217891
Denmark Technical C.DenmarkSC00010001-8133217989
Limestone U.GaffneySC00000101-8235218238
Morris C.SumterSC00010001-8034218399
Northeastern Technical C.CherawSC00000101-8035217837
Orangeburg Calhoun Technical C.OrangeburgSC00000101-8134218487
South Carolina State U.OrangeburgSC00010001-8133218733
Voorhees C.DenmarkSC00010001-8133218919
Oglala Lakota C.KyleSD00000011-10243219277
Sinte Gleska U.MissionSD00000011-10143219374
Sisseton Wahpeton C.SissetonSD00000011-9746219408
American Baptist C.NashvilleTN00010001-8736219505
Fisk U.NashvilleTN00010001-8736220181
Lane C.JacksonTN00010001-8936220598
Le Moyne-Owen C.MemphisTN00010001-9035220604
Meharry Medical C.NashvilleTN00010001-8736220792
Remington C.-Nashville CampusNashvilleTN01000001-8736445249
Southern Adventist U.C.daleTN01100002-8535221661
Southwest Tennessee Community C.MemphisTN00000101-9035221485
Tennessee State U.NashvilleTN00010001-8736221838
Altierus Career C.-BissonnetHoustonTX00100001-9630445461
Alvin Community C.AlvinTX00100001-9529222567
Amarillo C.AmarilloTX00100001-10235222576
Angelina C.LufkinTX00100001-9531222822
Angelo State U.San AngeloTX00100001-10031222831
Austin C.ShermanTX01000001-9734222983
Austin Community C. DistrictAustinTX00100001-9830222992
Baptist U. AmericasSan AntonioTX00100001-9929444398
Brazosport C.Lake JacksonTX00100001-9529223506
C. Biblical Studies-HoustonHoustonTX00100001-9630388520
C. MainlandTexas CityTX00100001-9529226408
Cisco C.CiscoTX00100001-9932223898
Coastal Bend C.BeevilleTX00100001-9828223320
Concordia U. TexasAustinTX00100001-9830224004
Dallas C.DallasTX00100001-9733224615
Del Mar C.Corpus ChristiTX00100001-9728224350
El Paso Community C.El PasoTX00100001-10632224642
Frank Phillips C.BorgerTX00100001-10136224891
Galveston C.GalvestonTX00100001-9529224961
Hallmark U.San AntonioTX00100001-9930225201
Houston Baptist U.HoustonTX00100001-9630225399
Houston Community C.HoustonTX01100002-9530225423
Howard C.Big SpringTX00100001-10132225520
Howard Payne U.BrownwoodTX00100001-9932225548
Huston-Tillotson U.AustinTX00110002-9830225575
Jarvis Christian U.HawkinsTX00010001-9533225885
Laredo C.LaredoTX00100001-10028226134
Lee C.BaytownTX00100001-9530226204
Lone Star C. SystemThe WoodlandsTX00100001-9530227182
McLennan Community C.WacoTX00100001-9732226578
McMurry U.AbileneTX00100001-10032226587
North Central Texas C.GainesvilleTX00100001-9734224110
Northeast Lakeview C.Universal CityTX00100001-9830488730
Northeast Texas Community C.Mount PleasantTX00100001-9533227225
Northwest Vista C.San AntonioTX00100001-9929420398
Odessa C.OdessaTX00100001-10232227304
Our Lady of the Lake U.San AntonioTX00100001-9929227331
Palo Alto C.San AntonioTX00100001-9929246354
Paul Quinn C.DallasTX00010001-9733227429
Prairie View A&M U.Prairie ViewTX00010001-9630227526
Ranger C.RangerTX00100001-9932227687
Remington C.-Dallas CampusGarlandTX00100001-9733223463
Remington C.-Houston Southeast CampusWebsterTX00100001-9530451857
Remington C.-North Houston CampusHoustonTX00100001-9530445203
Saint Edward's U.AustinTX00100001-9830227845
Sam Houston State U.HuntsvilleTX00100001-9631227881
San Antonio C.San AntonioTX00100001-9829227924
San Jacinto Community C.PasadenaTX00100001-9530227979
Schreiner U.KerrvilleTX00100001-9930228042
South Plains C.LevellandTX00100001-10234228158
South Texas C.McAllenTX00100001-9826409315
Southwest Texas Junior C.UvaldeTX00100001-10029228316
Southwestern Adventist U.KeeneTX00100001-9732228468
Southwestern Christian C.TerrellTX00010001-9633228486
St. Mary's U.San AntonioTX00100001-9929228149
St. Philip's C.San AntonioTX00010001-9829227854
Sul Ross State U.AlpineTX00100001-10430228501
Tarrant County C. DistrictFort WorthTX00100001-9733228547
Temple C.TempleTX00100001-9731228608
Texas A&M International U.LaredoTX00100001-9928226152
Texas A&M U.-C. StationC. StationTX00100001-9631228723
Texas A&M U.-Central TexasKilleenTX00100001-9831483036
Texas A&M U.-Corpus ChristiCorpus ChristiTX00100001-9728224147
Texas A&M U.-KingsvilleKingsvilleTX00100001-9828228705
Texas A&M U.-San AntonioSan AntonioTX00100001-9929459949
Texas C.TylerTX00010001-9532228884
Texas Lutheran U.SeguinTX00100001-9830228981
Texas Southern U.HoustonTX00010001-9530229063
Texas Southmost C.BrownsvilleTX00100001-9726227377
Texas State Technical C.WacoTX00100001-9732487320
Texas State U.San MarcosTX00100001-9830228459
Texas Tech U.LubbockTX00100001-10234229115
Texas Tech U. Health Sciences CenterLubbockTX00100001-10234229337
Texas Tech U. Health Sciences Center-El PasoEl PasoTX00100001-10632492689
Texas Wesleyan U.Fort WorthTX00100001-9733229160
Texas Woman's U.DentonTX00100001-9733229179
Trinity Valley Community C.AthensTX00100001-9632225308
U. HoustonHoustonTX01100002-9530225511
U. Houston-Clear LakeHoustonTX00100001-9530225414
U. Houston-DowntownHoustonTX00100001-9530225432
U. Houston-VictoriaVictoriaTX00100001-9729225502
U. Incarnate WordSan AntonioTX00100001-9829225627
U. North TexasDentonTX00100001-9733227216
U. North Texas at DallasDallasTX00100001-9733484905
U. St. ThomasHoustonTX01100002-9530227863
U. Texas at ArlingtonArlingtonTX01100002-9733228769
U. Texas at AustinAustinTX01100002-9830228778
U. Texas at El PasoEl PasoTX00100001-10732228796
U. Texas at San AntonioSan AntonioTX00100001-9930229027
U. Texas Health Science Center at San AntonioSan AntonioTX00100001-9930228644
U. Texas Permian BasinOdessaTX00100001-10232229018
U. Texas Rio Grande ValleyEdinburgTX00100001-9826227368
Vernon C.VernonTX00100001-9934229504
Victoria C.VictoriaTX00100001-9729229540
Wayland Baptist U.PlainviewTX00100001-10234229780
West Texas A&M U.CanyonTX00100001-10235229814
Western Texas C.SnyderTX00100001-10133229832
Wharton County Junior C.WhartonTX01100002-9629229841
Wiley C.MarshallTX00010001-9433229887
Hampton U.HamptonVA00010001-7637232265
Marymount U.ArlingtonVA00100001-7739232706
Norfolk State U.NorfolkVA00010001-7637232937
Northern Virginia Community C.AnnandaleVA01000001-7739232946
Virginia Commonwealth U.RichmondVA01000001-7738234030
Virginia Polytechnic Institute and State U.BlacksburgVA01000001-8037233921
Virginia State U.PetersburgVA00010001-7737234155
Virginia U. LynchburgLynchburgVA00010001-7937234137
Virginia Union U.RichmondVA00010001-7738234164
U. Virgin IslandsCharlotte AmalieVI00010001-6518243665
Big Bend Community C.Moses LakeWA00100001-11947234711
Columbia Basin C.PascoWA00100001-11946234979
Edmonds C.LynnwoodWA01000001-12248235103
Gather 4 Him Christian C.KennewickWA00100001-11946495147
Green River C.AuburnWA01000001-12247235343
Heritage U.ToppenishWA00100001-12046235422
Lake Washington Institute of TechnologyKirklandWA01000001-12248235699
North Seattle C.SeattleWA01000001-12248236072
Northwest Indian C.BellinghamWA00000011-12349380377
Perry Technical InstituteYakimaWA00100001-12147236212
Saint Martin's U.LaceyWA01000001-12347236452
Seattle Central C.SeattleWA01000001-12248236513
South Seattle C.SeattleWA01000001-12248236504
U. Washington-Tacoma CampusTacomaWA01000001-12247377564
Walla Walla Community C.Walla WallaWA00100001-11846236887
Wenatchee Valley C.WenatcheeWA00100001-12047236975
Yakima Valley C.YakimaWA00100001-12147237109
Alverno C.MilwaukeeWI00100001-8843238193
C. Menominee NationKeshenaWI00000011-8945413617
Herzing U.-KenoshaKenoshaWI01100002-8843459842
Lac Courte Oreilles Ojibwe C.HaywardWI00000011-9146260372
Mount Mary U.MilwaukeeWI00100001-8843239390
Bluefield State C.BluefieldWV00010001-8137237215
West Virginia State U.InstituteWV00010001-8238237899

AANAPISI = Asian American and Native American Pacific Islander–serving institution, ANNHSI = Alaska Native and Native Hawaiian–serving institution, HBCU = historically Black college or university, HSI = Hispanic-serving institution, MSI = minority-serving institution, NASNTI = Native American–serving nontribal institution, PBI = predominantly Black institution, TCCU = tribally controlled college or university.

Note(s):

Data are based on institutions eligible to participate in Title IV federal financial aid programs. The detailed data of MSIs by location and type are available at https://ncses.nsf.gov/pubs/nsb202332/assets/institutions-in-s-e-higher-education/figures/nsb202332-fighed-001.xlsx.

Source(s):

National Center for Education Statistics, Integrated Postsecondary Education Data System (IPEDS), Institutional Characteristics component, and FY 2022 Title III and Title V institutions designated eligible for the waiver of the nonfederal share matching requirements. Available at https://www2.ed.gov/about/offices/list/ope/idues/eligibility.html#el-inst. Accessed 5 December 2022.

Science and Engineering Indicators

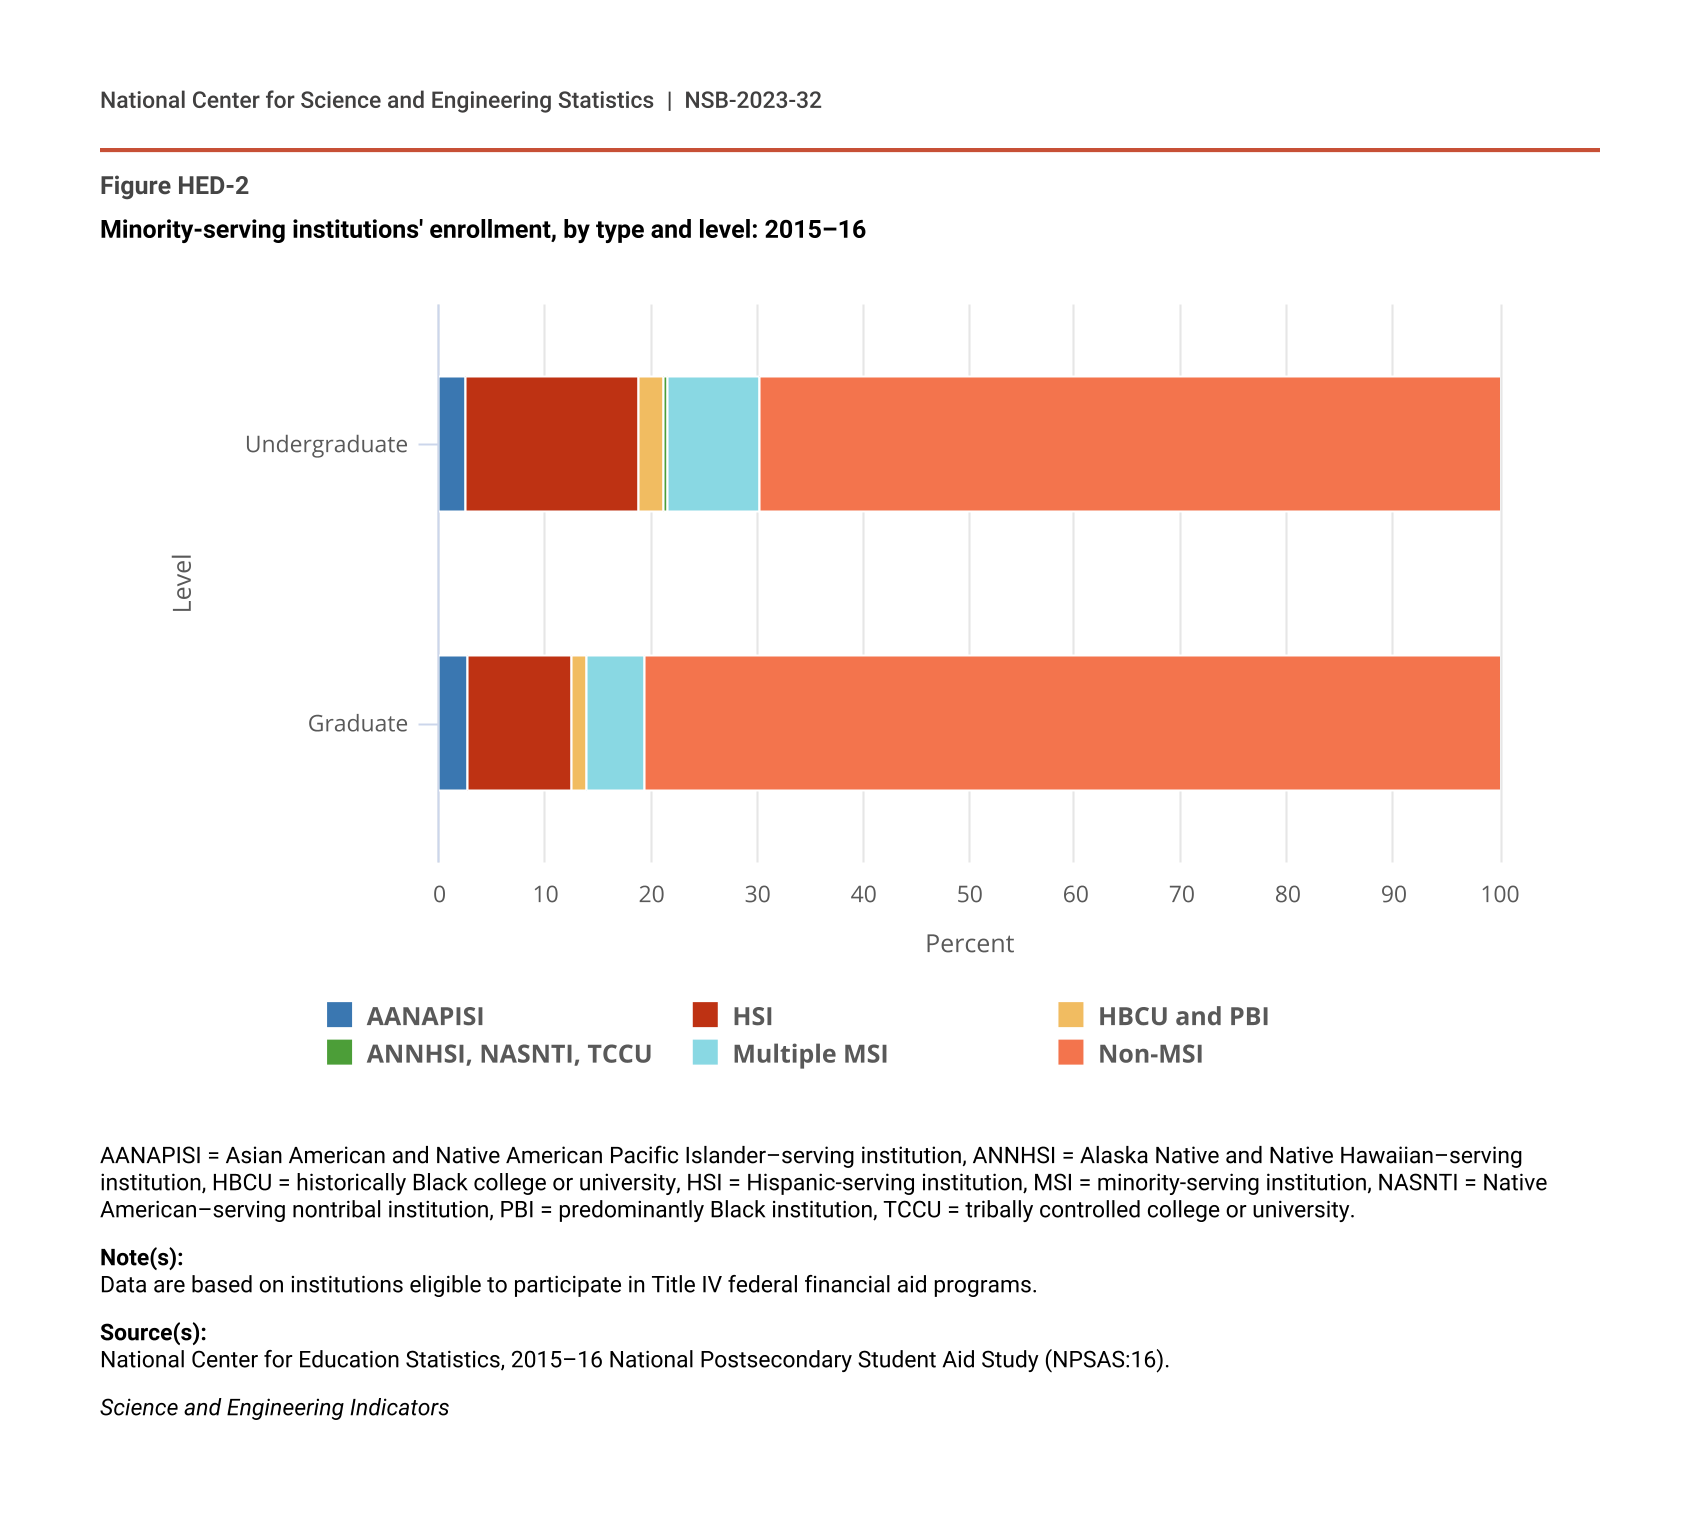
In academic year 2015–16, about 5,400,000 undergraduates, 30% of all undergraduates, were enrolled at MSIs (Figure HED-2; Table SHED-2). At the graduate level, about 550,000 students were enrolled at MSIs, accounting for 19% of all graduate students. Among MSIs, HSIs enrolled the most students, 16% of all undergraduates and 10% of graduate students. Institutions serving indigenous students—ANNHSIs, NASNTIs, and TCCUs—served the fewest. The percentage of students enrolled at MSIs differed by award level. About 21% of students in certificate programs were enrolled at an MSI, as were 43% of associate’s degree seekers, 21% of students in a bachelor’s degree program, 20% of master’s degree students, and 14% of doctoral degree students (Table SHED-2).

Minority-serving institutions' enrollment, by type and level: 2015–16
Keyboard instructions Hide

Minority-serving institutions' enrollment, by type and level: 2015–16

Chart
Bar chart with 6 data series.
The chart has 1 X axis displaying Level.
The chart has 1 Y axis displaying Percent. Data ranges from 2.5974025974026 to 100.
End of interactive chart.
(Percent)
Level AANAPISI HSI HBCU and PBI ANNHSI, NASNTI, TCCU Multiple MSI Non-MSI
Undergraduate 2.6 16.2 2.5 0.4 8.6 69.8
Graduate 2.7 9.9 1.3 0.1 5.5 80.6

AANAPISI = Asian American and Native American Pacific Islander–serving institution, ANNHSI = Alaska Native and Native Hawaiian–serving institution, HBCU = historically Black college or university, HSI = Hispanic-serving institution, MSI = minority-serving institution, NASNTI = Native American–serving nontribal institution, PBI = predominantly Black institution, TCCU = tribally controlled college or university.

Note(s):

Data are based on institutions eligible to participate in Title IV federal financial aid programs.

Source(s):

National Center for Education Statistics, 2015–16 National Postsecondary Student Aid Study (NPSAS:16).

Science and Engineering Indicators

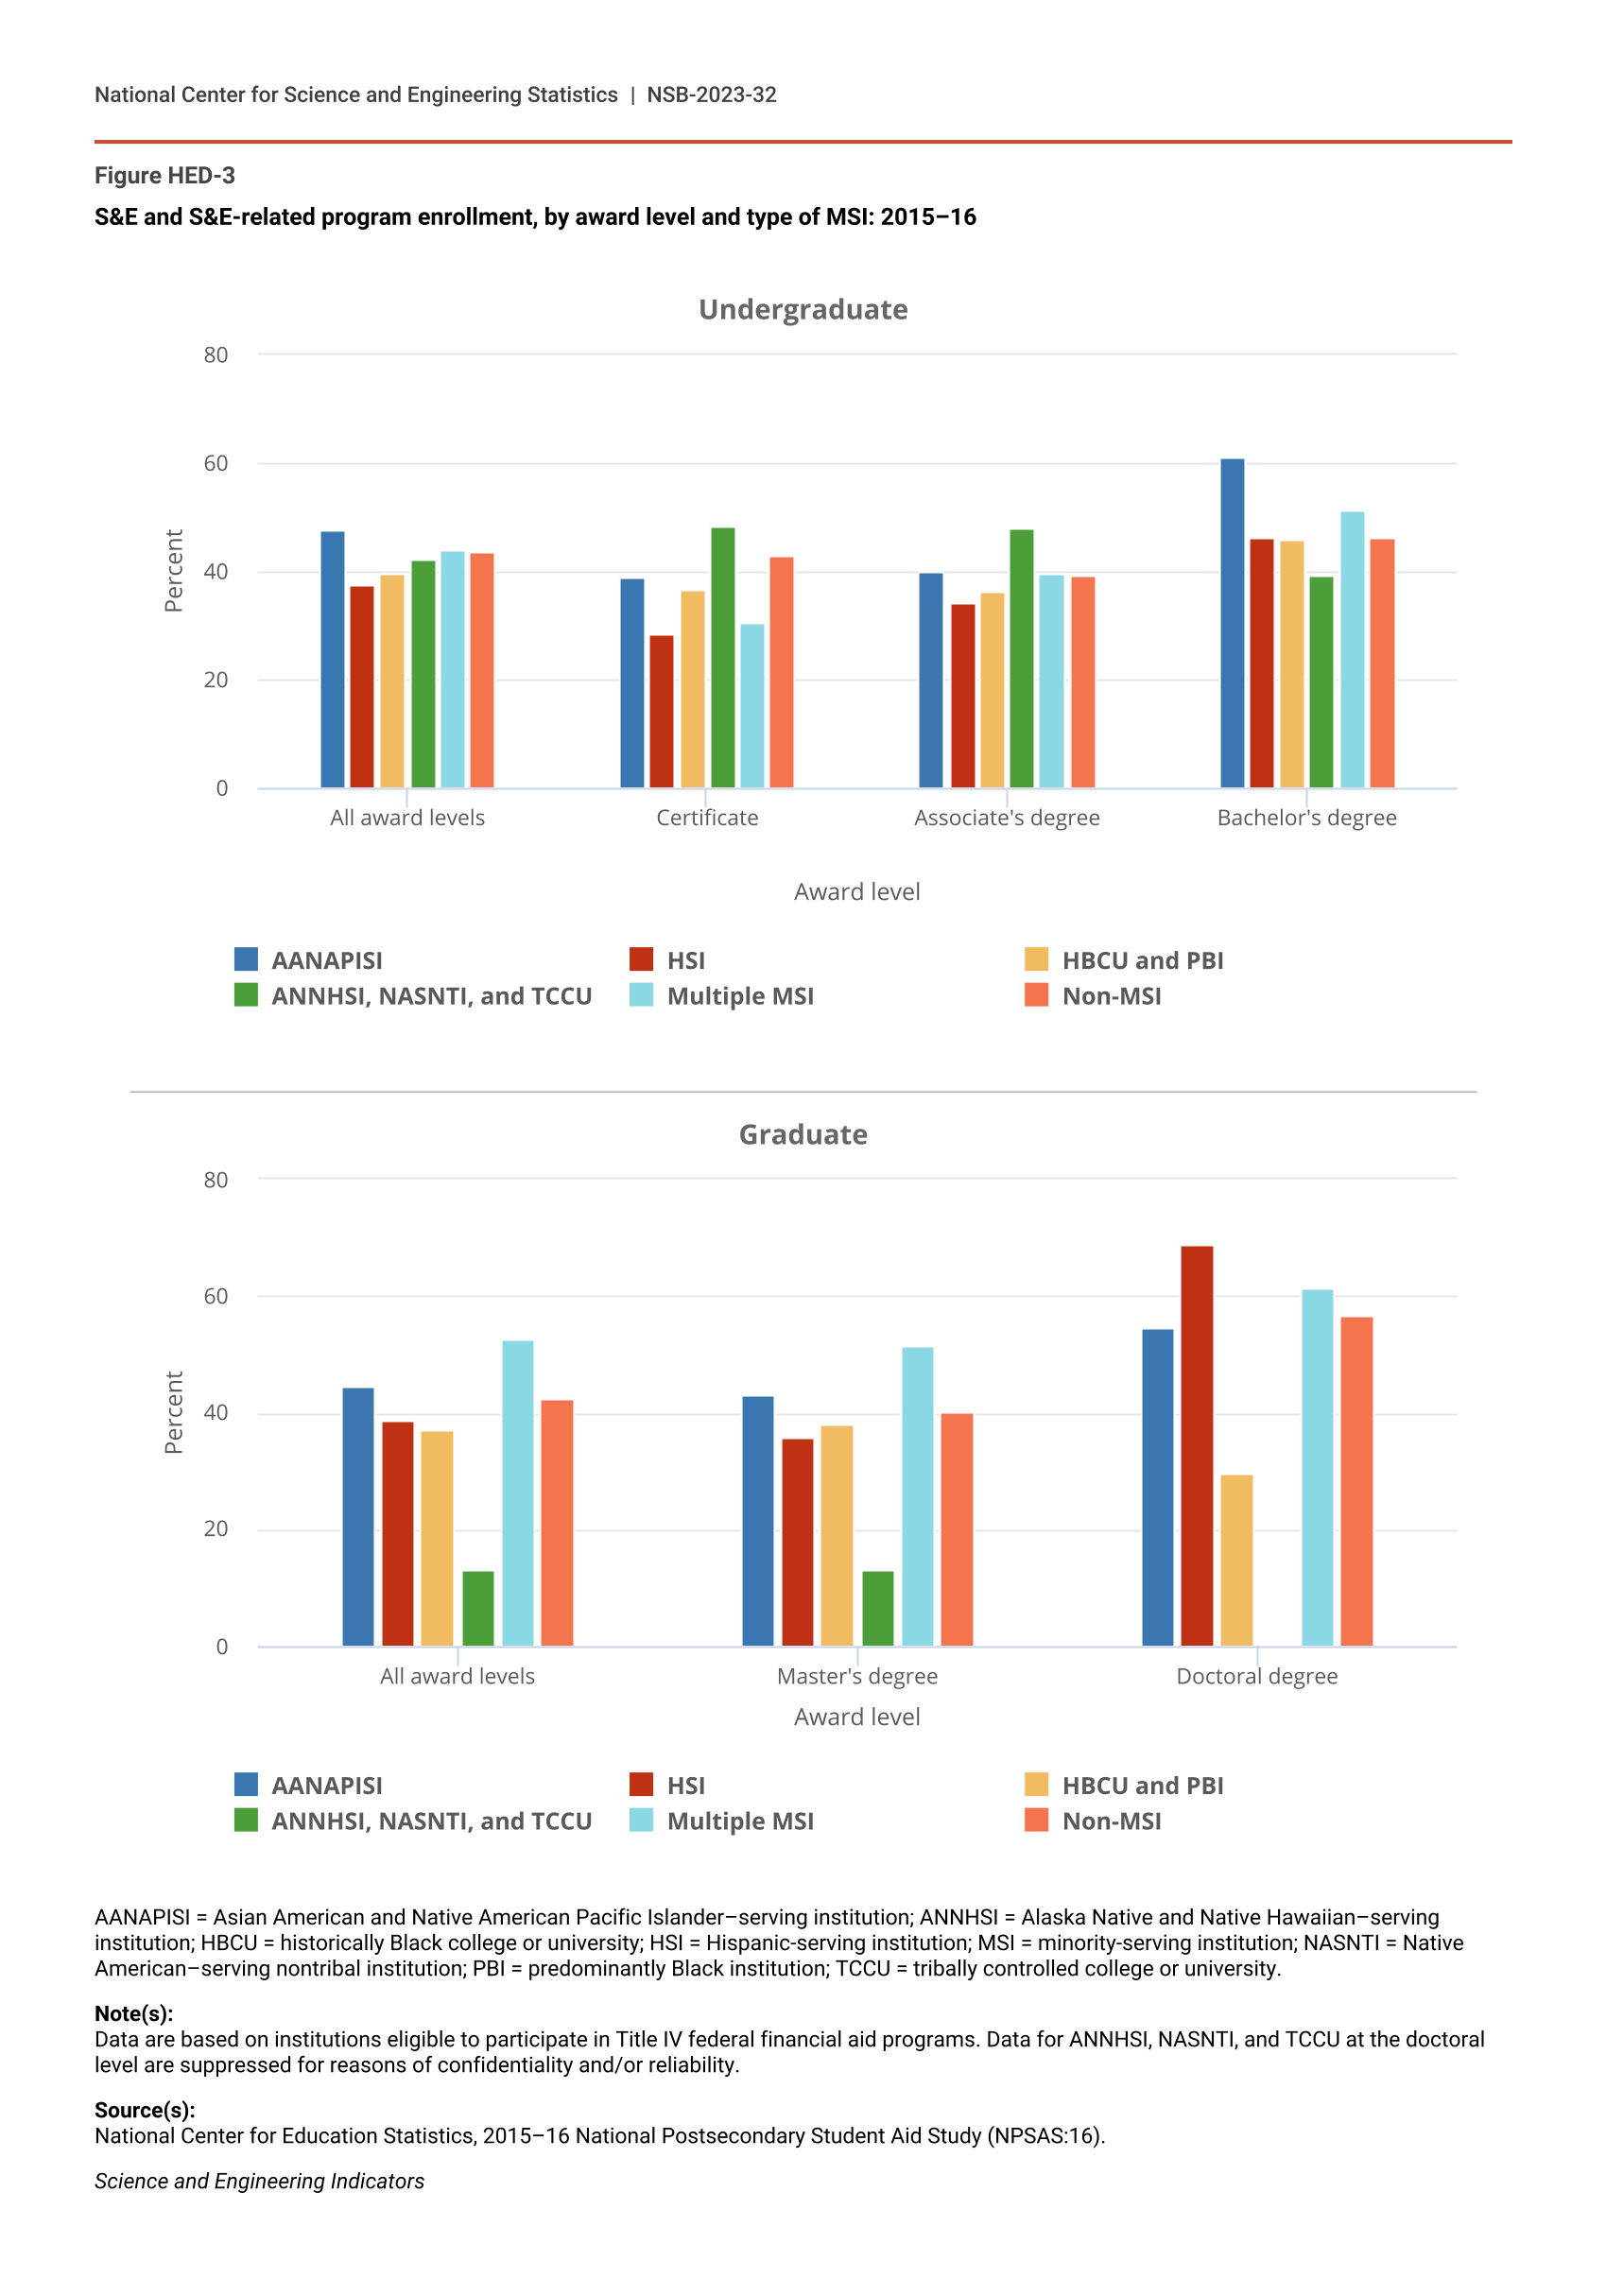
Among undergraduates who were enrolled in degree programs, 43% of students in all institutions and 40% of those in an MSI were majoring in S&E and S&E-related fields. The percentage of MSI undergraduates who majored in S&E and S&E-related fields ranged from 37% at HSIs to 47% of students enrolled in AANAPISIs. At the graduate level, 43% of both MSI and all students were enrolled in S&E or S&E-related fields. Among types of MSIs, the percentage of graduate students enrolled in S&E or S&E-related fields ranged from 13% at institutions serving indigenous students to 45% at AANAPISIs.

The percentage of students who were pursuing a degree in S&E or S&E-related fields differed by award level and MSI type. For example, 61% of bachelor’s degree students at AANAPISIs majored in S&E or S&E-related fields, compared with 51% or less among bachelor’s degree students in other MSI types (Figure HED-3). Among doctoral students, 30% of those at HBCUs and PBIs were enrolled in S&E or S&E-related fields, compared with 55% of students at AANAPISIs and 69% of those at HSIs.

S&E and S&E-related program enrollment, by award level and type of MSI: 2015–16
Keyboard instructions Hide

S&E and S&E-related program enrollment, by award level and type of MSI: 2015–16

Chart
Bar chart with 6 data series.
Undergraduate
The chart has 1 X axis displaying Award level.
The chart has 1 Y axis displaying Percent. Data ranges from 28.4 to 61.1.
End of interactive chart.
Chart
Bar chart with 6 data series.
Graduate
The chart has 1 X axis displaying Award level.
The chart has 1 Y axis displaying Percent. Data ranges from 13.3 to 69.
End of interactive chart.
(Percent)
Award level AANAPISI HSI HBCU and PBI ANNHSI, NASNTI, and TCCU Multiple MSI Non-MSI
All award levels 47.5 37.4 39.8 42.1 43.9 43.5
Certificate 38.9 28.4 36.6 48.5 30.7 42.9
Associate's degree 40.0 34.2 36.4 47.9 39.7 39.4
Bachelor's degree 61.1 46.1 46.0 39.1 51.4 46.1
(Percent)
Award level AANAPISI HSI HBCU and PBI ANNHSI, NASNTI, and TCCU Multiple MSI Non-MSI
All award levels 44.7 38.8 37.1 13.3 52.6 42.6
Master's degree 43.2 35.9 38.1 13.3 51.6 40.3
Doctoral degree 54.8 69.0 29.8 s 61.5 56.7

AANAPISI = Asian American and Native American Pacific Islander–serving institution; ANNHSI = Alaska Native and Native Hawaiian–serving institution; HBCU = historically Black college or university; HSI = Hispanic-serving institution; MSI = minority-serving institution; NASNTI = Native American–serving nontribal institution; PBI = predominantly Black institution; TCCU = tribally controlled college or university.

Note(s):

Data are based on institutions eligible to participate in Title IV federal financial aid programs. Data for ANNHSI, NASNTI, and TCCU at the doctoral level are suppressed for reasons of confidentiality and/or reliability.

Source(s):

National Center for Education Statistics, 2015–16 National Postsecondary Student Aid Study (NPSAS:16).

Science and Engineering Indicators

Community Colleges

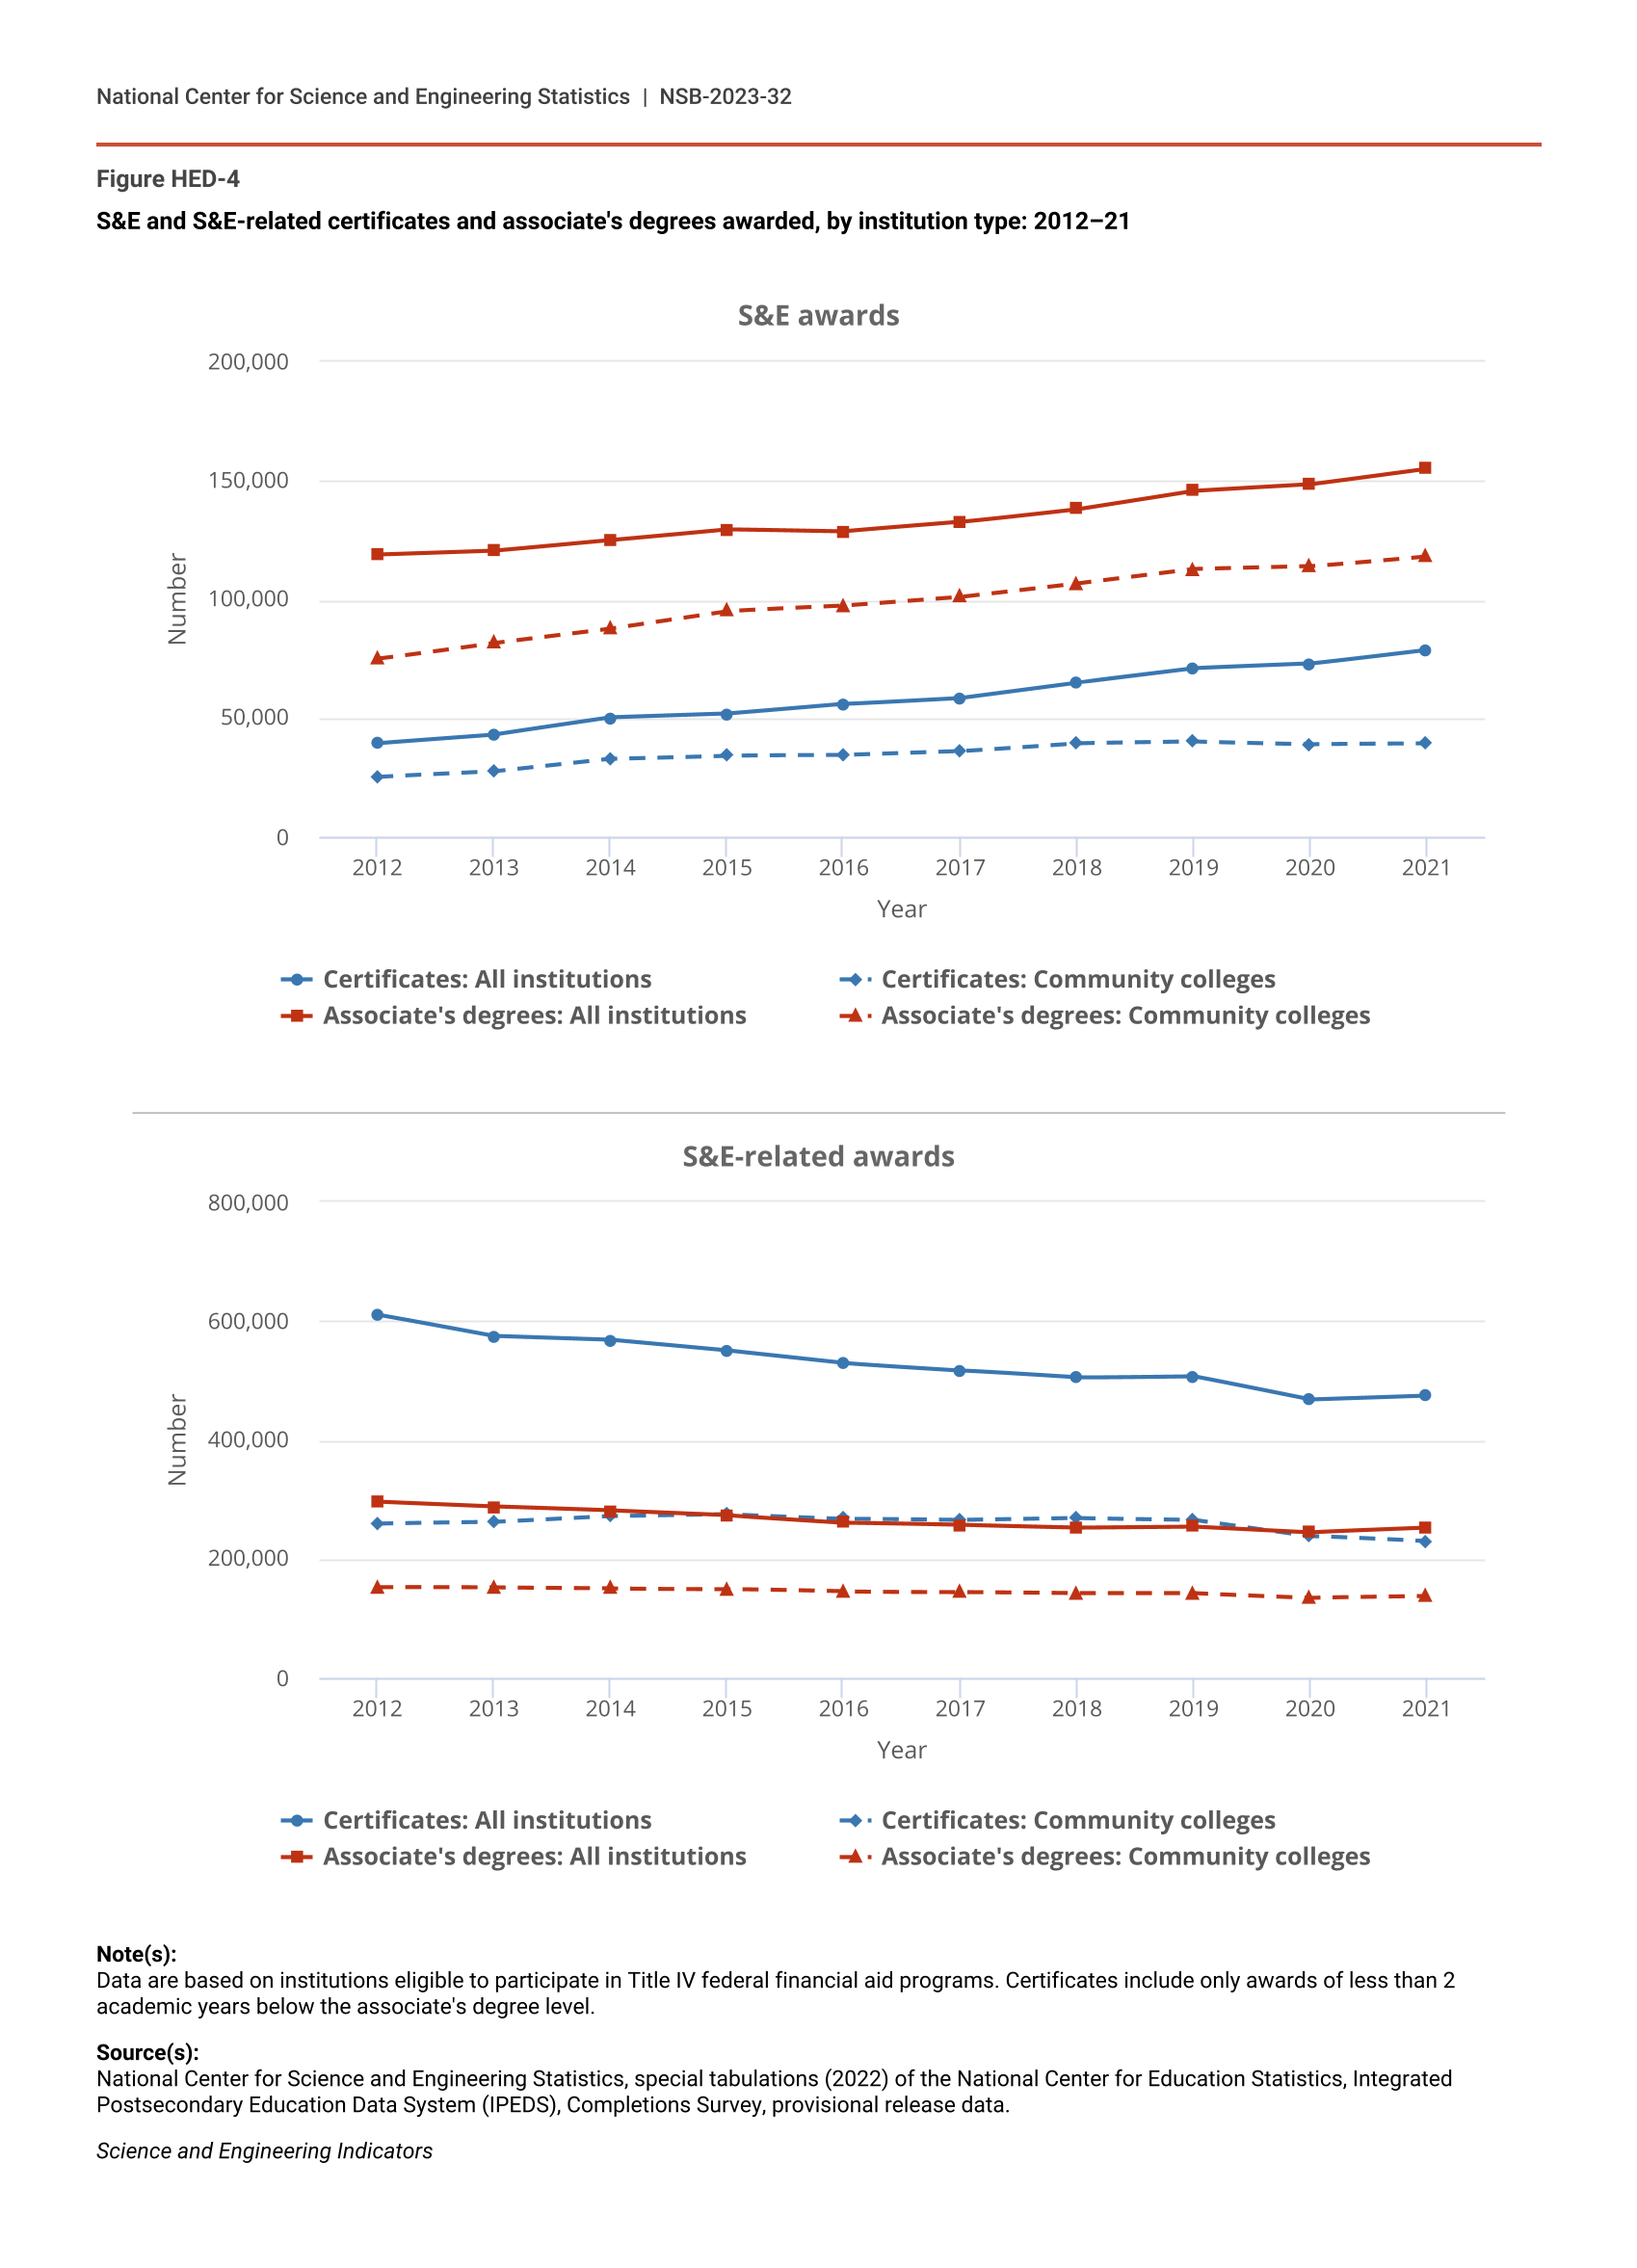
Community colleges are public colleges that offer certificate and associate’s degree programs that require 2 years or less to complete. They specialize in providing relatively affordable programs of study, including those in S&E and S&E-related fields. Certificates and associate’s degrees are common forms of preparation for S&E-related occupations in the STEM workforce (see Indicators 2022 report “The STEM Labor Force of Today: Scientists, Engineers, and Skilled Technical Workers” section “Education and Training of Workers in STEM”). Community colleges awarded 50% of the S&E certificates and 76% of the S&E associate’s degrees conferred in 2021 (Figure HED-4). Community colleges also awarded 48% of S&E-related certificates and 55% of S&E-related associate’s degrees. From 2012 to 2021, the number of certificates and associate’s degrees awarded by community colleges increased in S&E fields but decreased in S&E-related fields.

S&E and S&E-related certificates and associate's degrees awarded, by institution type: 2012–21
Keyboard instructions Hide

S&E and S&E-related certificates and associate's degrees awarded, by institution type: 2012–21

Chart
Line chart with 4 lines.
S&E awards
The chart has 1 X axis displaying Year.
The chart has 1 Y axis displaying Number. Data ranges from 25376 to 155029.
End of interactive chart.
Chart
Line chart with 4 lines.
S&E-related awards
The chart has 1 X axis displaying Year.
The chart has 1 Y axis displaying Number. Data ranges from 135593 to 611229.
End of interactive chart.
(Number)
Year Certificates: All institutions Certificates: Community colleges Associate's degrees: All institutions Associate's degrees: Community colleges
2012 39,476 25,376 118,662 74,951
2013 43,014 27,597 120,346 81,745
2014 50,188 32,942 124,916 87,768
2015 51,781 34,288 129,468 95,015
2016 55,929 34,493 128,526 97,155
2017 58,569 36,146 132,433 100,876
2018 64,991 39,555 137,984 106,582
2019 70,959 40,232 145,685 112,618
2020 72,881 39,162 148,449 113,823
2021 78,775 39,459 155,029 118,150
(Number)
Year Certificates: All institutions Certificates: Community colleges Associate's degrees: All institutions Associate's degrees: Community colleges
2012 611,229 259,846 296,419 152,961
2013 574,920 262,326 288,495 152,063
2014 568,463 272,400 281,774 150,750
2015 550,479 275,872 273,943 149,926
2016 529,454 268,405 261,833 145,619
2017 517,563 266,048 258,048 145,242
2018 505,163 269,281 253,585 143,204
2019 507,686 266,660 255,426 143,261
2020 468,186 239,266 245,644 135,593
2021 474,734 229,669 253,005 138,088
Note(s):

Data are based on institutions eligible to participate in Title IV federal financial aid programs. Certificates include only awards of less than 2 academic years below the associate's degree level.

Source(s):

National Center for Science and Engineering Statistics, special tabulations (2022) of the National Center for Education Statistics, Integrated Postsecondary Education Data System (IPEDS), Completions Survey, provisional release data.

Science and Engineering Indicators

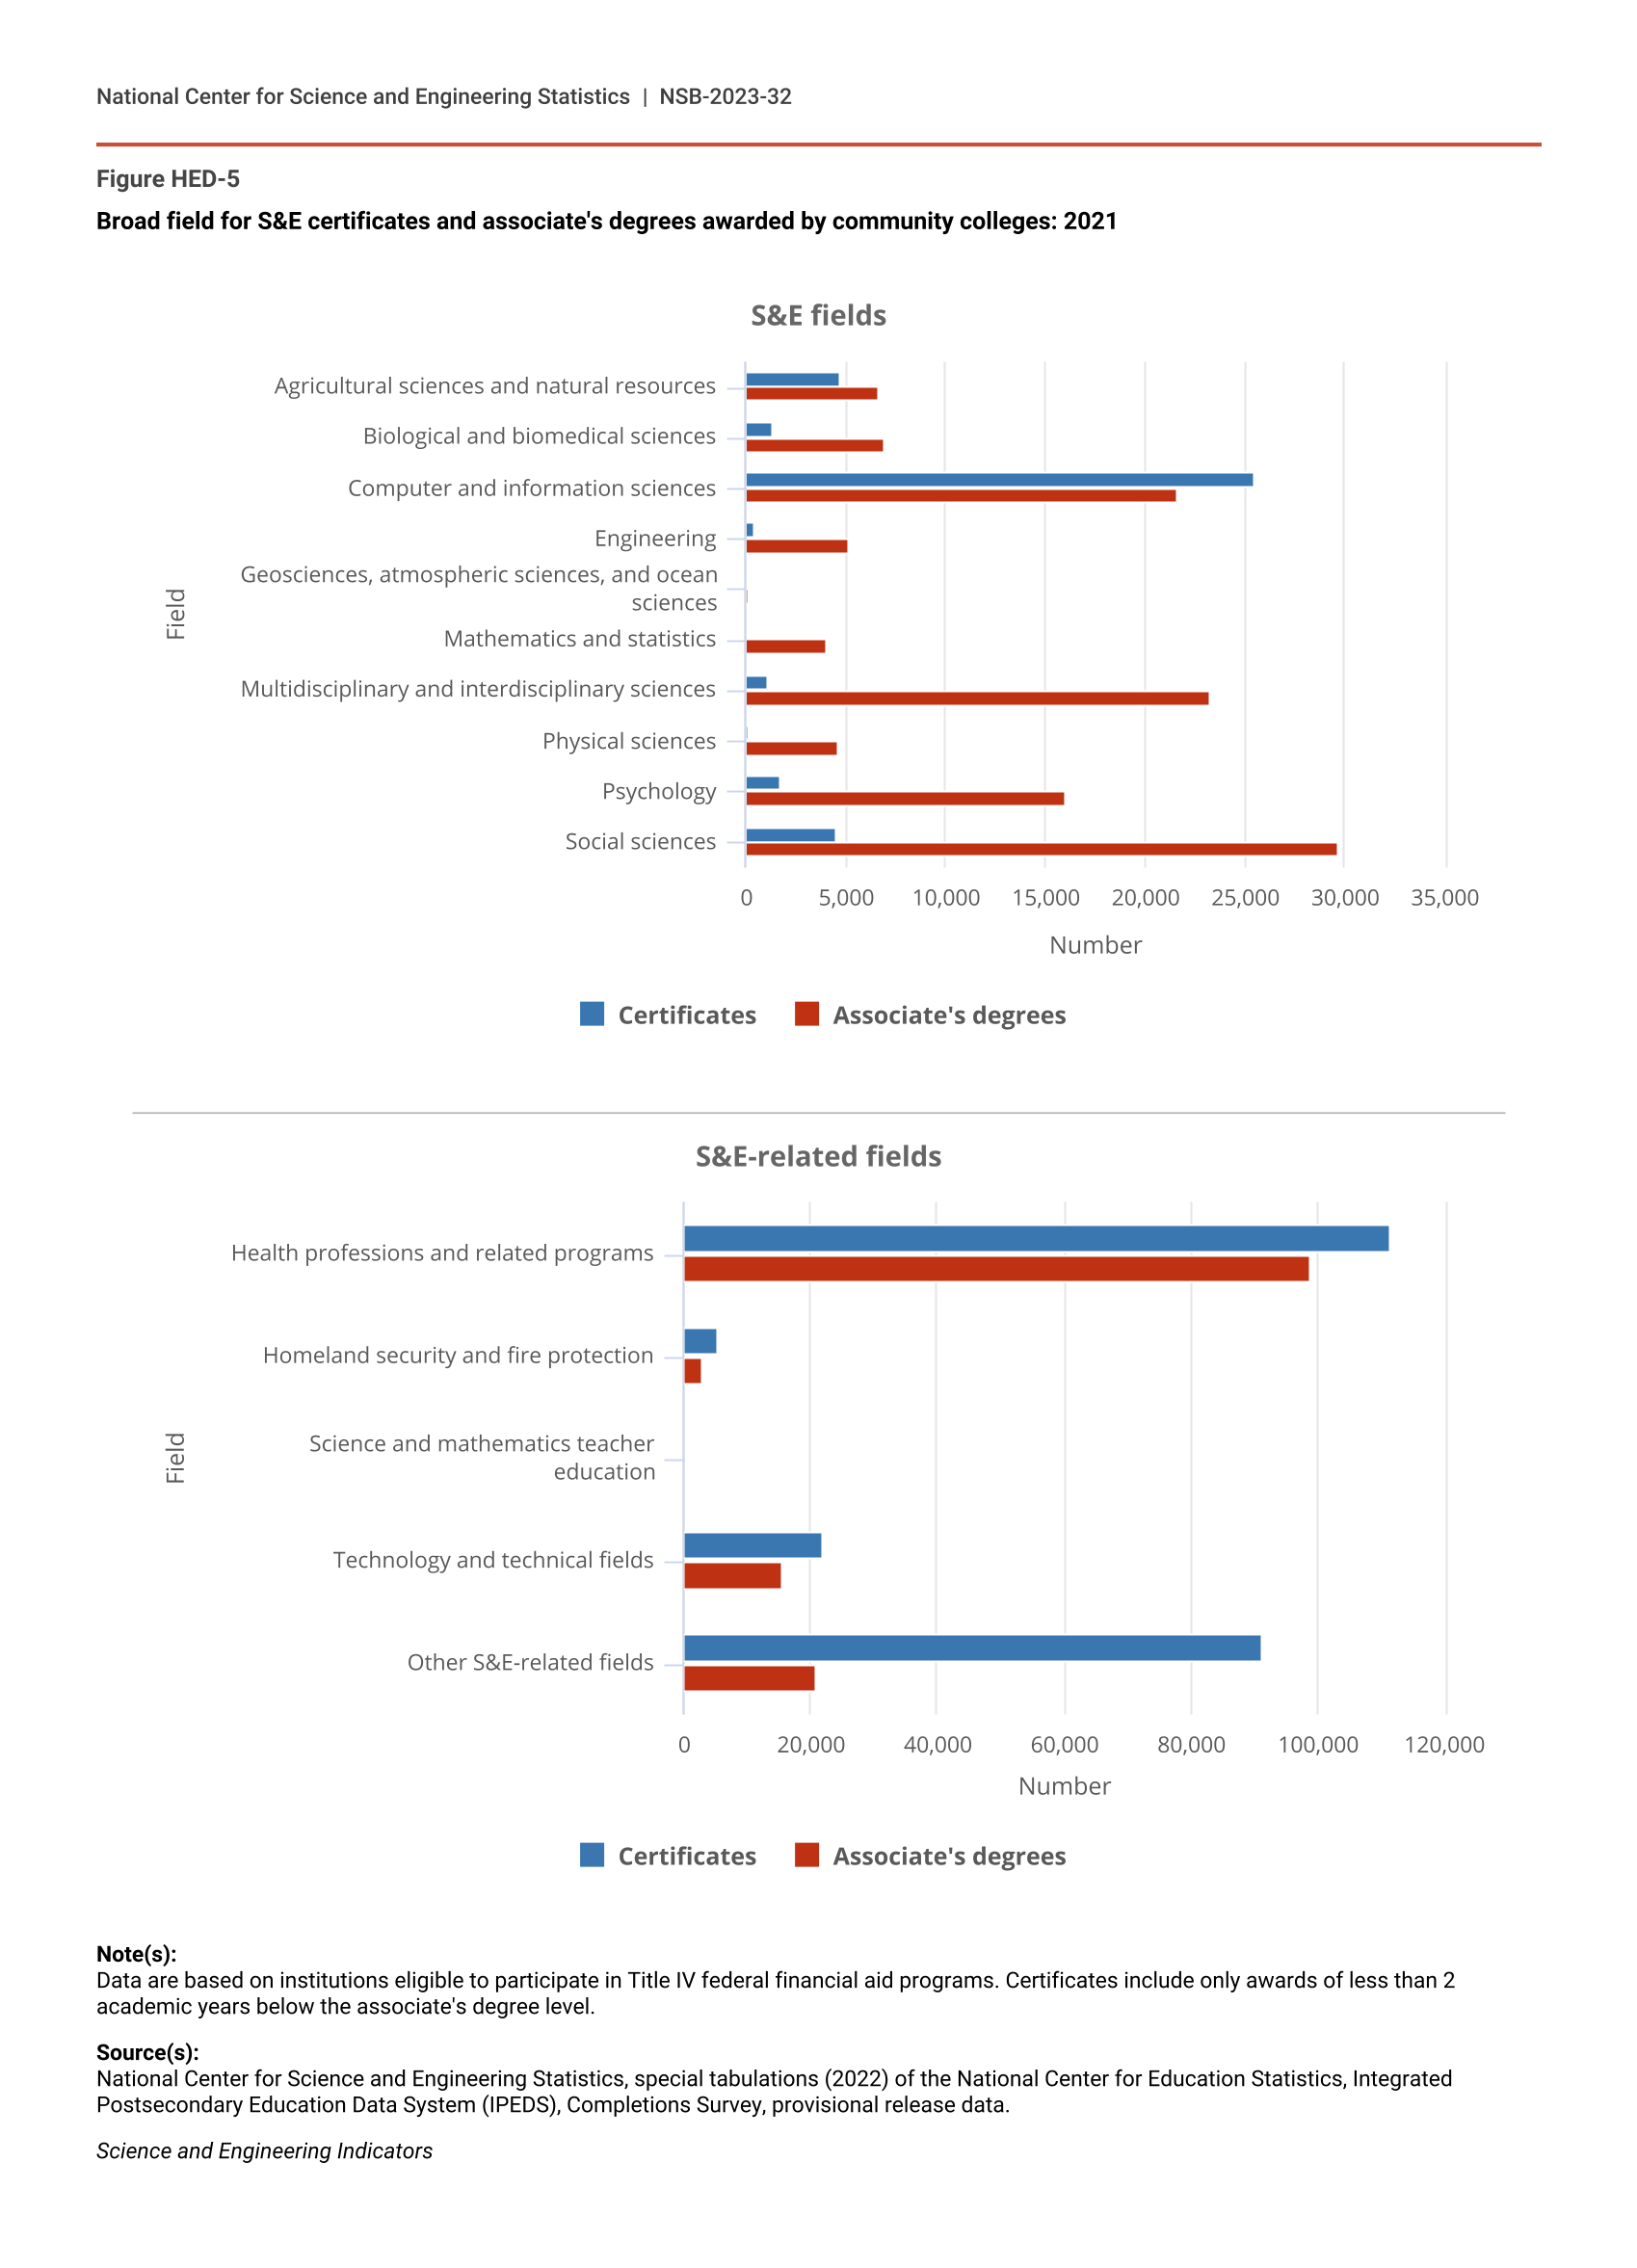
The most popular broad S&E or S&E-related field of study for both certificates and associate’s degrees awarded by community colleges was health professions and related programs, an S&E-related field (Figure HED-5). Among S&E fields, community colleges awarded the largest number of certificates in computer and information sciences and the largest number of associate’s degrees in social sciences.

Broad field for S&E certificates and associate's degrees awarded by community colleges: 2021
Keyboard instructions Hide

Broad field for S&E certificates and associate's degrees awarded by community colleges: 2021

Chart
Bar chart with 2 data series.
S&E fields
The chart has 1 X axis displaying Field.
The chart has 1 Y axis displaying Number. Data ranges from 5 to 29640.
End of interactive chart.
Chart
Bar chart with 2 data series.
S&E-related fields
The chart has 1 X axis displaying Field.
The chart has 1 Y axis displaying Number. Data ranges from 0 to 111462.
End of interactive chart.
(Number)
Field Certificates Associate's degrees
Agricultural sciences and natural resources 4,775 6,669
Biological and biomedical sciences 1,301 6,979
Computer and information sciences 25,483 21,667
Engineering 418 5,123
Geosciences, atmospheric sciences, and ocean sciences 5 142
Mathematics and statistics 46 4,019
Multidisciplinary and interdisciplinary sciences 1,115 23,277
Physical sciences 97 4,606
Psychology 1,708 16,028
Social sciences 4,511 29,640
(Number)
Field Certificates Associate's degrees
Health professions and related programs 111,462 98,728
Homeland security and fire protection 5,227 2,814
Science and mathematics teacher education 0 42
Technology and technical fields 21,818 15,609
Other S&E-related fields 91,162 20,895
Note(s):

Data are based on institutions eligible to participate in Title IV federal financial aid programs. Certificates include only awards of less than 2 academic years below the associate's degree level.

Source(s):

National Center for Science and Engineering Statistics, special tabulations (2022) of the National Center for Education Statistics, Integrated Postsecondary Education Data System (IPEDS), Completions Survey, provisional release data.

Science and Engineering Indicators

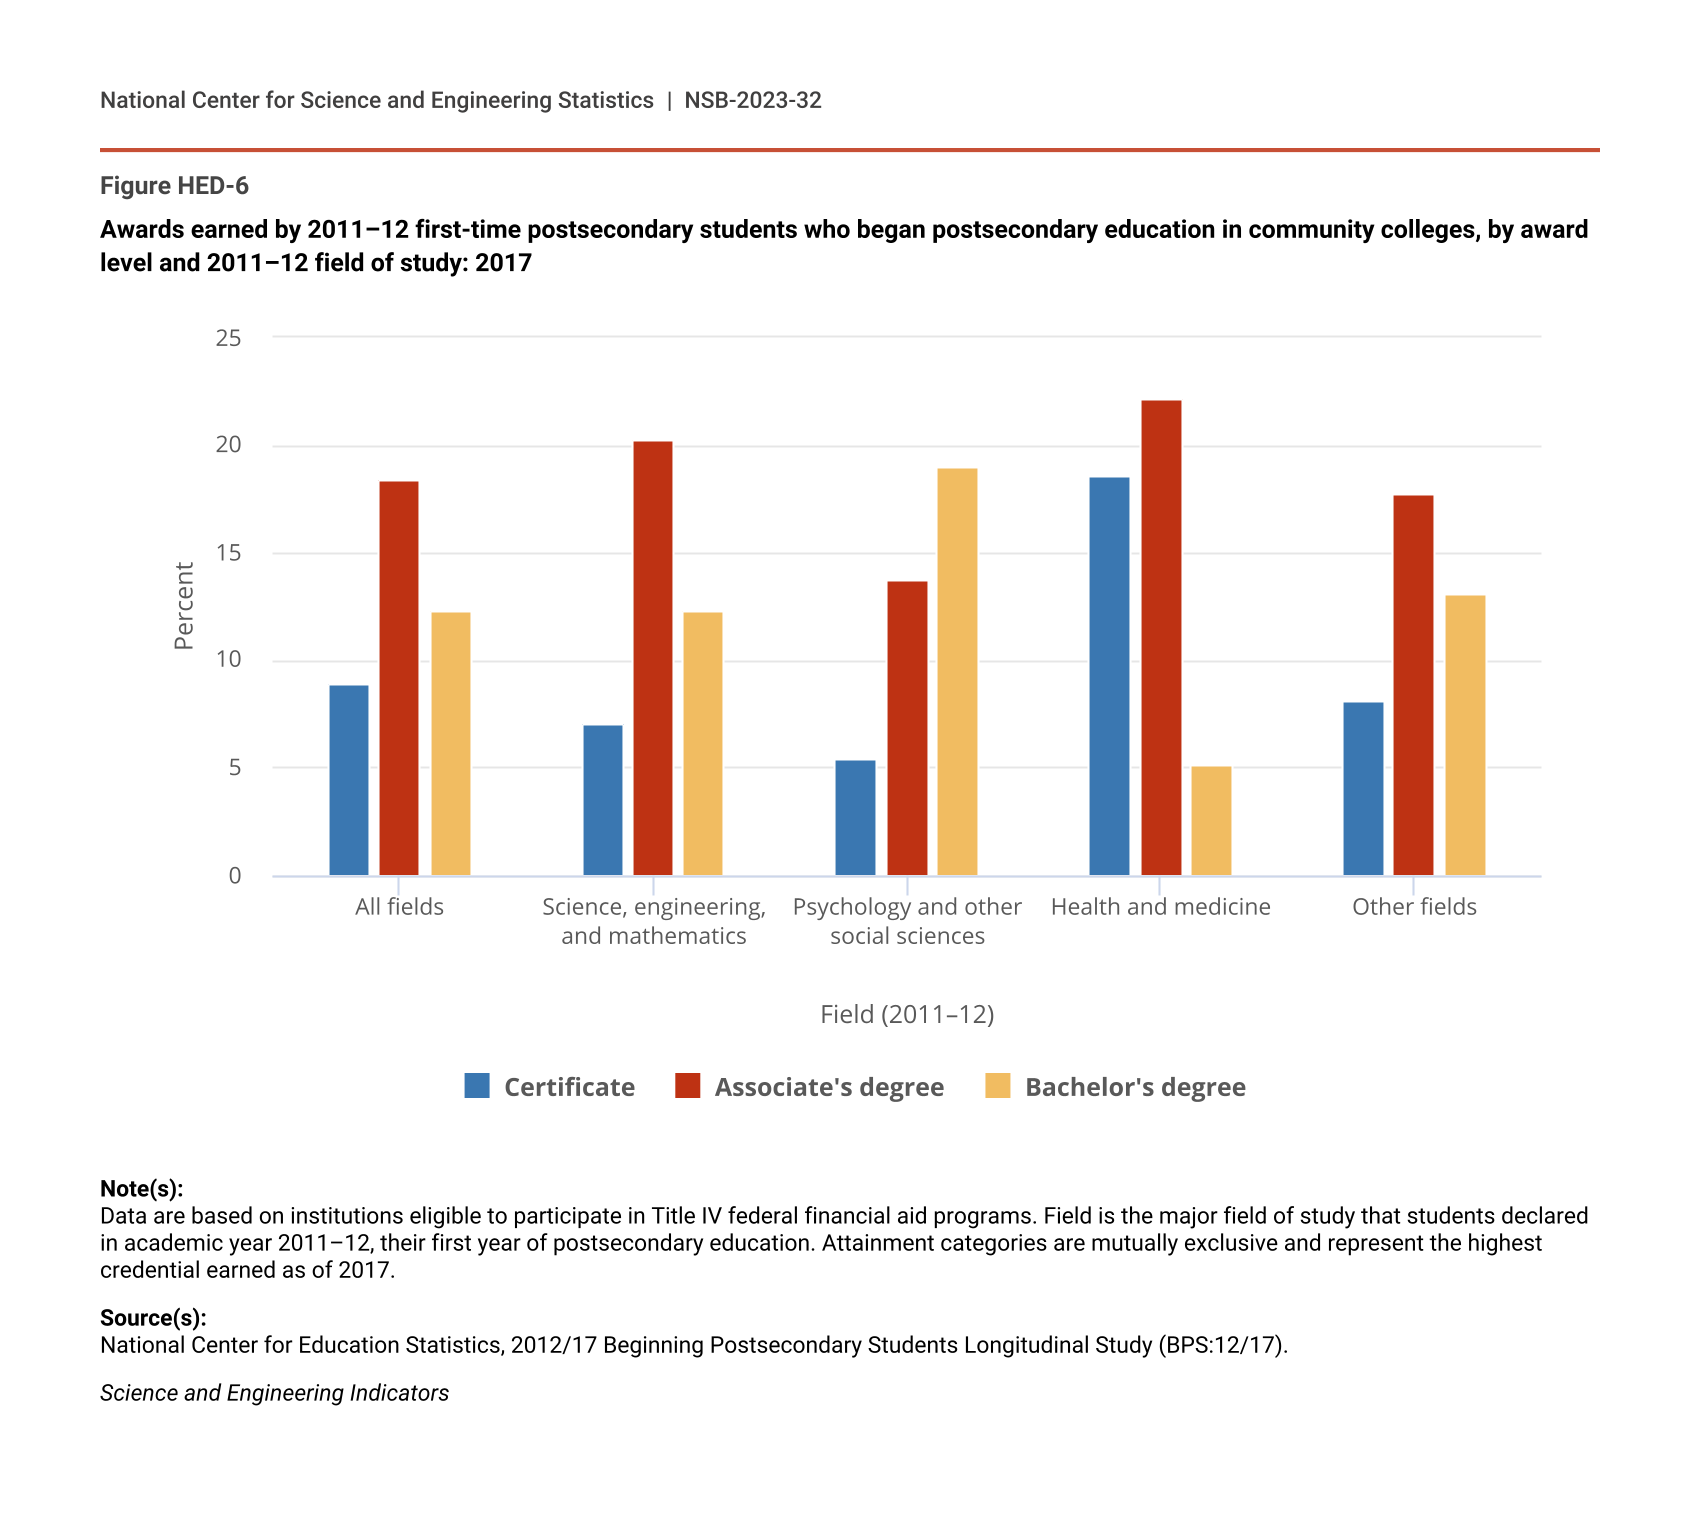
In addition to offering certificates and associate’s degrees, community colleges can be the first stop on the road to a bachelor’s or higher degree (Foley, Milan, and Hamrick 2020). Among students who began postsecondary education in science, engineering, and mathematics fields at a community college in academic year 2011–12, 12% had earned a bachelor’s degree within 6 years (i.e., by 2017) (Figure HED-6). In addition, 19% of community college students who had declared majors in psychology and other social sciences earned a bachelor’s degree within 6 years. Among 2015–16 bachelor’s degree recipients in S&E fields, about a quarter had begun postsecondary education at a community college, as had about a third of degree recipients in health and medicine (Table SHED-5).

Awards earned by 2011–12 first-time postsecondary students who began postsecondary education in community colleges, by award level and 2011–12 field of study: 2017
Keyboard instructions Hide

Awards earned by 2011–12 first-time postsecondary students who began postsecondary education in community colleges, by award level and 2011–12 field of study: 2017

Chart
Bar chart with 3 data series.
The chart has 1 X axis displaying Field (2011–12).
The chart has 1 Y axis displaying Percent. Data ranges from 5.1 to 22.2.
End of interactive chart.
(Percent)
Field (2011–12) Certificate Associate's degree Bachelor's degree
All fields 8.9 18.4 12.3
Science, engineering, and mathematics 7.1 20.3 12.3
Psychology and other social sciences 5.4 13.8 19.0
Health and medicine 18.6 22.2 5.1
Other fields 8.1 17.7 13.1
Note(s):

Data are based on institutions eligible to participate in Title IV federal financial aid programs. Field is the major field of study that students declared in academic year 2011–12, their first year of postsecondary education. Attainment categories are mutually exclusive and represent the highest credential earned as of 2017.

Source(s):

National Center for Education Statistics, 2012/17 Beginning Postsecondary Students Longitudinal Study (BPS:12/17).

Science and Engineering Indicators

Education at the associate’s degree level, predominantly offered by community colleges, also plays a role in the preparation of S&E doctorate recipients. Among individuals who earned doctorates in S&E fields between 2017 and 2021, 6% had previously earned associate’s degrees, including 12% of doctorate recipients in health sciences (Table SHED-6). Within some racial and ethnic groups, obtaining an associate’s degree was more common: 17% of American Indian or Alaska Native doctorate recipients, 10% of Black or African American doctorate recipients, and 10% of Hispanic doctorate recipients had previously earned an associate’s degree.

For-Profit Institutions

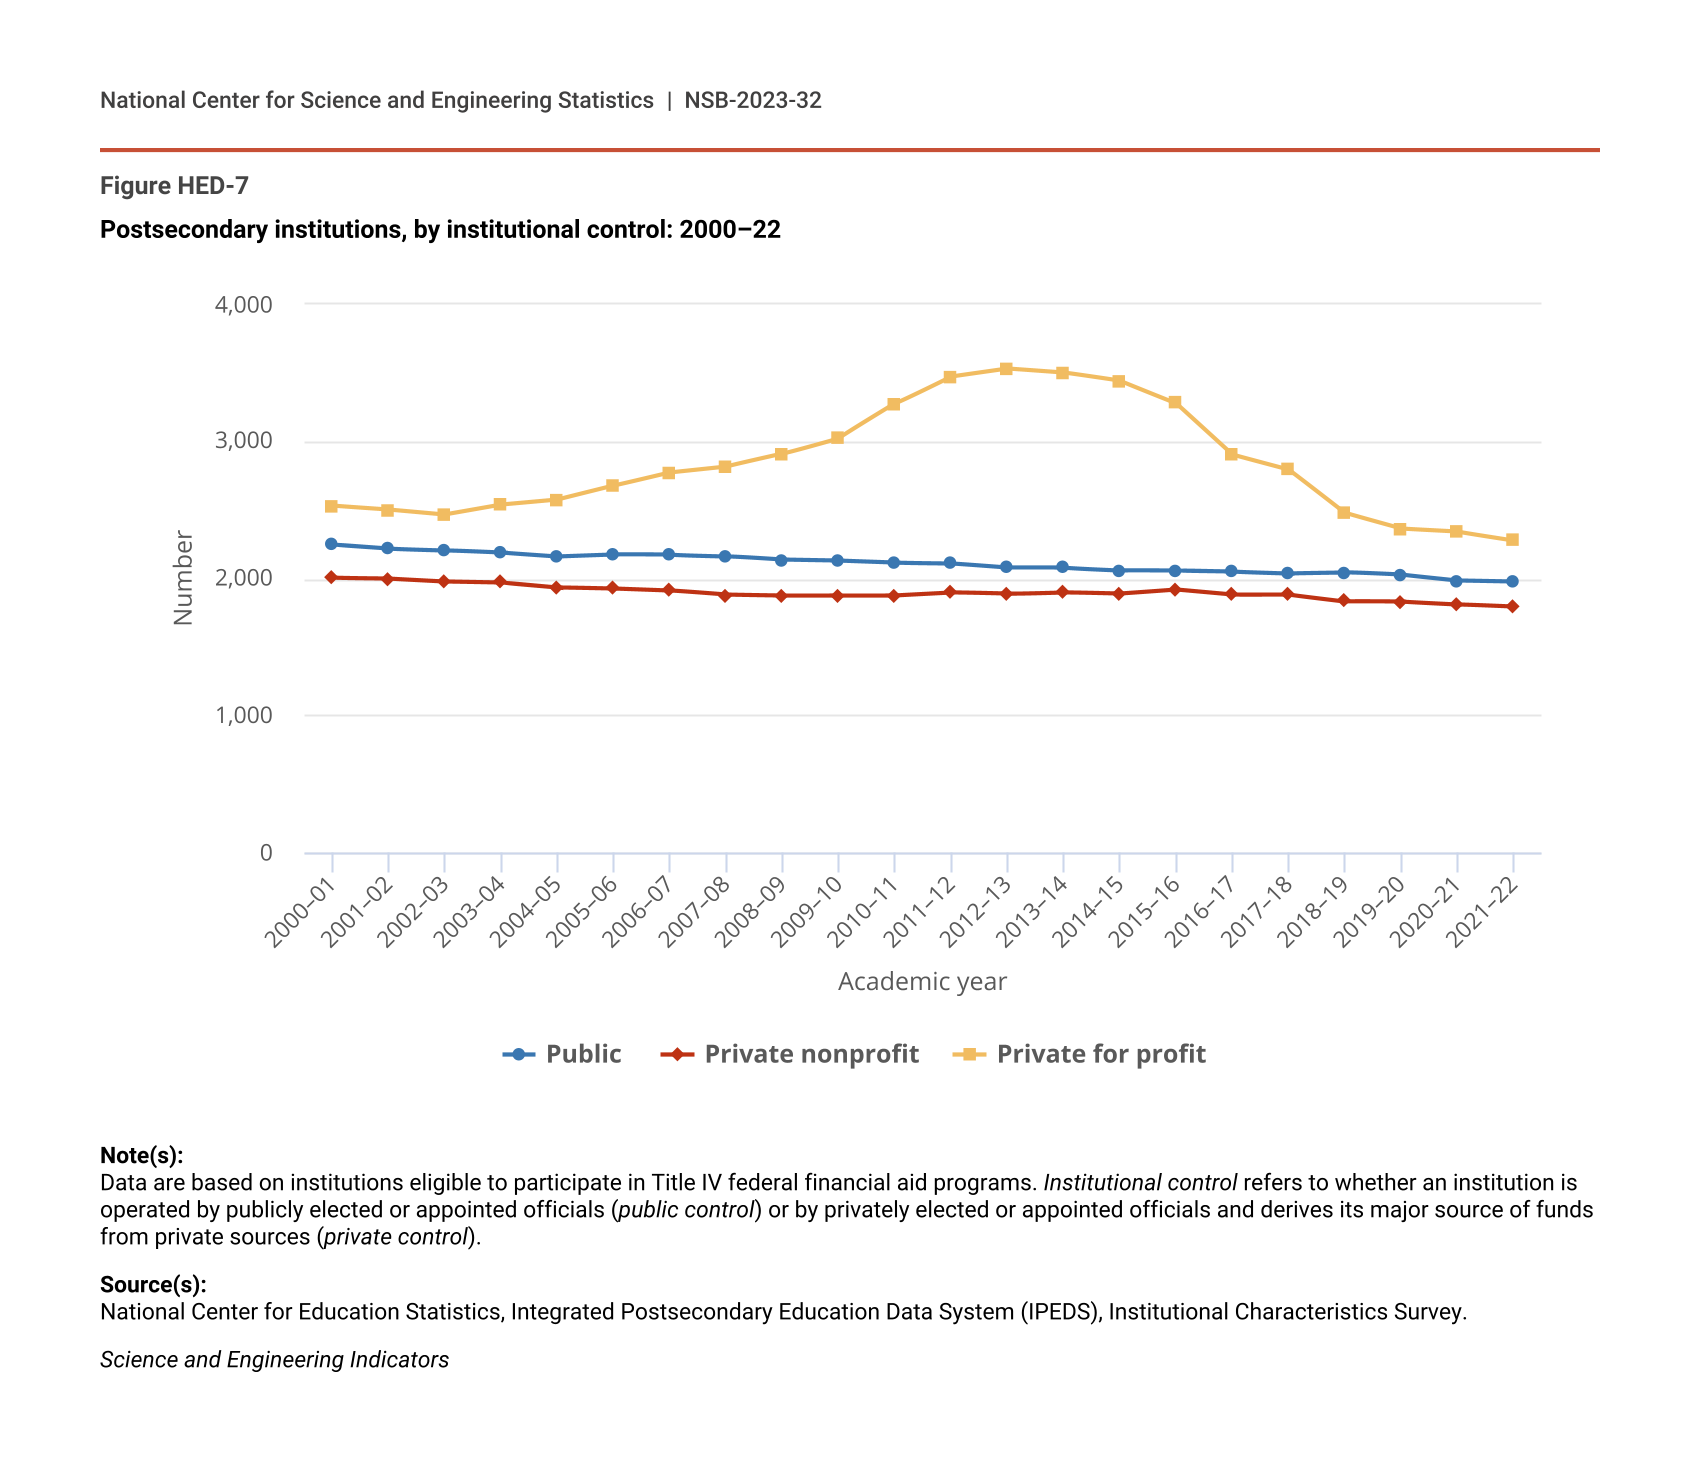
Since the advent of the Servicemen’s Readjustment Act of 1944 (GI Bill), enrollment in for-profit institutions has fluctuated considerably both in the number of students and as a percentage of all postsecondary enrollment, largely due to changes in federal financial aid regulations (Whitman 2018). Most recently, enrollment in for-profit institutions grew between 2000 and 2010 and then declined through 2018 (Table HED-2). In the early 2000s, regulations permitted for-profit institutions to realize more revenue from federal financial aid, including Pell Grants and federal student loans. The number of for-profit institutions increased, rising from 2,463 in 2002–03 to 3,533 in 2012–13 (Figure HED-7), and more financially needy students enrolled in these institutions (Deming, Goldin and Katz 2013; Fry and Cilluffo 2019). Between 2009 and 2015, the U.S. Department of Education proposed and implemented regulations that prevented institutions from participating in federal financial aid programs if too few of their graduates earned incomes sufficient to repay their loans (TICAS 2019). At least in part due to such regulations, the number of for-profit postsecondary institutions declined to 2,279 in 2021–22, and enrollment in for-profit institutions declined from 2.4 million to 1.3 million students between 2010 and 2021 (Table HED-2). At the certificate level, for-profit institutions made up 79% of U.S. institutions in 2021–22 (Table HED-1).

Total fall enrollment in postsecondary institutions, by institutional control: Selected years, 2000–21

(Number and percent change)
YearPublicPrivate nonprofitPrivate for profit
NumberPercent changeNumberPercent changeNumberPercent change
200011,891,450 empty3,137,108 empty672,851 empty
200212,883,0718.33,299,0945.2852,86226.8
200413,081,3581.53,440,5594.31,188,88139.4
200613,281,6641.53,543,4553.01,380,35516.1
200814,092,1096.13,684,7234.01,797,56330.2
201015,280,2738.43,881,9065.42,425,94535.0
201214,996,482-1.93,975,5422.42,175,031-10.3
201414,765,873-1.54,015,0941.01,882,497-13.4
201614,692,988-0.54,095,8152.01,435,266-23.8
201814,639,681-0.44,147,6041.31,221,149-14.9
202013,974,219-4.54,113,506-0.81,268,0863.8
202113,655,528-2.34,126,2890.31,254,795-1.0
Note(s):

Data are based on institutions eligible to participate in Title IV federal financial aid programs. Control refers to whether an institution is operated by publicly elected or appointed officials (public control) or by privately elected or appointed officials and derives its major source of funds from private sources (private control).

Source(s):

National Center for Education Statistics, Integrated Postsecondary Education Data System (IPEDS) Spring 2001–Spring 2021, Fall Enrollment Survey.

Science and Engineering Indicators

Postsecondary institutions, by institutional control: 2000–22
Keyboard instructions Hide

Postsecondary institutions, by institutional control: 2000–22

Chart
Line chart with 3 lines.
The chart has 1 X axis displaying Academic year.
The chart has 1 Y axis displaying Number. Data ranges from 1792 to 3533.
End of interactive chart.
(Number)
Academic year Public Private nonprofit Private for profit
2000–01 2,245 2,003 2,528
2001–02 2,216 1,999 2,500
2002–03 2,205 1,978 2,463
2003–04 2,187 1,970 2,535
2004–05 2,159 1,934 2,572
2005–06 2,173 1,925 2,674
2006–07 2,170 1,910 2,772
2007–08 2,161 1,878 2,815
2008–09 2,134 1,872 2,907
2009–10 2,127 1,873 3,023
2010–11 2,113 1,874 3,272
2011–12 2,109 1,895 3,475
2012–13 2,078 1,885 3,533
2013–14 2,077 1,897 3,503
2014–15 2,060 1,887 3,442
2015–16 2,057 1,917 3,278
2016–17 2,050 1,880 2,904
2017–18 2,038 1,882 2,795
2018–19 2,044 1,833 2,476
2019–20 2,024 1,829 2,363
2020–21 1,982 1,809 2,342
2021–22 1,974 1,792 2,279
Note(s):

Data are based on institutions eligible to participate in Title IV federal financial aid programs. Institutional control refers to whether an institution is operated by publicly elected or appointed officials (public control) or by privately elected or appointed officials and derives its major source of funds from private sources (private control).

Source(s):

National Center for Education Statistics, Integrated Postsecondary Education Data System (IPEDS), Institutional Characteristics Survey.

Science and Engineering Indicators

With the exception of certificates in S&E fields, the number of postsecondary awards conferred by for-profit institutions in S&E and S&E-related fields rose dramatically from 2000 through 2012 (Table HED-3). From 2012 through 2021, however, total awards conferred by for-profit institutions dropped precipitously, including a 48% decrease in S&E awards and a 36% decrease in S&E-related awards. Trends during this period differed between award levels and between S&E and S&E-related fields. In S&E fields, certificate and doctoral degree awards by for-profit institutions increased. In contrast, they declined in associate’s, bachelor’s, and master’s degree awards during this time. In S&E-related fields, certificate and associate’s degree awards decreased, while degree awards at the bachelor’s and master’s degree levels increased. For-profit institutions awarded no doctoral degrees in S&E-related fields through 2012 and awarded 24 doctoral degrees in 2021; however, doctoral degrees in S&E-related fields are relatively uncommon, making up about 1% of all doctoral degrees in each year from 2012 through 2021 (Table SHED-14).

Trends in for-profit institution awards, by degree level and field: 2000–21

(Number and percent)
Degree level and field200020122021Change 2000–12Change 2012–21
NumberPercentNumberPercent
Total340,259852,463521,115512,204150.5-331,348-38.9
S&E40,48078,27440,75437,79493.4-37,520-47.9
Certificate24,3777,71512,168-16,662-68.44,45357.7
Associate's degree10,42132,5135,81622,092212.0-26,697-82.1
Bachelor's degree4,00227,84012,66923,838595.7-15,171-54.5
Master's degree1,3299,4277,7408,098609.3-1,687-17.9
Doctoral degree3517792,361428121.91,582203.1
S&E-related154,831405,984258,152251,153162.2-147,832-36.4
Certificate120,971282,188150,361161,217133.3-131,827-46.7
Associate's degree30,00489,17240,47459,168197.2-48,698-54.6
Bachelor's degree2,89423,12642,35220,232699.119,22683.1
Master's degree96211,49824,94110,5361,095.213,443116.9
Doctoral degree00240NA24NA
Non-S&E144,948368,205222,209223,257154.0-145,996-39.7
Certificate91,062136,361109,25445,29949.7-27,107-19.9
Associate's degree31,79987,85222,73556,053176.3-65,117-74.1
Bachelor's degree13,33182,63649,04569,305519.9-33,591-40.6
Master's degree8,50759,06938,59750,562594.4-20,472-34.7
Doctoral degree2492,2872,5782,038818.529112.7

NA = not available.

Note(s):

Data are based on institutions eligible to participate in Title IV federal financial aid programs. Certificates include only awards of less than 2 academic years below the associate's degree level. Doctoral degree programs include research doctoral degree programs only and do not include professional doctoral programs (e.g., Doctor of Medicine).

Source(s):

National Center for Science and Engineering Statistics, special tabulations (2022) of the National Center for Education Statistics, Integrated Postsecondary Education Data System (IPEDS), Completions Survey, provisional release data.

Science and Engineering Indicators

Geographic Differences

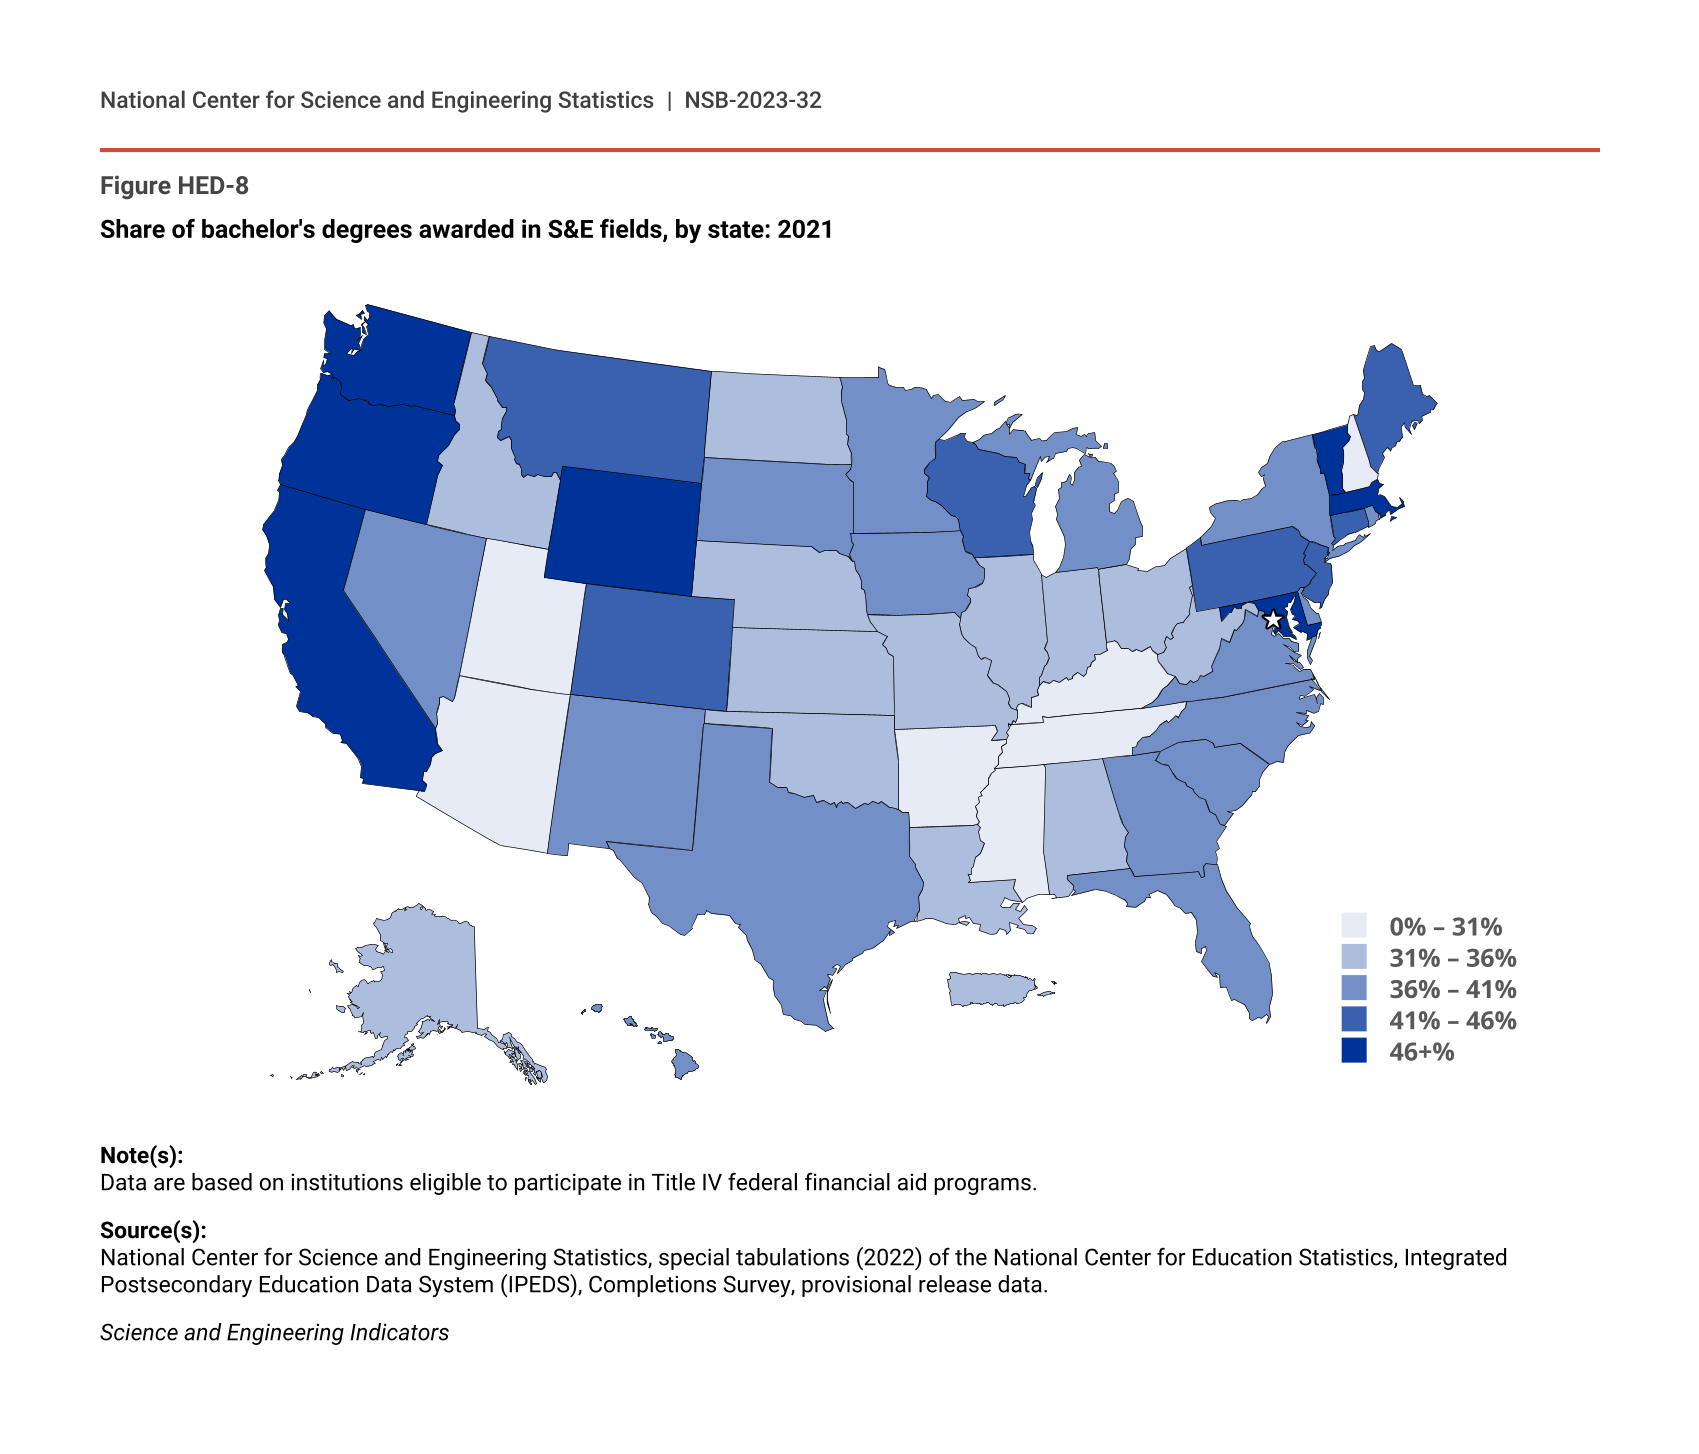
Policymakers and others have expressed concern over geographic inequities across the United States in access to high-quality S&E education and careers (NSB 2020; NSF/EHR 2020). Higher education institutions vary in the percentage of degrees they award that are in S&E fields, and this variation is apparent at the state level. States with the greatest share of bachelor’s degrees awarded in S&E fields—for example, Maryland (52%), Vermont (51%), District of Columbia (50%), California (49%), Oregon (49%), Washington (48%), and Massachusetts (46%)—were primarily on the West Coast and in the northeastern United States, with the exception of Wyoming (51%) (Figure HED-8). States with lower shares of bachelor’s degrees awarded in S&E fields were generally located in the middle and southeastern regions of the country, although the western states of Arizona (25%) and Utah (27%) had the lowest shares.

Share of bachelor's degrees awarded in S&E fields, by state: 2021
Keyboard instructions Hide

Share of bachelor's degrees awarded in S&E fields, by state: 2021

Chart
Map of United States of America with Territories with 1 data series.
Zoom inZoom out
End of interactive chart.
(Percent)
State Percent
Alabama 32.2
Alaska 35.4
Arizona 25.0
Arkansas 30.9
California 49.2
Colorado 44.2
Connecticut 42.0
Delaware 39.4
District of Columbia 50.2
Florida 36.8
Georgia 39.1
Hawaii 37.3
Idaho 32.8
Illinois 34.6
Indiana 34.3
Iowa 36.6
Kansas 32.9
Kentucky 30.3
Louisiana 35.0
Maine 42.5
Maryland 51.7
Massachusetts 46.4
Michigan 39.2
Minnesota 36.2
Mississippi 30.4
Missouri 32.7
Montana 44.4
Nebraska 33.5
Nevada 38.6
New Hampshire 30.1
New Jersey 41.5
New Mexico 39.4
New York 40.7
North Carolina 40.6
North Dakota 35.2
Ohio 34.5
Oklahoma 33.6
Oregon 48.6
Pennsylvania 41.6
Puerto Rico 35.6
Rhode Island 36.8
South Carolina 36.1
South Dakota 37.0
Tennessee 29.9
Texas 37.2
Utah 26.9
Vermont 50.6
Virginia 40.7
Washington 48.0
West Virginia 33.5
Wisconsin 41.2
Wyoming 51.4
Note(s):

Data are based on institutions eligible to participate in Title IV federal financial aid programs.

Source(s):

National Center for Science and Engineering Statistics, special tabulations (2022) of the National Center for Education Statistics, Integrated Postsecondary Education Data System (IPEDS), Completions Survey, provisional release data.

Science and Engineering Indicators

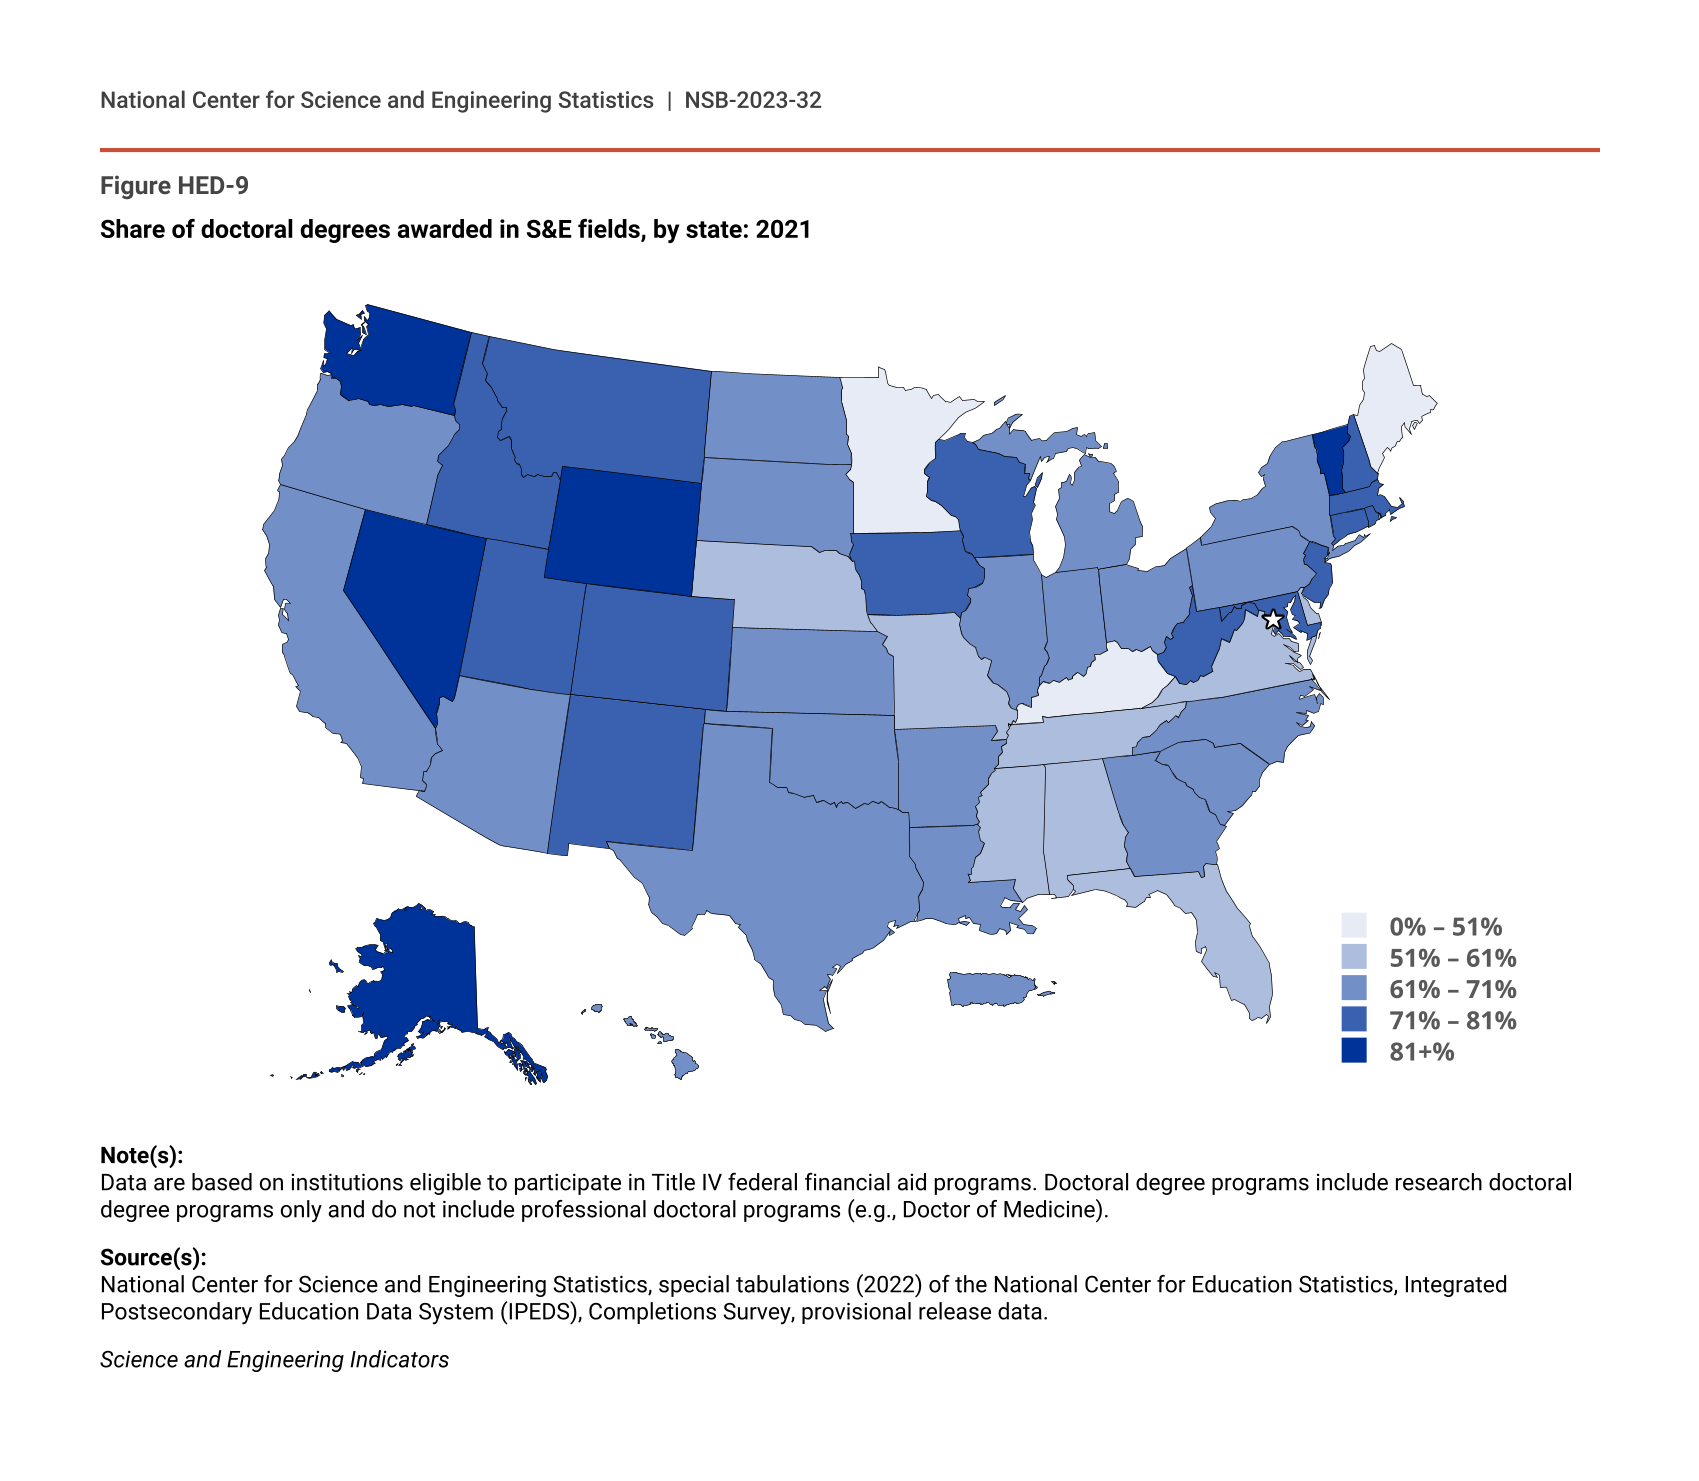
At the doctoral level, several states produced considerably higher concentrations of S&E degrees than were observed at the bachelor’s level. Alaska, which had the highest share of doctoral degrees awarded in S&E fields of any state (93%), awards a much smaller total number of doctoral degrees than most states and awards a comparatively high proportion of degrees in geosciences, atmospheric sciences, and ocean sciences (Figure HED-9). Several other states with high percentages of S&E doctoral degrees are also in the West—Washington (82%), Wyoming (82%), Nevada (81%)—and several northeastern states also awarded high percentages of doctorates in S&E fields: Vermont (82%), Massachusetts (80%), and Rhode Island (77%). In three states, institutions awarded 50% or less of all doctoral degrees in S&E fields: Kentucky (42%), Maine (43%), and Minnesota (50%).

Share of doctoral degrees awarded in S&E fields, by state: 2021
Keyboard instructions Hide

Share of doctoral degrees awarded in S&E fields, by state: 2021

Chart
Map of United States of America with Territories with 1 data series.
Zoom inZoom out
End of interactive chart.
(Percent)
State Percent
Alabama 59.2
Alaska 93.3
Arizona 61.0
Arkansas 65.1
California 68.1
Colorado 75.8
Connecticut 73.7
Delaware 57.0
District of Columbia 67.0
Florida 60.6
Georgia 70.3
Hawaii 68.1
Idaho 72.0
Illinois 63.6
Indiana 70.2
Iowa 78.8
Kansas 64.3
Kentucky 42.0
Louisiana 64.9
Maine 42.8
Maryland 75.7
Massachusetts 80.5
Michigan 68.8
Minnesota 49.8
Mississippi 57.6
Missouri 59.2
Montana 76.5
Nebraska 51.4
Nevada 81.2
New Hampshire 72.1
New Jersey 73.3
New Mexico 73.3
New York 69.5
North Carolina 69.6
North Dakota 67.5
Ohio 69.9
Oklahoma 65.1
Oregon 68.1
Pennsylvania 62.0
Puerto Rico 63.2
Rhode Island 77.0
South Carolina 66.9
South Dakota 68.9
Tennessee 53.6
Texas 65.5
Utah 73.8
Vermont 82.2
Virginia 52.8
Washington 81.8
West Virginia 78.3
Wisconsin 72.1
Wyoming 81.7
Note(s):

Data are based on institutions eligible to participate in Title IV federal financial aid programs. Doctoral degree programs include research doctoral degree programs only and do not include professional doctoral programs (e.g., Doctor of Medicine).

Source(s):

National Center for Science and Engineering Statistics, special tabulations (2022) of the National Center for Education Statistics, Integrated Postsecondary Education Data System (IPEDS), Completions Survey, provisional release data.

Science and Engineering Indicators

Online Education

Even before the COVID-19 pandemic, online coursetaking increased through the early 21st century. For many students—for example, those who commute significant distances to attend classes or who balance postsecondary education with work or family responsibilities—online courses can reduce the cost of commuting in terms of time as well as of financial resources (NCES 2021b; Travers 2020). As Web-based technology advanced the quality of online interaction, broadband Internet access became more available, and the cost of the necessary electronic devices diminished, the percentages of postsecondary students who took at least one online course increased (NCES 2021b).

The percentage of students who enrolled in online education, whether individual courses or programs, differed by award level and field of study. In 2015–16, online classes were generally more popular among master’s degree students than among certificate, associate’s, bachelor’s, or doctoral degree students. Forty-six percent of science, engineering, and mathematics, 55% of psychology and other social sciences, and 60% of health and medicine master’s degree students took an online class (Table SHED-8). Fewer doctoral students took an online course: 13% in science, engineering, and mathematics programs; 31% in psychology and other social sciences programs; and 42% in health and medicine programs. From 2012 to 2016, the share of students who took an online course increased at every level from certificate to doctoral students and in nearly all fields.

Compared with the percentage of students who took at least one online course, fewer students enrolled in postsecondary programs that were entirely online. Online programs were more common among master’s degree students than among students at other degree levels. Thirty-six percent of master’s degree students in psychology and other social sciences, as well as in health and medicine, were enrolled in online programs (Table SHED-9). Among doctoral students, larger percentages of those in psychology and other social sciences (24%) and in health and medicine (27%) were enrolled in online programs than students in science, engineering, and mathematics fields (5%). The percentage of doctoral students in science, engineering, and mathematics fields who were enrolled in online programs increased from 2% in 2012 to 5% in 2016.

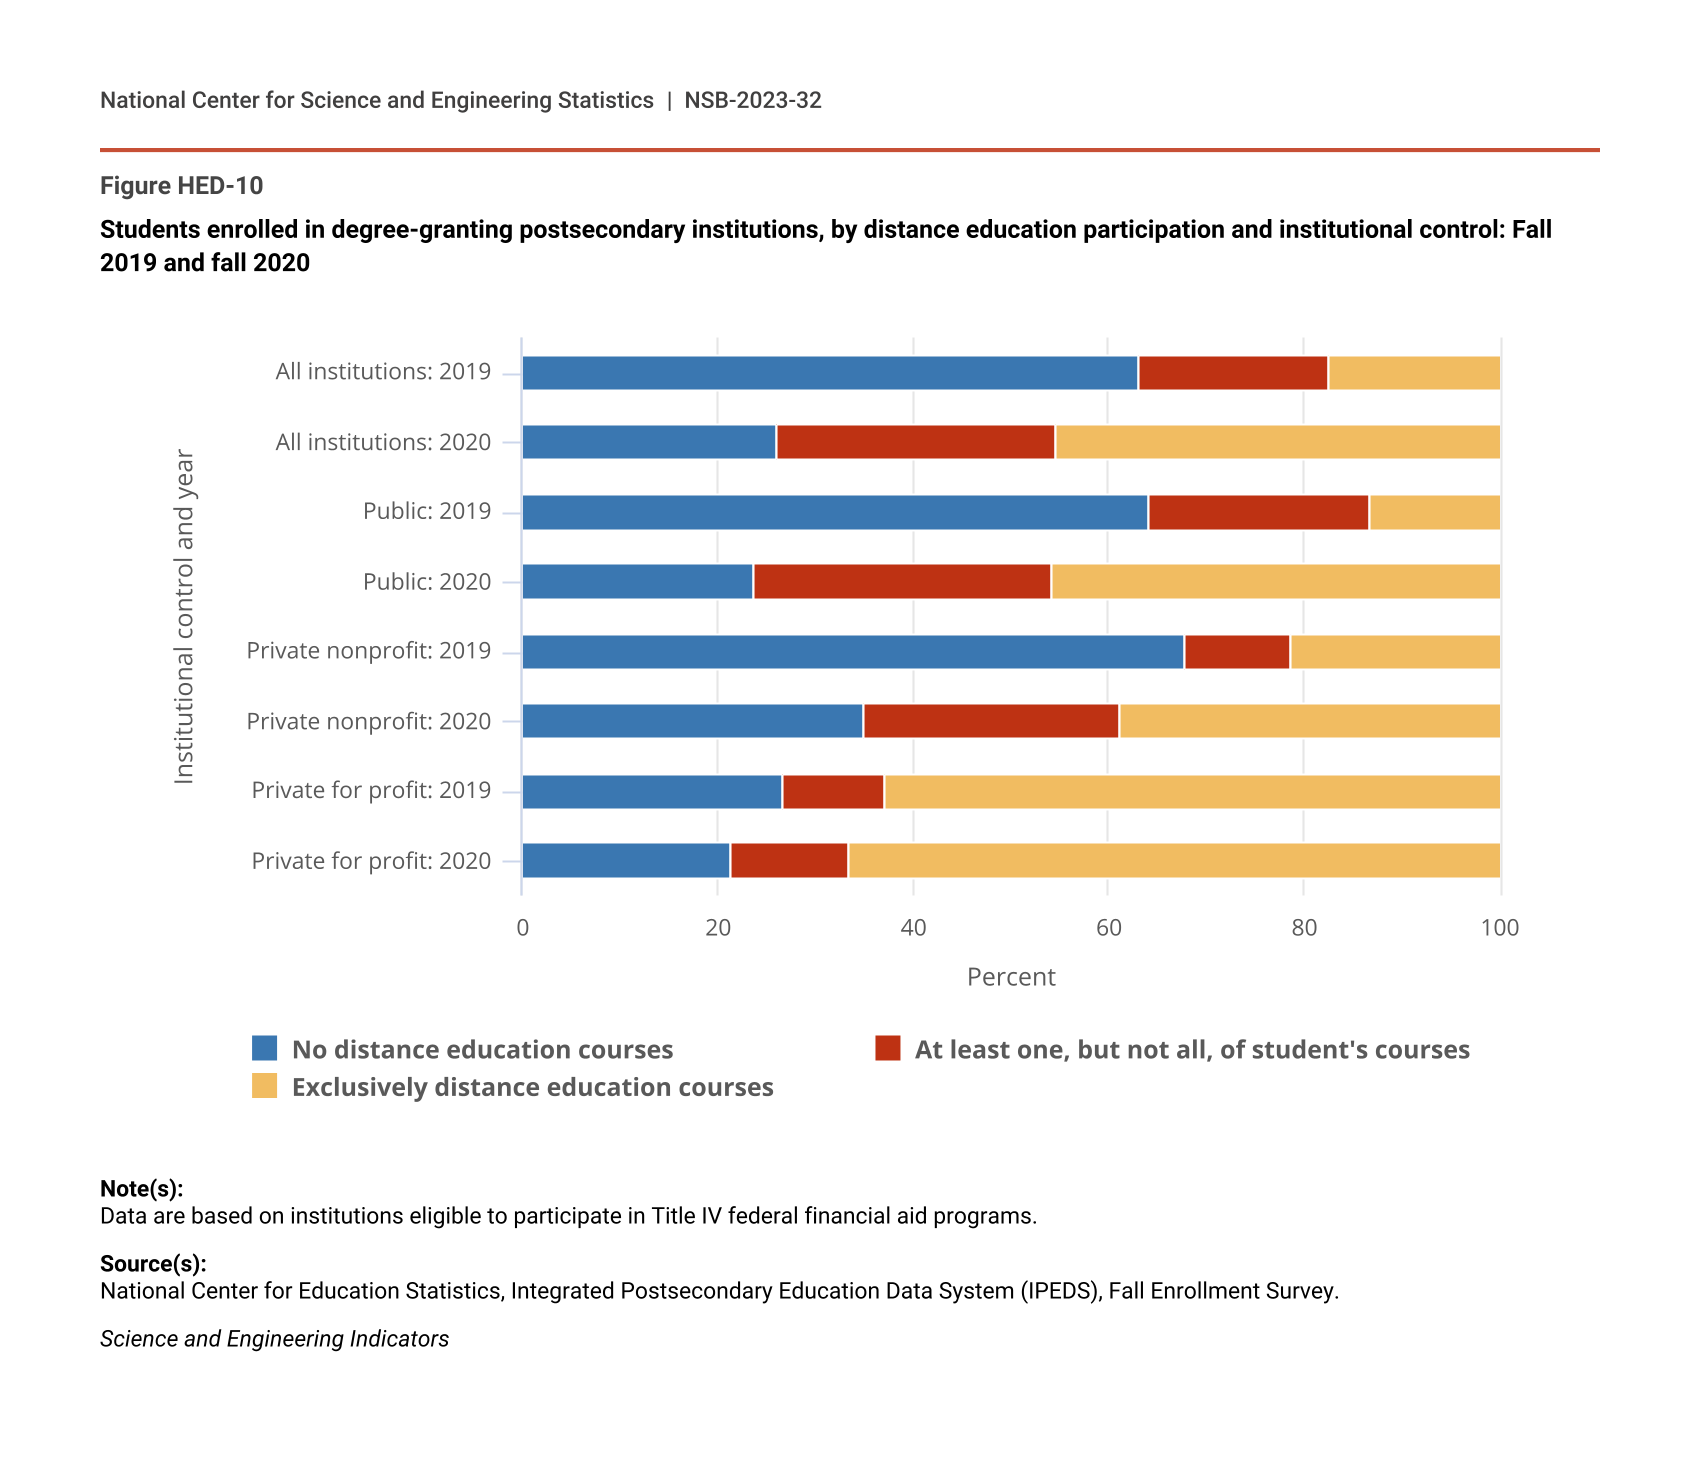
In response to the COVID-19 pandemic, public health measures required institutions to limit in-person instruction; as a consequence, participation in online postsecondary education accelerated dramatically between fall 2019 and fall 2020. In 2019, about a third of postsecondary students took at least one distance education course; in 2020, this share increased to about three-fourths (Figure HED-10). The percentage of students who took only distance education courses more than doubled between 2019 and 2020, increasing from 18% to 45%.

The increase in distance education participation between 2019 and 2020 differed by institution control, with greater increases for private nonprofit and public institutions relative to for-profit institutions, though for-profit institutions continued to have a substantially higher percentage of students taking distance education courses. For-profit institutions began offering more online instruction in the late 1990s and continuing through the 2000s and 2010s (Howarth and Stifler 2019; Whitman 2018). Consequently, the percentage of students in for-profit institutions who took only distance education courses increased from 63% in 2019 to 67% in 2020, a difference of 4 percentage points (Figure HED-10). In contrast, the percentage of students in private nonprofit institutions who took only distance education courses increased from 21% to 39%; among students in public institutions, the percentage increased from 13% to 46%.

Students enrolled in degree-granting postsecondary institutions, by distance education participation and institutional control: Fall 2019 and fall 2020
Keyboard instructions Hide

Students enrolled in degree-granting postsecondary institutions, by distance education participation and institutional control: Fall 2019 and fall 2020

Chart
Bar chart with 3 data series.
The chart has 1 X axis displaying Institutional control and year.
The chart has 1 Y axis displaying Percent. Data ranges from 21.278721278721 to 100.
End of interactive chart.
(Percent)
Institutional control and year No distance education courses At least one, but not all, of student's courses Exclusively distance education courses
All institutions: 2019 63.0 19.4 17.5
All institutions: 2020 26.0 28.5 45.5
Public: 2019 64.1 22.5 13.3
Public: 2020 23.7 30.5 45.9
Private nonprofit: 2019 67.9 10.7 21.4
Private nonprofit: 2020 35.0 26.2 38.8
Private for profit: 2019 26.7 10.5 62.8
Private for profit: 2020 21.3 12.2 66.6
Note(s):

Data are based on institutions eligible to participate in Title IV federal financial aid programs.

Source(s):

National Center for Education Statistics, Integrated Postsecondary Education Data System (IPEDS), Fall Enrollment Survey.

Science and Engineering Indicators