 An official website of the United States government
 Geographic Distribution of the STEM Workforce
Geography plays an important role not only in the capacity of a U.S. state or area to support innovative activity but also in a worker’s ability to access jobs that utilize their skills (Moretti 2013; Wright, Ellis, and Townley 2016; Chow 2022). Research also suggests that areas with denser STEM labor markets have a higher likelihood of people working in the same field as their degree (Wright, Ellis, and Townley 2016).
States Where the U.S. STEM Workers Are: 2021
In 2021, about half of U.S. states had a workforce in which at least a quarter was employed in STEM occupations. Many of these states were in the Midwest; however, several states outside the Midwest also had at least a quarter of their workforce in STEM occupations (Table SLBR-21). Notably, New Hampshire (28%), Washington (27%), Maryland (27%), South Dakota (27%), and Nebraska (27%) were among the states with the highest percentage of workers in STEM occupations.
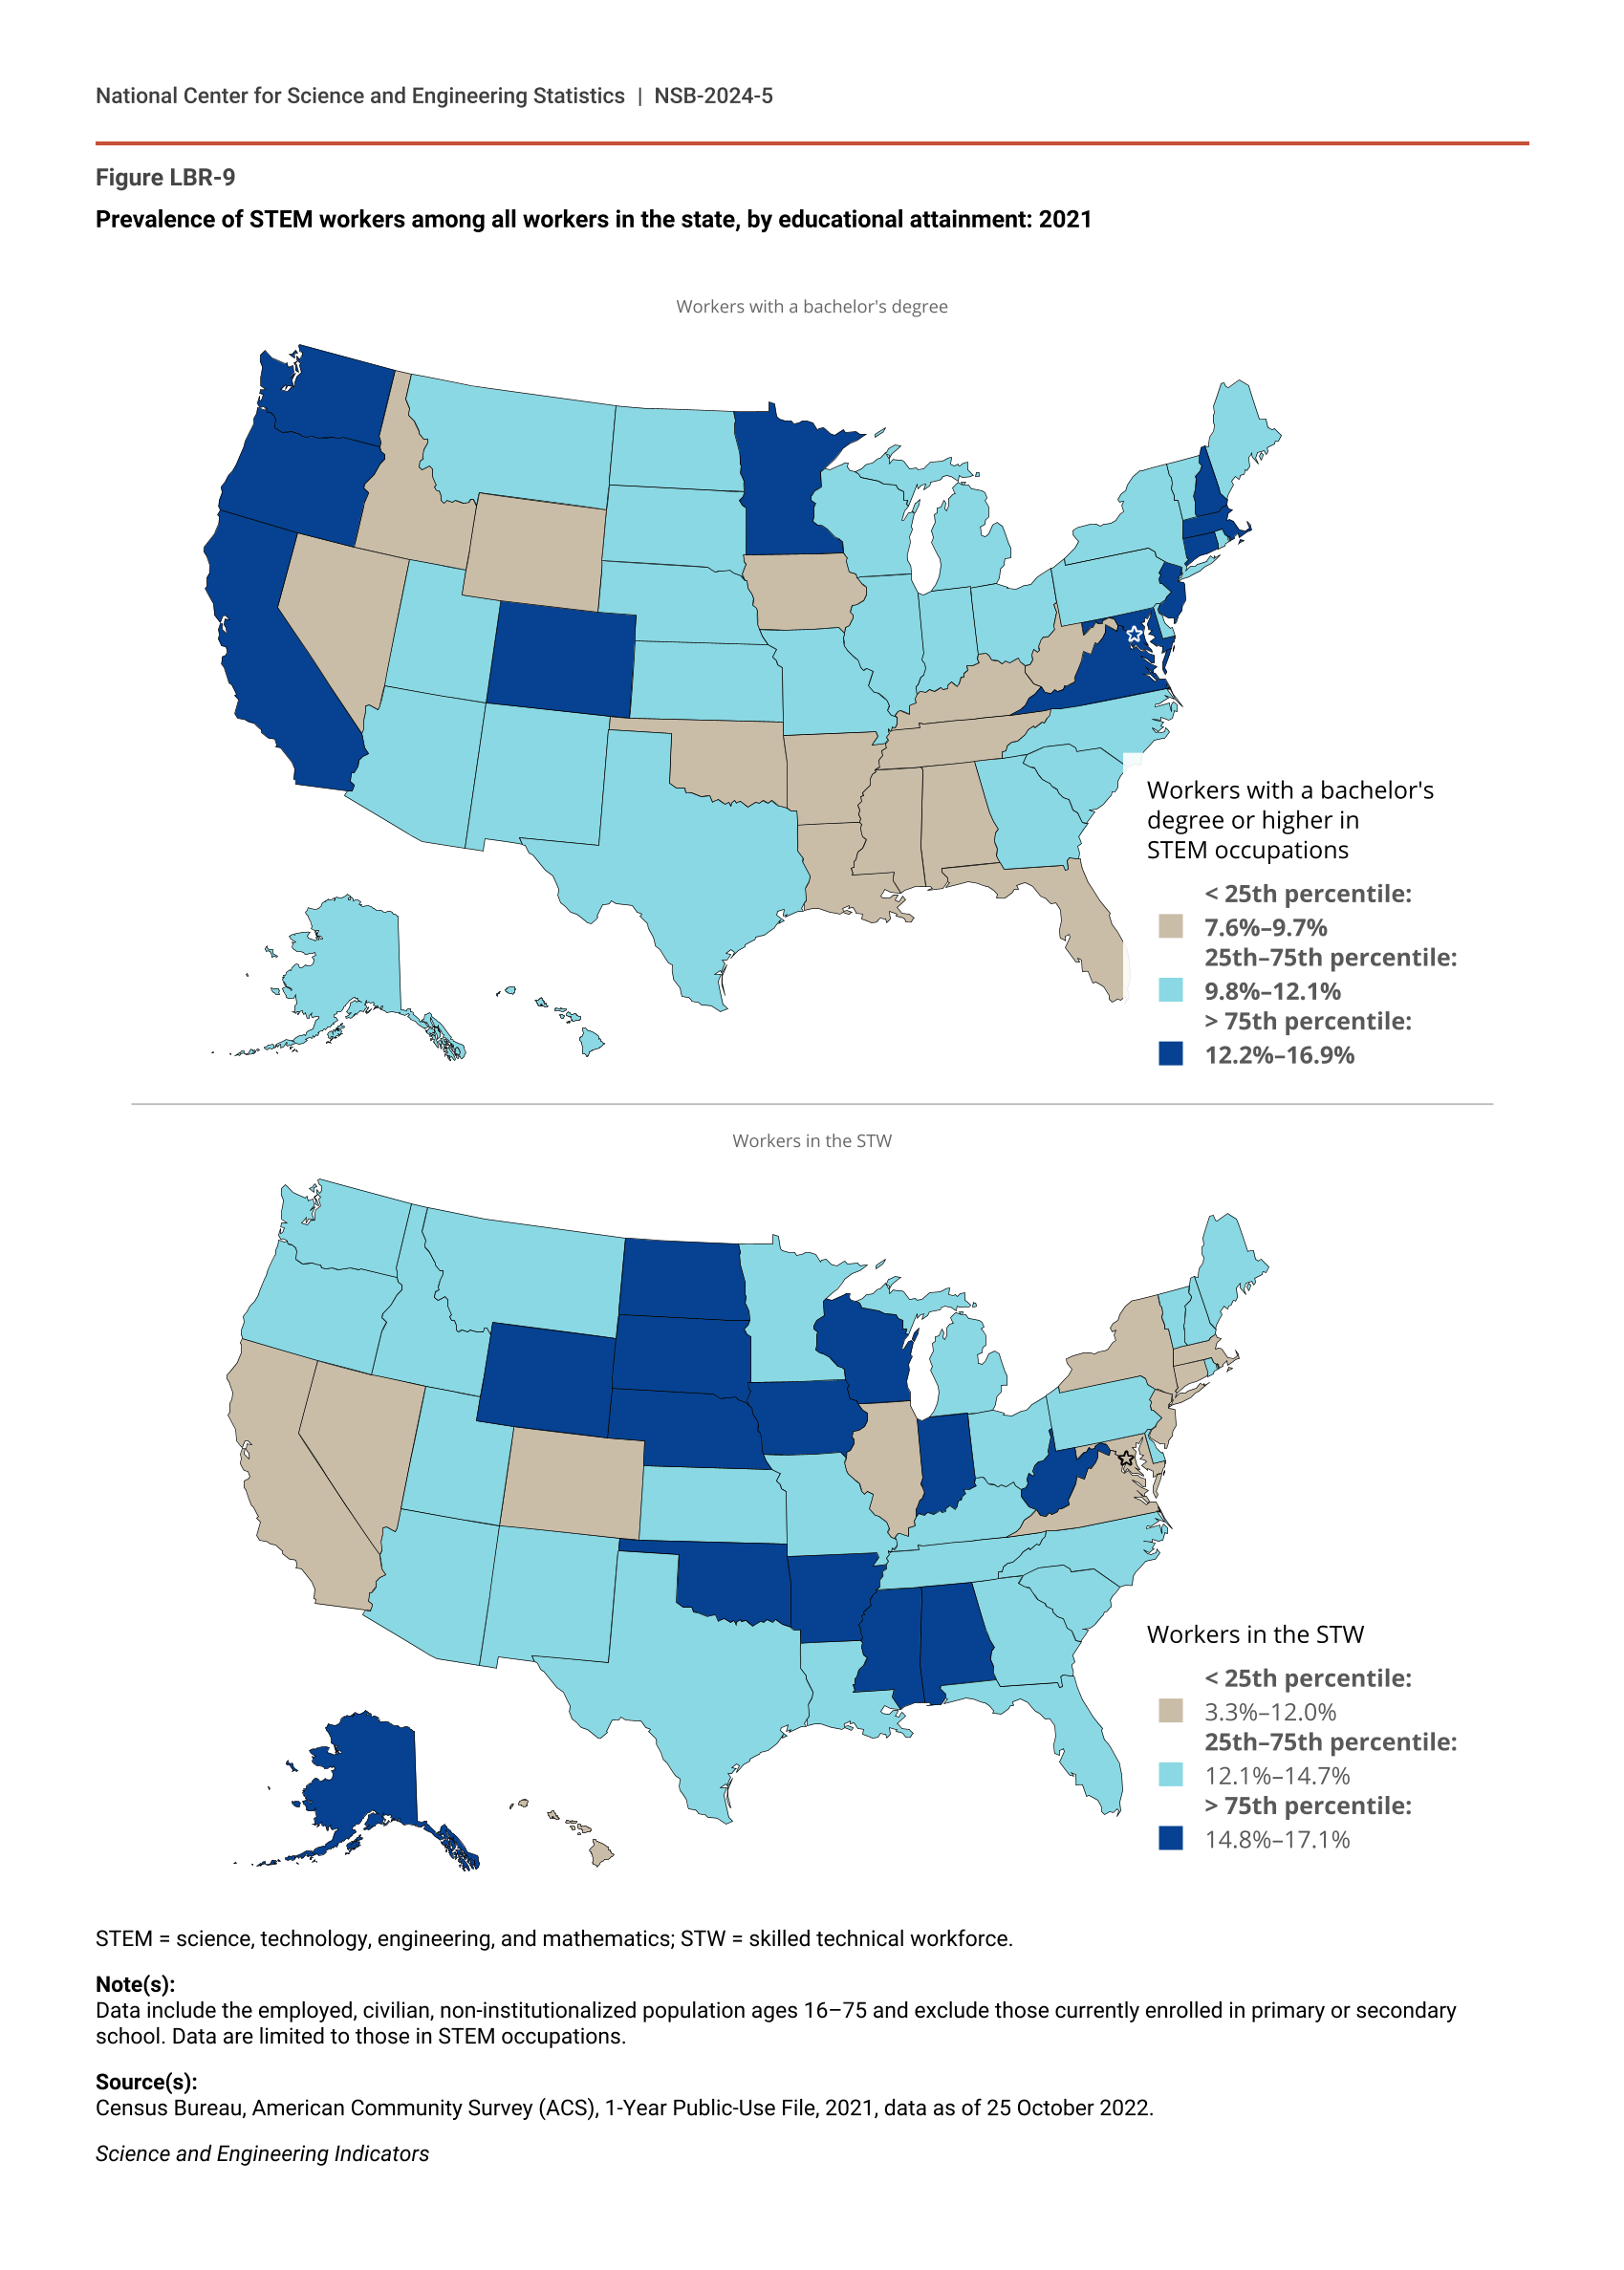
Examining the STW as a percentage of a state’s total workforce indicates that the District of Columbia had the lowest concentration of workers in a STEM occupation with less than a bachelor’s degree (STW) (3%); however, the rest of the states had between 10% and 17% of their workers in the STW (Figure LBR-9). Wyoming was among the states with the highest percentage of its workers in the STW (17%), followed closely by several states in the Midwest and South—South Dakota (16%), Iowa (16%), Indiana (16%), and Alabama (15%), to name a few.
Prevalence of STEM workers among all workers in the state, by educational attainment: 2021
| State | Workers with a bachelor's degree or higher in STEM occupations |
|---|---|
| Alabama | 9.5 |
| Alaska | 9.9 |
| Arizona | 10.7 |
| Arkansas | 8.5 |
| California | 12.7 |
| Colorado | 14.6 |
| Connecticut | 12.9 |
| Delaware | 10.8 |
| District of Columbia | 16.9 |
| Florida | 9.5 |
| Georgia | 10.6 |
| Hawaii | 10.2 |
| Idaho | 9.2 |
| Illinois | 11.9 |
| Indiana | 10.1 |
| Iowa | 9.1 |
| Kansas | 11.5 |
| Kentucky | 9.6 |
| Louisiana | 9.2 |
| Maine | 10.6 |
| Maryland | 15.2 |
| Massachusetts | 16.1 |
| Michigan | 11.6 |
| Minnesota | 12.7 |
| Mississippi | 7.6 |
| Missouri | 10.6 |
| Montana | 10.7 |
| Nebraska | 11.0 |
| Nevada | 8.5 |
| New Hampshire | 14.4 |
| New Jersey | 13.5 |
| New Mexico | 11.2 |
| New York | 11.8 |
| North Carolina | 11.5 |
| North Dakota | 10.4 |
| Ohio | 10.6 |
| Oklahoma | 8.8 |
| Oregon | 12.4 |
| Pennsylvania | 12.1 |
| Rhode Island | 11.1 |
| South Carolina | 9.9 |
| South Dakota | 10.5 |
| Tennessee | 9.7 |
| Texas | 10.5 |
| Utah | 10.6 |
| Vermont | 12.1 |
| Virginia | 14.0 |
| Washington | 14.9 |
| West Virginia | 9.2 |
| Wisconsin | 10.7 |
| Wyoming | 7.8 |
| State | Workers in the STW |
|---|---|
| Alabama | 15.5 |
| Alaska | 14.9 |
| Arizona | 12.9 |
| Arkansas | 15.5 |
| California | 10.7 |
| Colorado | 11.1 |
| Connecticut | 11.4 |
| Delaware | 13.4 |
| District of Columbia | 3.3 |
| Florida | 12.1 |
| Georgia | 12.7 |
| Hawaii | 11.0 |
| Idaho | 14.2 |
| Illinois | 11.8 |
| Indiana | 15.6 |
| Iowa | 15.9 |
| Kansas | 14.0 |
| Kentucky | 14.6 |
| Louisiana | 14.6 |
| Maine | 13.1 |
| Maryland | 11.6 |
| Massachusetts | 10.4 |
| Michigan | 14.3 |
| Minnesota | 13.5 |
| Mississippi | 15.5 |
| Missouri | 14.1 |
| Montana | 13.9 |
| Nebraska | 15.5 |
| Nevada | 11.8 |
| New Hampshire | 13.4 |
| New Jersey | 10.3 |
| New Mexico | 12.9 |
| New York | 9.9 |
| North Carolina | 13.7 |
| North Dakota | 15.3 |
| Ohio | 14.5 |
| Oklahoma | 15.1 |
| Oregon | 12.4 |
| Pennsylvania | 13.0 |
| Rhode Island | 12.9 |
| South Carolina | 14.4 |
| South Dakota | 16.3 |
| Tennessee | 13.9 |
| Texas | 13.0 |
| Utah | 13.7 |
| Vermont | 14.3 |
| Virginia | 11.9 |
| Washington | 12.1 |
| West Virginia | 15.1 |
| Wisconsin | 15.4 |
| Wyoming | 17.1 |
STEM = science, technology, engineering, and mathematics; STW = skilled technical workforce.
Note(s):
Data include the employed, civilian, non-institutionalized population ages 16–75 and exclude those currently enrolled in primary or secondary school. Data are limited to those in STEM occupations.
Source(s):
Census Bureau, American Community Survey (ACS), 1-Year Public-Use File, 2021, data as of 25 October 2022.
Science and Engineering Indicators
The STEM Workforce within States
While state-level data provide important information about state-level economies, local economies may be different than the state-level numbers (Table SLBR-22). This is to be expected for states large in both population and land area—such as Texas, Florida, New York, and California—given that they have multiple cities and large rural regions. However, variations exist across states of all sizes. The estimates referenced in this section were rendered at the smallest level of geography available in the ACS—the Public Use Microdata Area (PUMA). PUMAs indicate where individuals live rather than work (Census Bureau 2021). PUMAs are geographic areas that contain at least 100,000 people, and while some PUMAs are geographically large, such as Northern Arizona, others cover smaller, more densely populated areas, such as in and around Phoenix, Arizona. PUMAs do not cross state lines but do allow for analysis of areas that cross state lines, such as the cluster of PUMAs in northern Virginia, the District of Columbia, and Southern Maryland that represent the larger economy of the District of Columbia region. For ease of discussion, Table SLBR-22 contains both the PUMA label and the Metropolitan Statistical Area (MSA) where all or most of the PUMA falls when a PUMA is in an MSA (IPUMS 2020). Comparisons to national proportions of workers come from Table SLBR-2.
The percentage of PUMA residents working in STEM occupations varies widely. Nationally, 21.6% of workers worked in a STEM occupation, while about 45% of resident workers were employed in STEM occupations in three PUMAs in the San Jose–Sunnyvale–Santa Clara, CA, MSA (i.e., Silicon Valley). In contrast, three PUMAs in the Bronx borough of New York City and two in Laredo, Texas, had 12% or fewer resident workers employed in STEM occupations. Overall, there were 20 MSAs in 13 states with at least 1 PUMA that had 35% or more of the residents employed in STEM occupations.
Types of occupations tended to cluster. Nationally, about 4.2% of workers were in S&E occupations, with some areas having higher and lower densities of S&E workers. For example, the 10 PUMAs with 25% or more of workers in S&E occupations were in 4 MSAs: San Jose–Sunnyvale–Santa Clara, CA; San Francisco–Oakland-Hayward, CA; Seattle-Tacoma-Bellevue, WA; and Boston-Cambridge-Newton, MA-NH. Conversely, 55 PUMAs in 22 states had about 1% or less of workers employed in an S&E occupation, including 1 PUMA in the Merced, CA, MSA, which is less than 100 miles southeast of the high S&E occupation PUMAs in San Jose–Sunnyvale–Santa Clara, CA, MSA.
S&E-related occupation data highlight different PUMAs. Specifically, 22% of workers in the PUMA that covers Rochester, Minnesota (where the Mayo Clinic is located), worked in S&E-related occupations, which include many health care occupations, compared to 8% of the national workforce. Other PUMAs with around 17% or more of their workers in S&E-related occupations were in the Albuquerque, NM; New York–Newark–Jersey City, NY-NJ-PA; Philadelphia-Camden-Wilmington, PA-NJ-DE-MD; Lafayette, LA; Durham–Chapel Hill, NC; and Houston–The Woodlands–Sugar Land, TX, MSAs. The PUMAs with about 3% or fewer workers in S&E-related occupations overall tended to also have low percentages of workers in S&E occupations. Specifically, of PUMAs with 3% or fewer residents working in S&E-related occupations, only 1 (Atlanta, DeKalb County South) had about 4% of workers in S&E occupations. Of the 9 PUMAs with 20% or more of residents working in STEM middle-skill occupations, 5 were in Texas, with 3 of those 5 in the Houston–The Woodlands–Sugar Land, TX, MSA.