 An official website of the United States government
 Federal Support for U.S. R&D
U.S. federal obligations for R&D and R&D plant are presented by fiscal year, through FY 2023, in current U.S. dollars. (FY 2023 data are preliminary and are subject to revisions.) Obligations offer a different and complementary perspective of federal R&D funding discussed earlier using National Patterns statistics. Obligations represent the monetary amount for orders placed, contracts awarded, services received, and other similar transactions by federal agencies, regardless of when the funds were appropriated and when future payments may be required. Funding may be devoted to internal or intramural R&D performance (agency laboratories and other facilities as well as FFRDCs) or to external performers, notably academic institutions for basic research, as well as businesses, state and local governments, and nonprofit organizations.
Federal funding for R&D has been a key feature of U.S. science and technology policy for decades, supporting national defense, space exploration, energy, health, general science, and other national goals (CRS 2022c; Mowery 1992; Pece 2023a; NASEM 2020). Since 2008, total obligations for R&D and R&D plant have fluctuated, with notable increases in FYs 2009–10 and further increases in 2019–21 (Table RD-10). These earlier fluctuations are partly due to the 2009 ARRA, which brought with it historical R&D funding peaks in FYs 2009 and 2010 (and relative drops in total R&D obligations in the following years). Later increases in FYs 2019–22 were the result of supplemental COVID-19-related appropriations like the Coronavirus Aid, Relief, and Economic Security (CARES) Act, which declined in FY 2023 (Pece 2023b, 2024). In addition to the CARES Act, a number of laws have been enacted that impact federal R&D obligations, including the Creating Helpful Incentives to Produce Semiconductors (CHIPS) and Science Act of 2022 as well as the Infrastructure Investment and Jobs Act (IIJA) and the Inflation Reduction Act (IRA). The last section summarizes information on several federal funding areas related to critical and emerging technologies.
Federal obligations for R&D and R&D plant, by agency: FYs 2008–23
na = not applicable.
a Beginning with FY 2016, the totals reported for development obligations represent a refinement to this category by more narrowly defining it to be "experimental development." Most notably, totals for development do not include the Department of Defense (DOD) Budget Activity 7 (Operational Systems Development) obligations. Those funds, previously included in DOD's development obligation totals, support the development efforts to upgrade systems that have been fielded or have received approval for full rate production and anticipate production funding in the current or subsequent fiscal year. Therefore, the data are not directly comparable with totals reported in previous years.
Note(s):
Because of rounding in source tables, detail may not add to total. This table lists (in general) agencies with R&D and R&D plant obligations greater than $100 million in FY 2023. Agency rankings are based on FY 2023 data. All other agencies includes the Department of Housing and Urban Development, Department of Labor, Department of State, Department of the Treasury, Administrative Office of the U.S. Courts, Appalachian Regional Commission, Consumer Product Safety Commission, Federal Communications Commission, Federal Trade Commission, Library of Congress, National Archives and Records Commission, Nuclear Regulatory Commission, Tennessee Valley Authority, RESTORE Act Centers, Agency for Global Media, and Postal Service. FYs 2009–10 obligations include additional funding provided by the American Recovery and Reinvestment Act of 2009. Obligations for FYs 2020–22 include additional funding provided by supplemental COVID-19-related appropriations (e.g., Coronavirus Aid, Relief, and Economic Security [CARES] Act).
Source(s):
National Center for Science and Engineering Statistics, Survey of Federal Funds for Research and Development, Volume 72, FYs 2022–23.
Science and Engineering Indicators
Federal Obligations for R&D and R&D Plant, by Major Agencies
Continuing an ongoing trend, a small number of agencies’ FY 2022 R&D and R&D plant obligations constituted the majority of total federal obligations. The Department of Health and Human Services (HHS) ($74.4 billion, or 38% of total) and the Department of Defense (DOD) ($72.6 billion, or 37% of total) together accounted for around three-fourths of the $196.6 billion federal total. Other top agencies included the Department of Energy (DOE) ($18.0 billion, or 9% of total), the National Aeronautics and Space Administration (NASA) ($11.8 billion, or 6% of total), and NSF ($7.4 billion, or 4% of total) (Table RD-10).
In FY 2022, total obligations for R&D and R&D plant remained on par with FY 2021 ($196.6 billion and $193.9 billion, respectively). The CAGR from 2017 to 2022 was 10.1%, with preliminary estimates indicating FY 2023’s funding obligations will decrease slightly to $193.0 billion. DOD R&D and R&D plant obligations increased 2% to $72.6 billion in FY 2022, from $70.9 billion in FY 2021. HHS funding decreased 3% in FY 2022 ($74.4 billion, down from $77.1 billion in FY 2021) following a 25% increase in the year prior (from $61.8 billion in FY 2020) and a 57% increase in FY 2020 (from $39.4 billion in FY 2019).
Distribution of Federal Obligations, by Performer and Type of R&D
Agencies obligate funds for R&D and R&D plant to intramural or extramural performers and for different types of R&D (basic research, applied research, or experimental development). R&D accounted for approximately 97% of the total R&D and R&D plant obligations in FY 2022 ($190.4 billion of the total $196.6 billion), with R&D plant (facilities and major equipment) accounting for the remaining 3% ($6.2 billion) (Table RD-11). For each of the top 15 agencies presented in Table RD-11, R&D plant accounted for a minority of overall R&D obligations, with DOE having the most R&D plant obligations ($4.3 billion of the total $6.2 billion across all agencies), followed by NSF with $529 million.
Federal obligations for R&D and R&D plant, by agency and performer: FY 2022
Note(s):
Because of rounding in source tables, detail may not add to total. This table lists all agencies covered in Table RD-10 and as ranked there. R&D is basic research, applied research, and experimental development, and it does not include R&D plant. Intramural activities include actual intramural R&D performance and costs associated with planning and administration of both intramural and extramural programs by federal personnel, including federally funded research and development centers. Extramural performers includes federally funded R&D performed in the United States and U.S. territories by businesses, universities and colleges, other nonprofit institutions, state and local governments, and foreign organizations. FY 2022 obligations include additional funding provided by supplemental COVID-19-related appropriations (e.g., Coronavirus Aid, Relief, and Economic Security [CARES] Act). All other agencies includes the Department of Housing and Urban Development, Department of Labor, Department of State, Department of the Treasury, Administrative Office of the U.S. Courts, Appalachian Regional Commission, Consumer Product Safety Commission, Federal Communications Commission, Federal Trade Commission, Library of Congress, National Archives and Records Commission, Nuclear Regulatory Commission, Tennessee Valley Authority, RESTORE Act Centers, Agency for Global Media, and Postal Service.
Source(s):
National Center for Science and Engineering Statistics, Survey of Federal Funds for Research and Development, Volume 72, FYs 2022–23.
Science and Engineering Indicators
Extramural performers (businesses, higher education institutions, nonprofit organizations, state and local governments, and foreign organizations) accounted for 54% of R&D and R&D plant obligations ($105.9 billion) across all agencies in FY 2022, and intramural performers (which include both federal agencies’ conduct of R&D as well as obligations to FFRDCs) accounted for 46% ($90.7 billion). Yet the percentage of FY 2022 federal R&D and R&D plant obligations for extramural recipients varied greatly among agencies. Extramural recipients accounted for 27% of the agency’s total at DOE and 59% at DOD. At NSF and at the Patient-Centered Outcomes Research Trust Fund, extramural performers accounted for all or virtually all R&D and R&D plant funding, with 94% and 100%, respectively (Table RD-11).
Across all agencies, 24% of federal R&D obligations were devoted to basic research ($45.4 billion), 25% to applied research ($48.4 billion), and 51% to experimental development ($96.6 billion) in FY 2022 (Table RD-12). For DOD, 86% of total R&D was for experimental development ($62.2 billion), with 14% for applied research and basic research combined ($10.2 billion). In contrast, at NSF, 85% of R&D obligations were for basic research ($5.9 billion), with 15% ($1.0 billion) for applied research and no obligations for experimental development.
Federal obligations for R&D, by agency and type of R&D: FY 2022
Note(s):
This table lists all agencies covered in Table RD-10 and as ranked there. Because of rounding in source tables, detail may not add to total. FY 2022 obligations include additional funding provided by supplemental COVID-19-related appropriations (e.g., Coronavirus Aid, Relief, and Economic Security [CARES] Act). All other agencies includes the Department of Housing and Urban Development, Department of Labor, Department of State, Department of the Treasury, Administrative Office of the U.S. Courts, Appalachian Regional Commission, Consumer Product Safety Commission, Federal Communications Commission, Federal Trade Commission, Library of Congress, National Archives and Records Commission, Nuclear Regulatory Commission, Tennessee Valley Authority, RESTORE Act Centers, Agency for Global Media, and Postal Service.
Source(s):
National Center for Science and Engineering Statistics, Survey of Federal Funds for Research and Development, Volume 72, FYs 2022–23.
Science and Engineering Indicators
Distribution of Federal Obligations for Research, by S&E Fields
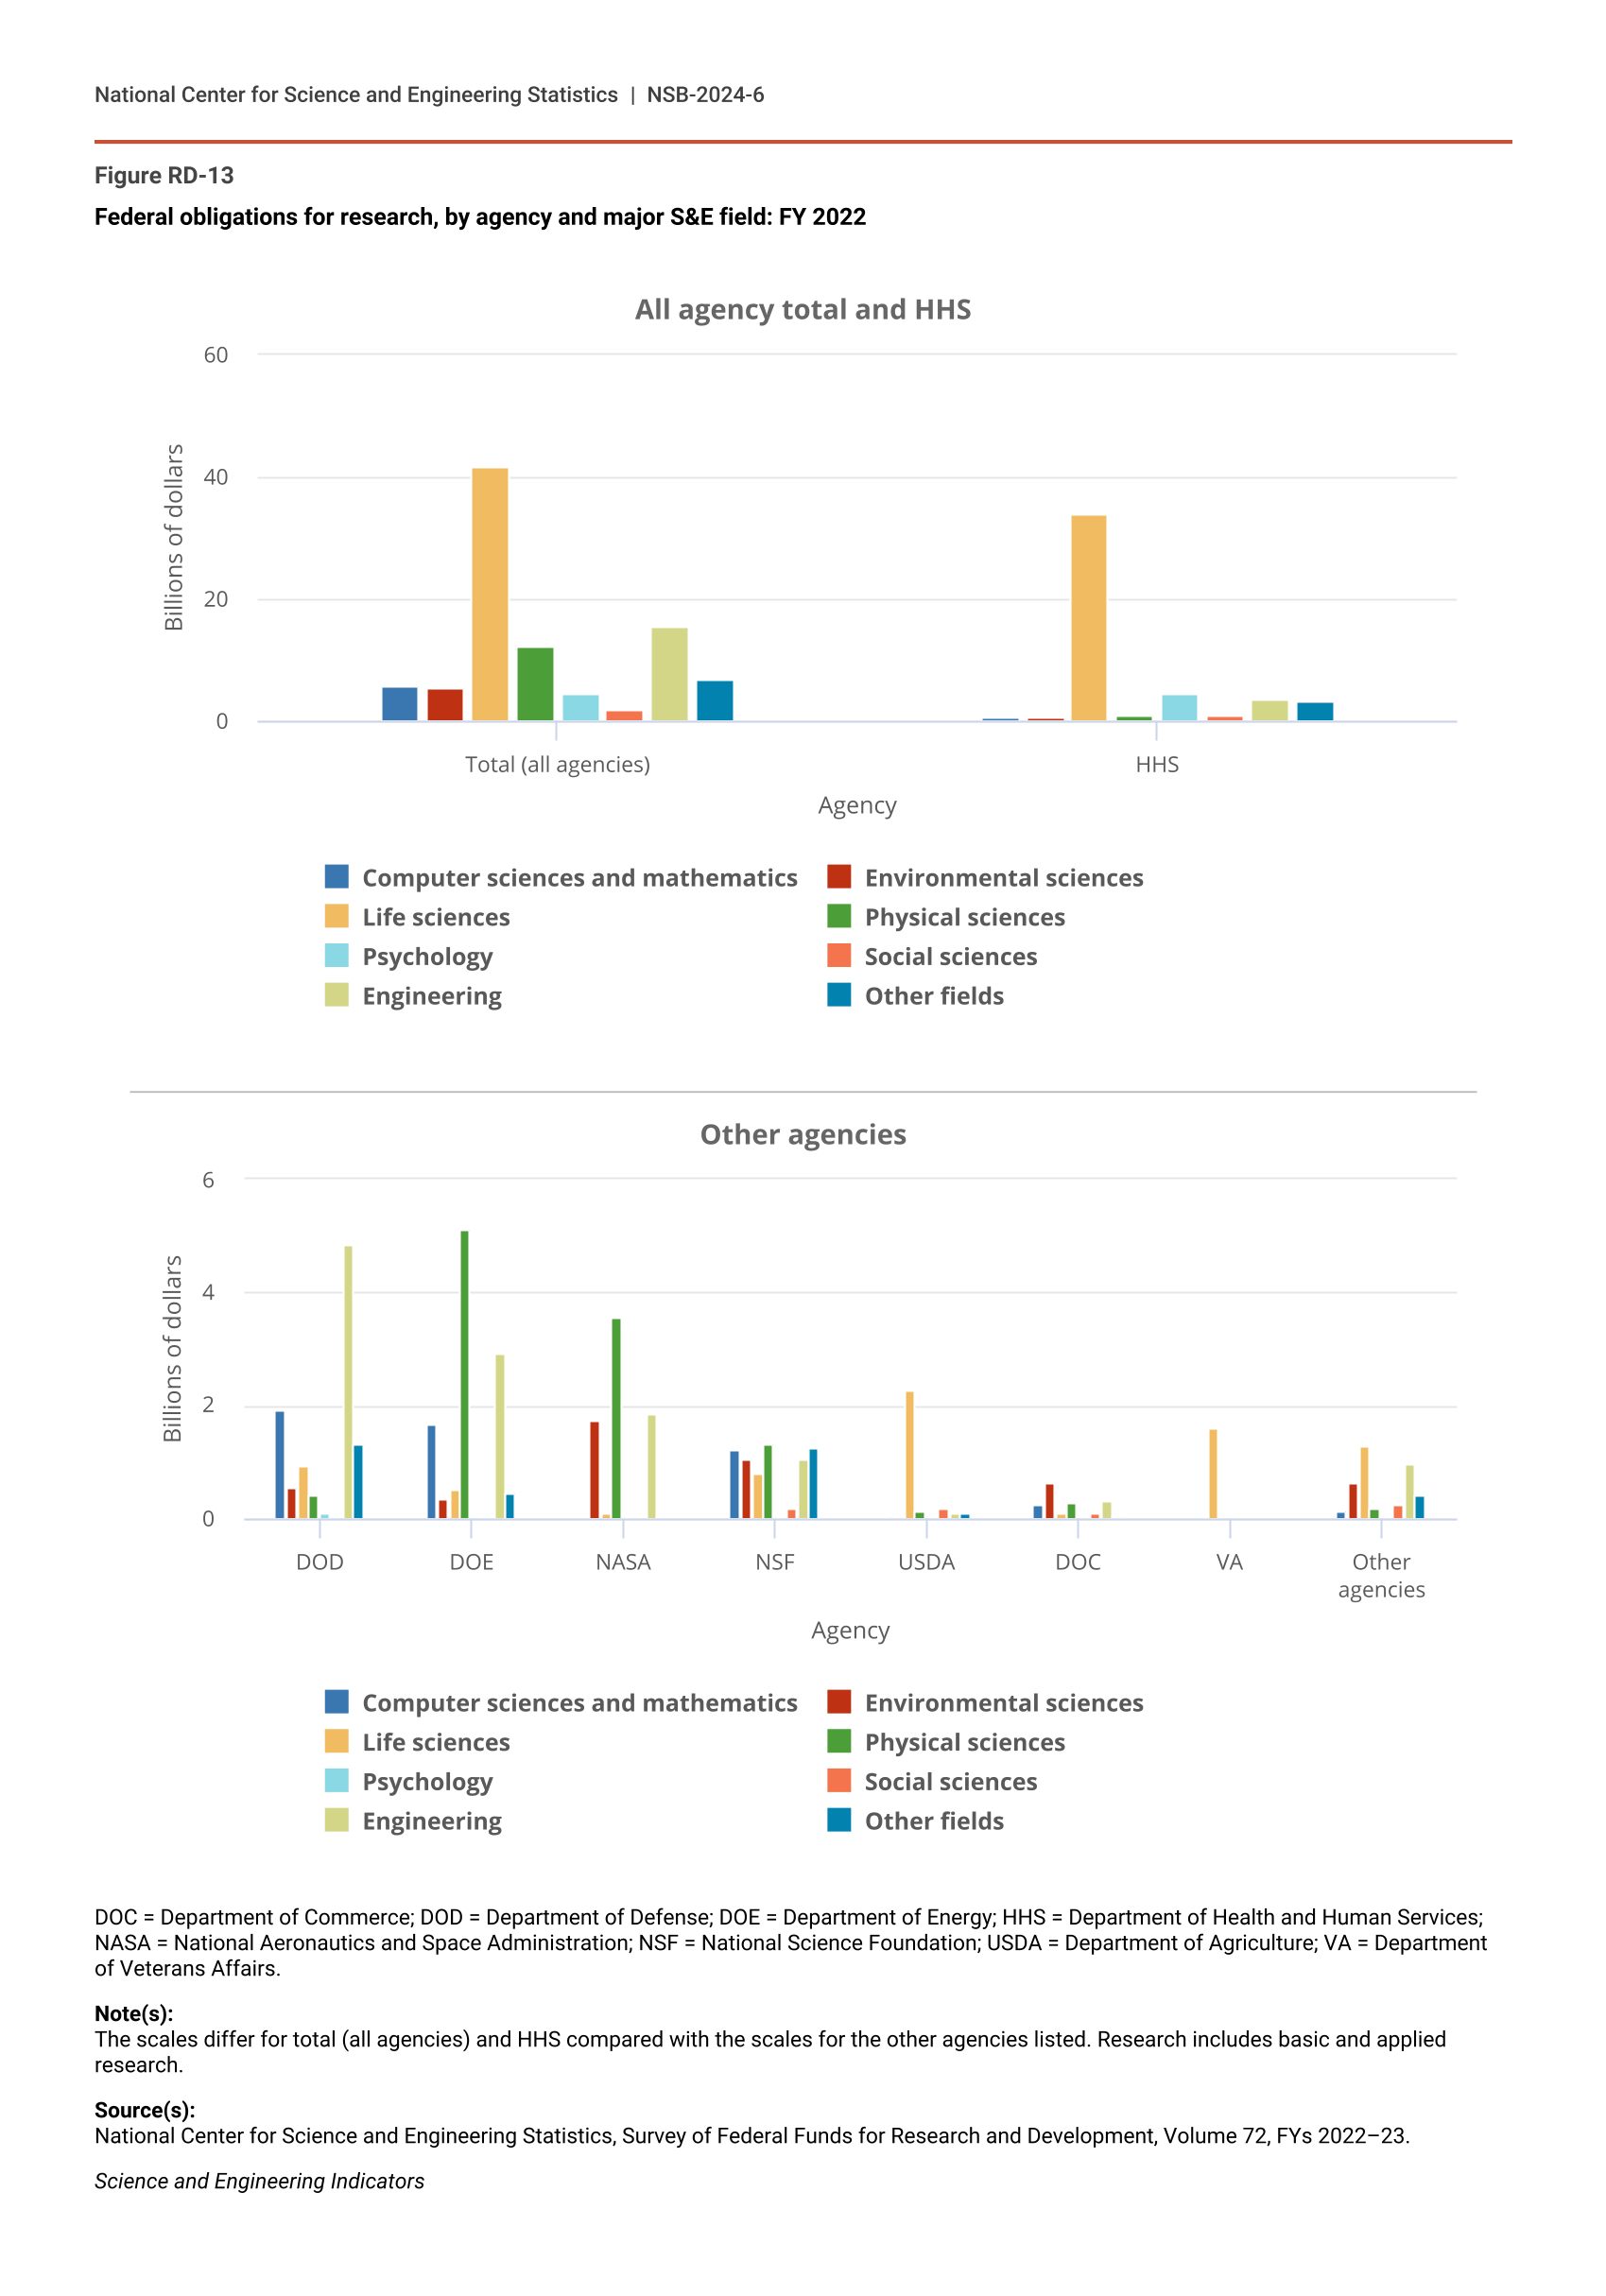
The government funds and performs research in a broad range of science and engineering (S&E) fields, including engineering, computer science and mathematics, environmental science, life sciences, physical sciences, and social sciences. Federal research obligations (basic plus applied research) reached $93.8 billion in FY 2022 across all S&E fields (Figure RD-13; Table SRD-7).
Federal obligations for research, by agency and major S&E field: FY 2022
| Agency | Computer sciences and mathematics | Environmental sciences | Life sciences | Physical sciences | Psychology | Social sciences | Engineering | Other fields |
|---|---|---|---|---|---|---|---|---|
| Total (all agencies) | 5.7 | 5.6 | 41.6 | 12.1 | 4.6 | 1.9 | 15.5 | 6.8 |
| HHS | 0.5 | 0.6 | 34.0 | 1.1 | 4.4 | 1.1 | 3.4 | 3.2 |
| Agency | Computer sciences and mathematics | Environmental sciences | Life sciences | Physical sciences | Psychology | Social sciences | Engineering | Other fields |
|---|---|---|---|---|---|---|---|---|
| DOD | 1.92 | 0.55 | 0.94 | 0.42 | 0.10 | 0.05 | 4.86 | 1.32 |
| DOE | 1.69 | 0.34 | 0.54 | 5.13 | 0.00 | 0.00 | 2.93 | 0.47 |
| NASA | 0.00 | 1.74 | 0.10 | 3.57 | 0.00 | 0.00 | 1.85 | 0.05 |
| NSF | 1.23 | 1.03 | 0.79 | 1.33 | 0.03 | 0.19 | 1.05 | 1.24 |
| USDA | 0.03 | 0.02 | 2.26 | 0.13 | 0.01 | 0.19 | 0.11 | 0.11 |
| DOC | 0.26 | 0.62 | 0.09 | 0.28 | 0.00 | 0.09 | 0.33 | 0.02 |
| VA | 0.00 | 0.00 | 1.61 | 0.00 | 0.00 | 0.00 | 0.00 | 0.00 |
| Other agencies | 0.13 | 0.64 | 1.29 | 0.17 | 0.02 | 0.25 | 0.97 | 0.42 |
DOC = Department of Commerce; DOD = Department of Defense; DOE = Department of Energy; HHS = Department of Health and Human Services; NASA = National Aeronautics and Space Administration; NSF = National Science Foundation; USDA = Department of Agriculture; VA = Department of Veterans Affairs.
Note(s):
The scales differ for total (all agencies) and HHS compared with the scales for the other agencies listed. Research includes basic and applied research.
Source(s):
National Center for Science and Engineering Statistics, Survey of Federal Funds for Research and Development, Volume 72, FYs 2022–23.
Science and Engineering Indicators
Obligations for life sciences research were the highest among S&E fields, at $41.6 billion across all agencies (44% of total obligations) (Figure RD-13; Table SRD-7). This can primarily be attributed to HHS, which accounted for $34.0 billion, or 82% of total life science obligations. HHS funding also included $4.4 billion (96%) of the total $4.6 billion in psychology obligations across agencies. More broadly, $48.3 billion in overall HHS research obligations (across all S&E fields) accounted for around half of the total $93.8 billion of federal research obligations in FY 2022 (Table RD-12).
Other top agencies in research obligations include DOE, with $5.1 billion obligated for physical sciences (42% of the total $12.1 billion in that field) and $2.9 billion for engineering (19% of the total $15.5 billion across all agencies), and DOD, with $1.9 billion obligated for computer sciences and mathematics research (34% of the total $5.7 billion across all agencies) and $4.9 billion for engineering (31% of total) (Figure RD-13; Table SRD-7). NSF research obligations are spread rather evenly among major S&E fields. NSF funds between $1.0 billion and $1.3 billion in each of the computer sciences and mathematics, environmental sciences, physical sciences, and engineering fields and $792 million in life sciences (Figure RD-13; Table SRD-7).
Federal R&D Funding for Selected Critical and Emerging Technologies
The federal government has long supported semiconductor and information technology (IT) R&D (NRC 2003). More recently, the CHIPS and Science Act of 2022 appropriated $52.7 billion to revitalize the U.S. semiconductor industry through support of U.S. semiconductor fabrication and technology development along the supply chain, including $13.7 billion supporting R&D, workforce development, and related programs (CRS 2023a, 2023b; Zimmermann 2022). Several other recent federal initiatives related to critical and emerging technologies focus on quantum science, advanced IT and AI, and nanotechnology (CRS 2022a, 2022b; USG 2023). The National Quantum Initiative (NQI) Act became Public Law 115-368 in December 2018 to accelerate American leadership in quantum information science and technology. Agencies with NQI activities reported $855 million in quantum information science R&D expenditures in FY 2021, up from $672 million in FY 2020 and $449 million in FY 2019 (SCQIS/NSTC 2023).
The Networking and Information Technology Research and Development (NITRD) Program coordinates federally funded R&D in advanced IT, networking, and AI. It was launched by the High-Performance Computing Act of 1991 and was most recently reauthorized in the 2017 American Innovation and Competitiveness Act (Public Law 114-329). Among agencies participating in the NITRD Program, $1.8 billion was budgeted in FY 2021 for R&D in nondefense AI (NITRD/NAIIO 2022).
Last, the National Nanotechnology Initiative was launched by the 21st Century Nanotechnology Research and Development Act of 2003 (Public Law 108-153) to “invest in Federal R&D programs in nanotechnology and related sciences” and to “provide for interagency coordination.” Participating agencies budgeted $3.5 billion in FY 2020 (NSET/NSTC 2022) and $3.8 billion in FY 2021 on nanotechnology R&D and related workforce development (NSET/NSTC 2023). The latter included $1.7 billion for COVID-19 diagnostics and vaccine research by the Biomedical Advanced Research and Development Authority within HHS.