 An official website of the United States government
 Post–High School Transitions
The U.S. education system strives to prepare every high school graduate for a career or for college, although studies suggest that more progress is needed in preparing students for these paths after high school. Research suggests that fewer than half of students may have the skills needed to succeed in college coursework or the workforce (ACT 2019; Cushing et al. 2019). This section begins with a discussion of the transition to postsecondary education and then provides information on those individuals who transition directly from high school into the workforce—specifically, the skilled technical workforce (STW).
Transition to Postsecondary Education
U.S. high school graduation rates have been rising steadily, reaching 85% in 2018 (Hussar et al. 2020). Although high school completion represents a major milestone for adolescents, most of today’s fastest-growing, well-paying jobs—especially those in STEM fields—require at least some postsecondary education, including the attainment of nondegree credentials (Carnevale et al. 2020; NASEM 2017; NSB 2019). In addition, a greater proportion of students who enter postsecondary education immediately after high school persist and attain a degree compared to students who delay their enrollment (Bozick and DeLuca 2005). This section focuses on indicators related to U.S. students’ transition from high school to postsecondary education. It presents information about AP and dual enrollment coursetaking, in which students can earn college credits for courses taken in high school and increase their postsecondary preparedness and propensity to pursue postsecondary education after high school. It then presents national data on trends in immediate college enrollment after high school and examines the relationship between perceptions of high school mathematics and science identity and ability and the decision to major in STEM fields at the postsecondary level. For more information on trends in postsecondary STEM education, see the forthcoming Indicators 2022 report, “Higher Education in Science and Engineering” section “Trends in Undergraduate and Graduate S&E Degree Awards.”
Participation in Advanced Placement
The AP program, administered by the College Board, provides college-level courses and exams for high school students in 38 subjects, including 12 mathematics and science subjects. Nearly 3 million students took at least one AP exam in 2019, and approximately 23,000 schools offered at least one AP course for students (College Board 2019). Students who earn a score of at least 3 out of 5 on an AP exam may earn college credit for the course. For state-level data on the AP program, see State Indicators.
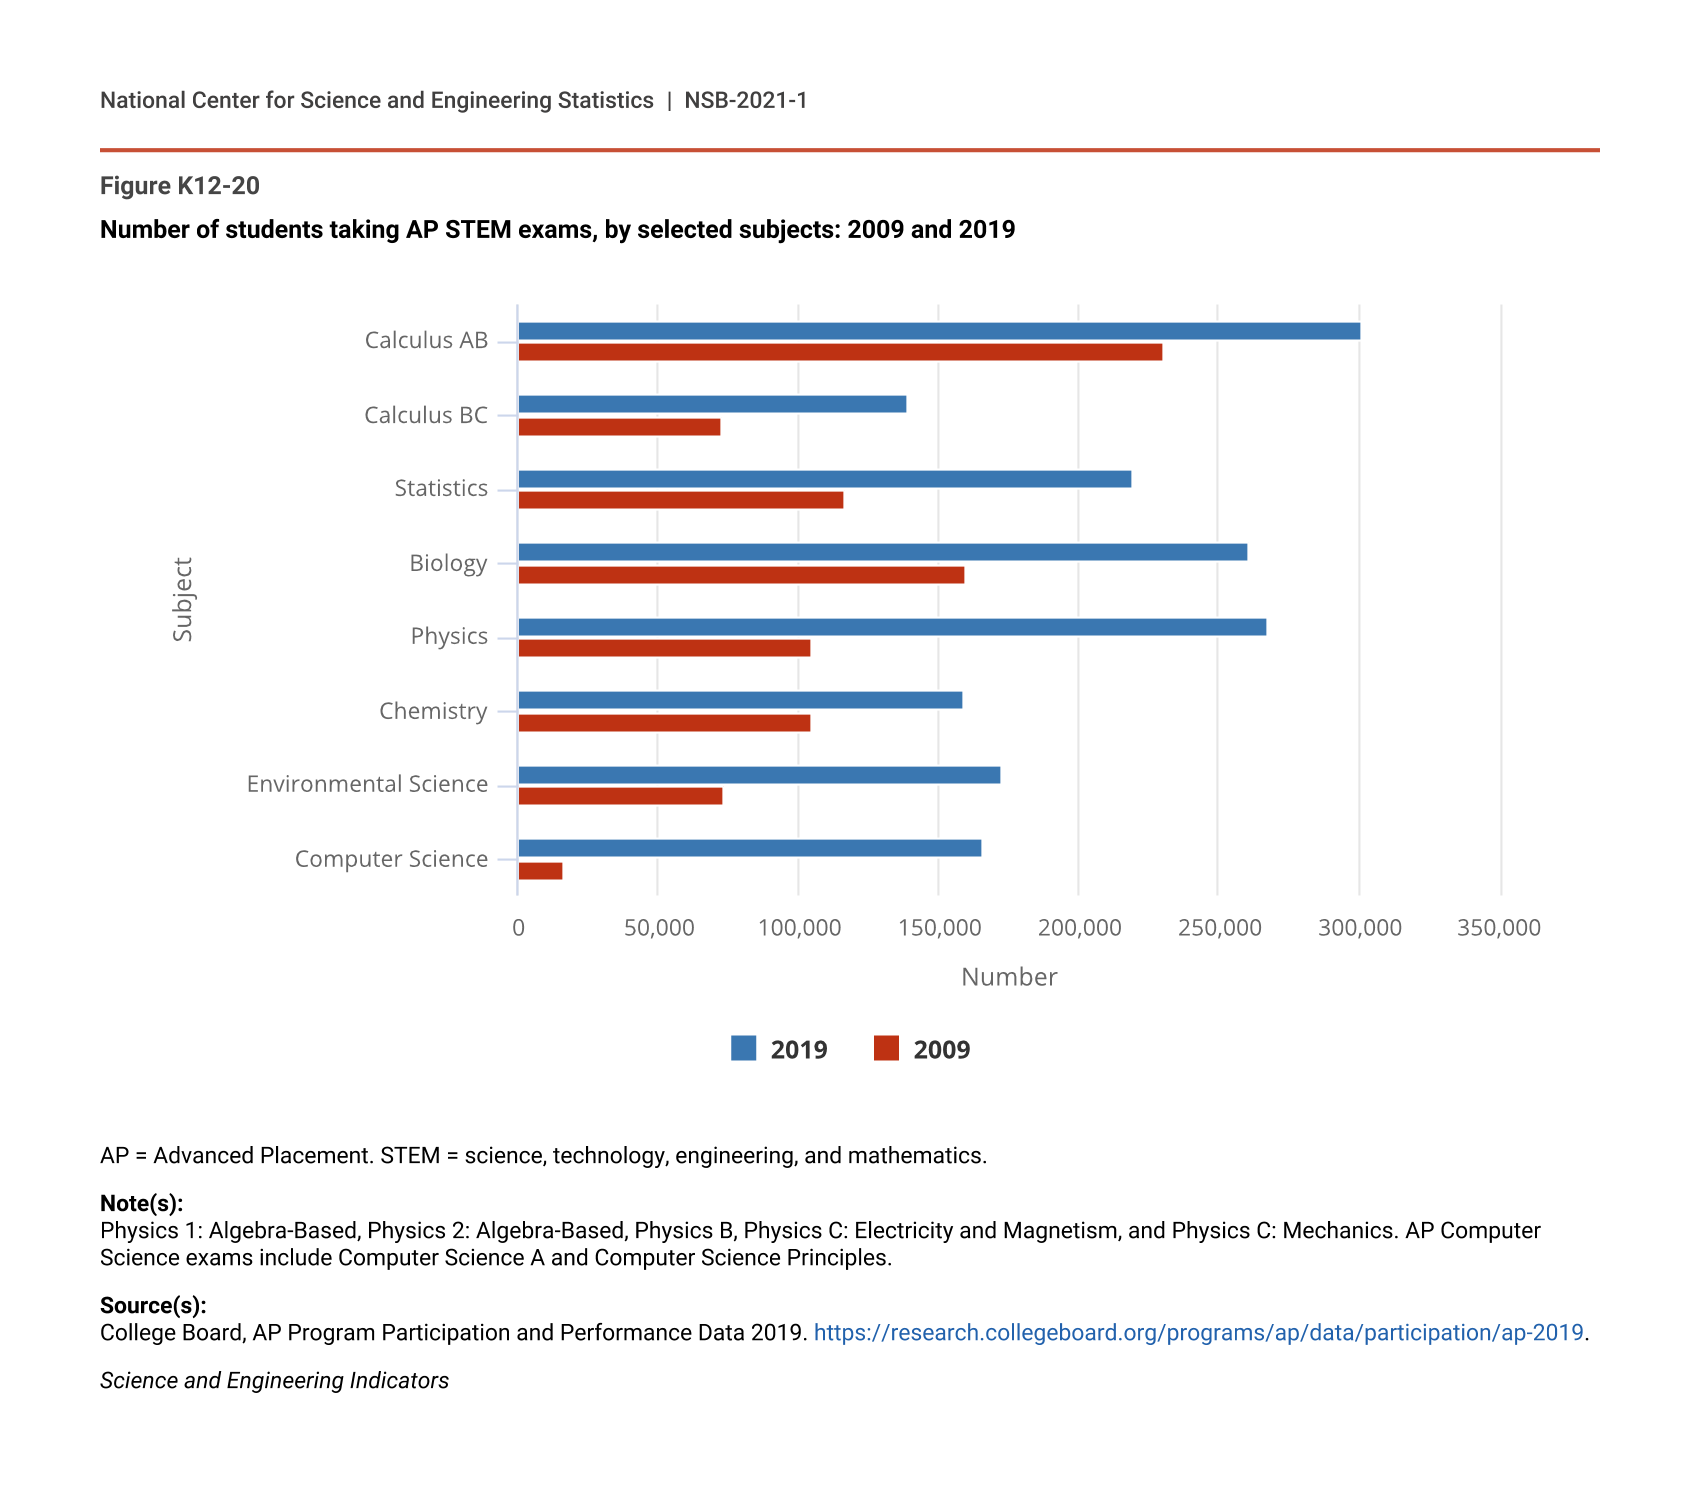
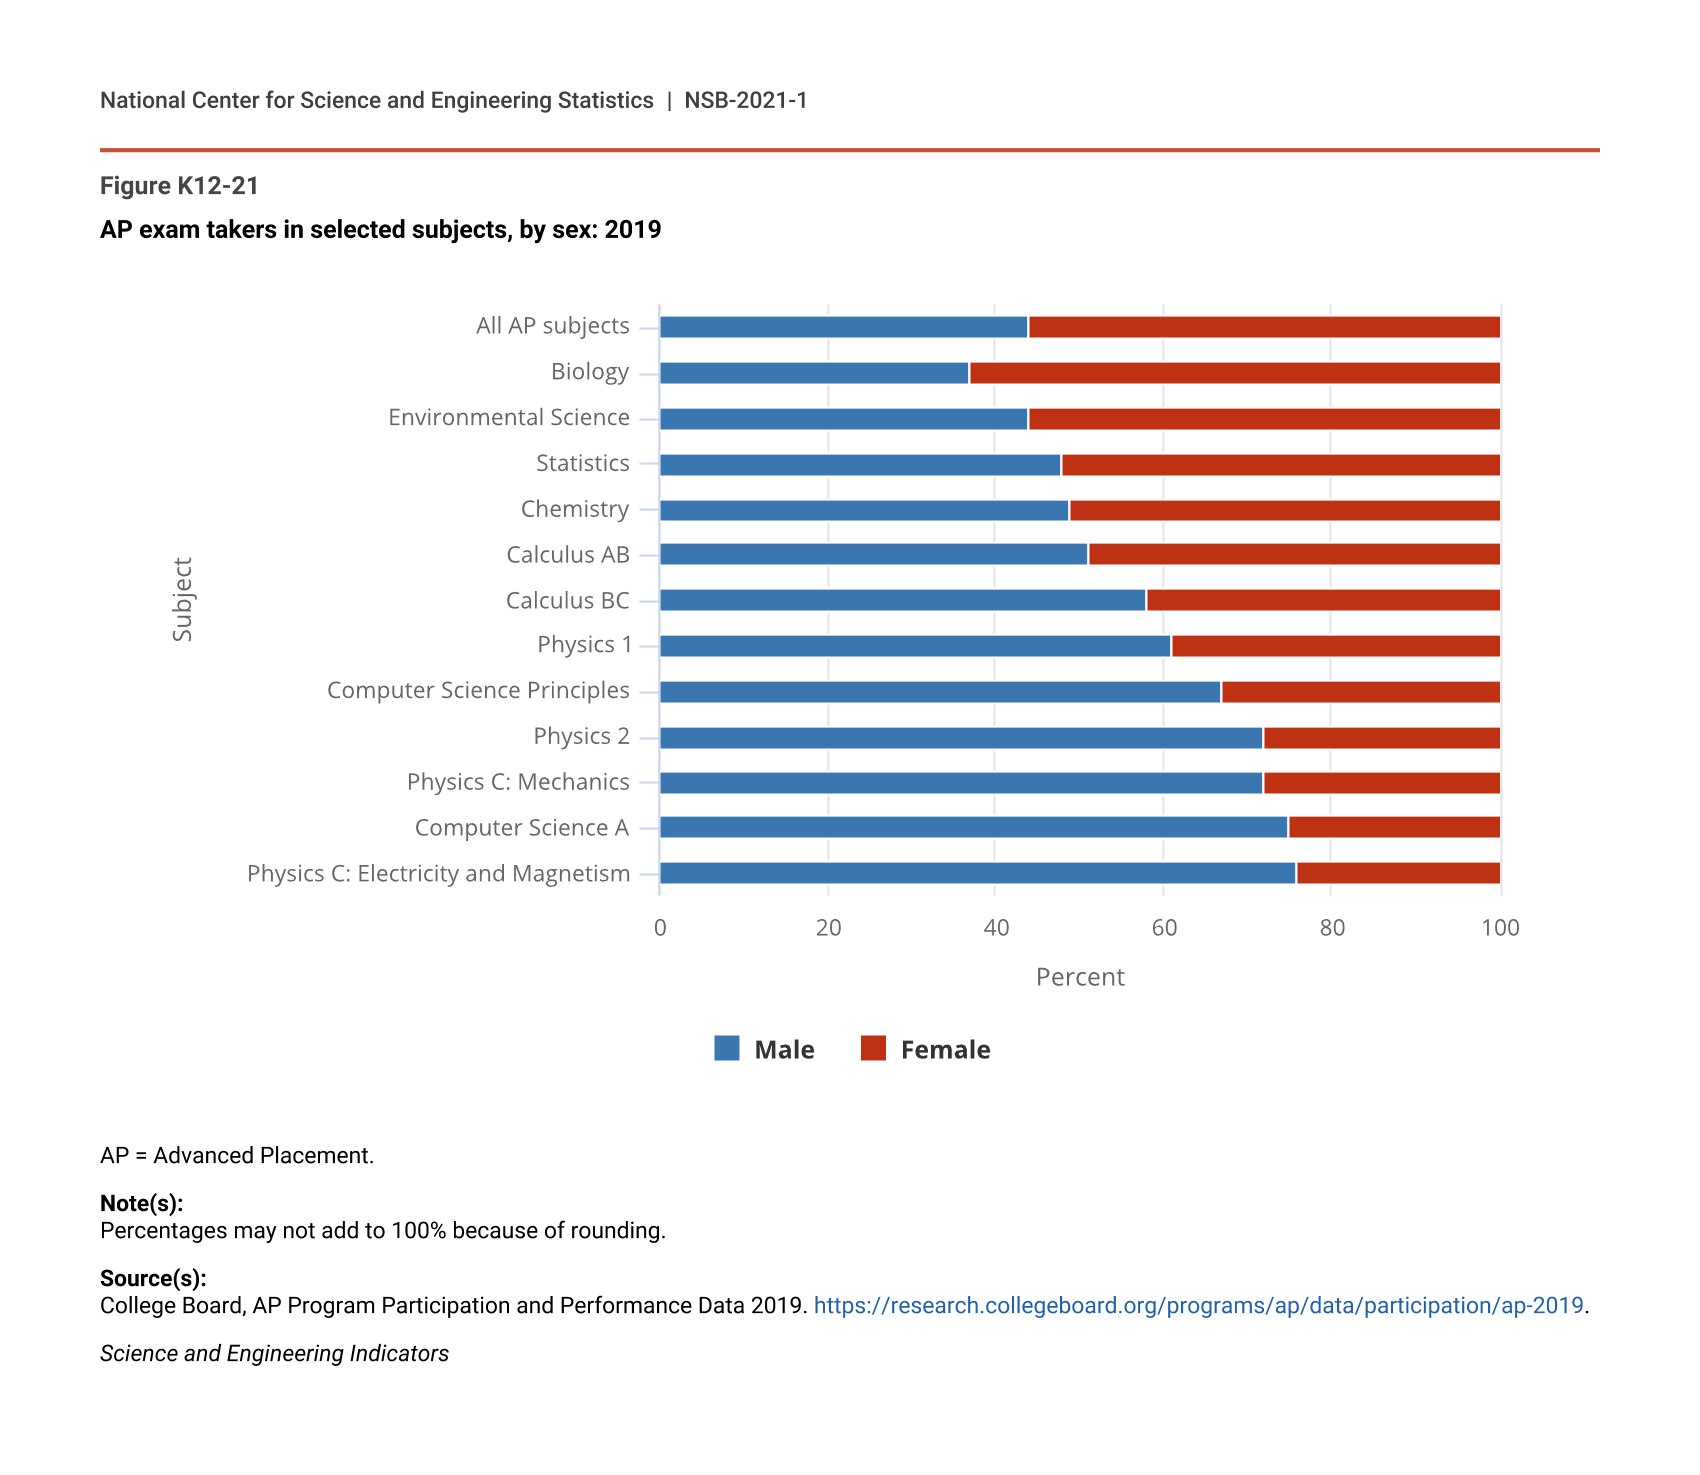
In the past decade, the number of students taking AP mathematics and science exams has increased in every STEM subject area (Figure K12-20). The number of high school students taking AP exams in STEM increased from 879,492 in 2009 to 1,684,501 in 2019. The number of students taking computer science exams experienced the largest growth, from about 17,000 students in 2009 to about 166,000 in 2019, a nearly 10-fold increase. Female students took over half (56%) of the total number of AP exams in 2019 (Figure K12-21), including half or more in several STEM subjects, such as biology (63%), environmental science (56%), statistics (52%), and chemistry (51%). For the majority of STEM AP subjects, however, female students accounted for less than half of the test takers. Male students made up 60% or more of exam takers in computer science and physics. The AP exams with the highest proportion of male test takers were Physics C: Electricity and Magnetism (76%) and Computer Science A (75%).
Number of students taking AP STEM exams, by selected subjects: 2009 and 2019
| Subject | 2019 | 2009 |
|---|---|---|
| Calculus AB | 300,659 | 230,588 |
| Calculus BC | 139,195 | 72,965 |
| Statistics | 219,392 | 116,876 |
| Biology | 260,816 | 159,580 |
| Physics | 267,346 | 104,497 |
| Chemistry | 158,847 | 104,789 |
| Environmental Science | 172,456 | 73,575 |
| Computer Science | 165,790 | 16,622 |
AP = Advanced Placement. STEM = science, technology, engineering, and mathematics.
Note(s):
Physics 1: Algebra-Based, Physics 2: Algebra-Based, Physics B, Physics C: Electricity and Magnetism, and Physics C: Mechanics. AP Computer Science exams include Computer Science A and Computer Science Principles.
Source(s):
College Board, AP Program Participation and Performance Data 2019. https://research.collegeboard.org/programs/ap/data/participation/ap-2019.
Science and Engineering Indicators
AP exam takers in selected subjects, by sex: 2019
| Subject | Male | Female |
|---|---|---|
| All AP subjects | 44 | 56 |
| Biology | 37 | 63 |
| Environmental Science | 44 | 56 |
| Statistics | 48 | 52 |
| Chemistry | 49 | 51 |
| Calculus AB | 51 | 49 |
| Calculus BC | 58 | 42 |
| Physics 1 | 61 | 39 |
| Computer Science Principles | 67 | 33 |
| Physics 2 | 72 | 28 |
| Physics C: Mechanics | 72 | 28 |
| Computer Science A | 75 | 25 |
| Physics C: Electricity and Magnetism | 76 | 24 |
AP = Advanced Placement.
Note(s):
Percentages may not add to 100% because of rounding.
Source(s):
College Board, AP Program Participation and Performance Data 2019. https://research.collegeboard.org/programs/ap/data/participation/ap-2019.
Science and Engineering Indicators
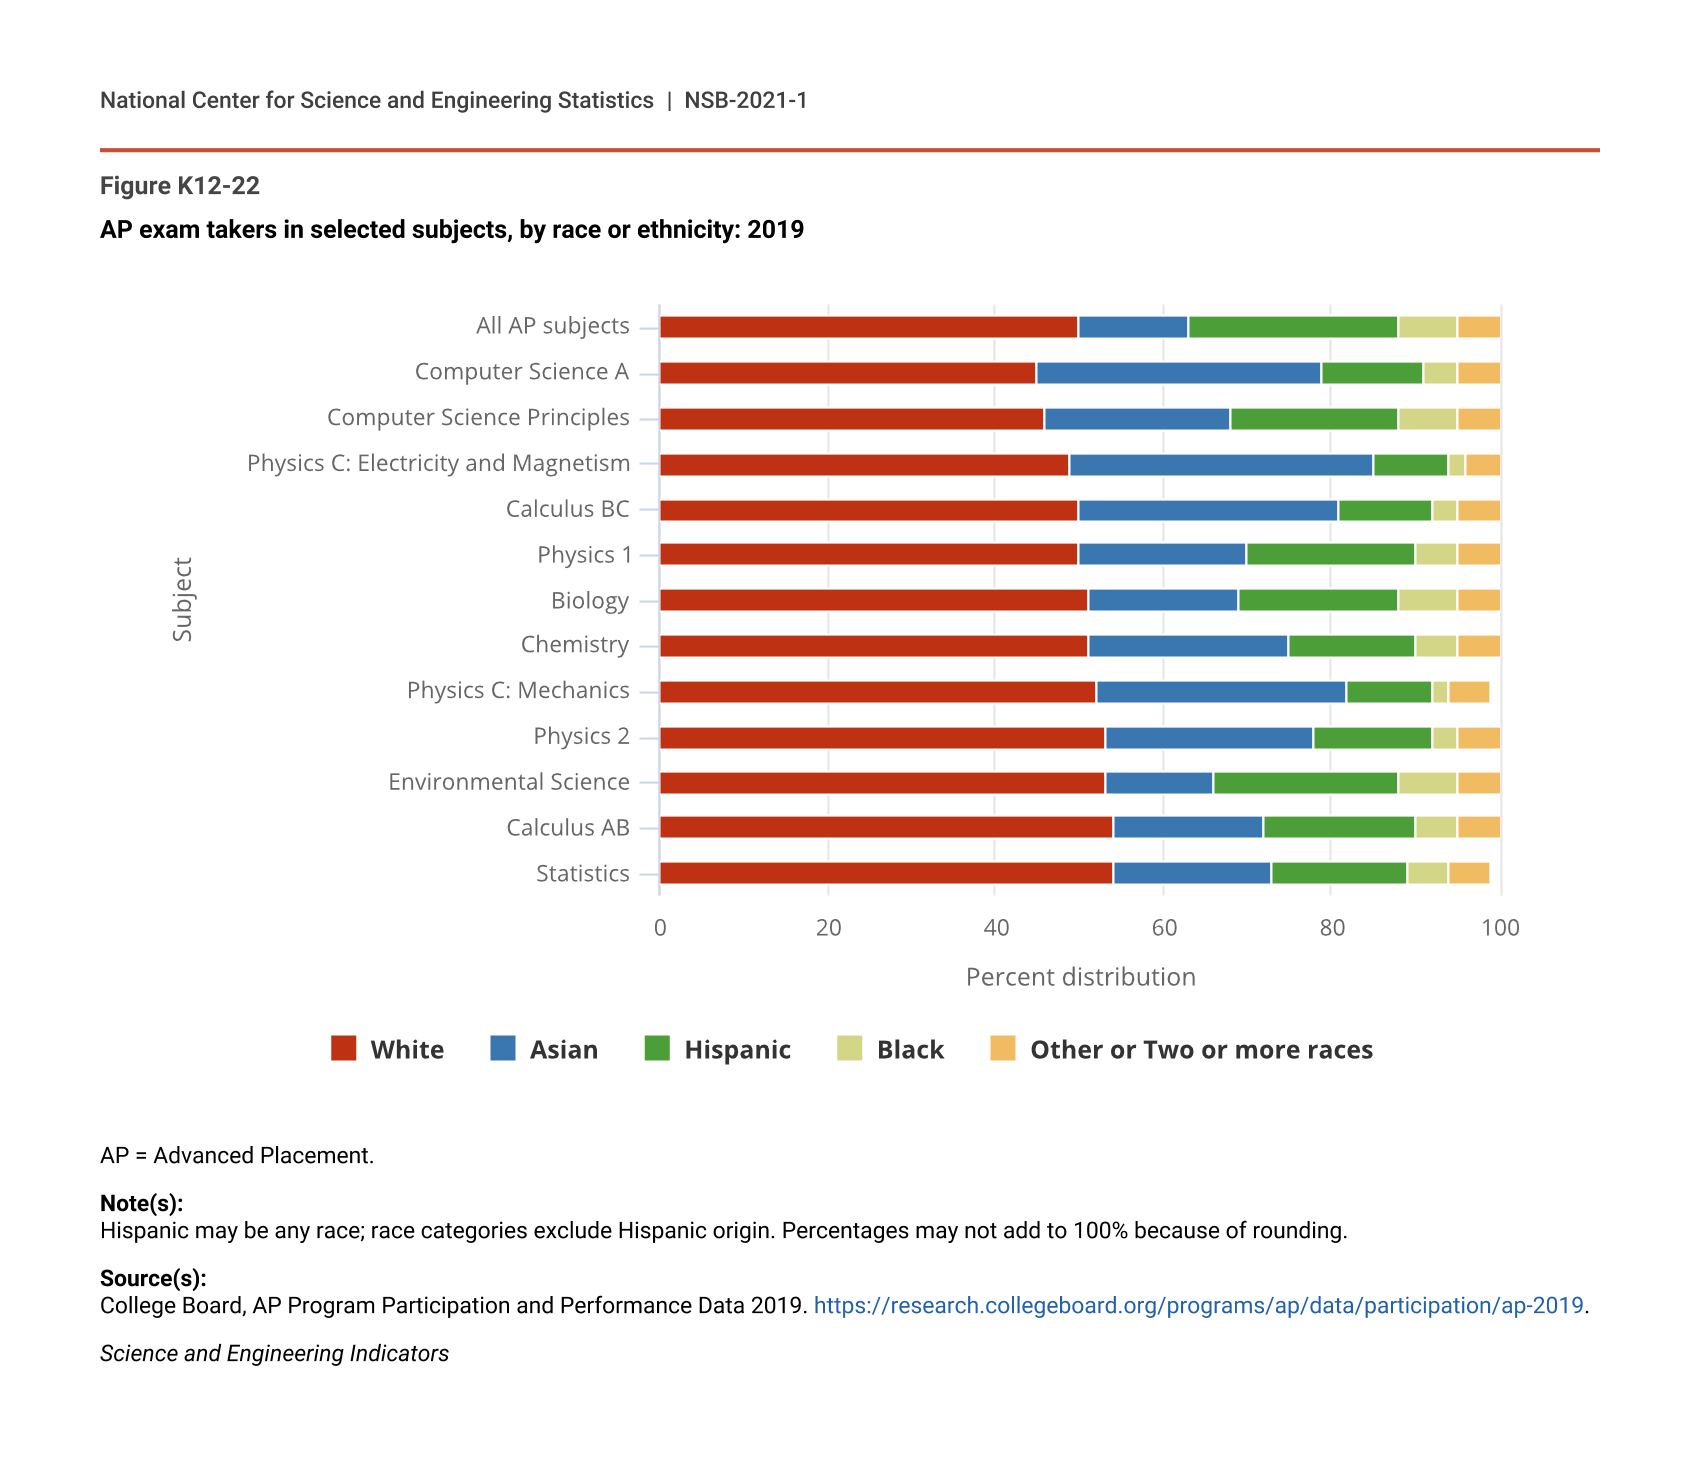
Analysis of 2019 STEM AP exam taking by minority students shows that Black and Hispanic students are underrepresented in STEM AP exam taking. Although these students collectively made up 42% of the U.S. elementary and secondary school population in 2019, together they accounted for 11%–29% of STEM subject-specific AP exam takers (Figure K12-22).
AP exam takers in selected subjects, by race or ethnicity: 2019
| Subject | White | Asian | Hispanic | Black | Other or Two or more races |
|---|---|---|---|---|---|
| All AP subjects | 50 | 13 | 25 | 7 | 5 |
| Computer Science A | 45 | 34 | 12 | 4 | 5 |
| Computer Science Principles | 46 | 22 | 20 | 7 | 5 |
| Physics C: Electricity and Magnetism | 49 | 36 | 9 | 2 | 5 |
| Calculus BC | 50 | 31 | 11 | 3 | 5 |
| Physics 1 | 50 | 20 | 20 | 5 | 5 |
| Biology | 51 | 18 | 19 | 7 | 5 |
| Chemistry | 51 | 24 | 15 | 5 | 5 |
| Physics C: Mechanics | 52 | 30 | 10 | 2 | 5 |
| Physics 2 | 53 | 25 | 14 | 3 | 5 |
| Environmental Science | 53 | 13 | 22 | 7 | 5 |
| Calculus AB | 54 | 18 | 18 | 5 | 5 |
| Statistics | 54 | 19 | 16 | 5 | 5 |
AP = Advanced Placement.
Note(s):
Hispanic may be any race; race categories exclude Hispanic origin. Percentages may not add to 100% because of rounding.
Source(s):
College Board, AP Program Participation and Performance Data 2019. https://research.collegeboard.org/programs/ap/data/participation/ap-2019.
Science and Engineering Indicators
The percentage of AP exam takers who passed AP exams in 2019 (earning at least a score of 3 out of 5) varied by subject. In mathematics, 58% of Calculus AB and 81% of Calculus BC exam takers scored a 3 or higher. In science, the percentage of students who scored 3 or higher ranged from a low of 45% for Physics 1 to a high of 82% for Physics C: Mechanics. A full report of 2019 AP exam scores is available at AP Exam Score Distributions.
Participation in Dual Enrollment Courses
In addition to AP courses, dual enrollment courses (courses for which students earn both high school and college credit) offer another option for high school students who wish to earn college credit while still in high school (Burns and Leu 2019). Students typically take these courses at their high school or a local college, either in person or online. Since a published source of STEM-specific dual enrollment statistics is not available, this section presents data on the overall availability and utilization of these courses.
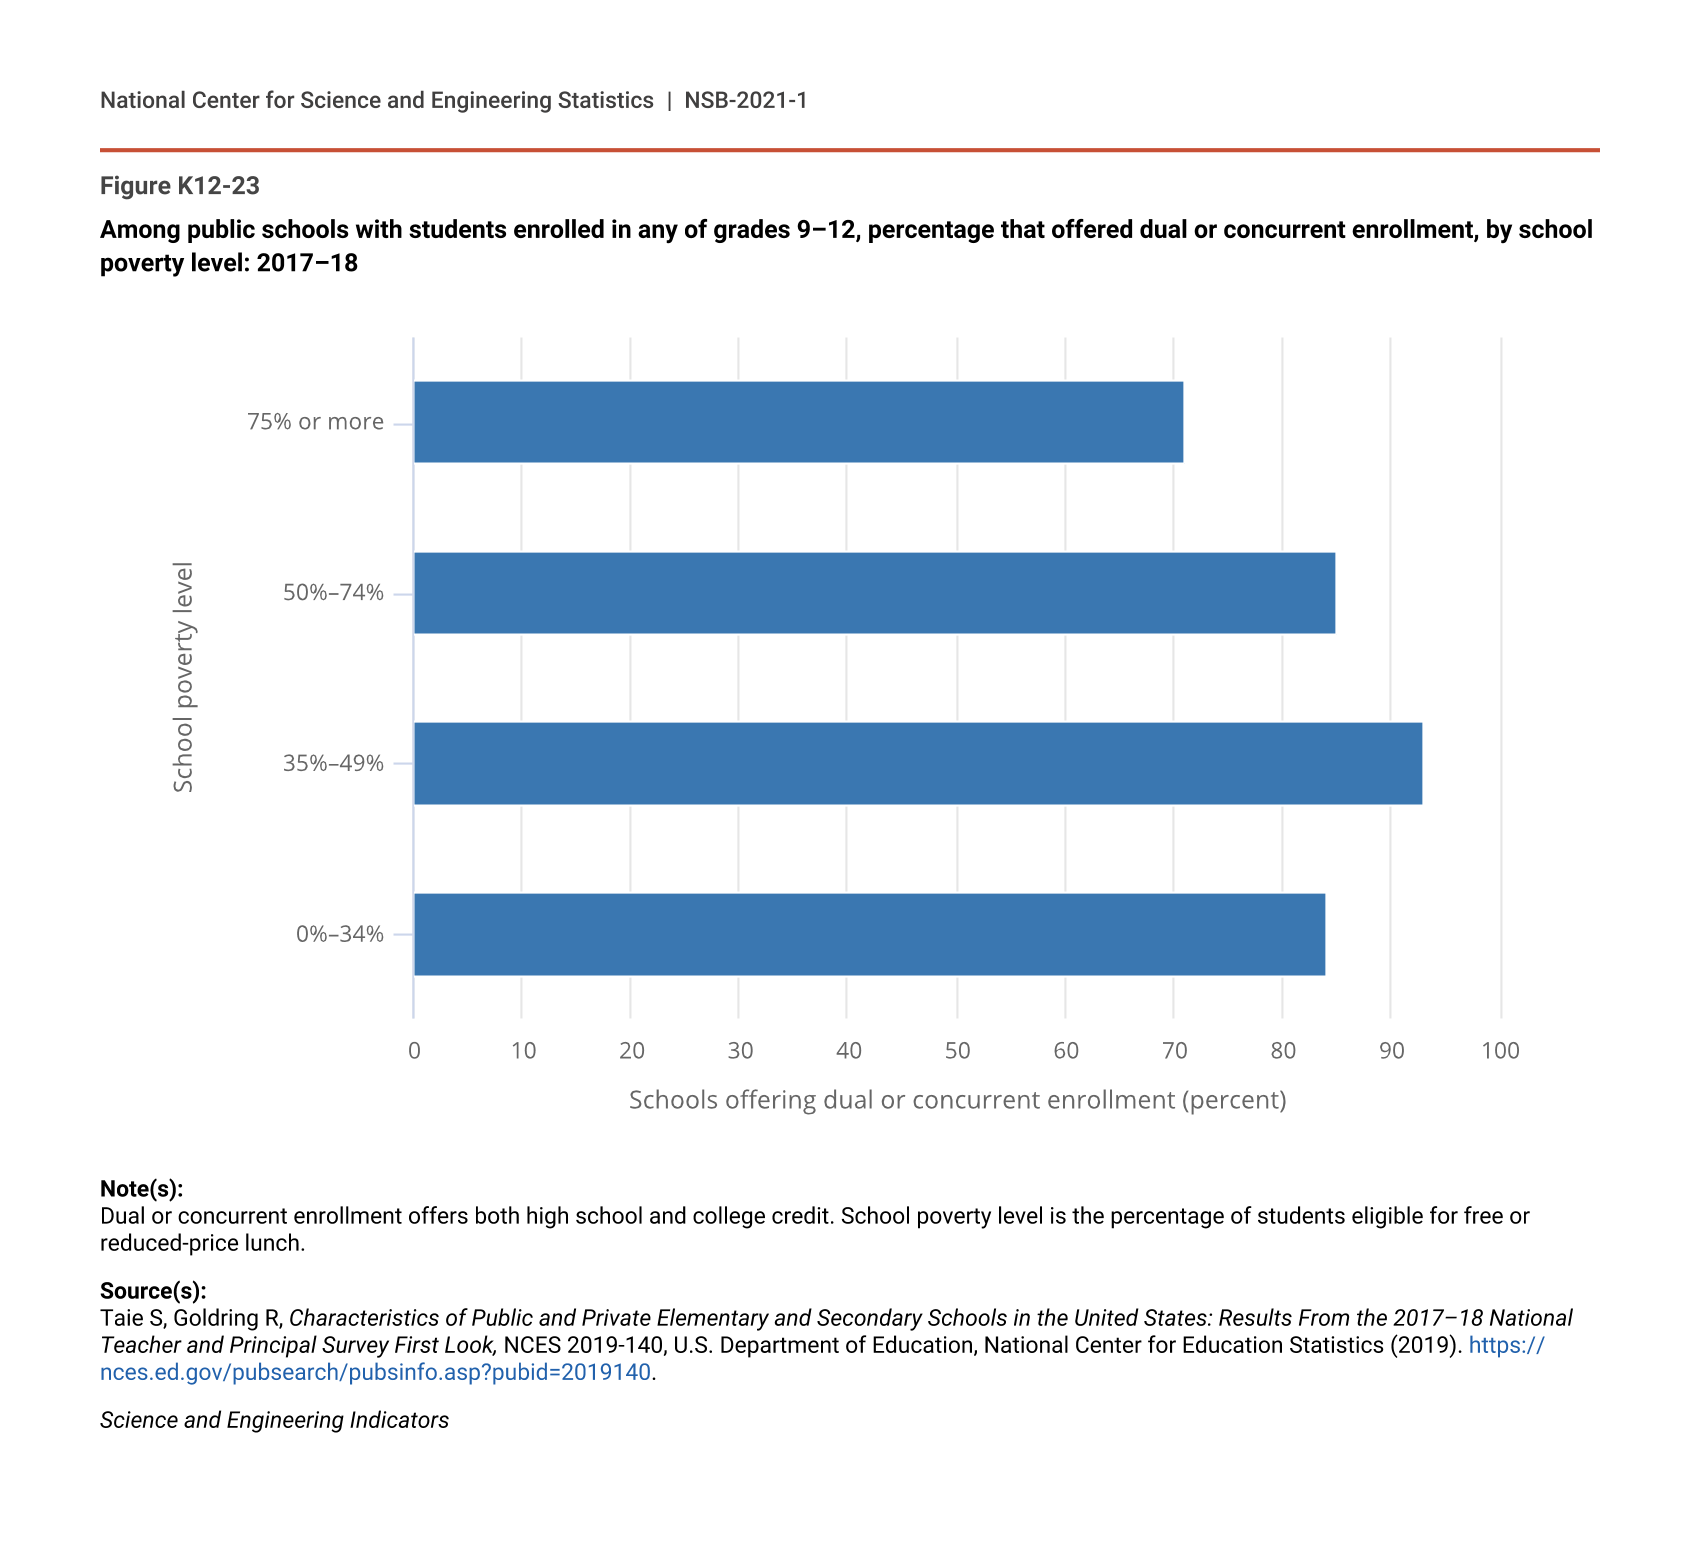
In 2017–18, 82% of public high schools offered dual enrollment courses (Table SK12-24). Availability of dual enrollment courses was highest among rural high schools, 90% of which offered dual enrollment, and lowest among city high schools, 73% of which offered dual enrollment. Whereas 71% of high-poverty-enrollment schools (those in which 75% or more of students were eligible for free or reduced-price lunch) offered dual enrollment courses, 84%–93% of schools at all other poverty levels did so (Figure K12-23). Despite widespread dual enrollment availability, only a small proportion of students earn dual enrollment course credit. Among 2013 high school graduates, for example, only 11% earned dual enrollment credits, with an average of 2.5 credits (Burns and Leu 2019).
Among public schools with students enrolled in any of grades 9–12, percentage that offered dual or concurrent enrollment, by school poverty level: 2017–18
| School poverty level | Schools offering dual or concurrent enrollment |
|---|---|
| 0%–34% | 84 |
| 35%–49% | 93 |
| 50%–74% | 85 |
| 75% or more | 71 |
Note(s):
Dual or concurrent enrollment offers both high school and college credit. School poverty level is the percentage of students eligible for free or reduced-price lunch.
Source(s):
Taie S, Goldring R, Characteristics of Public and Private Elementary and Secondary Schools in the United States: Results From the 2017–18 National Teacher and Principal Survey First Look, NCES 2019-140, U.S. Department of Education, National Center for Education Statistics (2019). https://nces.ed.gov/pubsearch/pubsinfo.asp?pubid=2019140.
Science and Engineering Indicators
Enrollment in Postsecondary Education
The 2018 estimates from the U.S. Census Bureau’s Current Population Survey indicate that about 70% of students who graduate from high school in a given year enroll in college by October of the same year, a figure that has not meaningfully changed in the past decade (Figure K12-24). Among 2018 high school completers who immediately enrolled in college, 26% enrolled in a 2-year institution, and 44% enrolled in a 4-year institution.
Immediate college enrollment rates among high school completers, by institution type: 2008–18
| Year | Total | 2-year institution | 4-year institution |
|---|---|---|---|
| 2008 | 69 | 28 | 41 |
| 2009 | 70 | 28 | 42 |
| 2010 | 68 | 27 | 41 |
| 2011 | 68 | 26 | 42 |
| 2012 | 66 | 29 | 38 |
| 2013 | 66 | 24 | 42 |
| 2014 | 68 | 25 | 44 |
| 2015 | 69 | 25 | 44 |
| 2016 | 70 | 24 | 46 |
| 2017 | 67 | 23 | 44 |
| 2018 | 69 | 26 | 44 |
Note(s):
The figure includes students ages 16–24 who graduated from high school or completed a GED or other high school equivalency credential in each survey year. Immediate college enrollment rates are defined as rates of high school completers enrolled in college in October after completing high school earlier in the same calendar year. Percentages may not add to 100% because of rounding.
Source(s):
De Brey C, Snyder TD, Zhang A, Dillow SA, Digest of Education Statistics 2019, NCES 2021-009, Tables 302.10 and 302.20, U.S. Department of Education, National Center for Education Statistics (2021). https://nces.ed.gov/programs/digest/current_tables.asp.
Science and Engineering Indicators
Immediate college enrollment rates in 2018 were higher for Asian students compared with students from other racial or ethnic groups (Figure K12-25). Black and Hispanic high school completers enrolled at lower rates (62% and 63%, respectively) than their Asian (78%) and White (70%) counterparts did.
Immediate college enrollment rates among high school completers, by sex and race or ethnicity: 2018
| Characteristic | Percent |
|---|---|
| Male | 67 |
| Female | 71 |
| White | 70 |
| Black | 62 |
| Hispanic | 63 |
| Asian | 78 |
Note(s):
The figure includes students ages 16–24 who graduated from high school or completed a GED or other high school equivalency credential in 2018. Immediate college enrollment rates are defined as rates of high school completers enrolled in college in October after completing high school earlier in the same calendar year. Hispanic may be any race; race categories exclude Hispanic origin.
Source(s):
De Brey C, Snyder TD, Zhang A, Dillow SA, Digest of Education Statistics 2019, NCES 2021-009, Tables 302.10 and 302.20, U.S. Department of Education, National Center for Education Statistics (2021). https://nces.ed.gov/programs/digest/current_tables.asp.
Science and Engineering Indicators
High School Students’ STEM Experience
With the goals of maintaining global competitiveness, enhancing capacity for innovation, and providing equal opportunity for all students to pursue STEM careers, U.S. policymakers have called for increasing the number and diversity of students pursuing postsecondary degrees in STEM fields (Allen-Ramdial and Campbell 2014). Demographic groups, including women, Blacks, and Hispanics, among others, continue to be underrepresented in STEM occupations compared to their proportion in the general population (NSB 2020).
Students’ STEM experience in elementary and secondary school is associated with their postsecondary field of study and career choices: student reports of high self-efficacy in mathematics and science in high school are associated with the choice of STEM majors in college (Wang 2013). Research also indicates that teachers and counselors can play a role in encouraging historically underrepresented minorities to pursue STEM majors and careers (Mau and Li 2018; Reinhold, Holzberger, and Seidel 2018; Shillingford, Oh, and Finnell 2018).
This section uses national data from the High School Longitudinal Study of 2009 (HSLS:09) to explore students’ reasons for taking mathematics and science courses in 2012 (while they are in high school) and their perceptions of their mathematics and science identity and ability. It then looks at the relationship between their perceptions of their mathematics and science identity and ability in high school and their decisions to pursue STEM majors in college in 2016.
Reasons for Taking Mathematics and Science Courses in High School
Students’ reasons for taking mathematics and science classes reveal how attitudes toward these subjects and outside influences may impact enrollment patterns in these STEM classes by sex and race or ethnicity. While most students, regardless of sex or race or ethnicity, report taking mathematics or science courses because they are required or because they will need them to get into college, there are some notable differences among groups in other factors and attitudes that influence taking these courses. For example, a slightly greater percentage of female students compared to male students reported that they were taking a mathematics or science course because someone else (e.g., a teacher, counselor, or parent) had encouraged them to do so (Table K12-5). However, the same proportion of male and female students reported that they took their mathematics class because they enjoy mathematics. Regarding science courses, a greater percentage of male students than female students reported that they took their science course because they enjoy science. The influence of friends was similar for male and female students in mathematics coursetaking, but a greater percentage of male students than female students reported that they were taking their science class because their friends were taking it.
Among fall 2009 students in grade 9 who took a mathematics or science course in 2012, percentage reporting various reasons for taking it, by sex and race or ethnicity: 2012
a Hispanic may be any race; race categories exclude Hispanic origin.
b Apply to students who took a mathematics course in the spring term of 2012. If a student took more than one mathematics course, the student was directed to the most challenging mathematics course taken. Students can choose more than one reason listed in the table.
c Apply to students who took a science course in the spring term of 2012. If a student took more than one science course, the student was directed to the most challenging science course taken. Students can choose more than one reason listed in the table.
Source(s):
National Center for Science and Engineering Statistics, special tabulations (2020) of the High School Longitudinal Study of 2009 (HSLS:09), First Follow-Up.
Science and Engineering Indicators
About half or less (between 30% and 48%) of the students in each race and ethnic group indicate that they took mathematics courses because they enjoyed the subject, whereas about half or more (between 48% and 61%) in each group report the same reason for taking science courses. The influence of school counselors, teachers, parents, or friends was relatively similar across all races and ethnicities, with a few exceptions. About 40% of Asian students reported that they took a mathematics or science class because their friends were taking the course, relative to a third or less of the other groups. Asian students were also relatively more inclined, along with White students, to report that parents encouraged them to take these courses.
Students’ Perceptions of Math and Science Identity and Ability
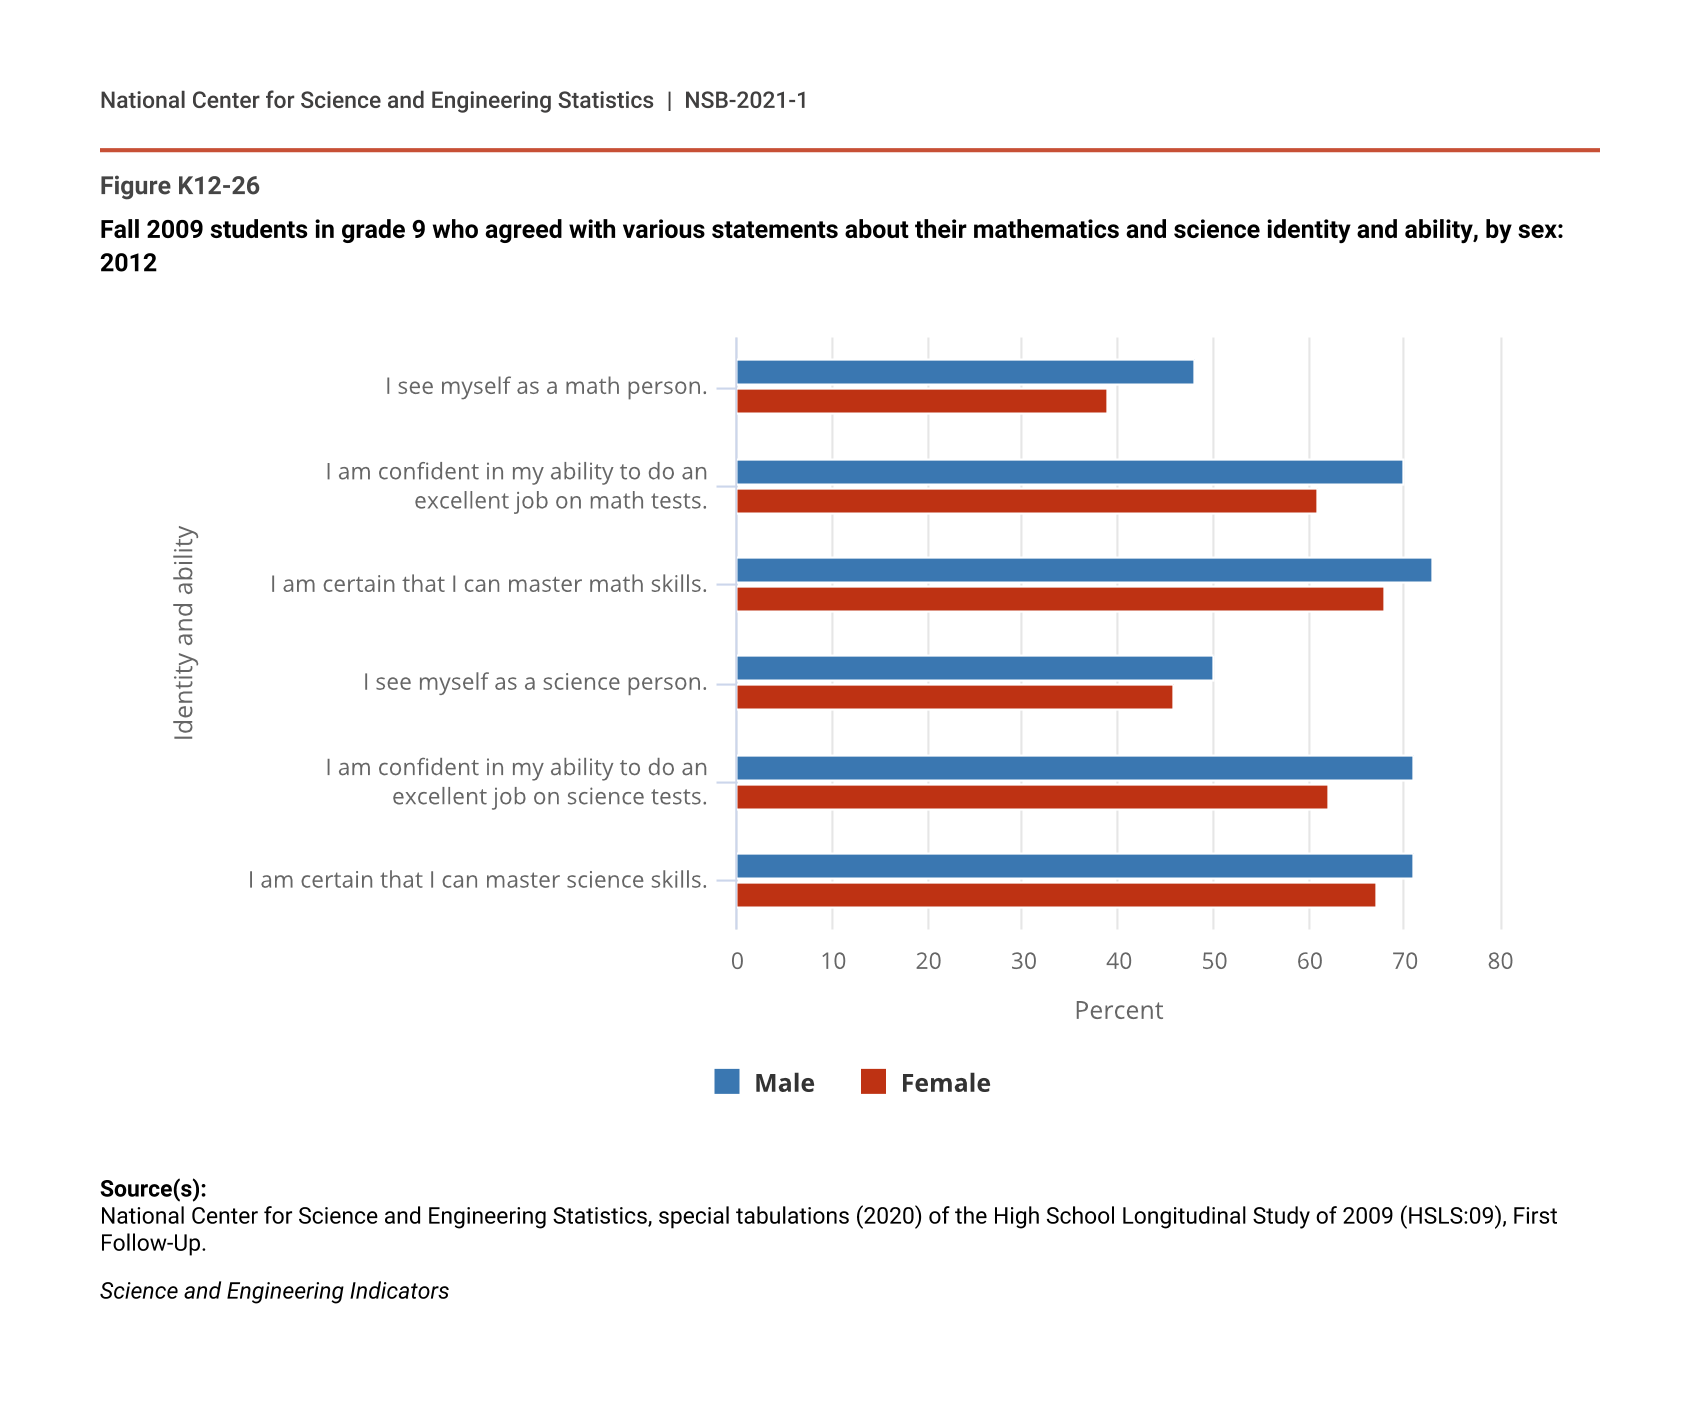
The available data suggest that male and female students vary in their perceptions of their mathematics and science identity and ability. For example, male high school students tended to agree more with the positive statements about their mathematics and science identity and their abilities in mathematics and science compared with their female counterparts (Figure K12-26). About half of male high school students agreed that they see themselves as a math person, compared with 39% of their female classmates, and 71% of male high school students agreed that they are confident in their ability to do an excellent job on science tests, compared with 62% of their female counterparts. There was some variation in responses by race or ethnicity (Table K12-6). For example, 59% of Asian students agreed that they see themselves as a math person, compared with 40%–44% of White, Black, and Hispanic students. Lower proportions of Hispanic students (62%) agreed that they were certain that they could master science skills compared with White, Black, and Asian students (70%–75%).
Fall 2009 students in grade 9 who agreed with various statements about their mathematics and science identity and ability, by sex: 2012
| Identity and ability | Male | Female |
|---|---|---|
| I see myself as a math person. | 48 | 39 |
| I am confident in my ability to do an excellent job on math tests. | 70 | 61 |
| I am certain that I can master math skills. | 73 | 68 |
| I see myself as a science person. | 50 | 46 |
| I am confident in my ability to do an excellent job on science tests. | 71 | 62 |
| I am certain that I can master science skills. | 71 | 67 |
Source(s):
National Center for Science and Engineering Statistics, special tabulations (2020) of the High School Longitudinal Study of 2009 (HSLS:09), First Follow-Up.
Science and Engineering Indicators
Fall 2009 students in grade 9 who agreed with various statements about their mathematics and science ability, by race or ethnicity: 2012
a Hispanic may be any race; race categories exclude Hispanic origin.
Source(s):
National Center for Science and Engineering Statistics, special tabulations (2020) of the High School Longitudinal Study of 2009 (HSLS:09), First Follow-Up.
Science and Engineering Indicators
Perceptions of Mathematics and Science Identity and Ability and Declaration of Postsecondary STEM Major
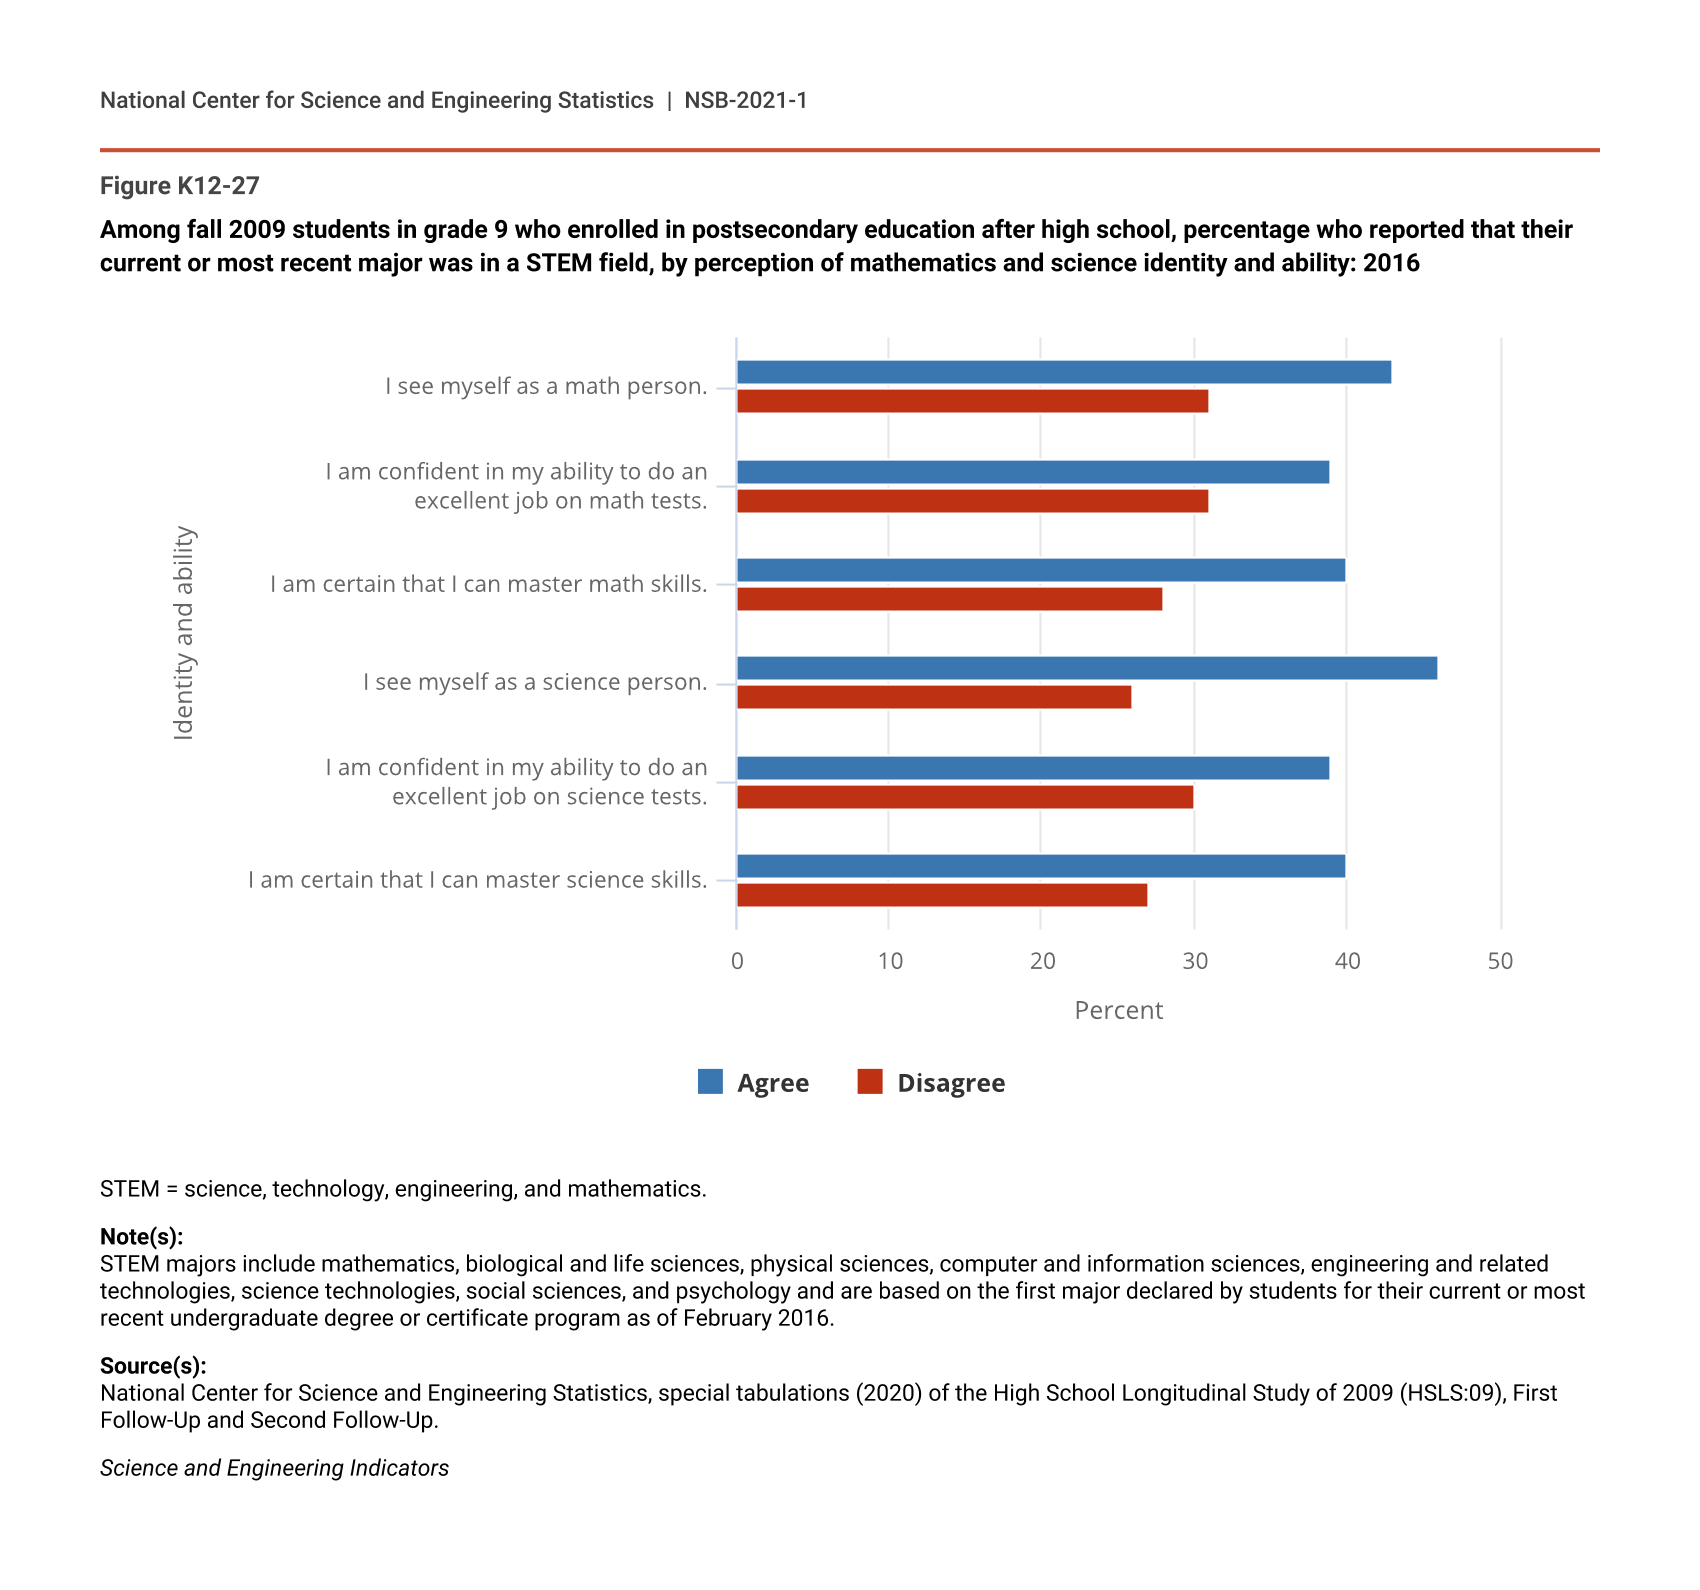
Data from HSLS:09 indicate that students’ perceptions of mathematics and science ability in high school are associated with postsecondary STEM choices. Students who agreed with positive statements about their mathematics and science identity and ability in high school declared STEM majors in college in greater proportions than students who disagreed (Figure K12-27). For example, students who saw themselves as a math or science person were more apt to declare a postsecondary STEM major than students who disagreed with these statements. Similarly, students who were certain that they could master math and science skills were more likely to declare a STEM major than peers who were not certain that they could master math and science skills.
Among fall 2009 students in grade 9 who enrolled in postsecondary education after high school, percentage who reported that their current or most recent major was in a STEM field, by perception of mathematics and science identity and ability: 2016
| Identity and ability | Agree | Disagree |
|---|---|---|
| I see myself as a math person. | 43 | 31 |
| I am confident in my ability to do an excellent job on math tests. | 39 | 31 |
| I am certain that I can master math skills. | 40 | 28 |
| I see myself as a science person. | 46 | 26 |
| I am confident in my ability to do an excellent job on science tests. | 39 | 30 |
| I am certain that I can master science skills. | 40 | 27 |
STEM = science, technology, engineering, and mathematics.
Note(s):
STEM majors include mathematics, biological and life sciences, physical sciences, computer and information sciences, engineering and related technologies, science technologies, social sciences, and psychology and are based on the first major declared by students for their current or most recent undergraduate degree or certificate program as of February 2016.
Source(s):
National Center for Science and Engineering Statistics, special tabulations (2020) of the High School Longitudinal Study of 2009 (HSLS:09), First Follow-Up and Second Follow-Up.
Science and Engineering Indicators
Transition to the Skilled Technical Workforce
For students who do not transition into postsecondary education immediately after high school, STW jobs offer higher pay and more opportunities than other types of positions (Carnevale et al. 2018; Rothwell 2015). STW jobs are those that require skills in STEM fields but do not require a bachelor’s-level degree for entry (Chen and Rotermund 2020). The Indicators 2020 report “Elementary and Secondary Mathematics and Science Education” used data from HSLS:09 to examine which students entered the STW directly after high school and which high school courses were associated with entry into the STW. The STW workforce in this cohort was made up primarily of men; 79% of students who entered the STW were men, and 21% were women. By comparison, 59% of students who entered the job market directly after high school were men, and 41% were women. The racial and ethnic distribution of the STW also differed from the overall distribution of those entering the workforce, with White students overrepresented in STW jobs (58% in the STW compared to 47% overall), and Black and Hispanic students underrepresented in the STW relative to their percentages in the workforce overall (10% compared to 16% and 15% compared to 25%, respectively). In terms of high school preparation, a greater percentage of students who had earned career and technical education (CTE) credits in the STEM-related fields of manufacturing; engineering and technology; architecture and construction; agriculture, food, and natural resources; and transportation, distribution, and logistics entered the STW directly after high school compared with those who had not earned any credits in these areas. For more information on the STW, see the forthcoming Indicators 2022 report, “The STEM Labor Force of Today: Scientists, Engineers, and Skilled Technical Workers.”