 An official website of the United States government
 Student Learning in Mathematics and Science
Policymakers, legislators, and educators in the United States continue to strive to improve K–12 STEM education. Access to high-quality STEM education for all students and students’ strong performance in STEM subjects are necessary for achieving and maintaining the STEM proficiency needed for economic growth, international competitiveness, and scientific literacy (Bush 2019; Committee on STEM Education 2018; NSB 2020). This section presents indicators of U.S. students’ performance in STEM subjects in elementary and secondary school, beginning with performance in mathematics in fourth and eighth grades. Next, it examines mathematics and science performance of U.S. 15-year-olds in an international context. Finally, it examines U.S. performance in computer science, both nationally and internationally.
National Trends in K–12 Student Achievement
Although average scores for the nation’s fourth and eighth graders on a national assessment of mathematics improved from 1990 to 2007 (by 27 points for fourth graders and 18 points for eighth graders), scores have remained essentially stagnant since 2007 (Figure K12-1). There were no statistically significant changes in the 2019 mathematics scores on the National Assessment of Educational Progress (NAEP) relative to scores 12 years ago (2007). Furthermore, the gap between high- and low-performing students has increased. The lowest-performing students at each grade level (those scoring within the 10th percentile) posted scores in 2019 that were lower than their scores a decade earlier, whereas the highest-performing students in the fourth and eighth grades (those scoring within the 90th percentile) had improved their scores since 2009 (Table SK12-1).
Average scores of students in grades 4 and 8 on the NAEP mathematics assessment: 1990–2019
| Year | Students in grade 4 | Students in grade 8 |
|---|---|---|
| 1990 | 213 | 263 |
| 1992 | 220 | 268 |
| 1996 | 224 | 270 |
| 2000 | 226 | 273 |
| 2003 | 235 | 278 |
| 2005 | 238 | 279 |
| 2007 | 240 | 281 |
| 2009 | 240 | 283 |
| 2011 | 241 | 284 |
| 2013 | 242 | 285 |
| 2015 | 240 | 282 |
| 2017 | 240 | 283 |
| 2019 | 241 | 282 |
NAEP = National Assessment of Educational Progress.
Note(s):
The scale for NAEP mathematics assessment scores is 0–500 for grades 4 and 8.
Source(s):
National Center for Science and Engineering Statistics, special tabulations (2020) of the 2009, 2011, 2013, 2015, 2017, and 2019 NAEP mathematics assessments, National Center for Education Statistics.
Science and Engineering Indicators
The NAEP 2019 mathematics data show that scores for Black, Hispanic, Native Hawaiian or Pacific Islander, and American Indian or Alaska Native students persistently lag behind the scores of their White and Asian peers. There are potentially many contributing factors to this persistent lag, including lack of access to high-quality STEM instruction and structural and systemic educational and societal inequities that affect students’ educational experiences and performance (Bowman, Comer, and Johns 2018; Hanushek et al. 2020; Pearman 2020; Reardon, Kalogrides, and Shores 2019). In 2019, Black, Hispanic, Native Hawaiian or Pacific Islander, and American Indian or Alaska Native students scored 18–25 points lower than White students in fourth grade and 24–32 points lower in eighth grade (Figure K12-2). Asian students have consistently outperformed all other groups, posting 2019 scores that were 14 points and 21 points higher than those of White students among fourth and eighth graders, respectively.
Average scores of students in grades 4 and 8 on the NAEP mathematics assessment, by race or ethnicity: 2011–19
| Year | Asian | White | Two or more races | Native Hawaiian or Pacific Islander | Hispanic | American Indian or Alaska Native | Black |
|---|---|---|---|---|---|---|---|
| 2011 | 257 | 249 | 245 | 236 | 229 | 225 | 224 |
| 2013 | 259 | 250 | 245 | 236 | 231 | 227 | 224 |
| 2015 | 259 | 248 | 245 | 231 | 230 | 227 | 224 |
| 2017 | 260 | 248 | 245 | 229 | 229 | 227 | 223 |
| 2019 | 263 | 249 | 244 | 226 | 231 | 227 | 224 |
| Year | Asian | White | Two or more races | Hispanic | American Indian or Alaska Native | Native Hawaiian or Pacific Islander | Black |
|---|---|---|---|---|---|---|---|
| 2011 | 305 | 293 | 288 | 270 | 265 | 269 | 262 |
| 2013 | 309 | 294 | 288 | 272 | 269 | 275 | 263 |
| 2015 | 307 | 292 | 285 | 270 | 267 | 276 | 260 |
| 2017 | 312 | 293 | 287 | 269 | 267 | 274 | 260 |
| 2019 | 313 | 292 | 286 | 268 | 262 | 266 | 260 |
NAEP = National Assessment of Educational Progress.
Note(s):
The scale for NAEP mathematics assessment scores is 0–500 for grades 4 and 8. Hispanic may be any race; race categories exclude Hispanic origin.
Source(s):
National Center for Science and Engineering Statistics, special tabulations (2020) of the 2011, 2013, 2015, 2017, and 2019 NAEP mathematics assessments, National Center for Education Statistics.
Science and Engineering Indicators
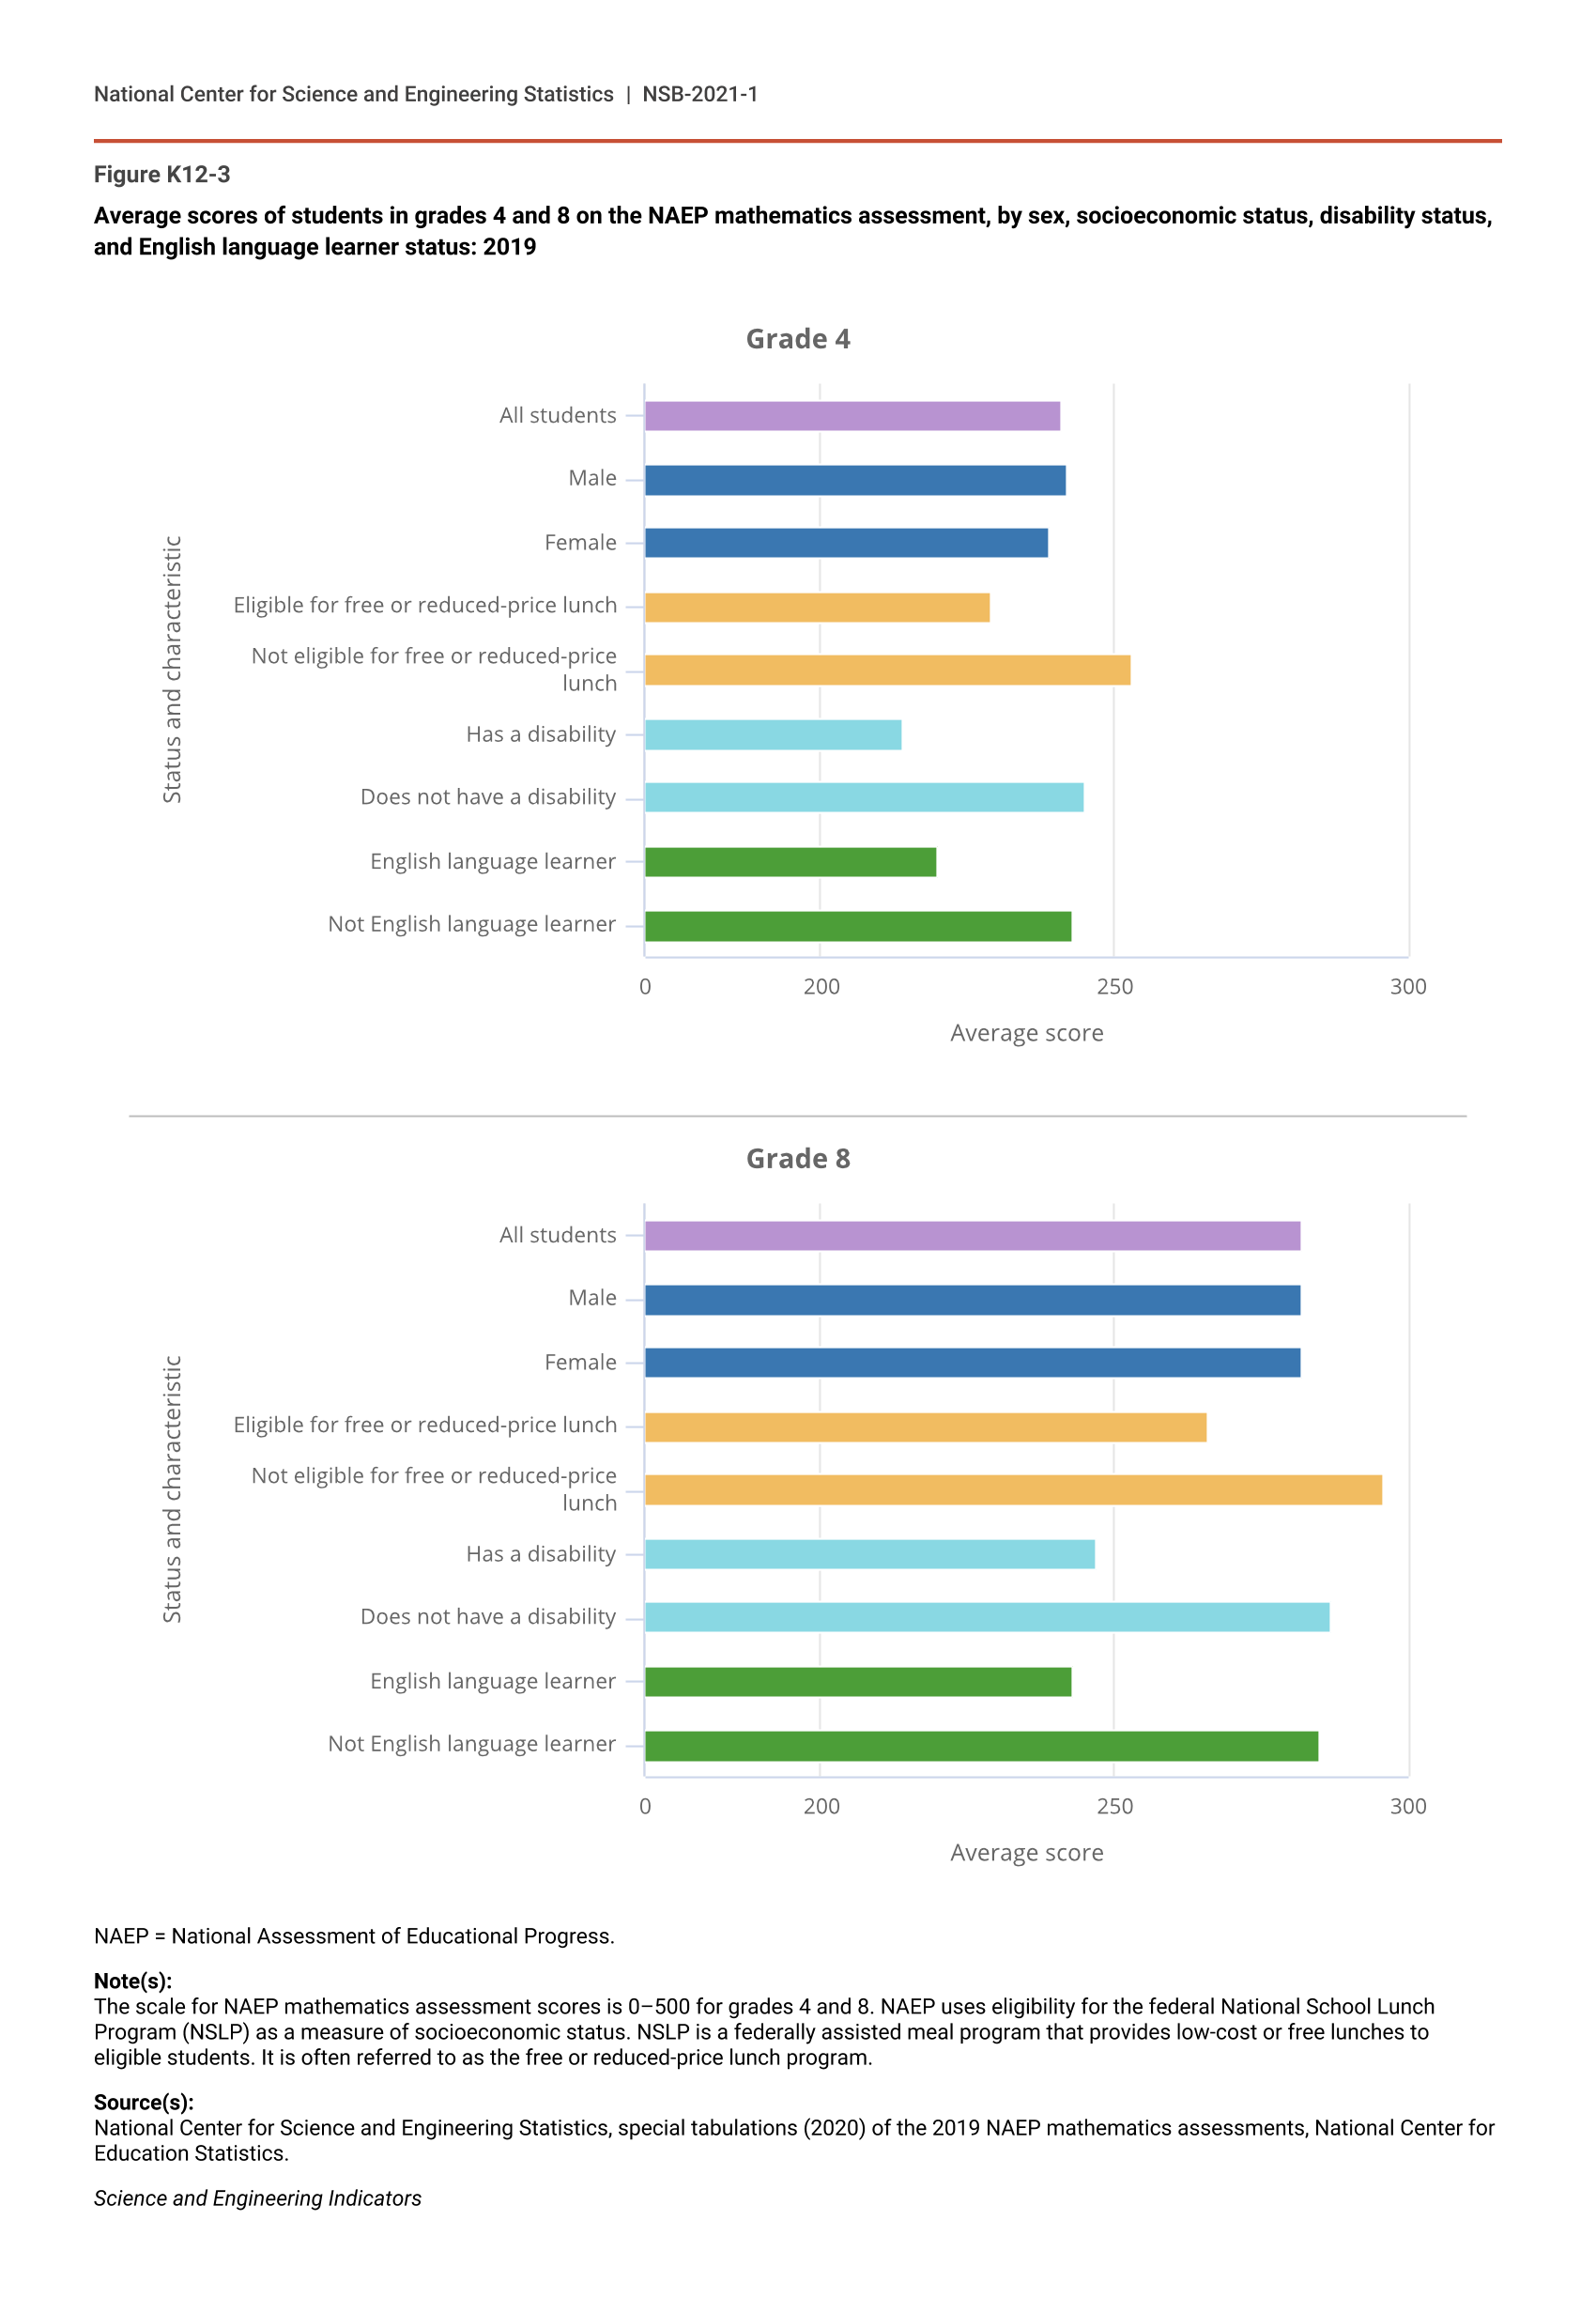
Score gaps of 23–42 points also exist at both grade levels between students from low- and high-SES families, students with and without disabilities, and students who are and are not English language learners (Figure K12-3). Male students slightly outscored female students by 3 points in fourth grade in 2019, but there was no difference in scores between males and females in eighth grade. Gaps up to 10 points appear in comparisons by region and school type, with fourth- and eighth-grade students in the Northeast scoring higher than students in the South and West, and students in suburban schools scoring higher than students in city, town, and rural schools (Figure K12-4).
Average scores of students in grades 4 and 8 on the NAEP mathematics assessment, by sex, socioeconomic status, disability status, and English language learner status: 2019
| Status and characteristic | Grade 4 score |
|---|---|
| All students | 241 |
| Male | 242 |
| Female | 239 |
| Eligible for free or reduced-price lunch | 229 |
| Not eligible for free or reduced-price lunch | 253 |
| Has a disability | 214 |
| Does not have a disability | 245 |
| English language learner | 220 |
| Not English language learner | 243 |
| Status and characteristic | Grade 8 score |
|---|---|
| All students | 282 |
| Male | 282 |
| Female | 282 |
| Eligible for free or reduced-price lunch | 266 |
| Not eligible for free or reduced-price lunch | 296 |
| Has a disability | 247 |
| Does not have a disability | 287 |
| English language learner | 243 |
| Not English language learner | 285 |
NAEP = National Assessment of Educational Progress.
Note(s):
The scale for NAEP mathematics assessment scores is 0–500 for grades 4 and 8. NAEP uses eligibility for the federal National School Lunch Program (NSLP) as a measure of socioeconomic status. NSLP is a federally assisted meal program that provides low-cost or free lunches to eligible students. It is often referred to as the free or reduced-price lunch program.
Source(s):
National Center for Science and Engineering Statistics, special tabulations (2020) of the 2019 NAEP mathematics assessments, National Center for Education Statistics.
Science and Engineering Indicators
Average scores of students in grades 4 and 8 on the NAEP mathematics assessment, by region of country and school location: 2019
| Region/School Location | Grade 4 score |
|---|---|
| Northeast | 243 |
| Midwest | 241 |
| South | 241 |
| West | 237 |
| City | 236 |
| Suburb | 245 |
| Town | 237 |
| Rural | 240 |
| Region/School Location | Grade 8 score |
|---|---|
| Northeast | 287 |
| Midwest | 286 |
| South | 280 |
| West | 279 |
| City | 277 |
| Suburb | 287 |
| Town | 277 |
| Rural | 283 |
NAEP = National Assessment of Educational Progress.
Note(s):
The scale for NAEP mathematics assessment scores is 0–500 for grades 4 and 8.
Source(s):
National Center for Science and Engineering Statistics, special tabulations (2020) of the 2019 NAEP mathematics assessments, National Center for Education Statistics.
Science and Engineering Indicators
Looking more deeply into gender differences, the only statistically significant difference between male and female eighth graders’ scores was among Black students, with females outscoring males by 5 points (Table K12-1). Among fourth graders, however, Black male students and Black female students had similar scores, whereas male students outscored female students among White, Asian, and Hispanic students. High-SES students had higher scores than low-SES students within all racial and ethnic groups at both grade levels, with score differences ranging from 15 points to 29 points.
Average scores of students in grades 4 and 8 on the NAEP mathematics assessment and score differences, by socioeconomic status and sex within race or ethnicity: 2019
* p < 0.05. Score difference is significantly different at the 0.05 level of statistical significance.
NAEP = National Assessment of Educational Progress.
a NAEP uses eligibility for the federal National School Lunch Program (NSLP) as a measure of socioeconomic status. NSLP is a federally assisted meal program that provides low-cost or free lunches to eligible students. It is sometimes referred to as the free or reduced-price lunch program.
b Other racial and ethnic groups are included in the rows for All students in grade 4 and All students in grade 8 but are not shown separately in the table.
c Hispanic may be any race; race categories exclude Hispanic origin.
Note(s):
The scale for NAEP mathematics assessment scores is 0–500 for grades 4 and 8.
Source(s):
National Center for Science and Engineering Statistics, special tabulations (2020) of the 2019 NAEP mathematics assessment, National Center for Education Statistics.
Science and Engineering Indicators
NAEP mathematics assessment results were recently released for students in 12th grade. These results show similar patterns as the results for fourth and eighth graders. The average score in 2019 was not significantly different from the score when the assessment was last administered in 2015 nor from the score in 2005, and scores for Black, Hispanic, and American Indian or Alaska Native students were lower than scores for White and Asian or Pacific Islander students (Table SK12-1).
The NAEP science assessment was administered to fourth, eighth, and 12th graders in 2019, but results were not available in time for inclusion in this volume of Indicators. The results for the 2015 NAEP science assessment showed that the average NAEP science scores for the nation increased 4 points between 2009 and 2015 in both fourth and eighth grades but did not change significantly in 12th grade. More detailed analysis of the 2015 NAEP science scores can be found in Indicators 2018. State-level data on mathematics and science achievement can be found in State Indicators.
International Comparisons of Mathematics and Science Performance
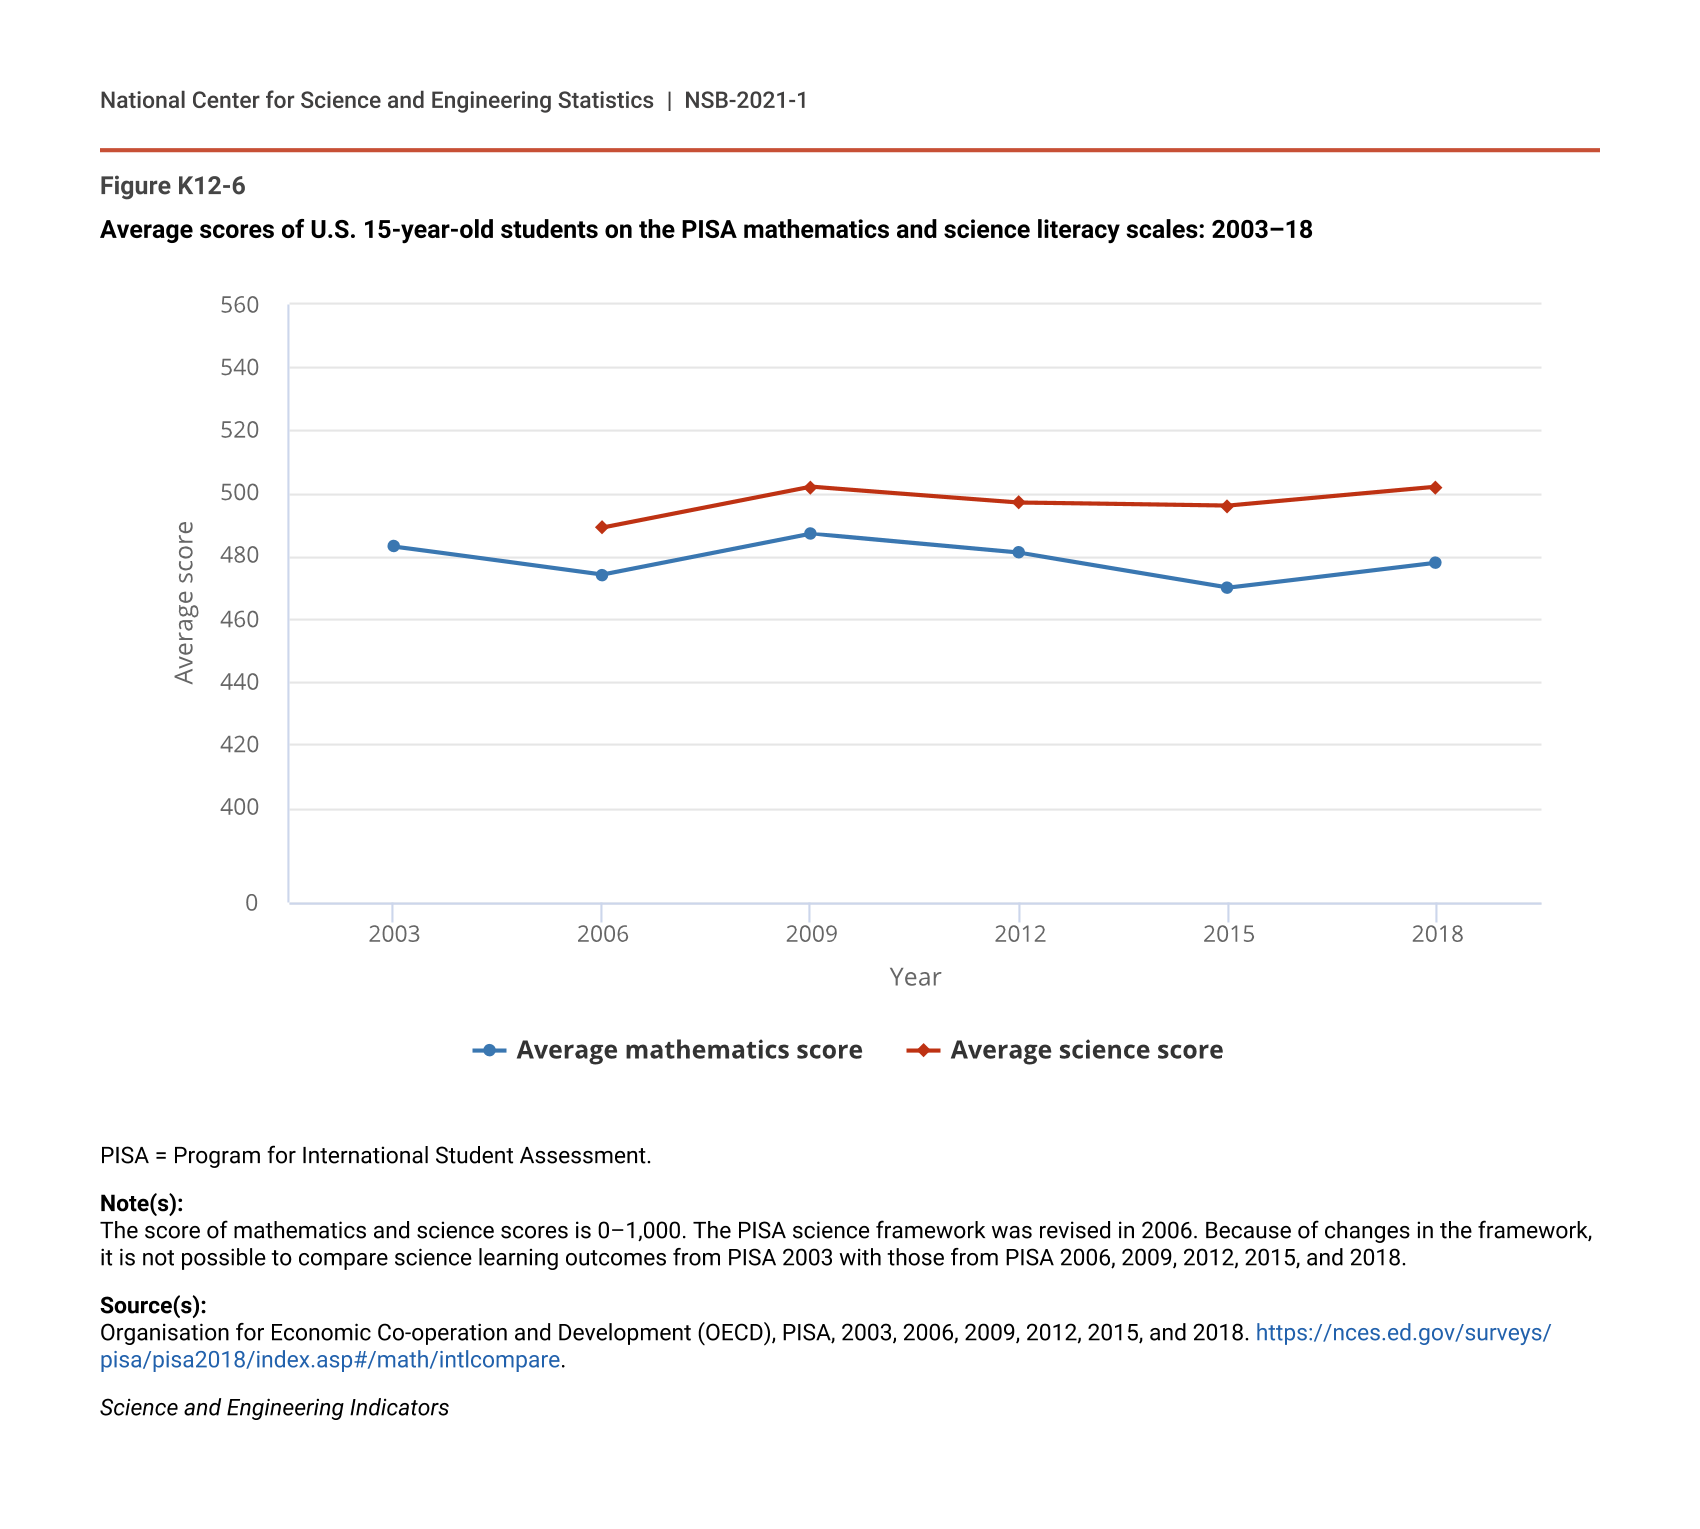
U.S. 15-year-olds rank higher internationally in science literacy than they do in mathematics literacy, as shown by their performance on the 2018 Program for International Student Assessment (PISA). In mathematics, U.S. 15-year-olds in 2018 ranked 25th among 37 OECD countries; compared to the 36 other OECD members, the U.S. average in mathematics literacy for 15-year-olds was lower than the average in 24 education systems, higher than in 6, and not measurably different than in 6 (Figure K12-5). The average score in 2018 was lower than the OECD average and did not measurably change since 2003 (Figure K12-6). In comparison, U.S. students fared better in science, ranking in the 7th position out of 37; compared to the 36 other OECD members, the U.S. average score in science literacy was lower than the average in 6 education systems, higher than in 19, and not measurably different than in 11. The U.S. average science score was higher than the OECD average in 2018 and improved by 13 points between 2006 and 2018.
Average scores of 15-year-old students on the PISA mathematics and science literacy scales, by OECD education system: 2018
| Education system | Average score |
|---|---|
| Japan* | 527 |
| South Korea* | 526 |
| Estonia* | 523 |
| Netherlands* | 519 |
| Poland* | 516 |
| Switzerland* | 515 |
| Canada* | 512 |
| Denmark* | 509 |
| Slovenia* | 509 |
| Belgium* | 508 |
| Finland* | 507 |
| Sweden* | 502 |
| United Kingdom* | 502 |
| Norway* | 501 |
| Germany* | 500 |
| Ireland* | 500 |
| Czechia* | 499 |
| Austria* | 499 |
| Latvia* | 496 |
| France* | 495 |
| Iceland* | 495 |
| New Zealand* | 494 |
| Portugal* | 492 |
| Australia* | 491 |
| OECD average* | 489 |
| Italy | 487 |
| Slovakia | 486 |
| Luxembourg | 483 |
| Spain | 481 |
| Lithuania | 481 |
| Hungary | 481 |
| United States | 478 |
| Israel* | 462 |
| Turkey* | 454 |
| Greece* | 451 |
| Chile* | 417 |
| Mexico* | 409 |
| Colombia* | 391 |
| Education system | Average score |
|---|---|
| Estonia* | 530 |
| Japan* | 529 |
| Finland* | 522 |
| South Korea* | 519 |
| Canada* | 518 |
| Poland* | 511 |
| New Zealand | 508 |
| Slovenia | 507 |
| United Kingdom | 505 |
| Netherlands | 503 |
| Germany | 503 |
| Australia | 503 |
| United States | 502 |
| Sweden | 499 |
| Belgium | 499 |
| Czechia | 497 |
| Ireland | 496 |
| Switzerland | 495 |
| France* | 493 |
| Denmark* | 493 |
| Portugal* | 492 |
| Norway* | 490 |
| Austria* | 490 |
| OECD average* | 489 |
| Latvia* | 487 |
| Spain* | 483 |
| Lithuania* | 482 |
| Hungary* | 481 |
| Luxembourg* | 477 |
| Iceland* | 475 |
| Turkey* | 468 |
| Italy* | 468 |
| Slovakia* | 464 |
| Israel* | 462 |
| Greece* | 452 |
| Chile* | 444 |
| Mexico* | 419 |
| Colombia* | 413 |
* p < 0.05. Significantly different from the U.S. estimate at the 0.05 level of statistical significance.
OECD = Organisation for Economic Co-operation and Development; PISA = Program for International Student Assessment.
Note(s):
The score of mathematics and science scores is 0–1,000. The OECD average is the average of the national averages of the OECD member countries, with each country weighted equally. For Colombia, Mexico, and Turkey, at least 50% but less than 75% of the 15-year-old population is covered by the PISA sample.
Source(s):
OECD, PISA, 2018. https://nces.ed.gov/surveys/pisa/pisa2018/index.asp#/math/intlcompare.
Science and Engineering Indicators
Average scores of U.S. 15-year-old students on the PISA mathematics and science literacy scales: 2003–18
| Year | Average mathematics score | Average science score |
|---|---|---|
| 2003 | 483 | NA |
| 2006 | 474 | 489 |
| 2009 | 487 | 502 |
| 2012 | 481 | 497 |
| 2015 | 470 | 496 |
| 2018 | 478 | 502 |
PISA = Program for International Student Assessment.
Note(s):
The score of mathematics and science scores is 0–1,000. The PISA science framework was revised in 2006. Because of changes in the framework, it is not possible to compare science learning outcomes from PISA 2003 with those from PISA 2006, 2009, 2012, 2015, and 2018.
Source(s):
Organisation for Economic Co-operation and Development (OECD), PISA, 2003, 2006, 2009, 2012, 2015, and 2018. https://nces.ed.gov/surveys/pisa/pisa2018/index.asp#/math/intlcompare.
Science and Engineering Indicators
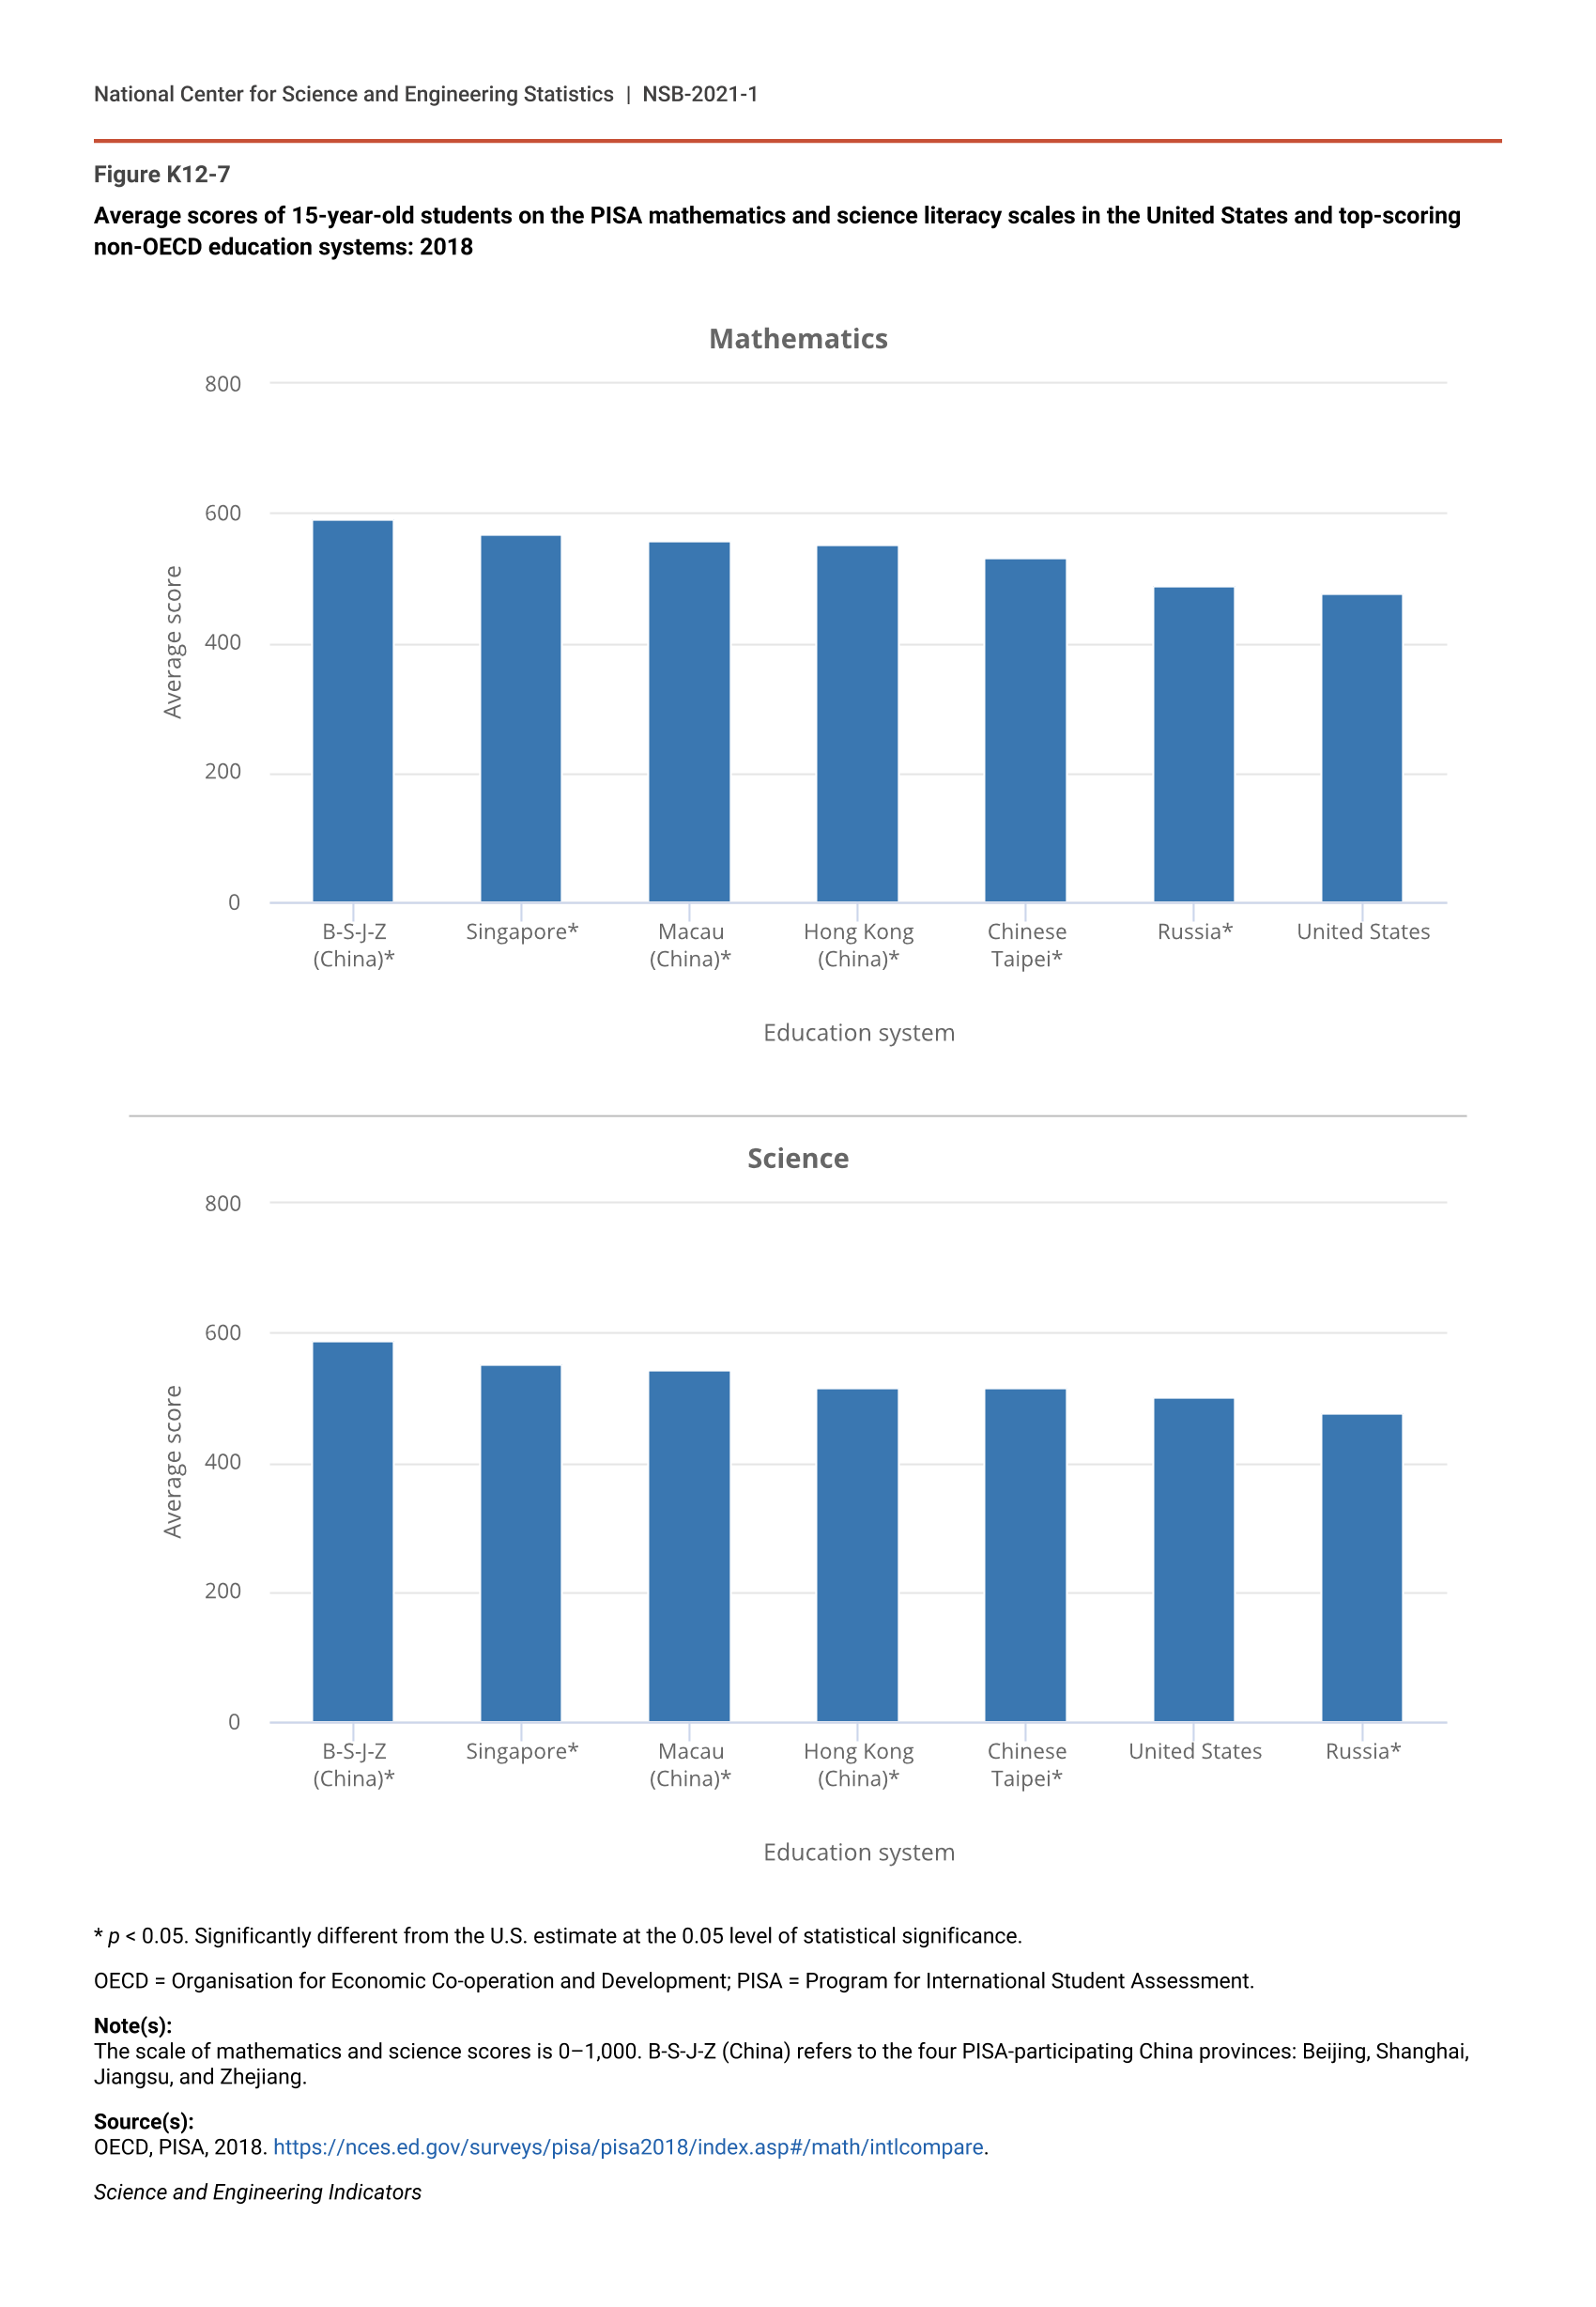
Japan, South Korea, Estonia, and the Netherlands were the highest-scoring OECD countries in mathematics in 2018, and Estonia and Japan were the highest scoring in science. PISA also tests students in several city-based and non-OECD-country education systems (Figure K12-7). Among these entities, Beijing, Shanghai, Jiangsu, and Zhejiang (B-S-J-Z) in China, Singapore, and Macau (China) were the highest scorers in both mathematics and science. The scores for cities and small countries in Figure K12-7 are not directly comparable to those of the United States, which has a much larger and more heterogenous education system. These scores are presented to provide context for U.S. performance compared to that of some of its global competitors in science and technology businesses and innovation.
Average scores of 15-year-old students on the PISA mathematics and science literacy scales in the United States and top-scoring non-OECD education systems: 2018
| Education system | Average mathematics score |
|---|---|
| B-S-J-Z (China)* | 591 |
| Singapore* | 569 |
| Macau (China)* | 558 |
| Hong Kong (China)* | 551 |
| Chinese Taipei* | 531 |
| Russia* | 488 |
| United States | 478 |
| Education system | Average science score |
|---|---|
| B-S-J-Z (China)* | 590 |
| Singapore* | 551 |
| Macau (China)* | 544 |
| Hong Kong (China)* | 517 |
| Chinese Taipei* | 516 |
| United States | 502 |
| Russia* | 478 |
* p < 0.05. Significantly different from the U.S. estimate at the 0.05 level of statistical significance.
OECD = Organisation for Economic Co-operation and Development; PISA = Program for International Student Assessment.
Note(s):
The scale of mathematics and science scores is 0–1,000. B-S-J-Z (China) refers to the four PISA-participating China provinces: Beijing, Shanghai, Jiangsu, and Zhejiang.
Source(s):
OECD, PISA, 2018. https://nces.ed.gov/surveys/pisa/pisa2018/index.asp#/math/intlcompare.
Science and Engineering Indicators
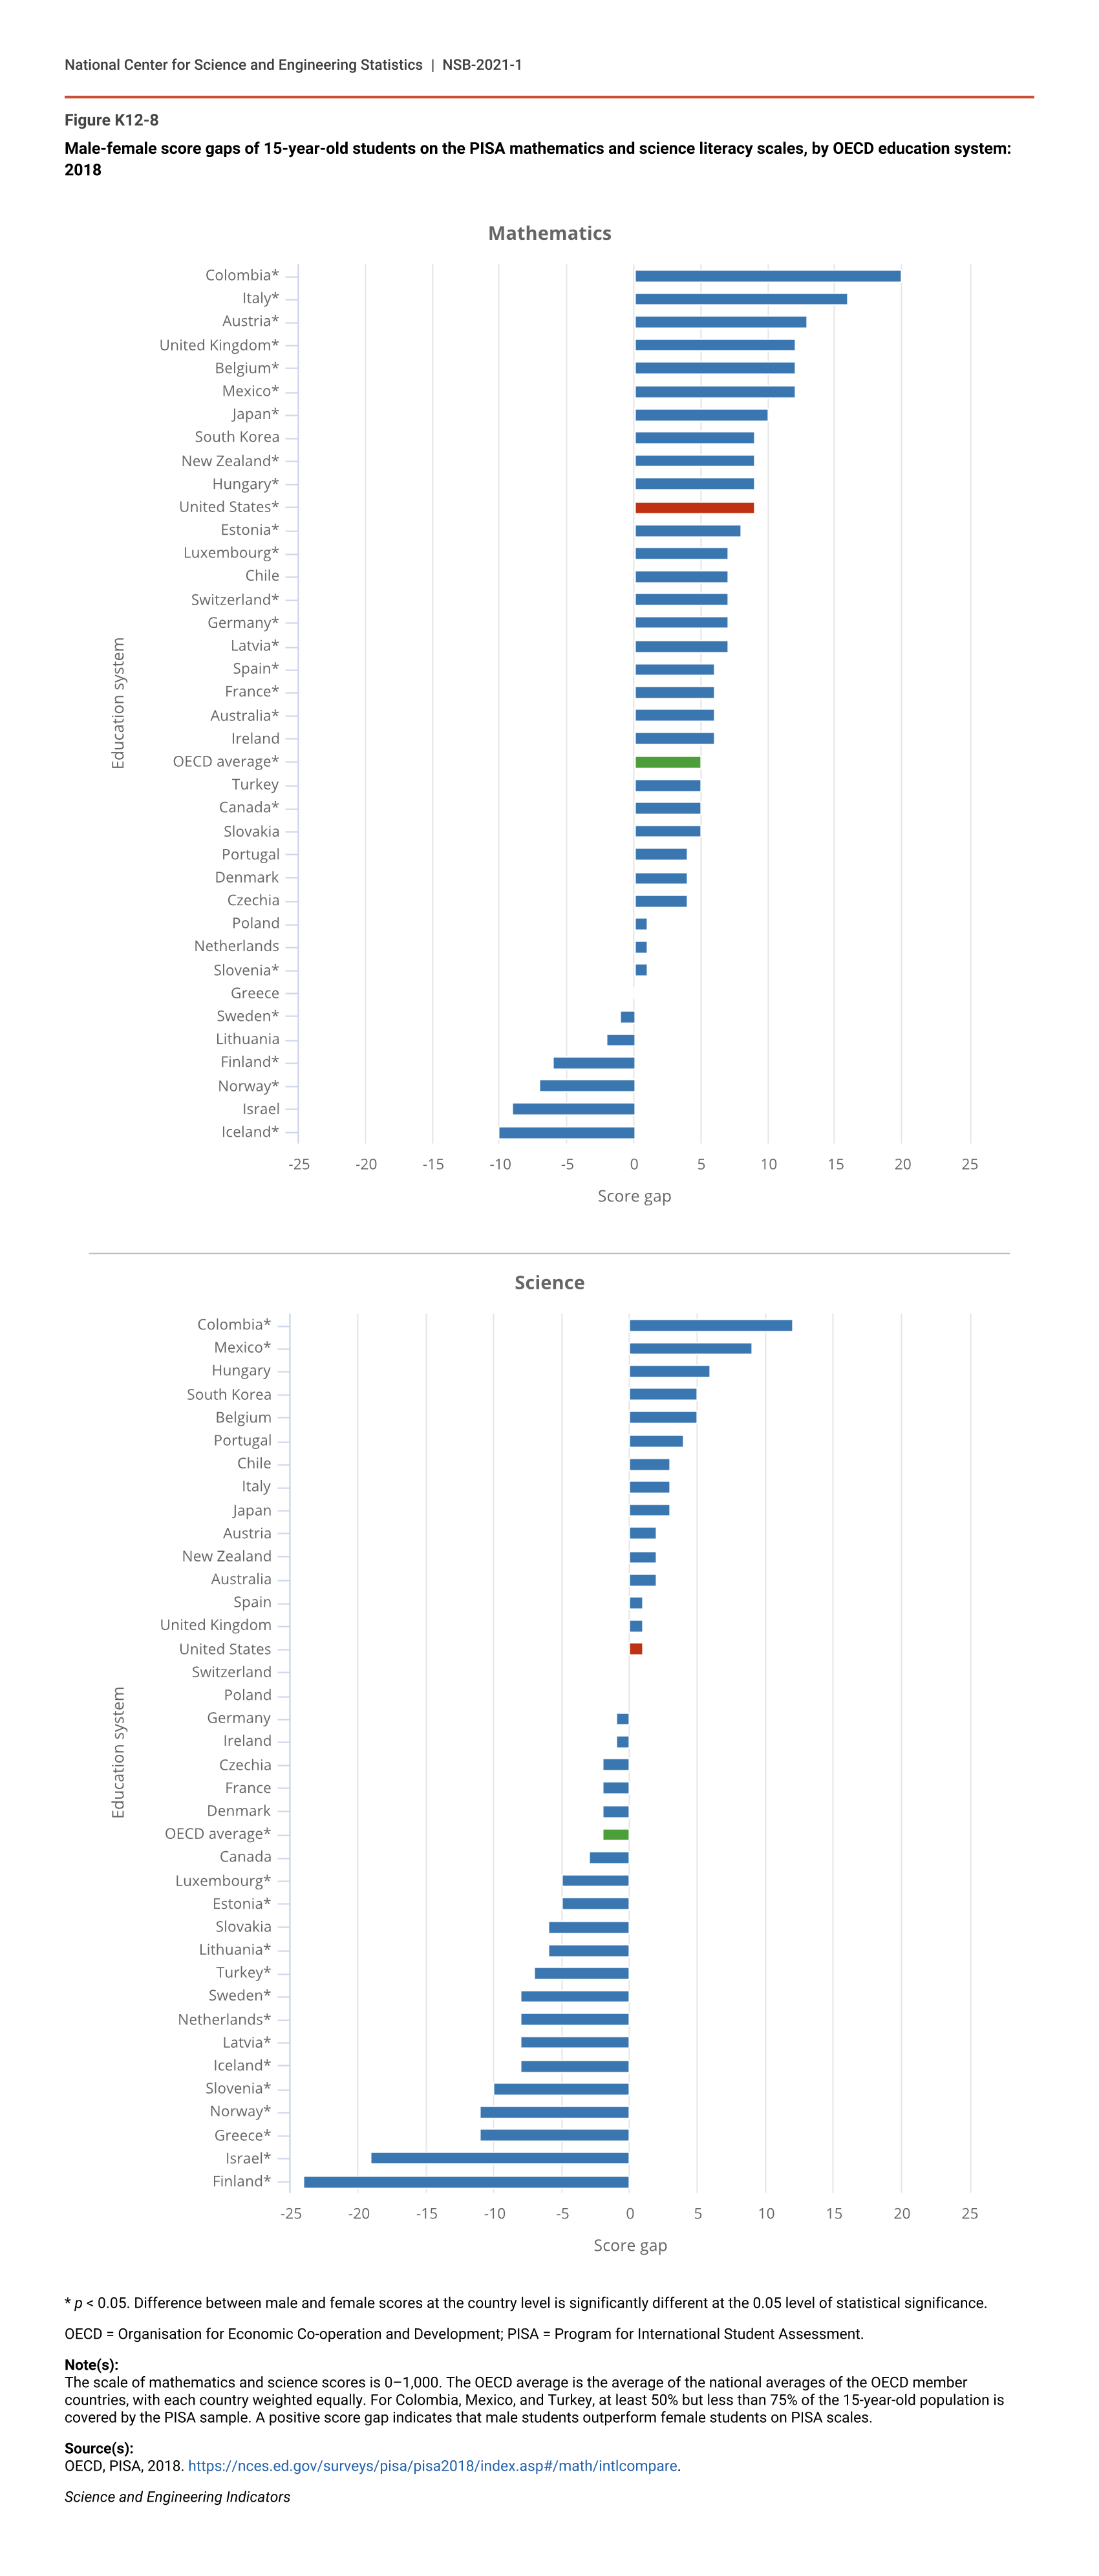
Average PISA scores indicate score gaps between male and female students in many countries, including the United States (Figure K12-8). In the United States, male students outperformed female students in mathematics literacy by 9 points, but there was no measurable difference between male and female students’ scores in science. Among OECD countries, on average, male students outscored female students by 5 points in mathematics, and female students outscored male students by 2 points in science. In such countries as Finland, Norway, Iceland, and Israel, female students outscored male students by substantial margins in both mathematics and science.
Male-female score gaps of 15-year-old students on the PISA mathematics and science literacy scales, by OECD education system: 2018
| Education system | Male-female mathematics score difference |
|---|---|
| Iceland* | -10 |
| Israel | -9 |
| Norway* | -7 |
| Finland* | -6 |
| Lithuania | -2 |
| Sweden* | -1 |
| Greece | 0 |
| Slovenia* | 1 |
| Netherlands | 1 |
| Poland | 1 |
| Czechia | 4 |
| Denmark | 4 |
| Portugal | 4 |
| Slovakia | 5 |
| Canada* | 5 |
| Turkey | 5 |
| OECD average* | 5 |
| Ireland | 6 |
| Australia* | 6 |
| France* | 6 |
| Spain* | 6 |
| Latvia* | 7 |
| Germany* | 7 |
| Switzerland* | 7 |
| Chile | 7 |
| Luxembourg* | 7 |
| Estonia* | 8 |
| United States* | 9 |
| Hungary* | 9 |
| New Zealand* | 9 |
| South Korea | 9 |
| Japan* | 10 |
| Mexico* | 12 |
| Belgium* | 12 |
| United Kingdom* | 12 |
| Austria* | 13 |
| Italy* | 16 |
| Colombia* | 20 |
| Education system | Male-female science score difference |
|---|---|
| Finland* | -24 |
| Israel* | -19 |
| Greece* | -11 |
| Norway* | -11 |
| Slovenia* | -10 |
| Iceland* | -8 |
| Latvia* | -8 |
| Netherlands* | -8 |
| Sweden* | -8 |
| Turkey* | -7 |
| Lithuania* | -6 |
| Slovakia | -6 |
| Estonia* | -5 |
| Luxembourg* | -5 |
| Canada | -3 |
| OECD average* | -2 |
| Denmark | -2 |
| France | -2 |
| Czechia | -2 |
| Ireland | -1 |
| Germany | -1 |
| Poland | 0 |
| Switzerland | 0 |
| United States | 1 |
| United Kingdom | 1 |
| Spain | 1 |
| Australia | 2 |
| New Zealand | 2 |
| Austria | 2 |
| Japan | 3 |
| Italy | 3 |
| Chile | 3 |
| Portugal | 4 |
| Belgium | 5 |
| South Korea | 5 |
| Hungary | 6 |
| Mexico* | 9 |
| Colombia* | 12 |
* p < 0.05. Difference between male and female scores at the country level is significantly different at the 0.05 level of statistical significance.
OECD = Organisation for Economic Co-operation and Development; PISA = Program for International Student Assessment.
Note(s):
The scale of mathematics and science scores is 0–1,000. The OECD average is the average of the national averages of the OECD member countries, with each country weighted equally. For Colombia, Mexico, and Turkey, at least 50% but less than 75% of the 15-year-old population is covered by the PISA sample. A positive score gap indicates that male students outperform female students on PISA scales.
Source(s):
OECD, PISA, 2018. https://nces.ed.gov/surveys/pisa/pisa2018/index.asp#/math/intlcompare.
Science and Engineering Indicators
The Trends in International Mathematics and Science Study (TIMSS) is another international comparative study that measures trends in mathematics and science achievement in fourth and eighth grades every 4 years. TIMSS is designed to align broadly with mathematics and science curricula in the participating education systems and, therefore, to reflect students’ school-based learning. The United States has participated in every administration of TIMSS since its inception in 1995, including the most recent administration in 2019. TIMSS 2019 data were released too late for inclusion in this edition of Indicators; data on U.S performance in 2019 are available here: TIMSS 2019 U.S. Results.
International Comparisons of Computer Science Performance
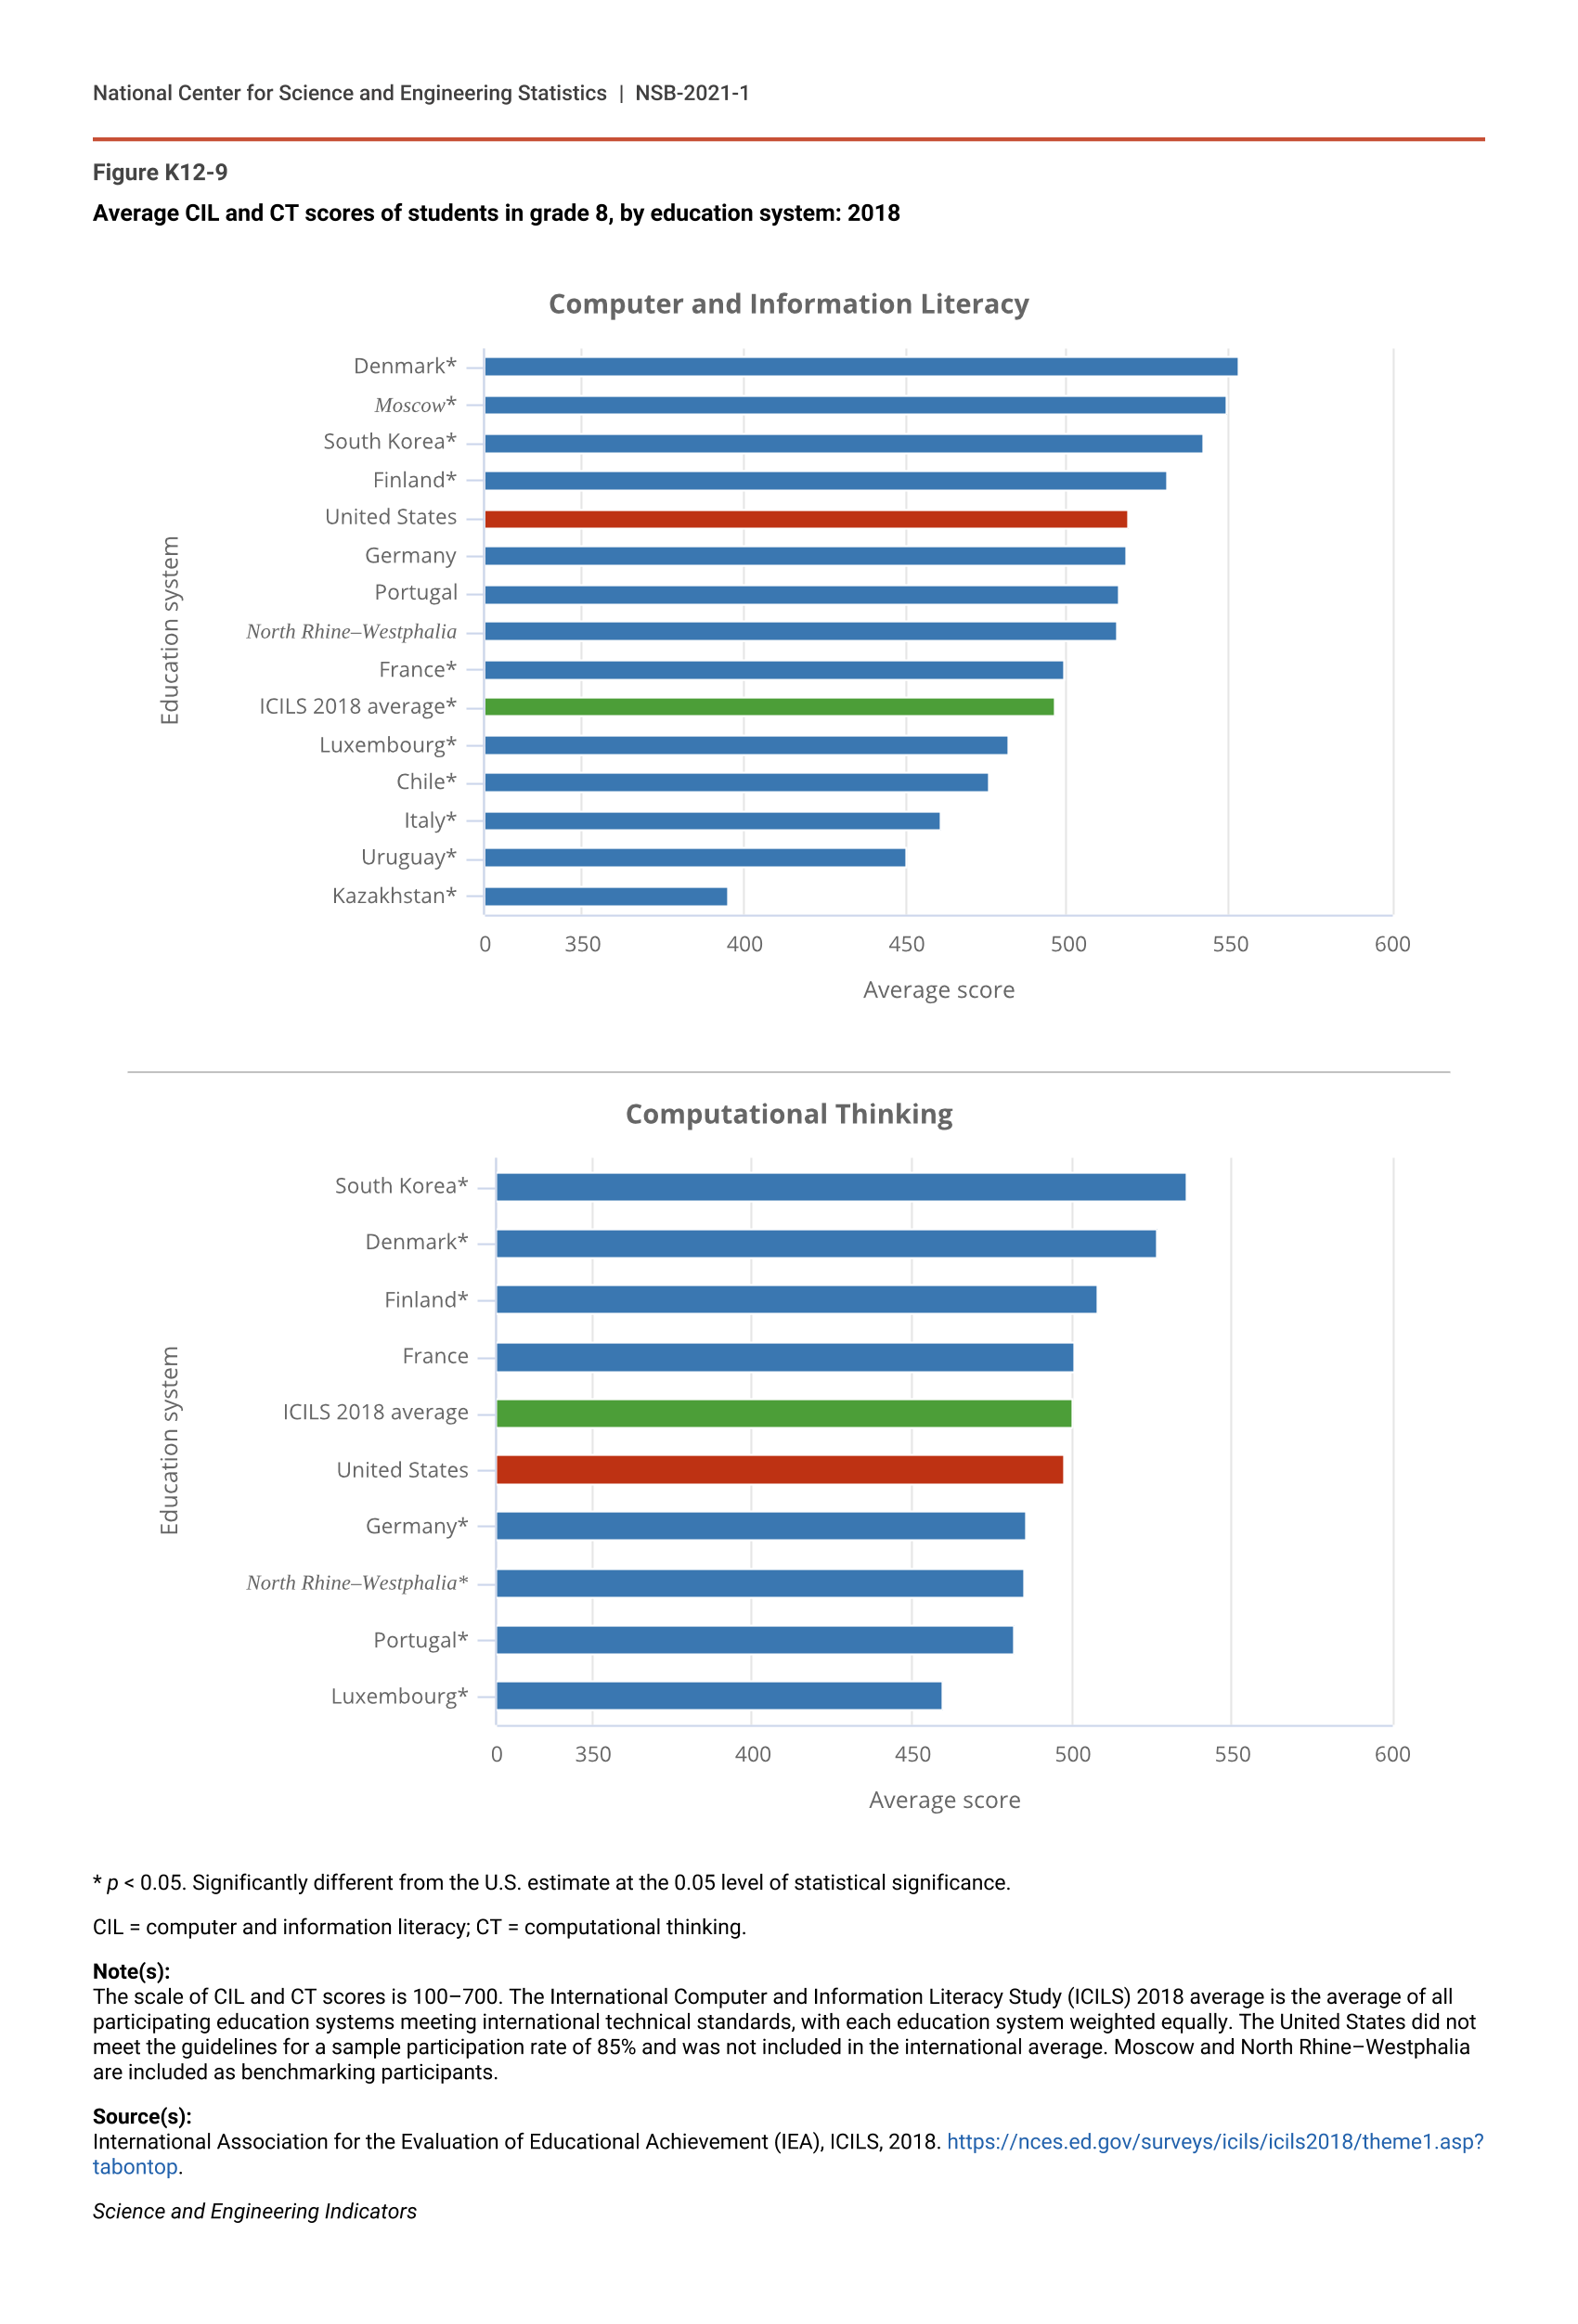
In the 2018 International Computer and Information Literacy Study (ICILS), U.S. eighth-grade students’ average score was higher than the international average on computer and information literacy and was not measurably different from the international average on computational thinking (Figure K12-9). Computer and information literacy refers to the ability to use computers effectively in everyday life at home, work, and school, whereas computational thinking refers to the use of computers to solve problems and includes such skills as programming. The United States scored 5th among the 14 education systems that participated in the computer and information literacy assessment and 4th among the 9 education systems that participated in the computational thinking assessment. Internationally, Denmark and South Korea were the highest-scoring countries on both assessments. The city of Moscow had the second-highest score in computer and information literacy. U.S. students outperformed their counterparts in France, Luxembourg, Chile, Italy, Uruguay, and Kazakhstan in computer and information literacy and Germany, Portugal, and Luxembourg in computational thinking.
Average CIL and CT scores of students in grade 8, by education system: 2018
| Education system | CIL score |
|---|---|
| Denmark* | 553 |
| Moscow* | 549 |
| South Korea* | 542 |
| Finland* | 531 |
| United States | 519 |
| Germany | 518 |
| Portugal | 516 |
| North Rhine–Westphalia | 515 |
| France* | 499 |
| ICILS 2018 average* | 496 |
| Luxembourg* | 482 |
| Chile* | 476 |
| Italy* | 461 |
| Uruguay* | 450 |
| Kazakhstan* | 395 |
| Education system | CT score |
|---|---|
| South Korea* | 536 |
| Denmark* | 527 |
| Finland* | 508 |
| France | 501 |
| ICILS 2018 average | 500 |
| United States | 498 |
| Germany* | 486 |
| North Rhine–Westphalia* | 485 |
| Portugal* | 482 |
| Luxembourg* | 460 |
* p < 0.05. Significantly different from the U.S. estimate at the 0.05 level of statistical significance.
CIL = computer and information literacy; CT = computational thinking.
Note(s):
The scale of CIL and CT scores is 100–700. The International Computer and Information Literacy Study (ICILS) 2018 average is the average of all participating education systems meeting international technical standards, with each education system weighted equally. The United States did not meet the guidelines for a sample participation rate of 85% and was not included in the international average. Moscow and North Rhine–Westphalia are included as benchmarking participants.
Source(s):
International Association for the Evaluation of Educational Achievement (IEA), ICILS, 2018. https://nces.ed.gov/surveys/icils/icils2018/theme1.asp?tabontop.
Science and Engineering Indicators
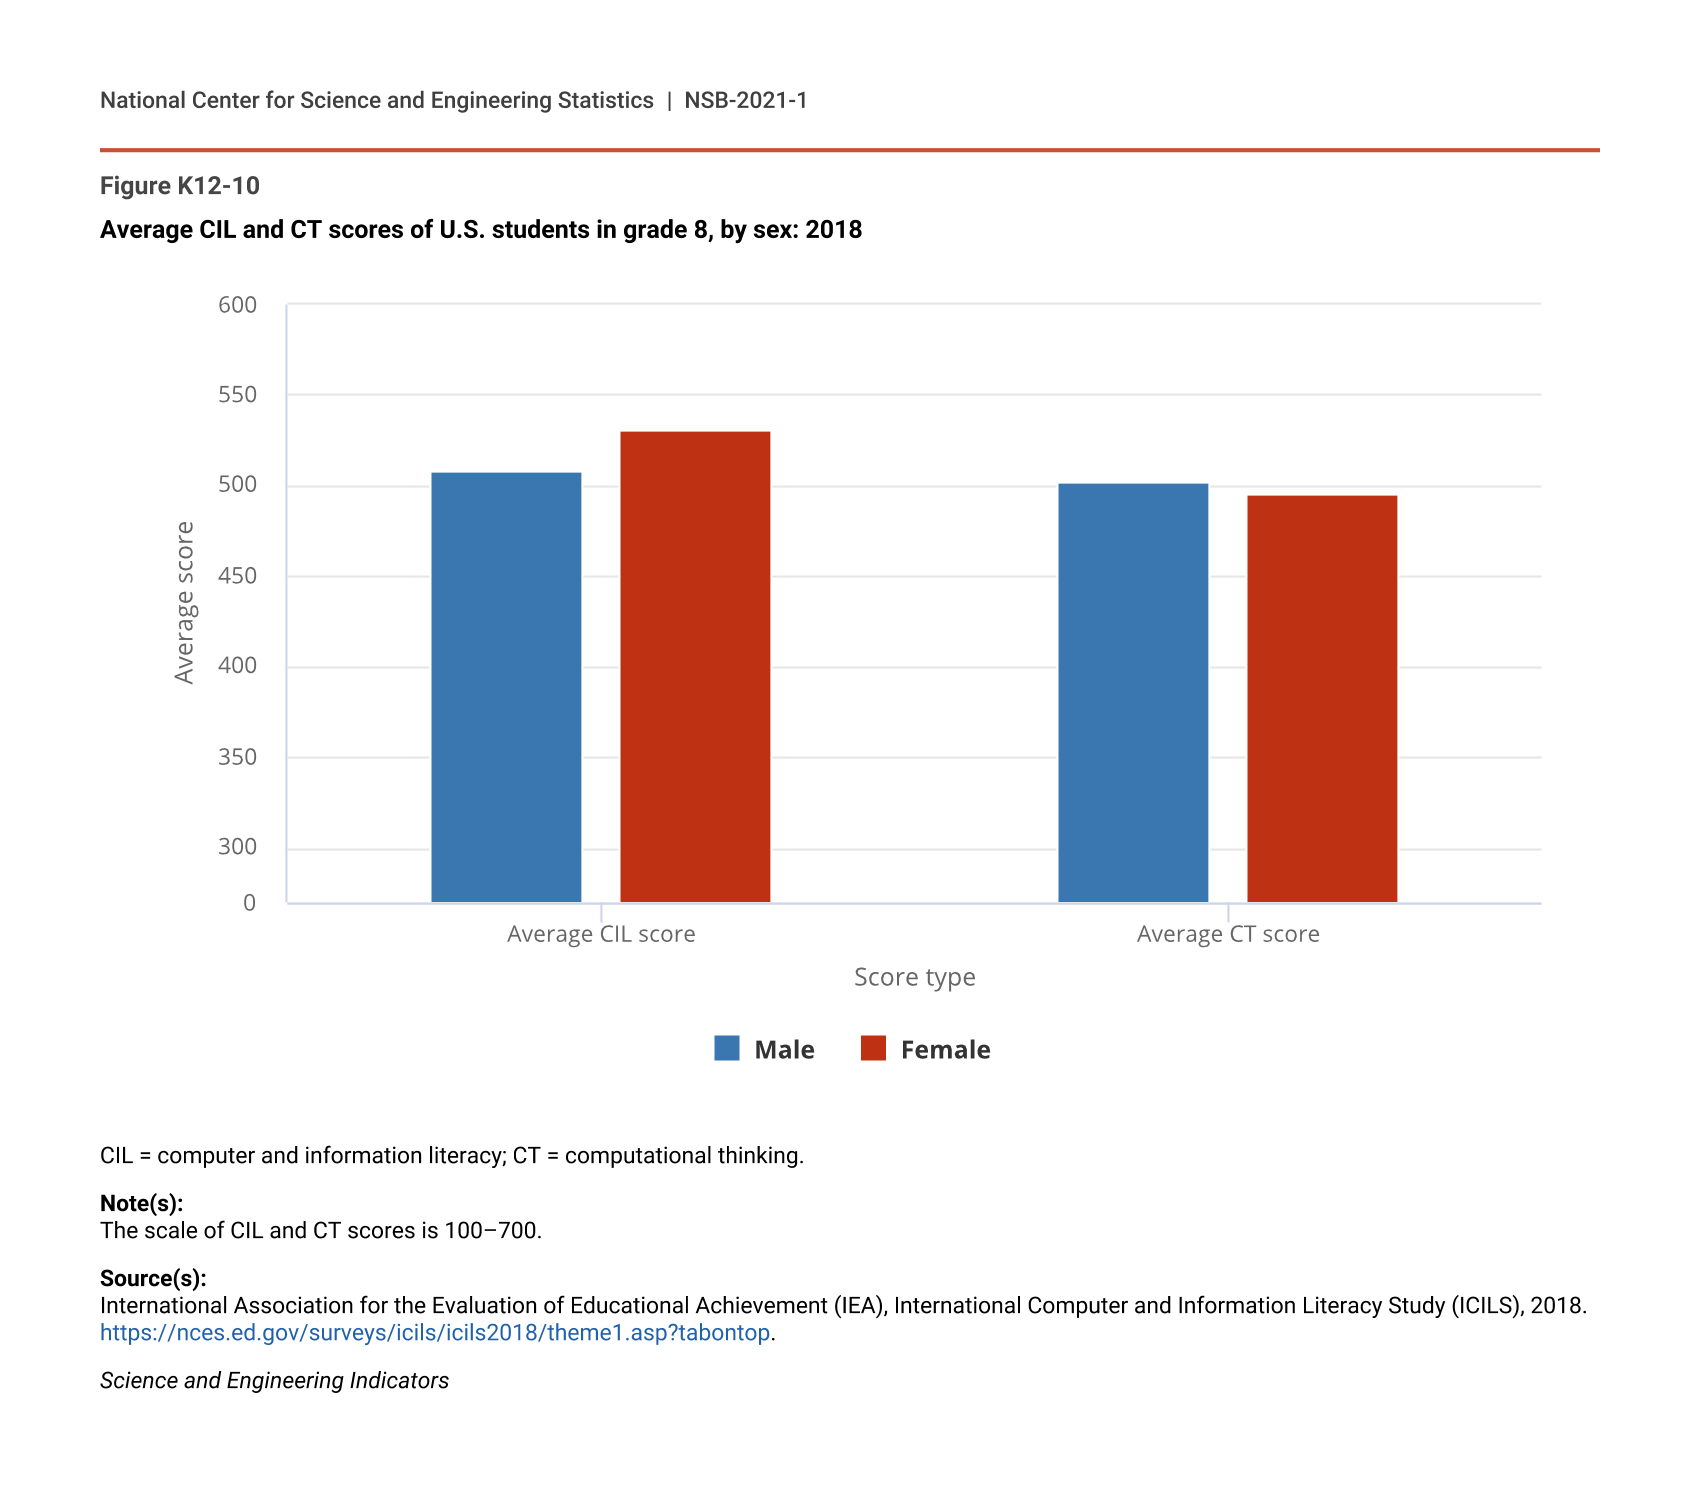
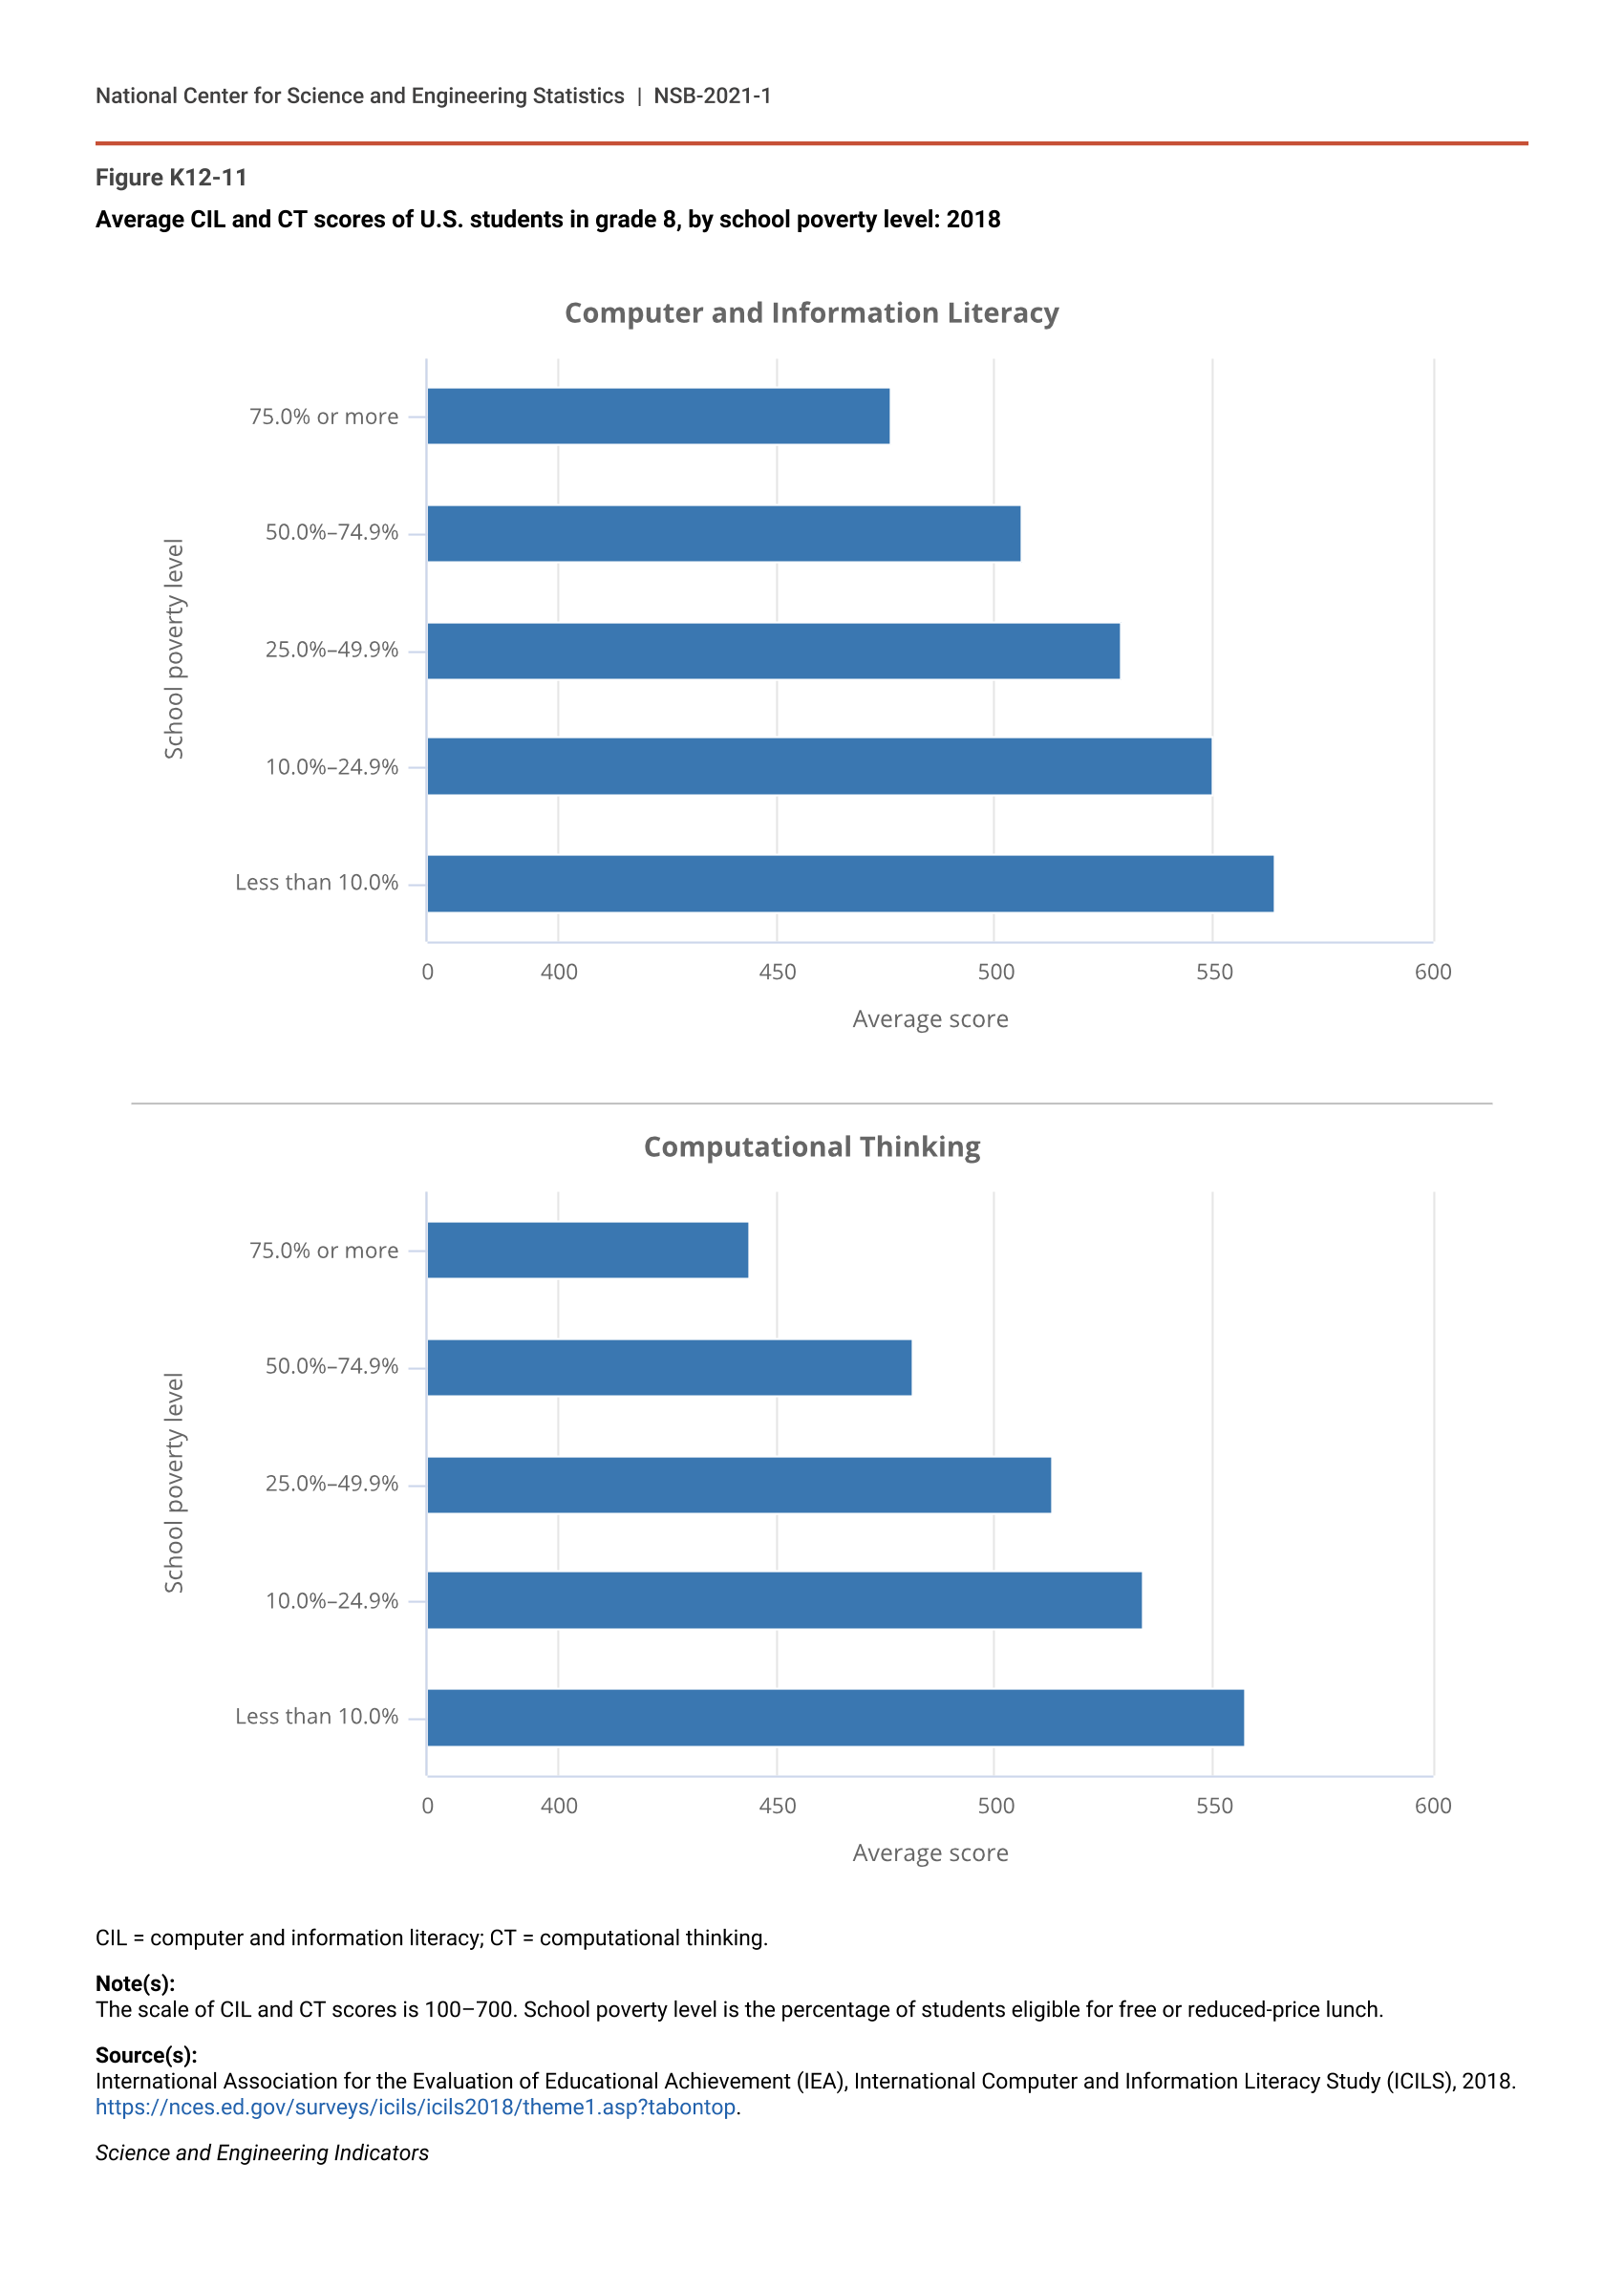
ICILS also provides information about U.S. eighth-grade student scores by sex, race or ethnicity, and school poverty level. Female students outperformed male students in computer and information literacy by 23 points (531 compared to 508); there was no measurable difference in scores between male students and female students in computational thinking (Figure K12-10). Scores differed far more substantially by school poverty level. U.S. eighth-grade students in schools with less than 10% of students eligible for free or reduced-price lunch outscored students in schools with 75% or more students eligible by 88 points in computer and information literacy (564 compared to 476) and 112 points (557 compared to 444) in computational thinking (Figure K12-11).
Average CIL and CT scores of U.S. students in grade 8, by sex: 2018
| Score type | Male | Female |
|---|---|---|
| Average CIL score | 508 | 531 |
| Average CT score | 502 | 495 |
CIL = computer and information literacy; CT = computational thinking.
Note(s):
The scale of CIL and CT scores is 100–700.
Source(s):
International Association for the Evaluation of Educational Achievement (IEA), International Computer and Information Literacy Study (ICILS), 2018. https://nces.ed.gov/surveys/icils/icils2018/theme1.asp?tabontop.
Science and Engineering Indicators
Average CIL and CT scores of U.S. students in grade 8, by school poverty level: 2018
| School poverty level | Average CIL score |
|---|---|
| 75.0% or more | 476 |
| 50.0%–74.9% | 506 |
| 25.0%–49.9% | 529 |
| 10.0%–24.9% | 550 |
| Less than 10.0% | 564 |
| School poverty level | Average CT score |
|---|---|
| 75.0% or more | 444 |
| 50.0%–74.9% | 481 |
| 25.0%–49.9% | 513 |
| 10.0%–24.9% | 534 |
| Less than 10.0% | 557 |
CIL = computer and information literacy; CT = computational thinking.
Note(s):
The scale of CIL and CT scores is 100–700. School poverty level is the percentage of students eligible for free or reduced-price lunch.
Source(s):
International Association for the Evaluation of Educational Achievement (IEA), International Computer and Information Literacy Study (ICILS), 2018. https://nces.ed.gov/surveys/icils/icils2018/theme1.asp?tabontop.
Science and Engineering Indicators
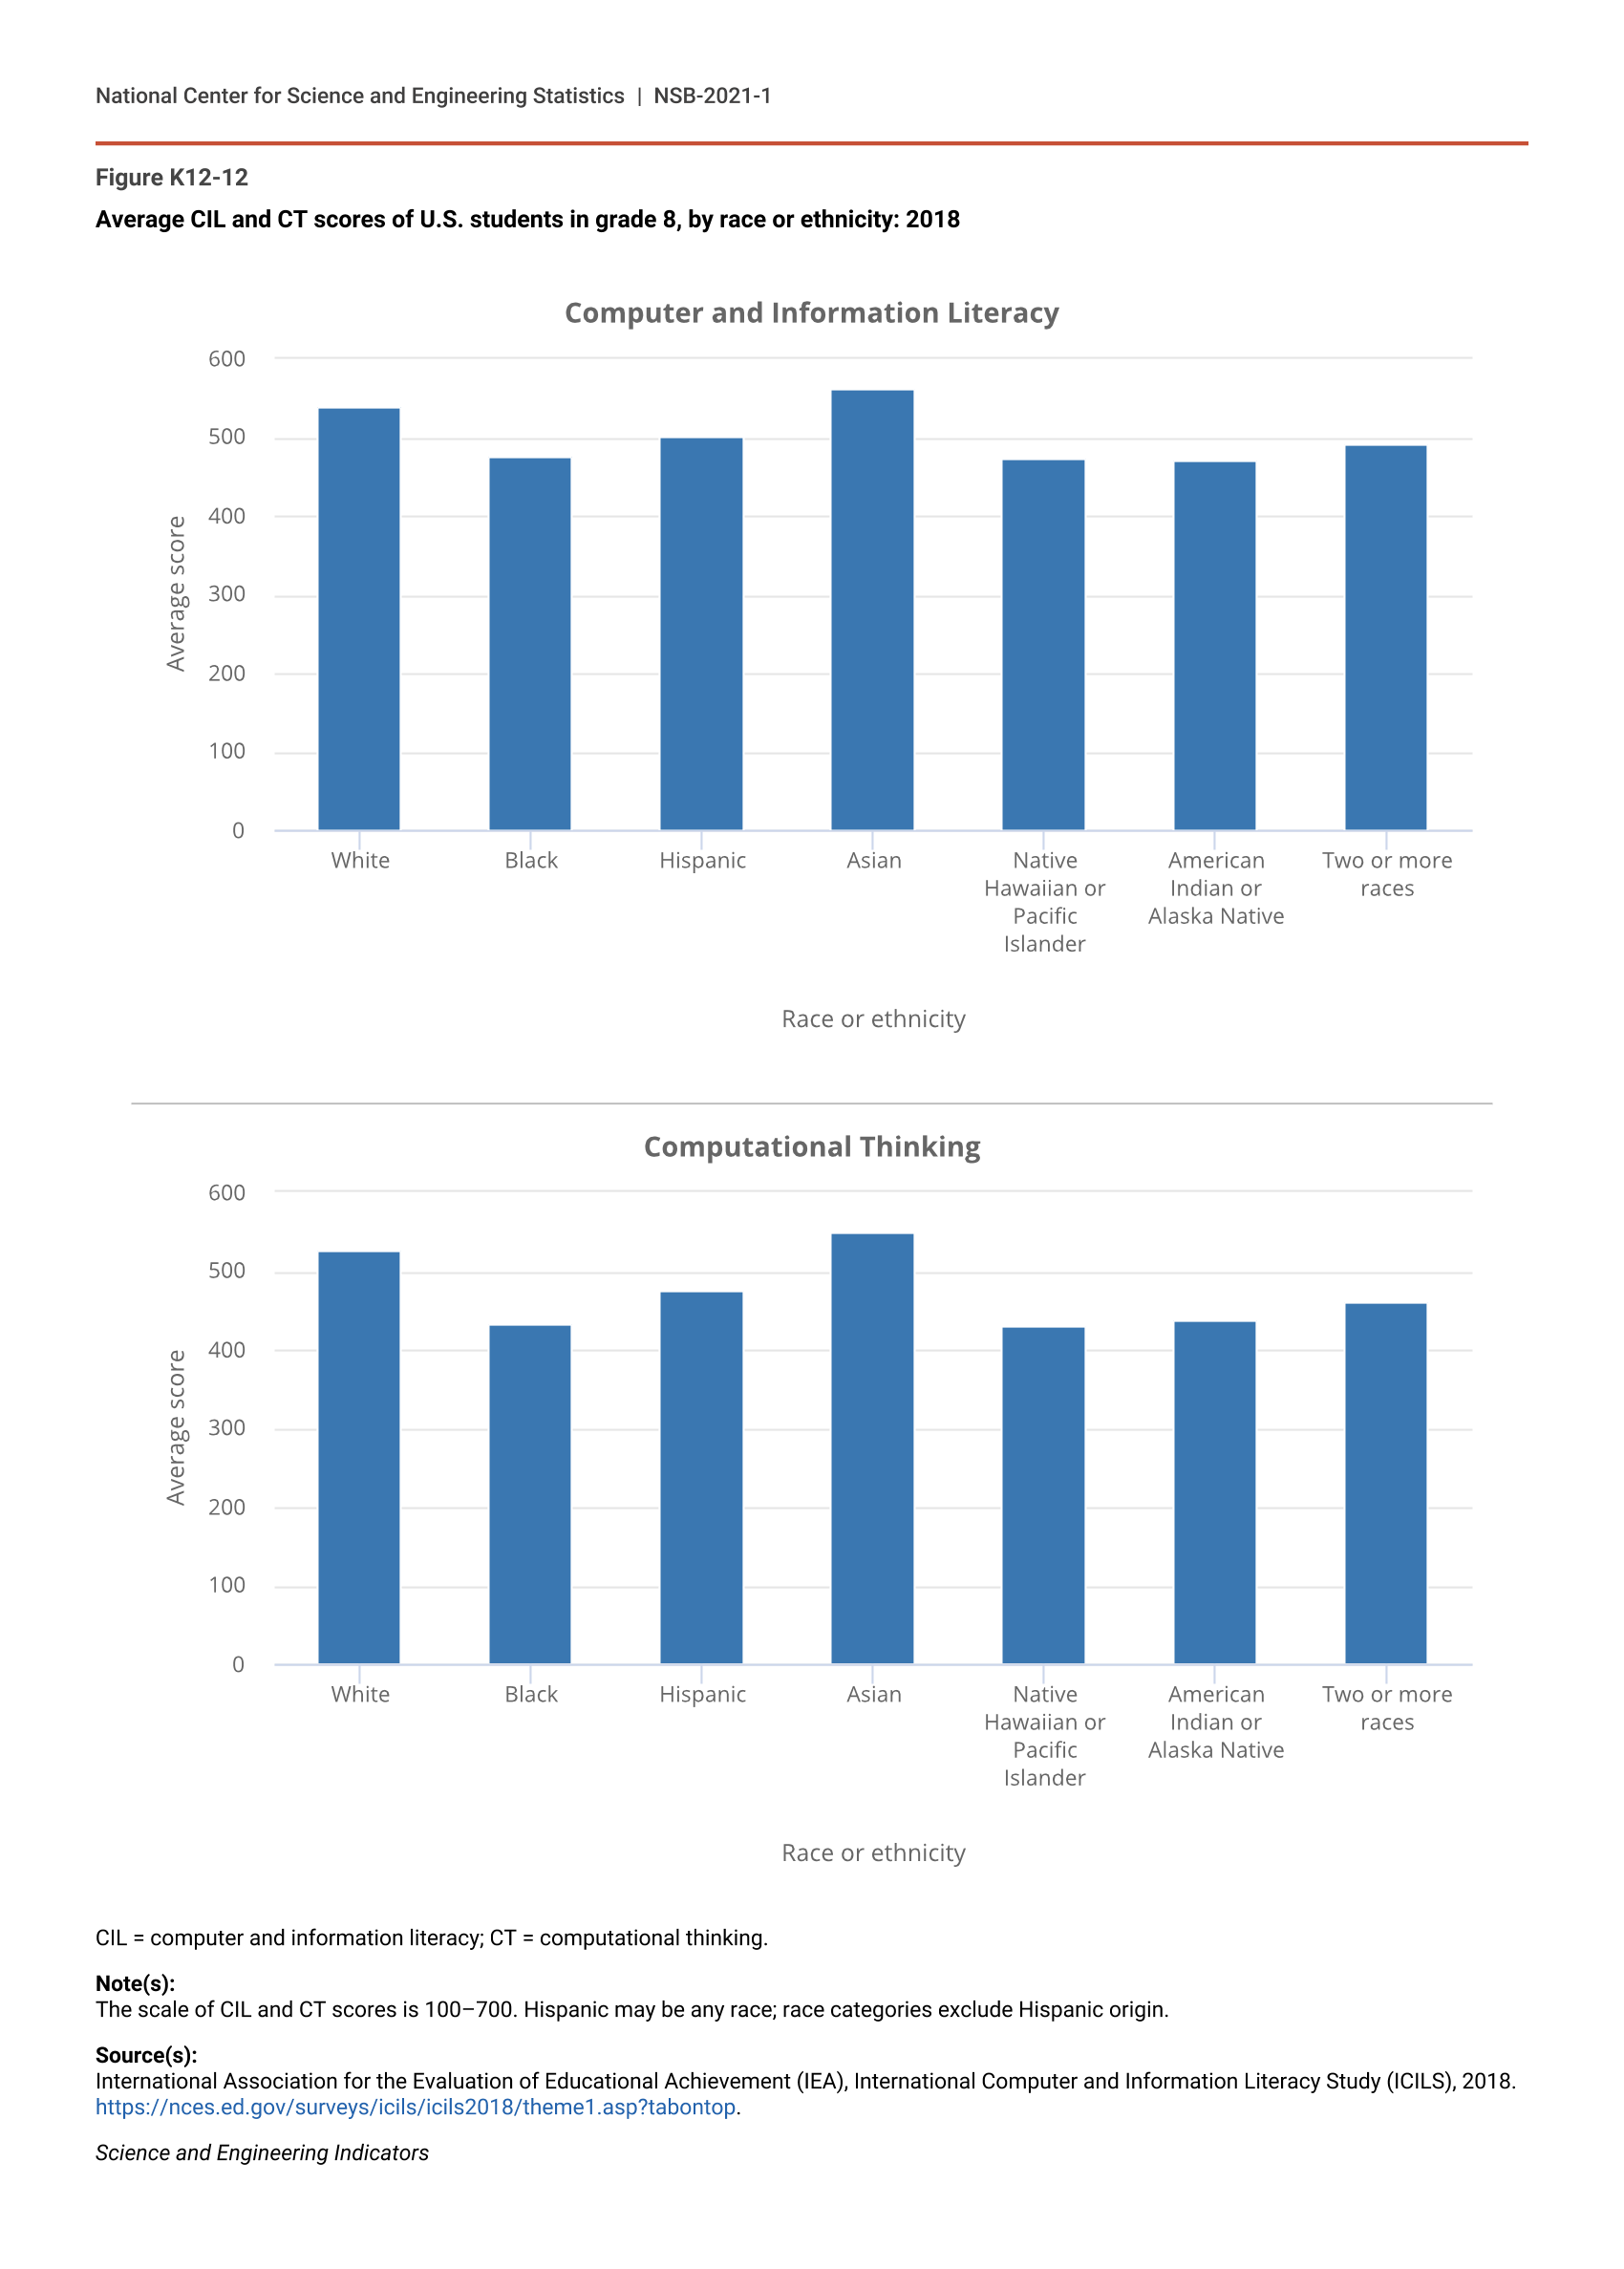
As with NAEP scores, ICILS scores by race or ethnicity indicate that U.S. Black, Hispanic, Native Hawaiian or Pacific Islander, and American Indian or Alaska Native students posted scores that lag behind those of their White and Asian counterparts in both computer and information literacy and computational thinking (Figure K12-12). Researchers suggest that contributors to these persistent differences include inequitable access to high-quality computer science instruction and to computer or wireless technology, lack of a culturally relevant curriculum, and societal narratives about who is good at computer science (IEA 2020; Margolis et al. 2017; Vakil 2018). ICILS scores ranged from 563 for Asian students to 470 for American Indian or Alaska Native students.
Average CIL and CT scores of U.S. students in grade 8, by race or ethnicity: 2018
| Race or ethnicity | Average CIL score |
|---|---|
| White | 540 |
| Black | 475 |
| Hispanic | 502 |
| Asian | 563 |
| Native Hawaiian or Pacific Islander | 473 |
| American Indian or Alaska Native | 470 |
| Two or more races | 491 |
| Race or ethnicity | Average CT score |
|---|---|
| White | 526 |
| Black | 432 |
| Hispanic | 476 |
| Asian | 549 |
| Native Hawaiian or Pacific Islander | 431 |
| American Indian or Alaska Native | 437 |
| Two or more races | 460 |
CIL = computer and information literacy; CT = computational thinking.
Note(s):
The scale of CIL and CT scores is 100–700. Hispanic may be any race; race categories exclude Hispanic origin.
Source(s):
International Association for the Evaluation of Educational Achievement (IEA), International Computer and Information Literacy Study (ICILS), 2018. https://nces.ed.gov/surveys/icils/icils2018/theme1.asp?tabontop.
Science and Engineering Indicators