 An official website of the United States government
 Online Education in STEM and Impact of COVID-19
The COVID-19 pandemic led to school building closures in March 2020 and an unprecedented, near-total transition to online or alternative learning, affecting approximately 55 million students in 124,000 U.S. public and private schools (Education Week 2020a). In fall 2020, the majority of school districts continued to rely on a distance-learning model for instruction, including some of the nation’s largest school districts, such as Los Angeles Unified School District and Chicago Public Schools (Education Week 2020b). In response to these shifts in instruction, many researchers are endeavoring to understand the impact on students and are finding that there may be long-term effects on student learning (see sidebar Learning Losses and COVID-19).
This sections draws on education data from the Household Pulse Survey, a nationally representative survey conducted by the U.S. Census Bureau in collaboration with five federal agencies to gather data on the effects of COVID-19 on American households. Although they are not specific to STEM classes, these data offer insight into student access to computers and the Internet as well as the amount of time families spent on education during the pandemic, both in spring 2020, immediately after the transition to distance learning for most students, and in fall 2020, when students returned to school either in person or virtually. To provide context for the pandemic-related shift to digital instruction, this section also presents data about teachers’ and students’ use of technology before the pandemic. These data show that the use of technology and online instruction were not widely prevalent before COVID-19 and underscore the challenges of a shift to fully remote and hybrid learning approaches during the pandemic.
Education during COVID-19
Household Pulse Survey data help illustrate how the COVID-19 pandemic affected schools, students, and families, including how schools and districts were able to make some adjustments by fall 2020 to improve access to teachers and digital devices needed for online learning. In the first week of May 2020, adults in households with children enrolled in K–12 schools reported an average of 13 hours per week spent on teaching activities with children, with Asian households reporting the lowest amount of time at about 10 hours per week. On average, students spent about 4 hours per week in live virtual contact with their teachers, but this fell to about 3 hours for households in which the respondent had less than a high school education (Table K12-7).
Average number of hours in the past week spent on home-based education in households with children enrolled in K−12 school, by selected adult characteristics: 7−12 May 2020
a Hispanic may be any race; race categories exclude Hispanic origin.
Note(s):
The table includes adults 18 years and older in households with children enrolled in K−12 school.
Source(s):
National Center for Science and Engineering Statistics, special tabulations (2020) of the 2020 U.S. Census Bureau Household Pulse Survey.
Science and Engineering Indicators
In September 2020, respondents reported how much time their child spent on learning activities in the last week compared with a regular school day prior to the pandemic (Table K12-8). About half reported “as much,” “a little bit more,” or “much more” time spent, while one-fourth reported “a little bit less” time spent. More than one-fourth of respondents reported that their child spent “much less” time on learning activities compared with pre-COVID-19 instruction.
Adults who reported time that their children spent on all learning activities in the past week relative to a school day before the COVID-19 pandemic, by selected adult characteristics: 16−28 September 2020
a Hispanic may be any race; race categories exclude Hispanic origin.
Note(s):
The table includes adults 18 years and older in households with children enrolled in K−12 school. Adults in households with only homeschooled children are not included. Percentages may not add to 100% because of rounding.
Source(s):
National Center for Science and Engineering Statistics, special tabulations (2020) of the 2020 U.S. Census Bureau Household Pulse Survey.
Science and Engineering Indicators
A majority of respondents (85%) reported that their children had at least 2 days a week of live contact with their teachers, either in person or by phone or video (Table K12-9). More than two-thirds of respondents reported that their children had 4 days or more of contact with their teacher in the last week. However, 11% of respondents reported that their child had no contact with their teacher in the last week. In addition, live contact with teachers varied by students’ household income and parental education. About 16% of households with the lowest income levels (below $25,000), as well as 20% of households in which the respondent had less than a high school education, reported no teacher contact. This compared with 6% of households at the highest income level ($200,000 and above) and 7% of households in which the respondent reported a bachelor’s degree or higher.
Adults who reported frequency of live contact of children with their teachers in person, by phone, or by video in the past week, by selected adult characteristics: 16−28 September 2020
a Hispanic may be any race; race categories exclude Hispanic origin.
Note(s):
The table includes adults 18 years and older in households with children enrolled in K−12 school. Adults in households with only homeschooled children are not included. Percentages may not add to 100% because of rounding.
Source(s):
National Center for Science and Engineering Statistics, special tabulations (2020) of the 2020 U.S. Census Bureau Household Pulse Survey.
Science and Engineering Indicators
Although the proportion of respondents indicating that their child’s classes were delivered fully online declined from 73% in May 2020 to 66% in September 2020 (Table SK12-30), in the majority of households with K–12 students, the students continued to receive fully online instruction in fall 2020, which underscores the importance of understanding students’ access to computers and the Internet. The percentage of respondents reporting that a computer or other digital device and the Internet were always available for children to use at home for educational purposes increased from about 70% in May 2020 to about 77% in September 2020, although these proportions varied by household characteristics (Table K12-10). For example, 44% of households at the lowest education level of less than high school reported in May 2020 that a computer was always available for educational purposes compared with 62% in September 2020. However, this was still lower than the 85% of households with a bachelor’s degree or higher who reported the same in September 2020.
Adults who reported that a computer or other digital device and the Internet were always available for children to use at home for educational purposes, by selected adult characteristics: 7−12 May 2020 and 16−28 September 2020
Note(s):
Adults in households with only homeschooled children are not included. Percentages may not add to 100% because of rounding.
Source(s):
National Center for Science and Engineering Statistics, special tabulations (2020) of the 2020 U.S. Census Bureau Household Pulse Survey.
Science and Engineering Indicators
Schools and districts made progress in providing computers to students to use for educational purposes between May 2020 and the beginning of the new school year in fall 2020. About 40% of respondents reported that the child’s school or district provided a computer for educational use in May 2020. That figure rose to 61% in September 2020 (Table SK12-32). The percentage of respondents reporting that the school or school district paid for Internet services changed slightly from 2% to 4% between May 2020 and September 2020, and nearly all respondents (97%) reported paying for these services themselves in both months.
Student and Teacher Use of Technology Prior to COVID-19
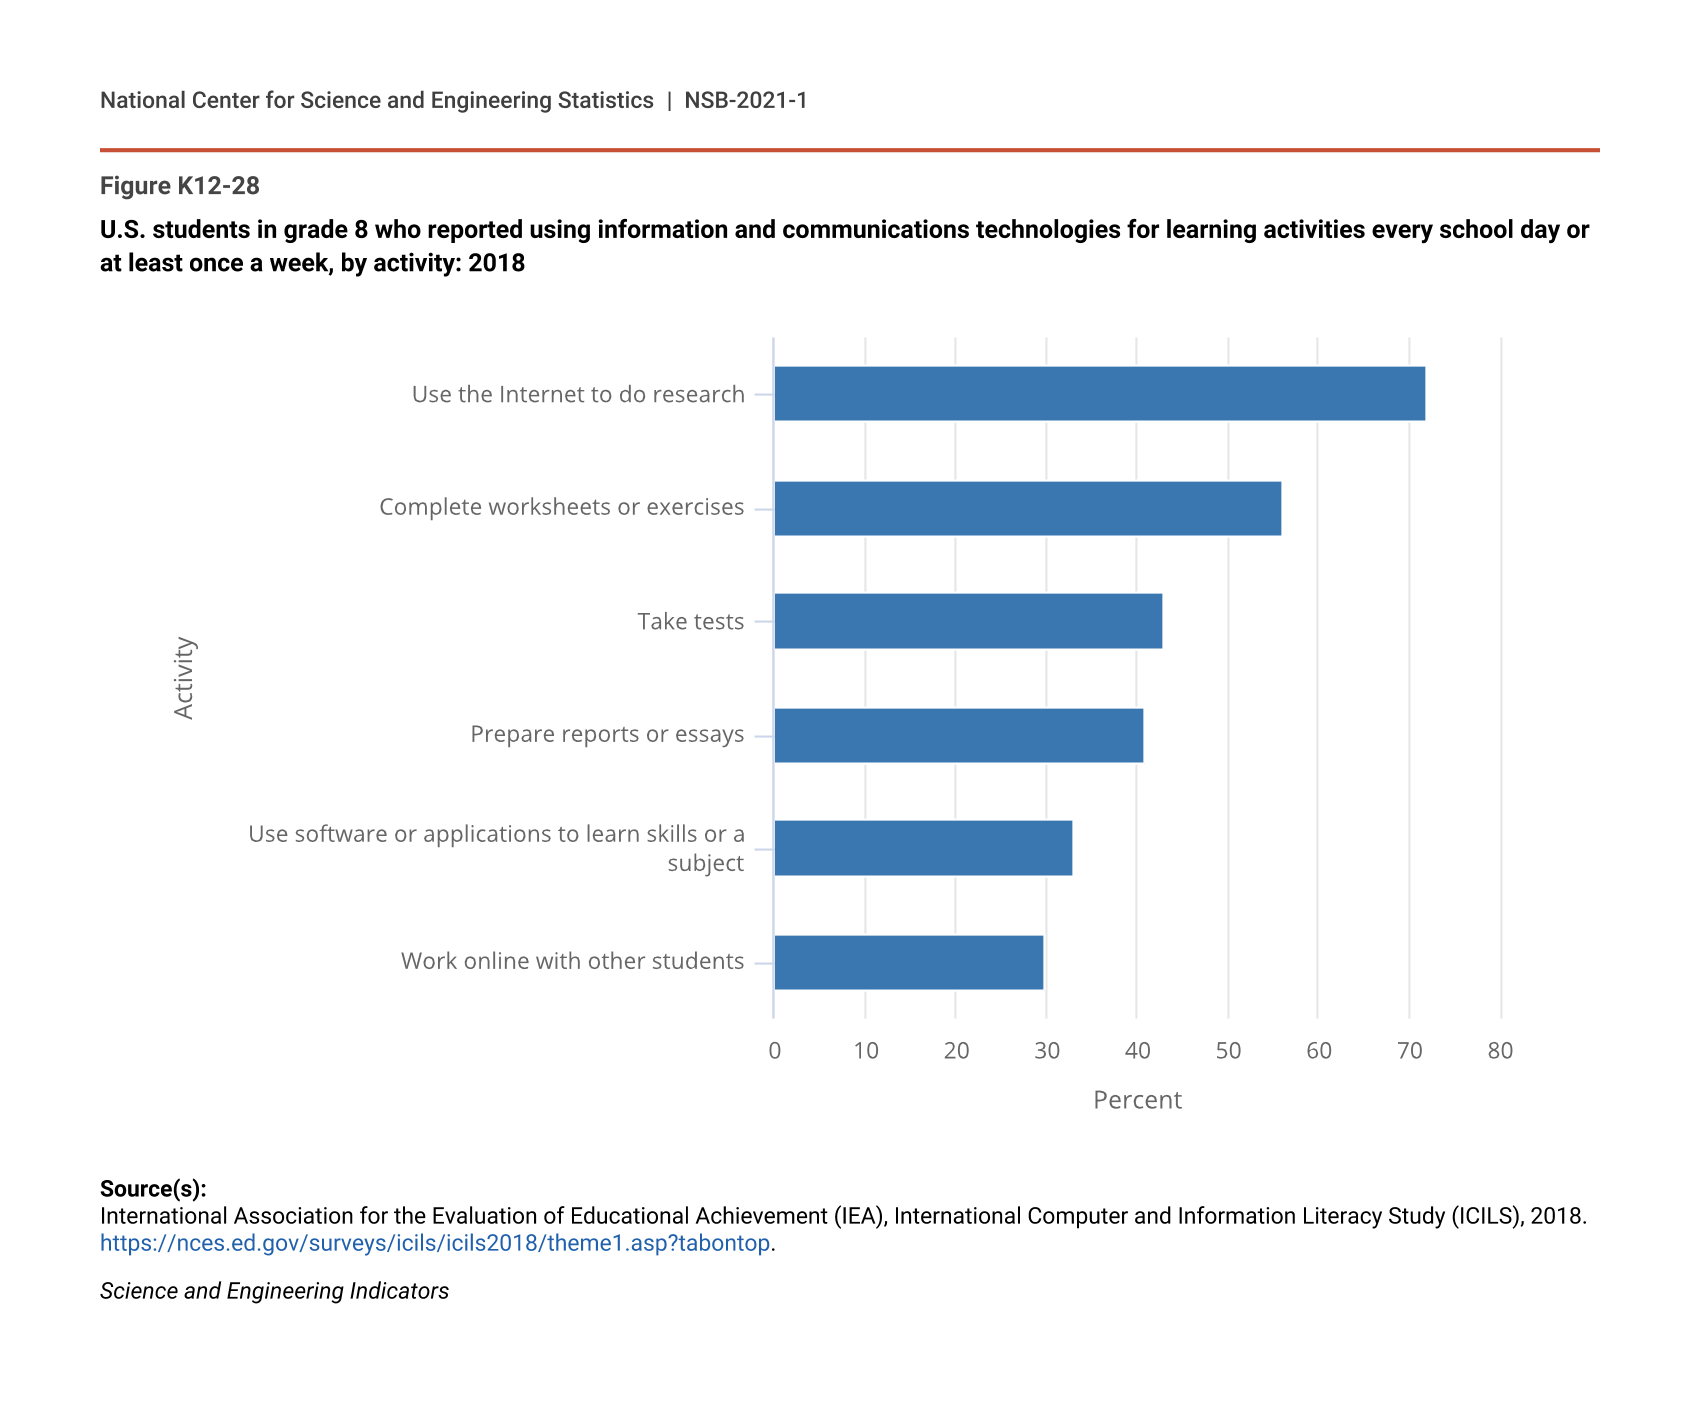
Pre-COVID-19 data on eighth-grade students’ use of the Internet and computers to complete various learning activities indicate that there may have been a significant learning curve involved in the shift to remote instruction, when most schoolwork needed to be completed online. The 2018 ICILS offers insight into how students used information and computer technology for a variety of learning activities before COVID-19 (Figure K12-28). Almost three-fourths of students reported using the Internet to do research at least once a week. It was less common for students to use computers for other activities, such as completing worksheets or exercises (56%), taking tests (43%), using software to learn skills or subjects (33%), and working online with other students (30%).
U.S. students in grade 8 who reported using information and communications technologies for learning activities every school day or at least once a week, by activity: 2018
| Activity | Percentage |
|---|---|
| Use the Internet to do research | 72 |
| Complete worksheets or exercises | 56 |
| Take tests | 43 |
| Prepare reports or essays | 41 |
| Use software or applications to learn skills or a subject | 33 |
| Work online with other students | 30 |
Source(s):
International Association for the Evaluation of Educational Achievement (IEA), International Computer and Information Literacy Study (ICILS), 2018. https://nces.ed.gov/surveys/icils/icils2018/theme1.asp?tabontop.
Science and Engineering Indicators
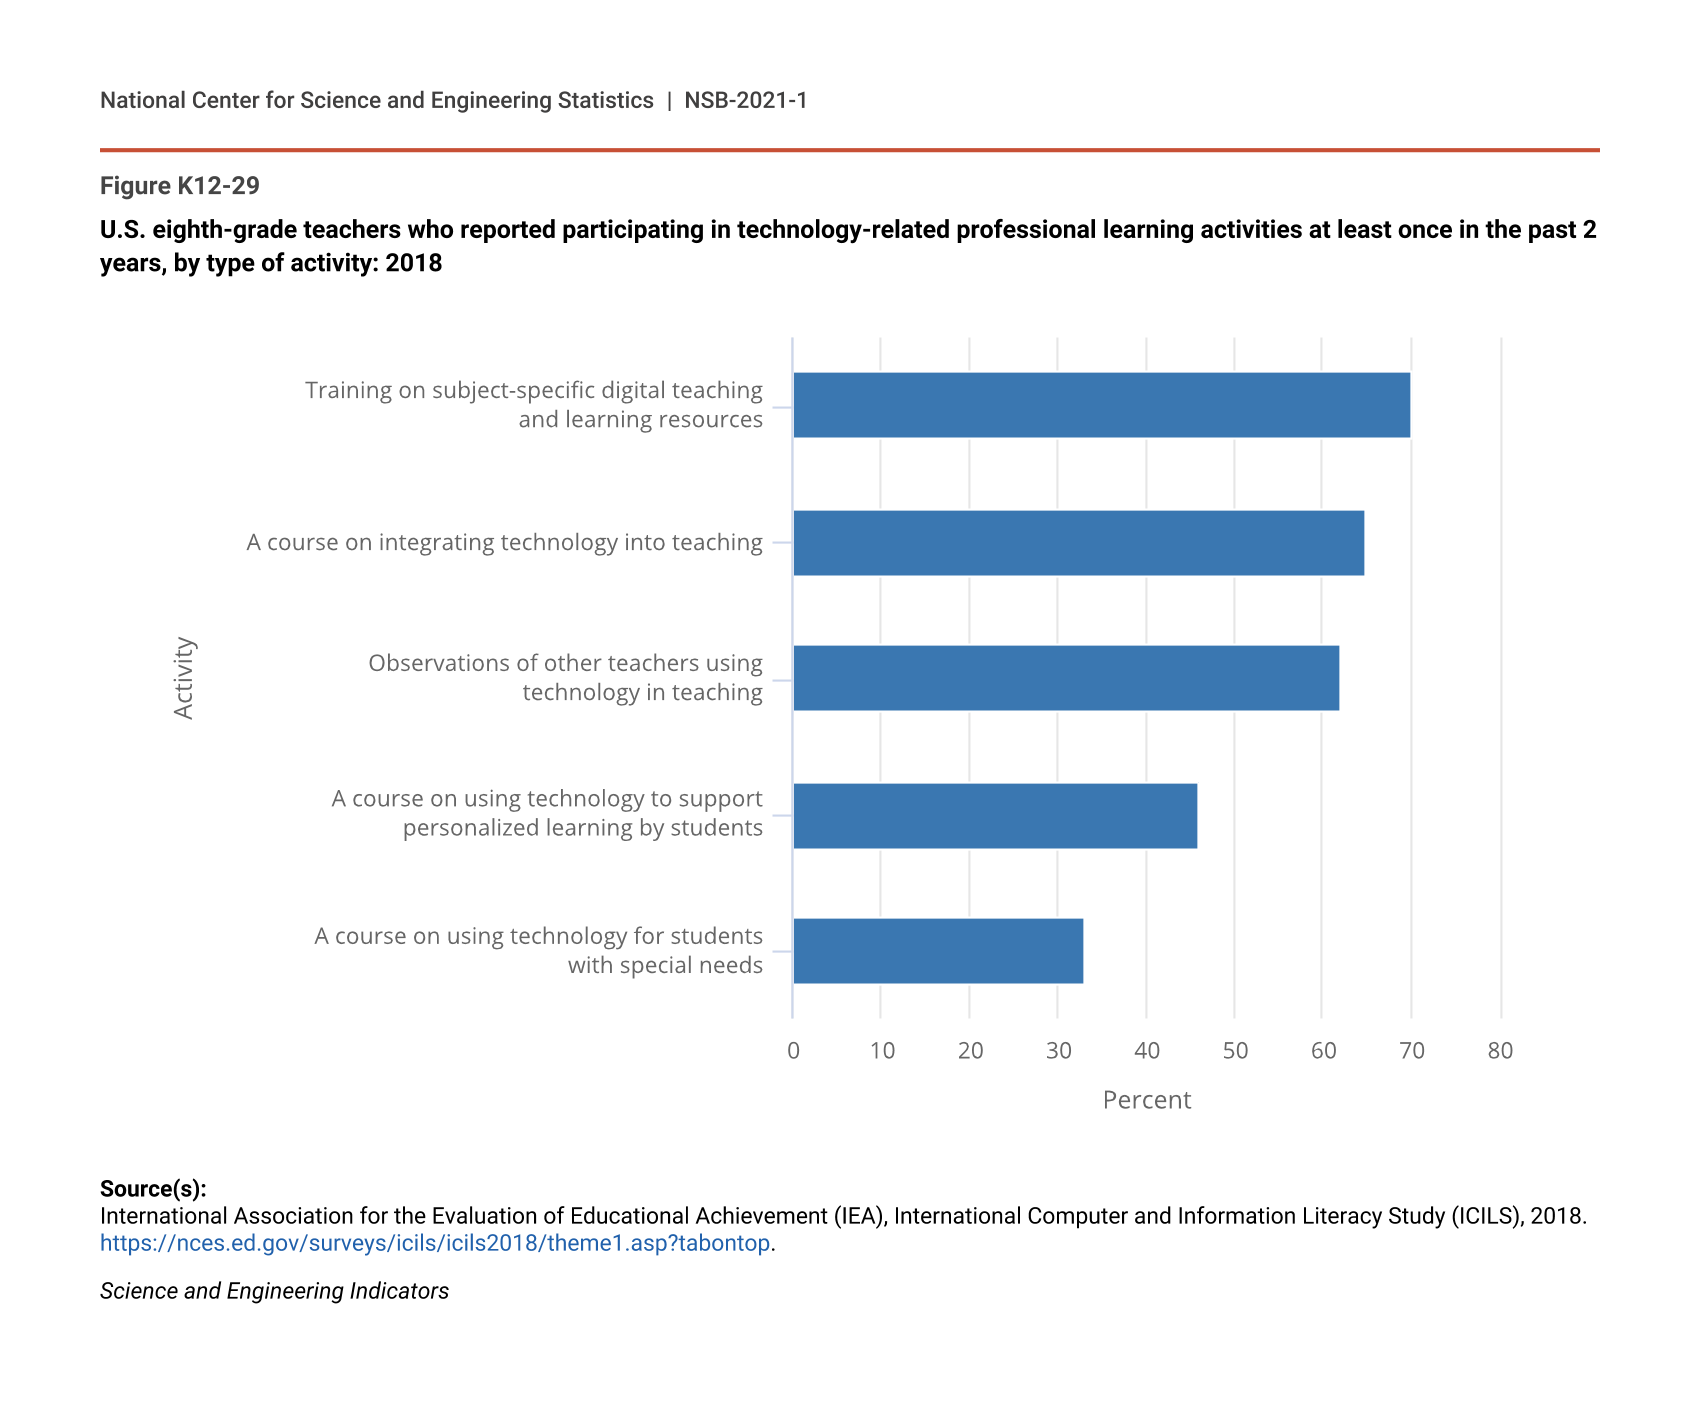
ICILS also offers insight into the extent to which U.S. eighth-grade teachers participated in professional development in using information and communications technologies (ICT) for various teaching tasks before the pandemic (Figure K12-29). These numbers suggest that eighth-grade teachers had some familiarity with using technology for instruction before the pandemic, although likely not at the levels needed to be fully online or responsive to the individual needs of students. About two-thirds of teachers reported participating in training on subject-specific digital resources or taking a course on integrating ICT into teaching and learning between 2016 and 2018. Less than half of teachers reported taking a course on how to use ICT to support personalized learning by students, and only a third reported taking a course on using ICT for students with special needs. About 60% of teachers reported that they had sufficient time to develop lessons incorporating technology and to develop expertise in the use of technology for teaching during the 2017–18 school year (Table SK12-35).
U.S. eighth-grade teachers who reported participating in technology-related professional learning activities at least once in the past 2 years, by type of activity: 2018
| Activity | Percent |
|---|---|
| Training on subject-specific digital teaching and learning resources | 70 |
| A course on integrating technology into teaching | 65 |
| Observations of other teachers using technology in teaching | 62 |
| A course on using technology to support personalized learning by students | 46 |
| A course on using technology for students with special needs | 33 |
Source(s):
International Association for the Evaluation of Educational Achievement (IEA), International Computer and Information Literacy Study (ICILS), 2018. https://nces.ed.gov/surveys/icils/icils2018/theme1.asp?tabontop.
Science and Engineering Indicators