 An official website of the United States government
 Global Trade in Knowledge- and Technology-Intensive Output
Exports are an indicator of a country’s competitiveness in the world market. The goods and services produced or used in production by KTI industries are produced within global value chains (GVCs) with inputs from many countries. A significant volume of trade is in intermediate inputs—the goods and services used in the production process to produce other goods and services—that are exported to other countries for further production (Miroudot, Lanz, and Ragoussis 2009); since 2002, trade in intermediate inputs has tripled (Lund et al. 2020).
GVCs are global production arrangements comprising R&D, design, production, logistics, marketing, and related activities that take place across regions to bring a product or service from conception to its final form (OECD 2012). Proximity to markets and raw materials, transportation costs, labor costs, access to skilled workers, government regulations, and technological capabilities are among factors that influence the location of production activities (Donofrio and Whitefoot 2015). GVCs benefit both participating firms and countries through efficiency gains from specialization and economies of scale and lower prices (Andrews, Gal, and Witheridge 2018). These arrangements create opportunities for countries to partake in global production by specializing in segments of production in which they have a comparative advantage.
Gross trade flows provide useful insights on volume of trade and trading patterns across countries. However, these flows do not provide information to gauge the value contributed by any country in the production chain (Koopman, Wang, and Wei 2014). Value-added trade is the featured measure of trade in this section. It measures the countries’ contributions in the production chain separately from the total value of the traded products, thus providing useful insights into the production and trade relations between countries.
This section presents new analysis on globalization of U.S. KTI industries, focusing on their use of foreign intermediate inputs. This analysis is especially relevant in light of the COVID-19 pandemic, which has revived discussions of efficiency, stability, risk and resilience in GVCs (e.g., OECD 2020, Arriola et al. 2020, Lund et al. 2020).
The source for the trade data is the OECD Trade in Value Added (TiVA) database. A description of this database is provided in the Technical Appendix. Since the latest year of data in this database is 2018, to supplement this analysis, this section also presents experimental TiVA statistics based on a single-country framework that are under development through a new partnership between the National Center for Science and Engineering Statistics (NCSES) and BEA. (See sidebar U.S. Trade in Value Added: A Single-Country Perspective.)
Gross Flows of Trade in KTI Output
Comparative country data on gross exports by KTI industries are available for most, but not all, KTI manufacturing industries and the IT and other information services industry. There are no data available on exports by the medical and dental instruments industry. Because the OECD trade data are insufficiently detailed for the other KTI services industries (software publishing and scientific research and development), the analysis on KTI services trade is supplemented with U.S. data from BEA’s International Economic Accounts.
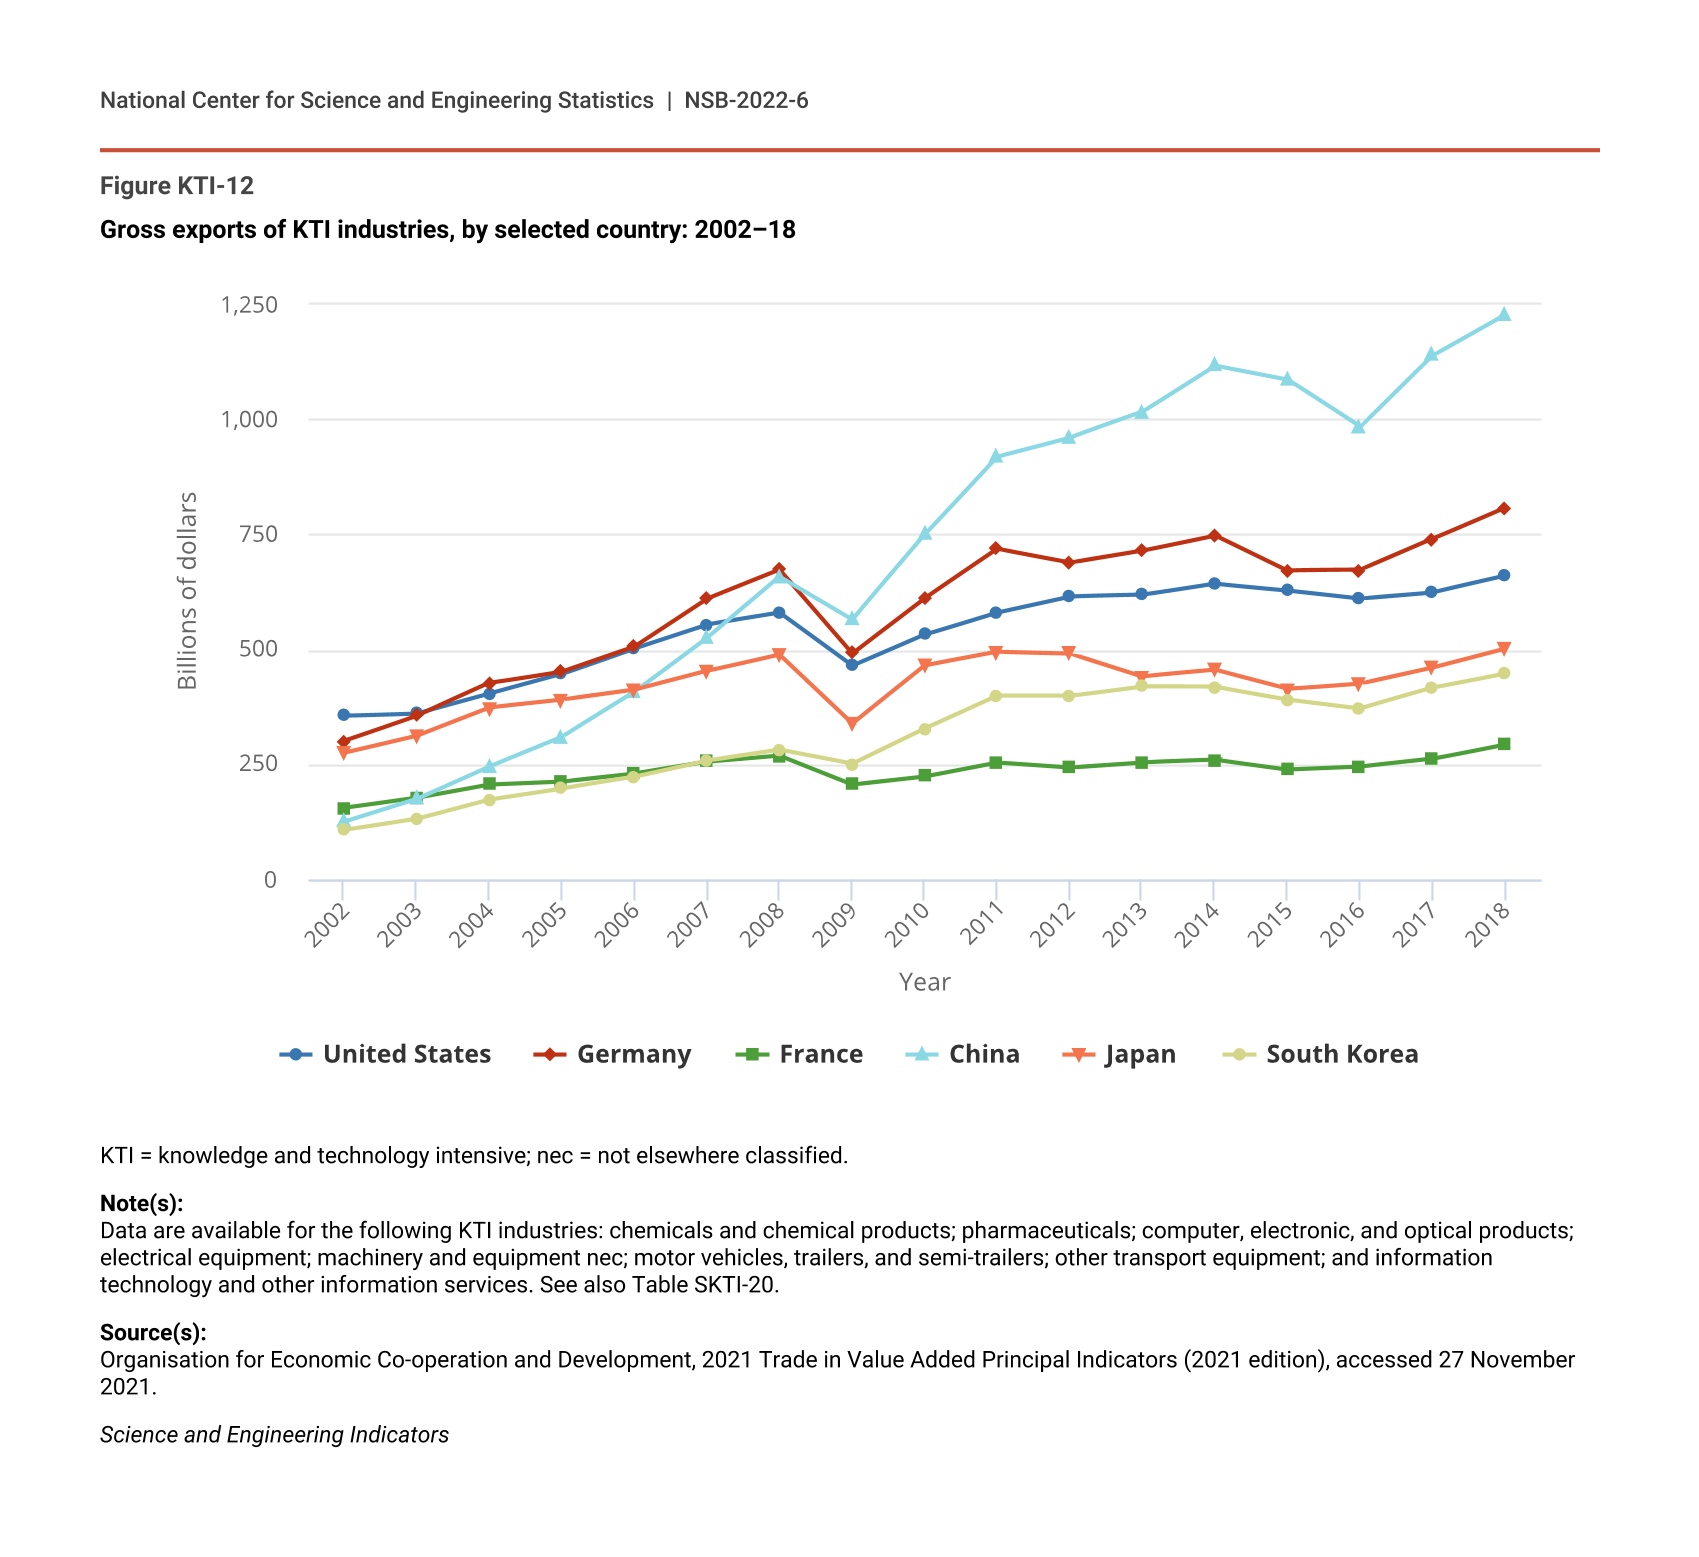
Global exports of KTI industries were over $7.4 trillion in 2018 (Figure KTI-12; Table SKTI-20). China is the largest exporter of KTI products with a 17% share of global exports, followed by Germany (11%). The United States (9%) is the third-largest exporter, followed by Japan (7%) and South Korea (6%). These top 5 exporters of KTI products accounted for almost half of all KTI exports in 2018. Other countries with sizable export shares are France, Mexico, Taiwan, Italy, Ireland, India, the United Kingdom, Switzerland, the Netherlands, Singapore, Spain, Canada, and Thailand (each with a 2%–4% global share in 2018).
Gross exports of KTI industries, by selected country: 2002–18
| Year | United States | Germany | France | China | Japan | South Korea |
|---|---|---|---|---|---|---|
| 2002 | 356.1 | 301.0 | 155.6014 | 125.1 | 275.6 | 107.2 |
| 2003 | 361.2 | 355.9 | 178.1 | 175.0 | 312.8 | 132.1 |
| 2004 | 403.9 | 427.0 | 206.8 | 245.5 | 373.6 | 174.0 |
| 2005 | 446.7 | 452.4 | 213.3 | 309.7 | 390.1 | 197.6 |
| 2006 | 502.7 | 506.5 | 230.6 | 407.4 | 411.6 | 222.4 |
| 2007 | 554.3 | 610.4 | 255.9 | 525.0 | 452.8 | 257.6 |
| 2008 | 579.4 | 673.3 | 269.4 | 658.1 | 488.8 | 281.5 |
| 2009 | 464.3 | 491.5 | 207.0 | 565.3 | 339.4 | 251.2 |
| 2010 | 532.4 | 611.4 | 224.4 | 749.8 | 465.5 | 328.1 |
| 2011 | 580.8 | 718.5 | 254.6 | 920.0 | 495.0 | 399.4 |
| 2012 | 615.3 | 689.2 | 243.5 | 961.3 | 491.5 | 399.2 |
| 2013 | 618.7 | 715.1 | 254.2 | 1,016.6 | 441.4 | 419.9 |
| 2014 | 643.2 | 748.1 | 259.4 | 1,117.2 | 455.2 | 418.9 |
| 2015 | 628.8 | 671.3 | 238.4 | 1,087.0 | 414.3 | 391.4 |
| 2016 | 611.3 | 672.4 | 244.6 | 983.7 | 426.3 | 371.9 |
| 2017 | 624.2 | 740.2 | 261.7 | 1,139.4 | 461.3 | 416.2 |
| 2018 | 659.9 | 808.4 | 293.2 | 1,228.5 | 502.4 | 446.9 |
KTI = knowledge and technology intensive; nec = not elsewhere classified.
Note(s):
Data are available for the following KTI industries: chemicals and chemical products; pharmaceuticals; computer, electronic, and optical products; electrical equipment; machinery and equipment nec; motor vehicles, trailers, and semi-trailers; other transport equipment; and information technology and other information services. See also Table SKTI-20.
Source(s):
Organisation for Economic Co-operation and Development, 2021 Trade in Value Added Principal Indicators (2021 edition), accessed 27 November 2021.
Science and Engineering Indicators
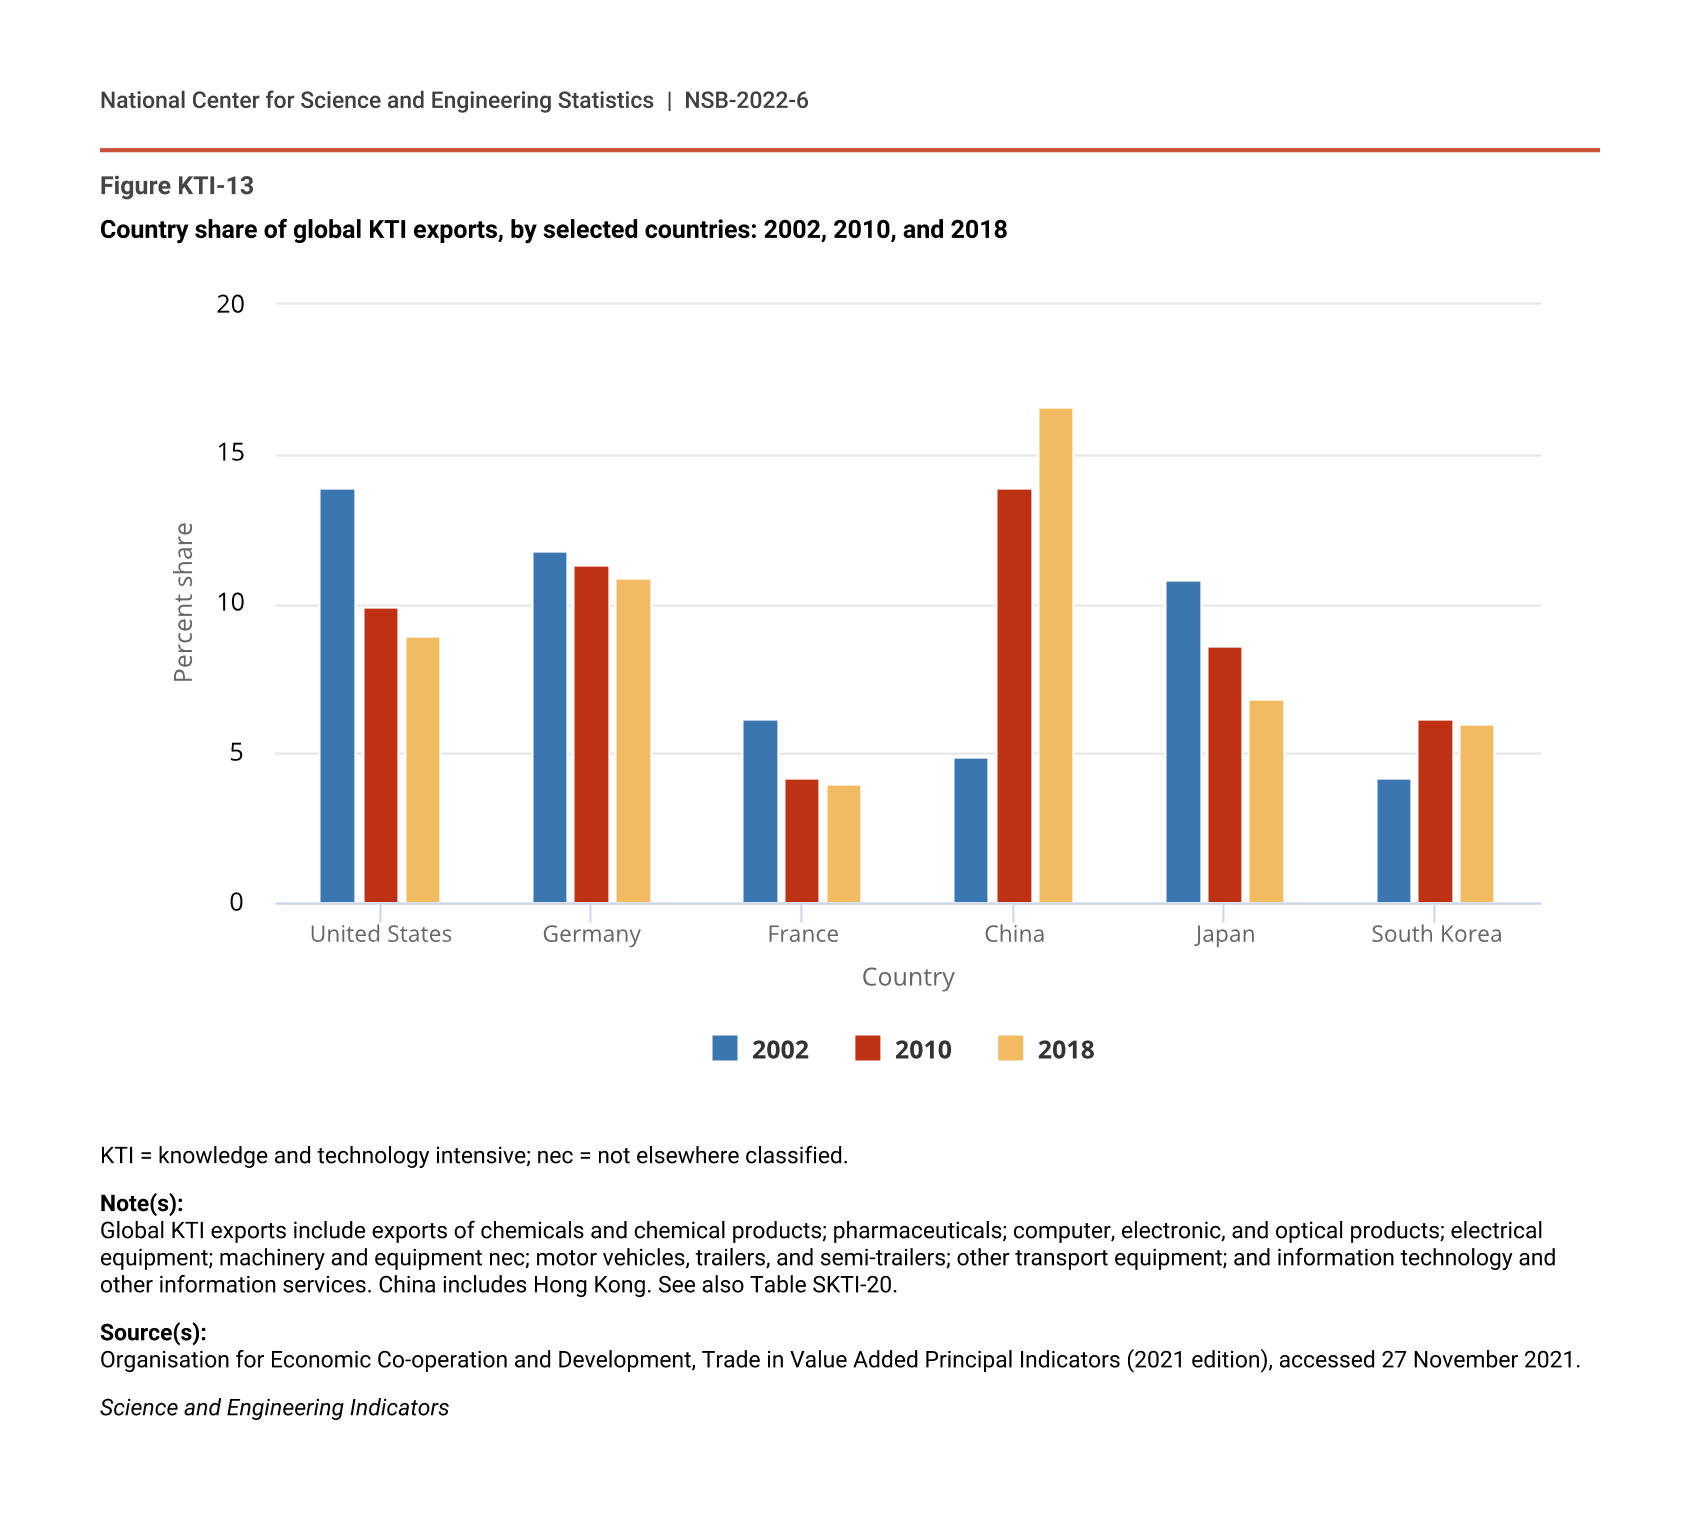
World exports of KTI products have increased nearly threefold since 2002 (Table SKTI-20). China has accounted for most of this increase. China’s KTI exports increased nearly 10-fold, and its global share rose from 5% in 2002 to 17% in 2018 (Figure KTI-13). KTI exports from other Asian countries— including South Korea, Thailand, Vietnam and India—have also increased rapidly during this period. The slower growth in exports by other major exporters compared to these Asian countries has resulted in declines in their global export shares, most notably for the United States (from 14% in 2002 to 9% in 2018).
Country share of global KTI exports, by selected countries: 2002, 2010, and 2018
| Country | 2002 | 2010 | 2018 |
|---|---|---|---|
| United States | 13.9 | 9.9 | 8.9 |
| Germany | 11.8 | 11.3 | 10.9 |
| France | 6.1 | 4.2 | 4.0 |
| China | 4.9 | 13.9 | 16.6 |
| Japan | 10.8 | 8.6 | 6.8 |
| South Korea | 4.2 | 6.1 | 6.0 |
KTI = knowledge and technology intensive; nec = not elsewhere classified.
Note(s):
Global KTI exports include exports of chemicals and chemical products; pharmaceuticals; computer, electronic, and optical products; electrical equipment; machinery and equipment nec; motor vehicles, trailers, and semi-trailers; other transport equipment; and information technology and other information services. China includes Hong Kong. See also Table SKTI-20.
Source(s):
Organisation for Economic Co-operation and Development, Trade in Value Added Principal Indicators (2021 edition), accessed 27 November 2021.
Science and Engineering Indicators
China is the hub of “Factory Asia”—the electronics goods production network centered in East Asia—and plays a central role in this network as the major location of final assembly and as the largest importer and exporter of electronic components (WTO/IDE-JETRO 2011). China imports and exports inputs and components from other Asian economies—notably, Japan, South Korea, Singapore, and Taiwan (Frederick and Lee 2017). China has a global manufacturing scale, a network of suppliers, a large labor force of skilled production workers, and the ability to quickly ramp up production required for many electronic products that have short development cycles (Donofrio and Whitefoot 2015). China has also become a center for manufacturing and assembly of many other KTI products, including electrical equipment, other machinery and equipment, and motor vehicles.
KTI manufacturing exports comprise a large share of manufacturing exports (more than 50%) for all major exporters of KTI products (Figure KTI-14). This share is lowest for China (57% in 2018) and largest for Japan (78%). Exports by KTI manufacturing industries comprised 63% of all U.S. manufacturing exports in 2018. The KTI share of manufacturing exports has declined since the early 2000s for some of the major KTI exporters but has stabilized after 2010.
KTI manufacturing exports as a share of all manufacturing exports, by selected country: 2002–18
| Year | United States | Germany | France | China | Japan | South Korea |
|---|---|---|---|---|---|---|
| 2002 | 70.3 | 70.8 | 67.3 | 45.3 | 85.1 | 71.5 |
| 2003 | 70.1 | 70.1 | 66.8 | 47.7 | 85.0 | 73.4 |
| 2004 | 70.3 | 69.6 | 66.9 | 49.9 | 84.4 | 72.9 |
| 2005 | 69.9 | 68.2 | 65.8 | 50.0 | 82.8 | 72.4 |
| 2006 | 69.3 | 66.9 | 64.8 | 51.1 | 80.4 | 71.4 |
| 2007 | 68.9 | 66.9 | 63.9 | 52.6 | 79.6 | 71.7 |
| 2008 | 65.3 | 68.2 | 62.4 | 55.1 | 77.4 | 68.8 |
| 2009 | 65.3 | 67.7 | 63.1 | 56.7 | 76.0 | 71.1 |
| 2010 | 64.1 | 69.4 | 62.5 | 58.6 | 76.9 | 73.4 |
| 2011 | 61.1 | 68.9 | 61.3 | 57.1 | 76.1 | 70.4 |
| 2012 | 61.7 | 69.0 | 62.1 | 55.6 | 76.9 | 68.8 |
| 2013 | 61.2 | 69.3 | 62.8 | 54.7 | 76.5 | 70.7 |
| 2014 | 62.1 | 70.3 | 62.9 | 55.6 | 76.6 | 70.3 |
| 2015 | 64.5 | 71.5 | 65.3 | 56.0 | 77.6 | 75.8 |
| 2016 | 65.3 | 71.4 | 66.5 | 55.9 | 78.3 | 76.0 |
| 2017 | 63.7 | 71.4 | 66.2 | 57.4 | 78.1 | 75.7 |
| 2018 | 63.0 | 71.5 | 65.3 | 56.9 | 78.1 | 74.6 |
KTI = knowledge and technology intensive; nec = not elsewhere classified.
Note(s):
KTI manufacturing exports include exports of chemicals and chemical products; pharmaceuticals; computer, electronic, and optical products; electrical equipment; machinery and equipment nec; motor vehicles, trailers, and semi-trailers; and other transport equipment. See also Table SKTI-20.
Source(s):
Organisation for Economic Co-operation and Development, Trade in Value Added Principal Indicators (2021 edition), accessed 27 November 2021.
Science and Engineering Indicators
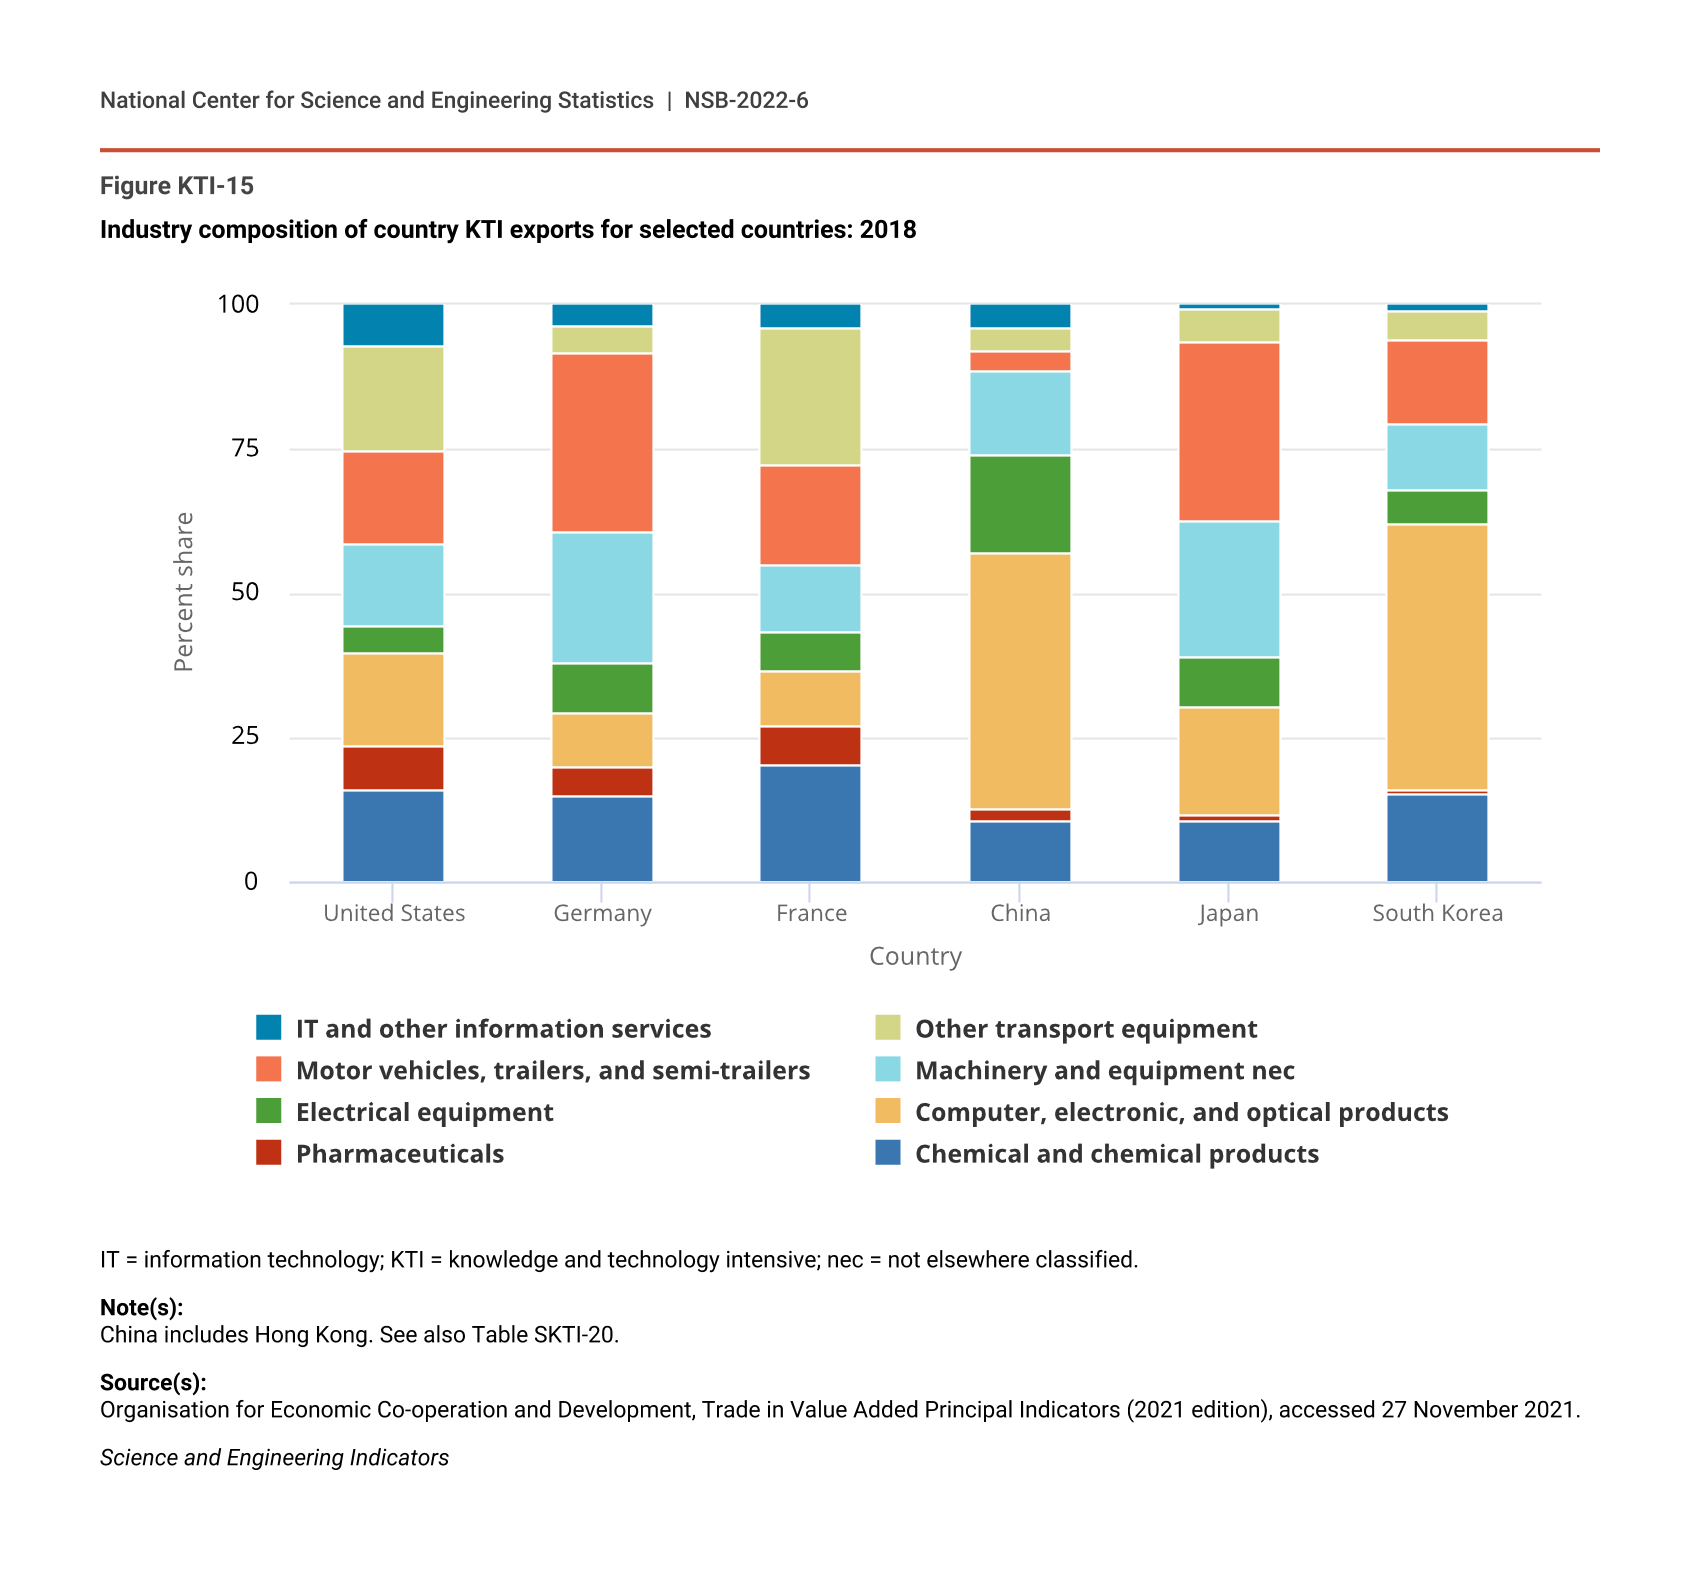
The industry composition of KTI exports varies by country (Figure KTI-15). For China and South Korea, exports by the computer, electronic, and optical products industry dominate their KTI exports (44%–46% share). Exports by the motor vehicles industry account for more than 30% of KTI exports of Germany and Japan. The U.S. KTI exports are spread more uniformly across KTI industries, with each of the following accounting for 14%–18% of U.S. KTI exports: exports of motor vehicles; computer, electronic, and optical products; chemicals and chemical products; other machinery and equipment; and other transport equipment. Pharmaceuticals and IT and other information services each account for more than 7% of U.S. KTI exports.
Industry composition of country KTI exports for selected countries: 2018
| Country | Chemical and chemical products | Pharmaceuticals | Computer, electronic, and optical products | Electrical equipment | Machinery and equipment nec | Motor vehicles, trailers, and semi-trailers | Other transport equipment | IT and other information services |
|---|---|---|---|---|---|---|---|---|
| United States | 15.9 | 7.5 | 16.3 | 4.6 | 14.2 | 16.4 | 17.8 | 7.3 |
| Germany | 14.8 | 5.2 | 9.3 | 8.6 | 22.9 | 31.0 | 4.8 | 3.5 |
| France | 20.1 | 7.0 | 9.4 | 6.9 | 11.5 | 17.5 | 23.7 | 4.0 |
| China | 10.6 | 2.2 | 44.3 | 16.8 | 14.3 | 3.9 | 3.8 | 4.0 |
| Japan | 10.3 | 1.2 | 18.7 | 8.9 | 23.2 | 31.2 | 5.6 | 0.8 |
| South Korea | 15.2 | 0.7 | 46.1 | 5.9 | 11.3 | 14.6 | 5.0 | 1.0 |
IT = information technology; KTI = knowledge and technology intensive; nec = not elsewhere classified.
Note(s):
China includes Hong Kong. See also Table SKTI-20.
Source(s):
Organisation for Economic Co-operation and Development, Trade in Value Added Principal Indicators (2021 edition), accessed 27 November 2021.
Science and Engineering Indicators
The United States is the only country among major KTI exporters with a large and growing deficit in KTI trade (Figure KTI-16). The U.S. trade deficit was $550 billion in 2018, of which $528 billion was in output produced by KTI manufacturing industries and $22 billion by the IT and other information services industry. (The OECD TiVA database reports U.S. exports of IT and other information services industry at $48.3 billion and imports at $70.2 billion.) Moreover, the U.S. trade deficit has widened by almost $300 billion compared to the average deficit of about $250 billion during the 2002–10 period. China had a KTI trade deficit until 2004 but since then has gradually increased its trade surplus. Japan, Germany, and South Korea have substantial KTI trade surpluses, whereas France has a comparatively smaller surplus.
KTI trade balance, by selected country: 2002–18
| Year | United States | Germany | France | China | Japan | South Korea |
|---|---|---|---|---|---|---|
| 2002 | -207.1 | 140.6 | 24.8 | -31.7185 | 176.0 | 58.3 |
| 2003 | -218.2 | 162.0 | 24.4 | -37.7 | 199.4 | 74.1 |
| 2004 | -245.8 | 195.3 | 27.8 | -34.2 | 239.6 | 101.4 |
| 2005 | -271.9 | 206.8 | 21.5 | 6.8 | 263.1 | 113.3 |
| 2006 | -279.7 | 221.6 | 24.7 | 46.2 | 252.7 | 121.0 |
| 2007 | -263.0 | 289.9 | 14.9 | 100.1 | 287.7 | 140.0 |
| 2008 | -234.5 | 324.3 | 17.9 | 155.1 | 303.6 | 144.1 |
| 2009 | -179.5 | 215.9 | 8.5 | 130.6 | 194.3 | 148.9 |
| 2010 | -258.0 | 266.3 | 8.1 | 166.1 | 277.7 | 190.2 |
| 2011 | -301.6 | 327.1 | 0.4 | 195.2 | 268.1 | 224.4 |
| 2012 | -327.0 | 334.7 | 12.0 | 263.4 | 251.1 | 231.0 |
| 2013 | -338.3 | 355.0 | 15.7 | 239.4 | 208.3 | 254.8 |
| 2014 | -380.8 | 368.3 | 12.1 | 265.1 | 196.4 | 251.0 |
| 2015 | -450.7 | 322.9 | 11.3 | 310.8 | 175.3 | 227.2 |
| 2016 | -454.6 | 312.7 | 8.8 | 262.4 | 187.6 | 208.8 |
| 2017 | -507.6 | 339.9 | 2.4 | 296.0 | 208.4 | 223.0 |
| 2018 | -550.2 | 353.0 | 8.5 | 306.6 | 228.4 | 249.9 |
KTI = knowledge and technology intensive; nec = not elsewhere classified.
Note(s):
Data are available for the following KTI industries: chemicals and chemical products; pharmaceuticals; computer, electronic, and optical products; electrical equipment; machinery and equipment nec; motor vehicles, trailers, and semi-trailers; other transport equipment; and information technology and other information services. See also Table SKTI-20.
Source(s):
Organisation for Economic Co-operation and Development, Trade in Value Added Principal Indicators (2021 edition), accessed 27 November 2021.
Science and Engineering Indicators
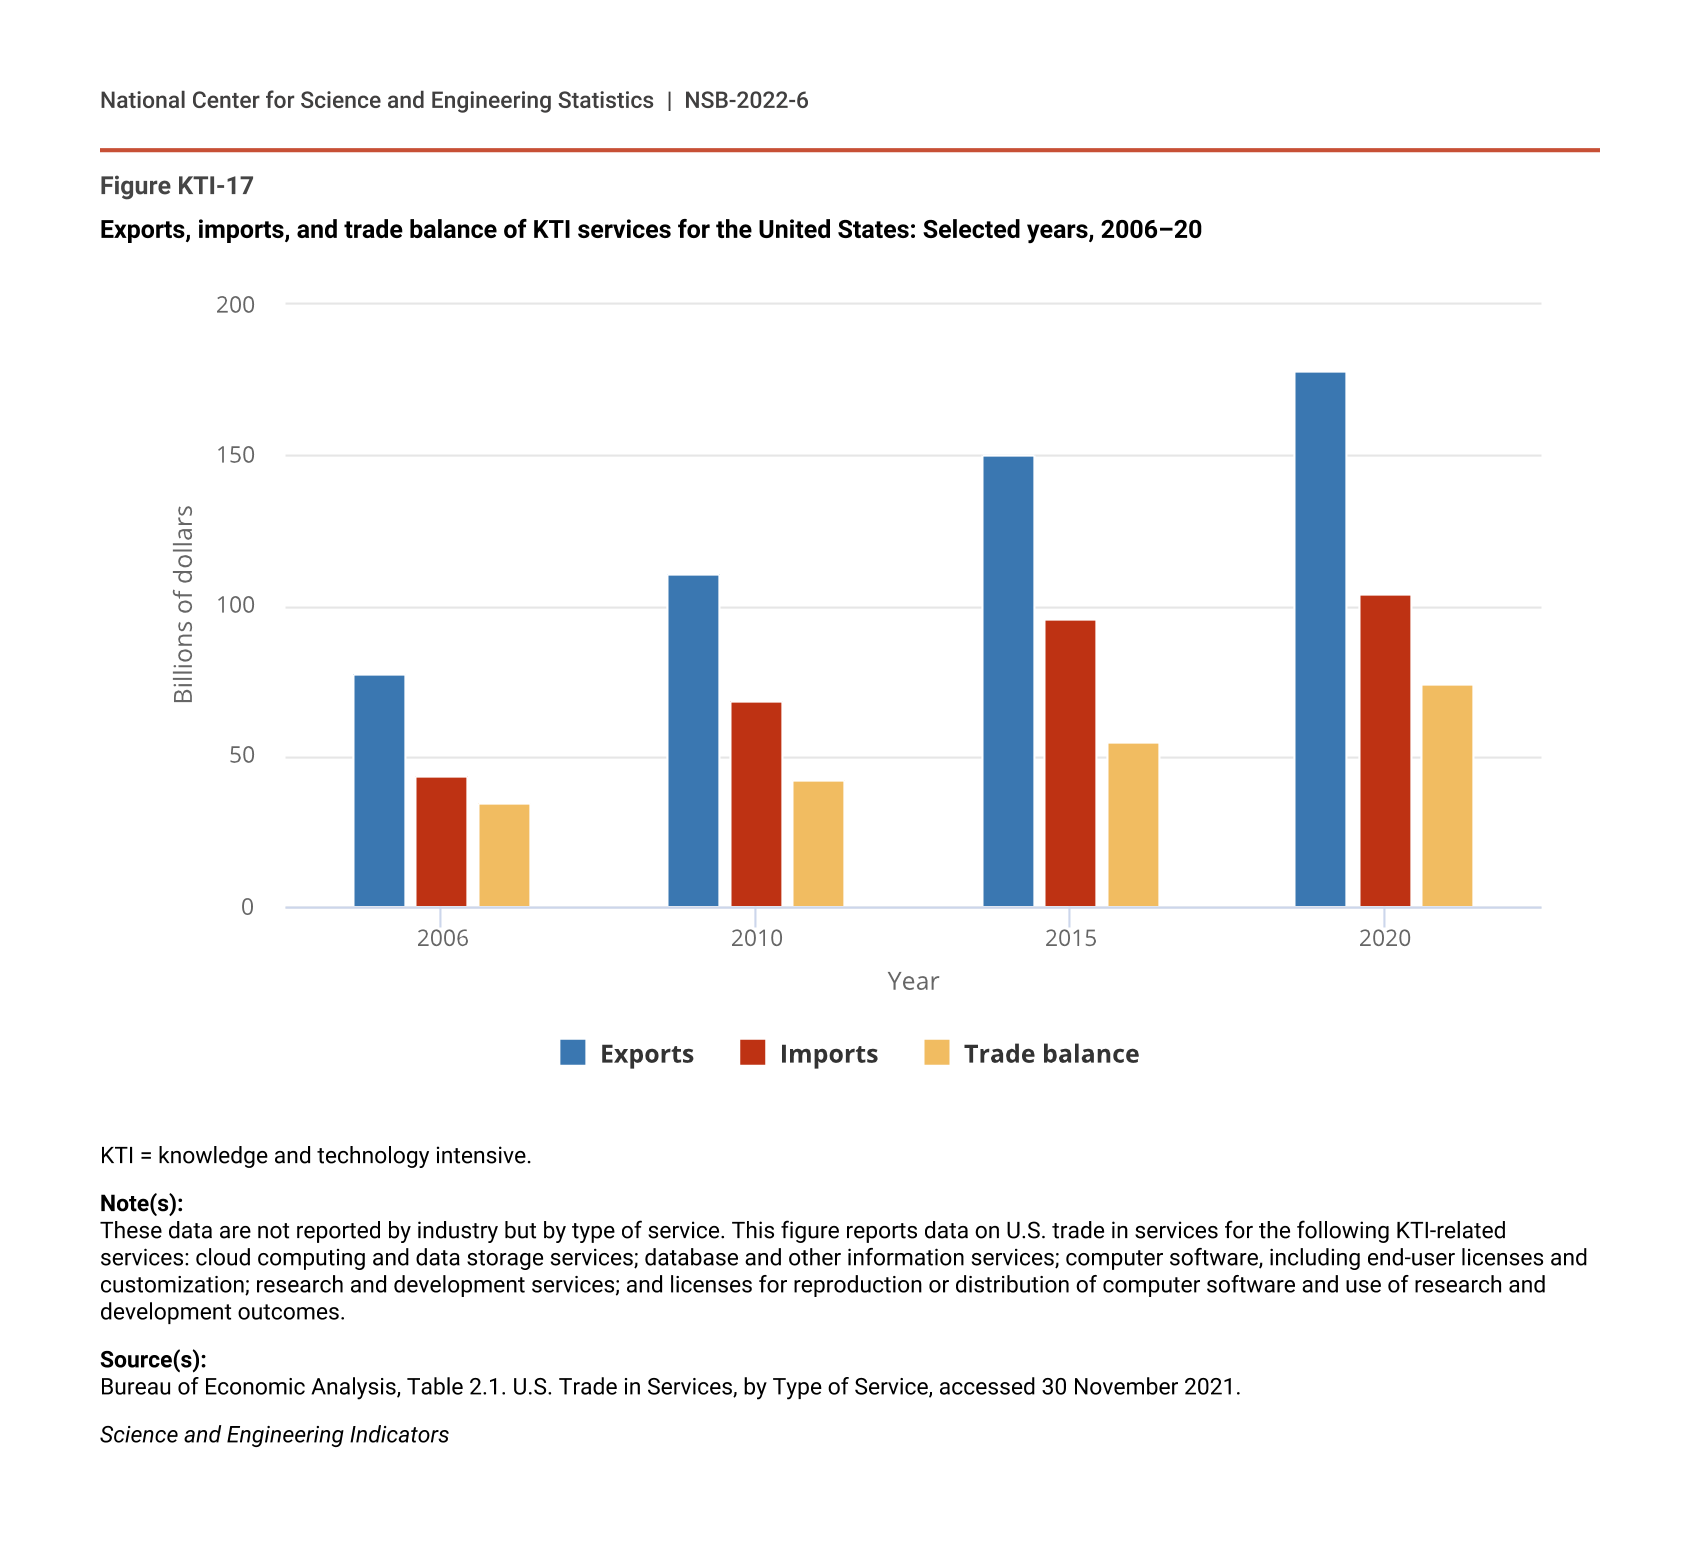
The U.S. trade deficit, while sizable, may be lower when considering trade of other KTI services (software publishing and scientific research and development services). BEA collects and reports data on trade in services by service type. Although not directly comparable with the exports by services industries reported in the OECD TiVA database, these data provide useful insights on trends of KTI services trade. These data show a positive and growing trade balance in cloud computing and data storage services; database and other information services; computer software, including end-user licenses and customization; R&D services; and licenses for reproduction or distribution of computer software and use of R&D outcomes (Figure KTI-17). The trade surplus in these services has doubled since 2006 (first year of available data), from $34 billion in 2006 to $74 billion in 2020.
Exports, imports, and trade balance of KTI services for the United States: Selected years, 2006–20
| Year | Exports | Imports | Trade balance |
|---|---|---|---|
| 2006 | 77.7 | 43.3 | 34.4 |
| 2010 | 110.9 | 68.5 | 42.4 |
| 2015 | 150.3 | 95.3 | 55.0 |
| 2020 | 178.2 | 104.1 | 74.1 |
KTI = knowledge and technology intensive.
Note(s):
These data are not reported by industry but by type of service. This figure reports data on U.S. trade in services for the following KTI-related services: cloud computing and data storage services; database and other information services; computer software, including end-user licenses and customization; research and development services; and licenses for reproduction or distribution of computer software and use of research and development outcomes.
Source(s):
Bureau of Economic Analysis, Table 2.1. U.S. Trade in Services, by Type of Service, accessed 30 November 2021.
Science and Engineering Indicators
Value-Added Trade in KTI Output
Because not all of the value of gross exports is generated in the exporting country, an important indicator of globalization in production is the foreign value-added content (or foreign value-added share) of gross exports. This indicator captures the value of imported intermediate goods and services that are embodied in a domestic industry’s exports.
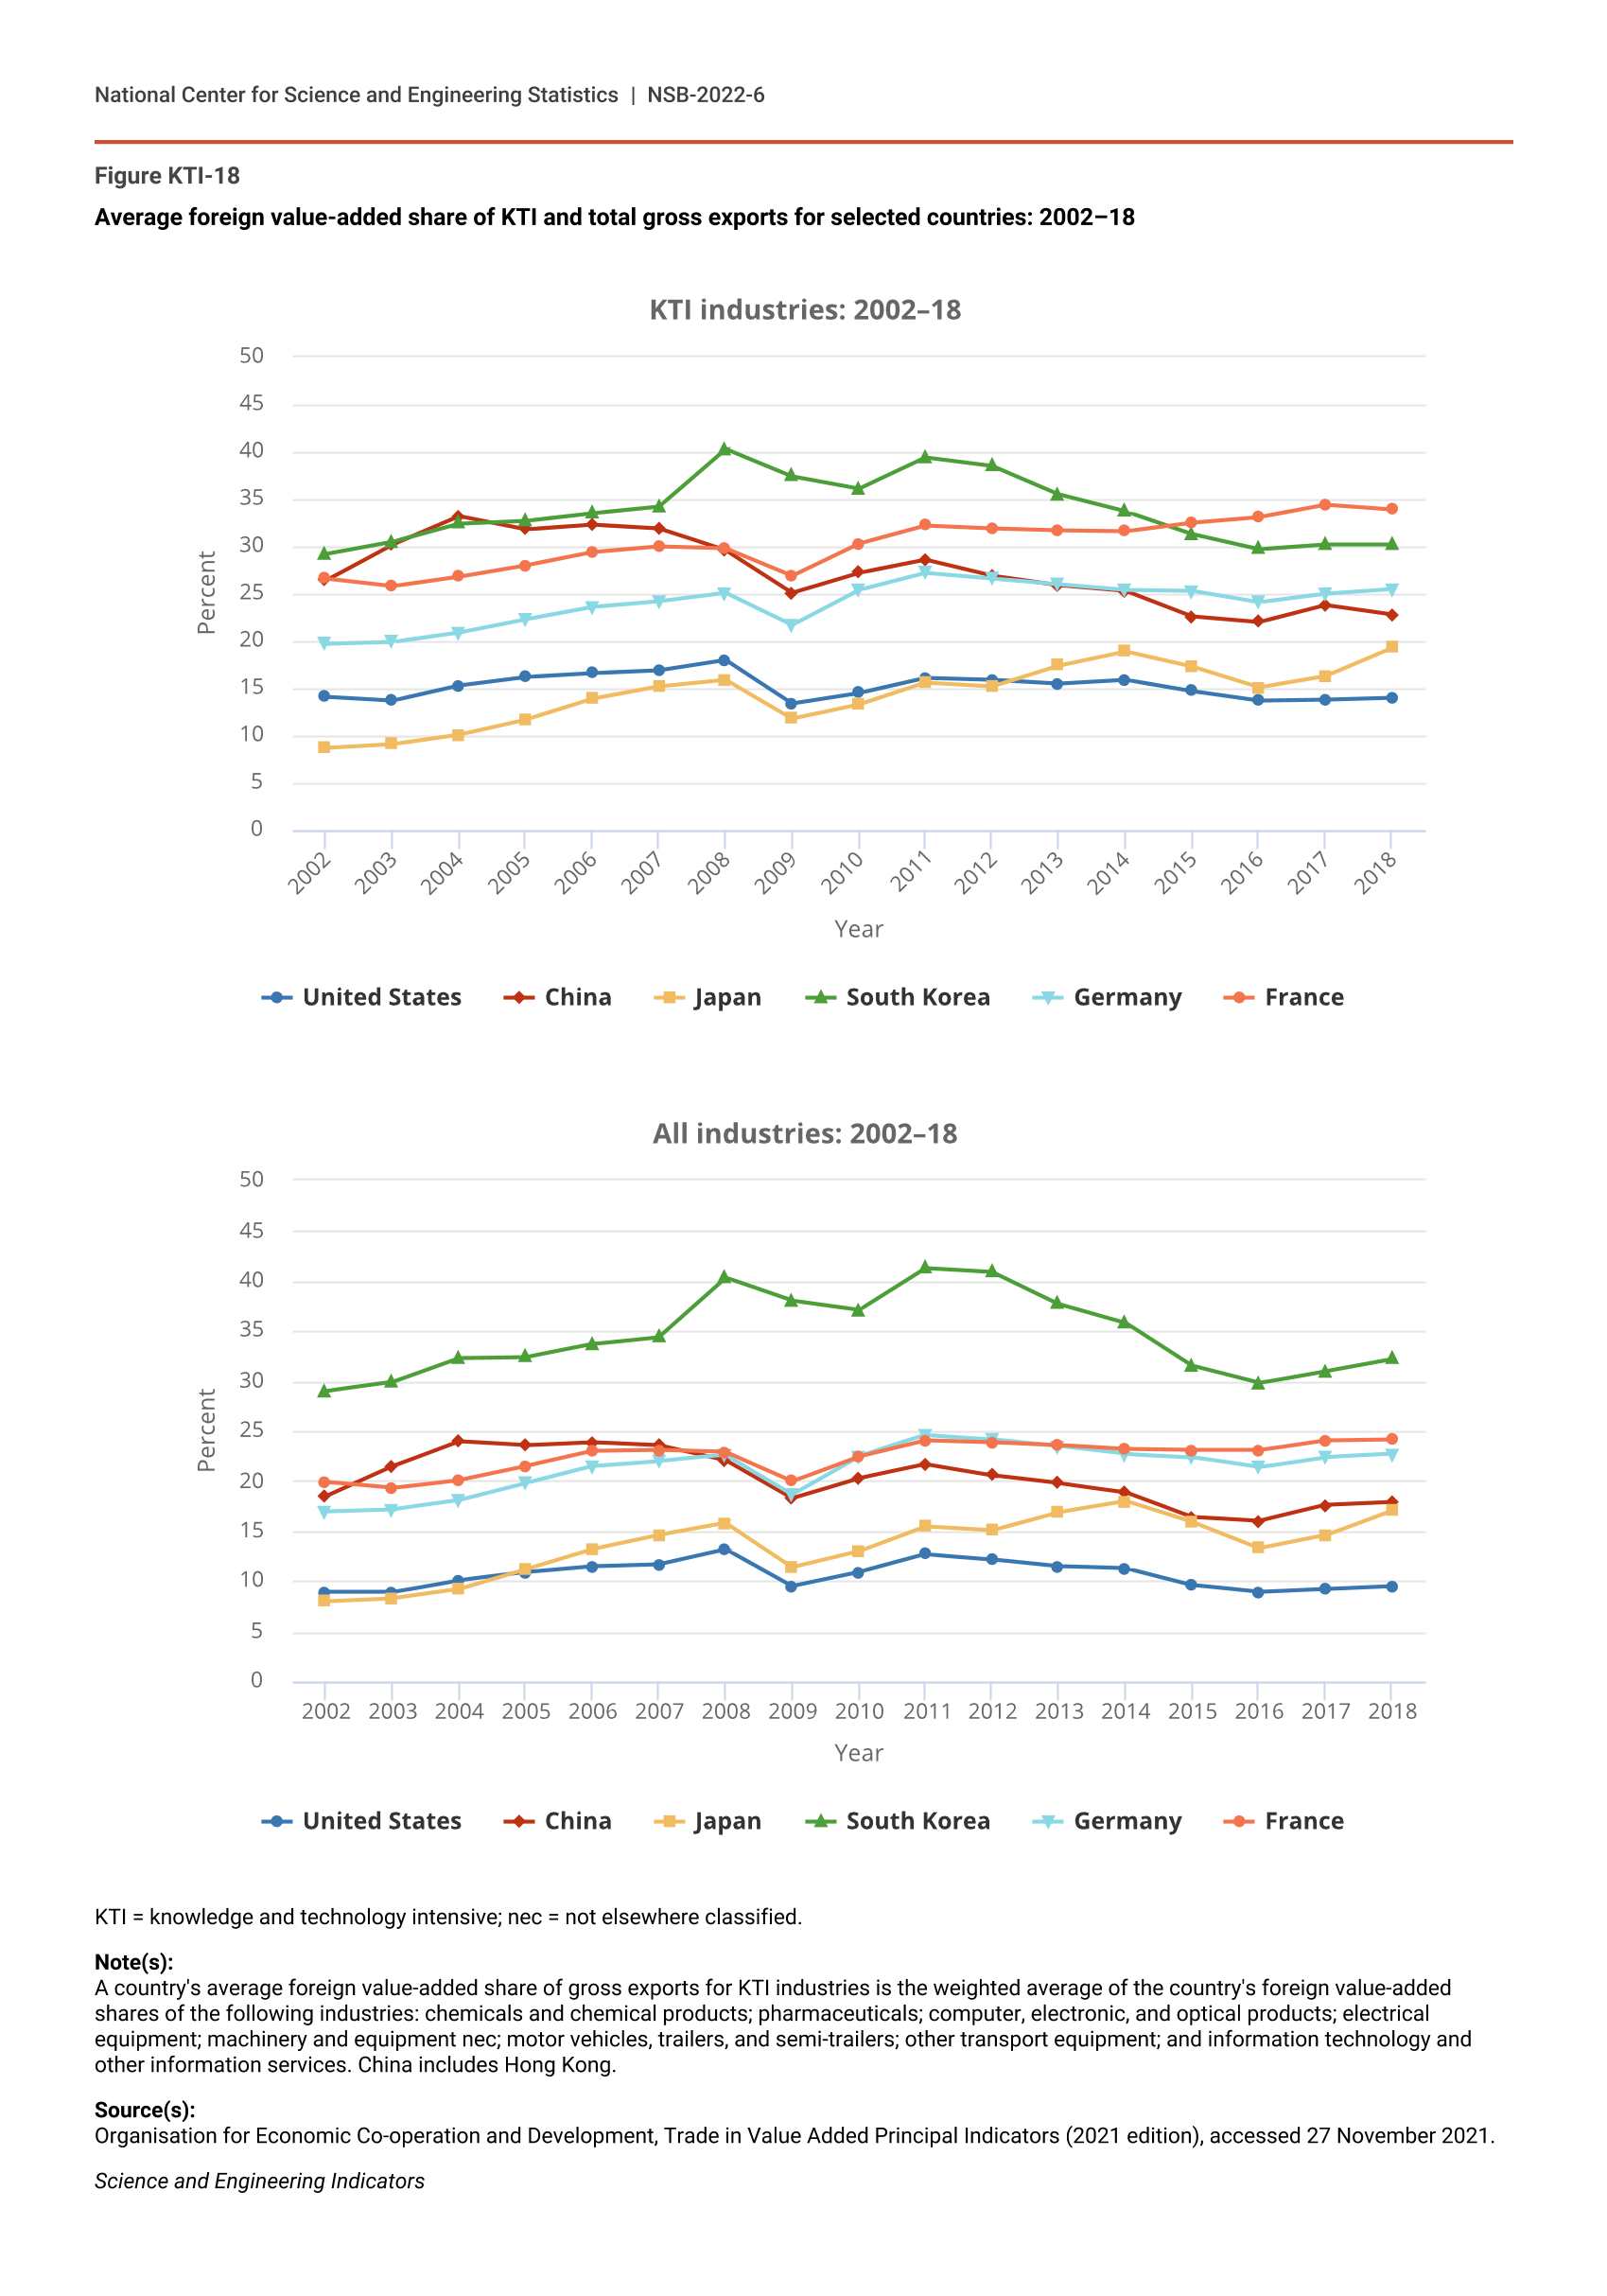
The average foreign value-added content share of U.S. KTI industries over the 2002–18 period is about 15%, higher than the average across all industries (11%) (Figure KTI-18). Germany, France, China, and South Korea have higher foreign content shares of their KTI exports compared to the United States and Japan.
Average foreign value-added share of KTI and total gross exports for selected countries: 2002–18
| Year | United States | China | Japan | South Korea | Germany | France |
|---|---|---|---|---|---|---|
| 2002 | 14.1 | 26.4 | 8.7 | 29.2 | 19.7 | 26.6 |
| 2003 | 13.7 | 30.2 | 9.1 | 30.5 | 19.9 | 25.8 |
| 2004 | 15.3 | 33.2 | 10.1 | 32.4 | 20.9 | 26.8 |
| 2005 | 16.2 | 31.8 | 11.7 | 32.7 | 22.3 | 28.0 |
| 2006 | 16.6 | 32.3 | 13.9 | 33.5 | 23.6 | 29.4 |
| 2007 | 16.9 | 31.9 | 15.2 | 34.2 | 24.2 | 30.0 |
| 2008 | 18.0 | 29.6 | 15.9 | 40.3 | 25.1 | 29.8 |
| 2009 | 13.4 | 25.1 | 11.8 | 37.4 | 21.7 | 26.9 |
| 2010 | 14.5 | 27.2 | 13.3 | 36.1 | 25.4 | 30.3 |
| 2011 | 16.1 | 28.6 | 15.6 | 39.4 | 27.2 | 32.2 |
| 2012 | 15.9 | 26.9 | 15.2 | 38.5 | 26.6 | 31.9 |
| 2013 | 15.5 | 25.9 | 17.4 | 35.5 | 26.0 | 31.7 |
| 2014 | 15.9 | 25.3 | 18.9 | 33.7 | 25.4 | 31.6 |
| 2015 | 14.7 | 22.6 | 17.3 | 31.3 | 25.3 | 32.5 |
| 2016 | 13.7 | 22.0 | 15.1 | 29.7 | 24.1 | 33.1 |
| 2017 | 13.8 | 23.8 | 16.3 | 30.2 | 25.0 | 34.4 |
| 2018 | 14.0 | 22.8 | 19.3 | 30.2 | 25.5 | 33.9 |
| Year | United States | China | Japan | South Korea | Germany | France |
|---|---|---|---|---|---|---|
| 2002 | 8.9 | 18.5 | 8.0 | 29.0 | 17.0 | 19.9 |
| 2003 | 8.9 | 21.5 | 8.3 | 29.9 | 17.2 | 19.3 |
| 2004 | 10.1 | 24.0 | 9.2 | 32.3 | 18.1 | 20.1 |
| 2005 | 10.9 | 23.6 | 11.2 | 32.4 | 19.8 | 21.5 |
| 2006 | 11.5 | 23.9 | 13.2 | 33.7 | 21.5 | 23.0 |
| 2007 | 11.7 | 23.6 | 14.6 | 34.4 | 22.0 | 23.1 |
| 2008 | 13.2 | 22.1 | 15.8 | 40.3 | 22.6 | 22.9 |
| 2009 | 9.5 | 18.3 | 11.4 | 38.0 | 18.7 | 20.0 |
| 2010 | 10.9 | 20.3 | 13.0 | 37.1 | 22.5 | 22.5 |
| 2011 | 12.7 | 21.7 | 15.5 | 41.3 | 24.6 | 24.1 |
| 2012 | 12.2 | 20.6 | 15.1 | 40.9 | 24.2 | 23.9 |
| 2013 | 11.5 | 19.8 | 16.9 | 37.7 | 23.5 | 23.6 |
| 2014 | 11.3 | 18.9 | 18.0 | 35.8 | 22.7 | 23.2 |
| 2015 | 9.6 | 16.4 | 15.9 | 31.5 | 22.4 | 23.1 |
| 2016 | 8.9 | 16.0 | 13.3 | 29.8 | 21.4 | 23.1 |
| 2017 | 9.2 | 17.6 | 14.6 | 31.0 | 22.4 | 24.1 |
| 2018 | 9.5 | 17.9 | 17.1 | 32.2 | 22.7 | 24.2 |
KTI = knowledge and technology intensive; nec = not elsewhere classified.
Note(s):
A country's average foreign value-added share of gross exports for KTI industries is the weighted average of the country's foreign value-added shares of the following industries: chemicals and chemical products; pharmaceuticals; computer, electronic, and optical products; electrical equipment; machinery and equipment nec; motor vehicles, trailers, and semi-trailers; other transport equipment; and information technology and other information services. China includes Hong Kong.
Source(s):
Organisation for Economic Co-operation and Development, Trade in Value Added Principal Indicators (2021 edition), accessed 27 November 2021.
Science and Engineering Indicators
The average foreign value-added content of gross exports in KTI industries (and overall industries) has gradually declined for many major economies since 2011, leveling off after 2016. The decline is more pronounced in South Korea and China, where it started earlier than 2011. China’s average foreign content share of gross exports for KTI industries declined from a high of 33% in 2004 to 23% in 2015 and has since fluctuated around 23%. This decline is largely a result of China’s policy efforts to reform its science and technology (S&T) system and build capacity to produce domestically many of the high-technology components that it imports from other countries (Chen and Shih 2005). The decline in the average foreign content share of U.S. KTI gross exports is more modest, from a high of 18% in 2008 to 14% in 2016, and it has since remained at 14%.
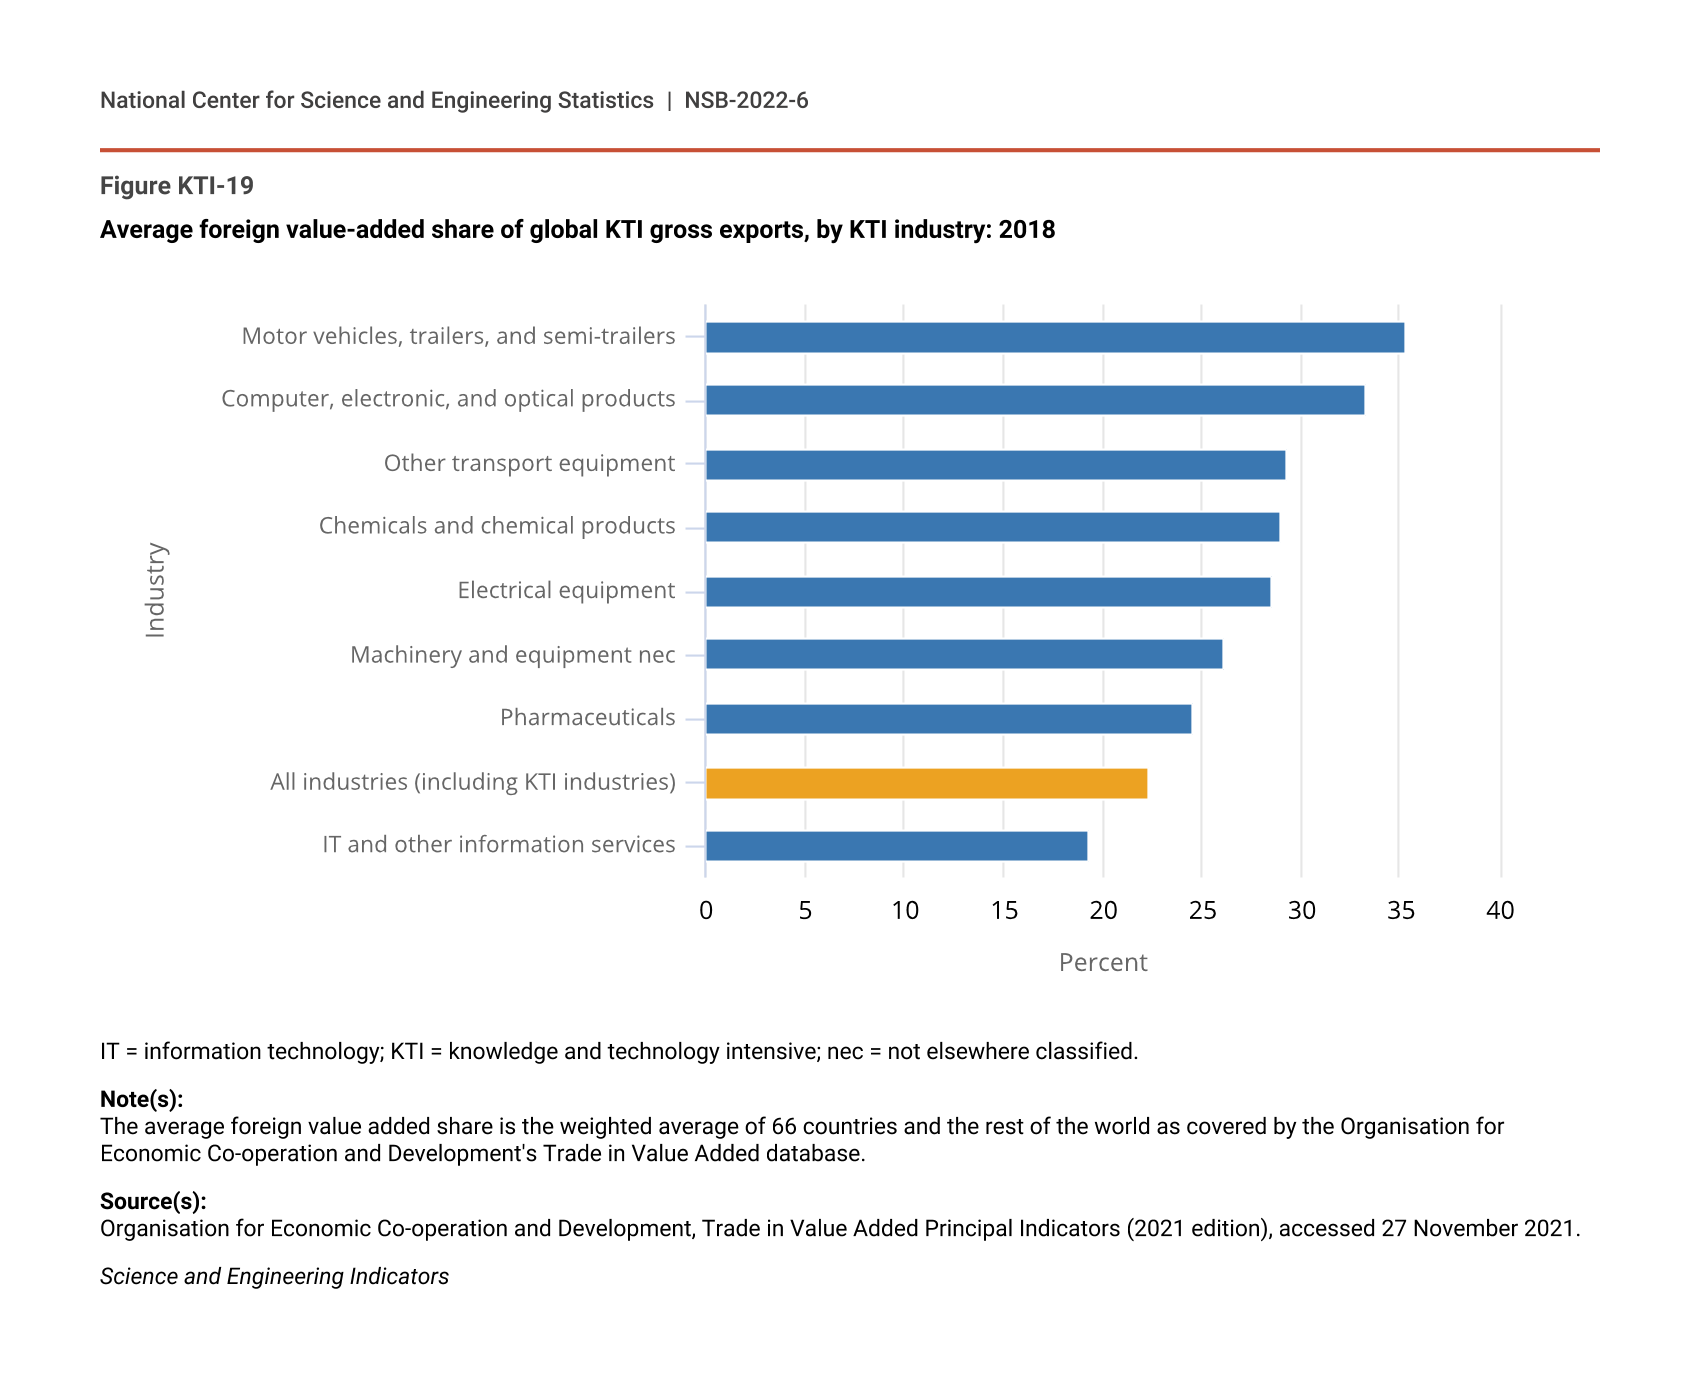
Among KTI industries, motor vehicles and computer, electronic, and optical products are the two most globally integrated industries (i.e., industries with the highest average shares of foreign value-added content in gross exports across all countries) (Figure KTI-19). The average foreign content share of gross exports in these two industries is over 30%. Other manufacturing KTI industries have foreign content shares that range from 25% to 29%. The IT and other information services industry has the lowest foreign content share of gross exports among KTI industries at 19%. By the nature of their production processes, services-producing industries in general rely more on labor and capital and less on purchased intermediate inputs (whether foreign or domestic) than goods-producing industries.
Average foreign value-added share of global KTI gross exports, by KTI industry: 2018
| Industry | 2018 |
|---|---|
| IT and other information services | 19.3 |
| All industries (including KTI industries) | 22.4 |
| Pharmaceuticals | 24.6 |
| Machinery and equipment nec | 26.1 |
| Electrical equipment | 28.6 |
| Chemicals and chemical products | 29.0 |
| Other transport equipment | 29.3 |
| Computer, electronic, and optical products | 33.3 |
| Motor vehicles, trailers, and semi-trailers | 35.3 |
IT = information technology; KTI = knowledge and technology intensive; nec = not elsewhere classified.
Note(s):
The average foreign value added share is the weighted average of 66 countries and the rest of the world as covered by the Organisation for Economic Co-operation and Development's Trade in Value Added database.
Source(s):
Organisation for Economic Co-operation and Development, Trade in Value Added Principal Indicators (2021 edition), accessed 27 November 2021.
Science and Engineering Indicators
Global value chains are prevalent in the computer, electronic, and optical products industry because components are modular and generally low weight, which keeps shipping costs low (OECD 2012). A significant portion of production of electronic products with short development cycles has moved to Asian countries like China that are able to scale up production quickly. Production of motor vehicles, on the other hand, is generally located closer to the final markets to keep transportation costs low and to better understand customers’ needs as it relates to motor vehicle design (Donofrio and Whitefoot 2015).
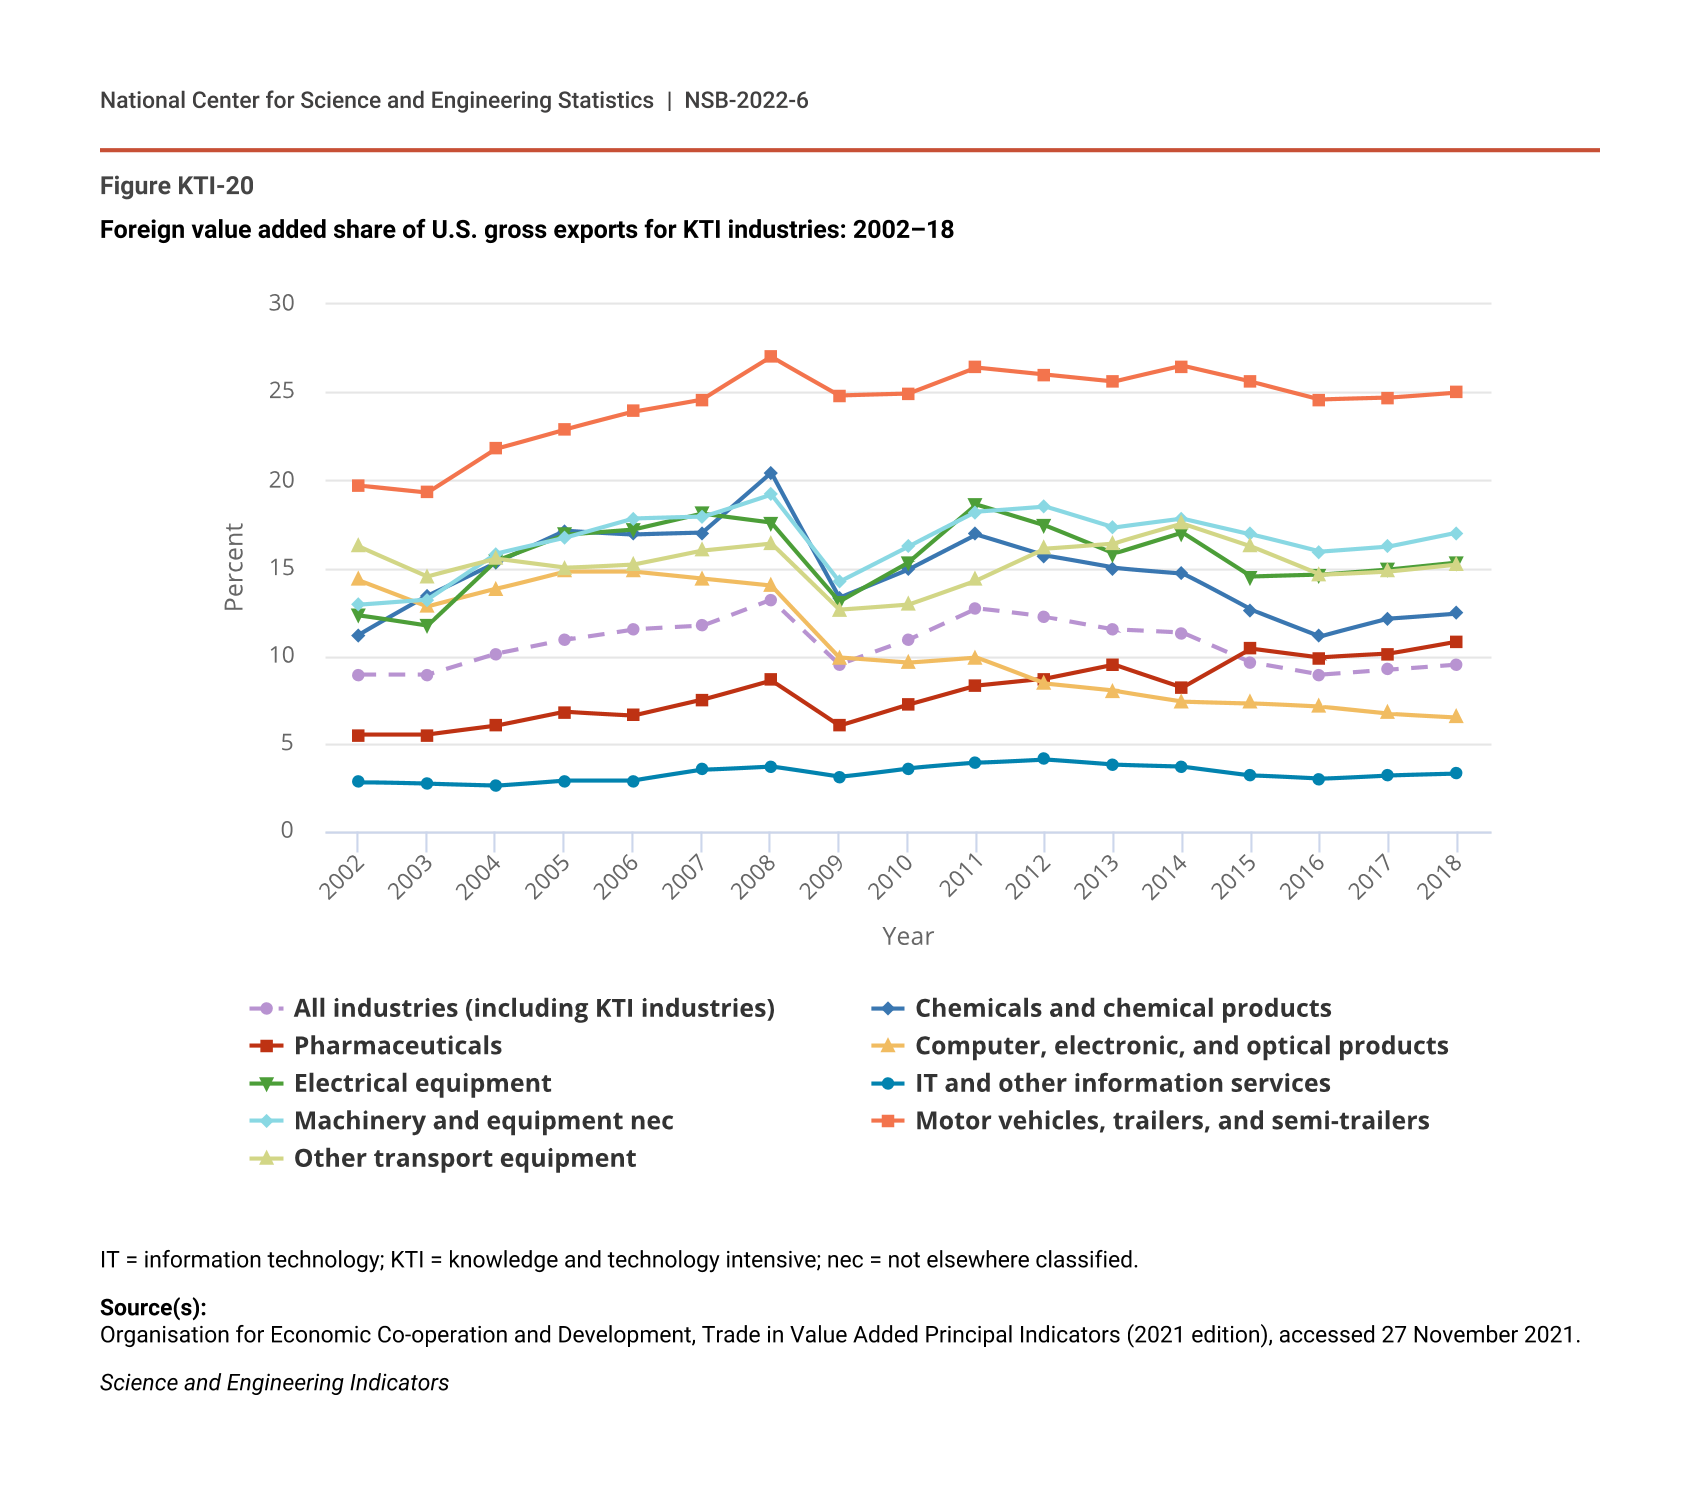
In the United States, the motor vehicle industry is the most reliant on foreign intermediate inputs. Since 2007, 25% or more of the value of motor vehicles exports each year was foreign value added (Figure KTI-20). The foreign content share in gross exports for most U.S. KTI manufacturing industries varies between 10% and 20%. Among U.S. KTI manufacturing industries, computer, electronic, and optical products and pharmaceuticals have the lowest foreign content share in exports.
Foreign value added share of U.S. gross exports for KTI industries: 2002–18
| Year | All industries (including KTI industries) | Chemicals and chemical products | Pharmaceuticals | Computer, electronic, and optical products | Electrical equipment | IT and other information services | Machinery and equipment nec | Motor vehicles, trailers, and semi-trailers | Other transport equipment |
|---|---|---|---|---|---|---|---|---|---|
| 2002 | 8.9 | 11.2 | 5.5 | 14.3 | 12.3 | 2.8 | 12.9 | 19.7 | 16.2 |
| 2003 | 8.9 | 13.4 | 5.5 | 12.8 | 11.7 | 2.7 | 13.2 | 19.3 | 14.5 |
| 2004 | 10.1 | 15.3 | 6.0 | 13.8 | 15.4 | 2.6 | 15.8 | 21.8 | 15.5 |
| 2005 | 10.9 | 17.1 | 6.8 | 14.8 | 16.9 | 2.9 | 16.7 | 22.9 | 15.0 |
| 2006 | 11.5 | 16.9 | 6.6 | 14.8 | 17.2 | 2.9 | 17.8 | 23.9 | 15.2 |
| 2007 | 11.7 | 17.0 | 7.5 | 14.4 | 18.1 | 3.5 | 17.9 | 24.6 | 16.0 |
| 2008 | 13.2 | 20.4 | 8.6 | 14.0 | 17.6 | 3.7 | 19.2 | 27.0 | 16.4 |
| 2009 | 9.5 | 13.3 | 6.0 | 9.9 | 13.1 | 3.1 | 14.2 | 24.8 | 12.6 |
| 2010 | 10.9 | 14.9 | 7.2 | 9.6 | 15.3 | 3.6 | 16.2 | 24.9 | 12.9 |
| 2011 | 12.7 | 16.9 | 8.3 | 9.9 | 18.6 | 3.9 | 18.2 | 26.4 | 14.3 |
| 2012 | 12.2 | 15.7 | 8.7 | 8.4 | 17.4 | 4.1 | 18.5 | 26.0 | 16.1 |
| 2013 | 11.5 | 15.0 | 9.5 | 8.0 | 15.8 | 3.8 | 17.3 | 25.6 | 16.4 |
| 2014 | 11.3 | 14.7 | 8.2 | 7.4 | 17.0 | 3.7 | 17.8 | 26.5 | 17.5 |
| 2015 | 9.6 | 12.6 | 10.4 | 7.3 | 14.5 | 3.2 | 16.9 | 25.6 | 16.2 |
| 2016 | 8.9 | 11.1 | 9.9 | 7.1 | 14.6 | 3.0 | 15.9 | 24.6 | 14.6 |
| 2017 | 9.2 | 12.1 | 10.1 | 6.7 | 14.9 | 3.2 | 16.2 | 24.7 | 14.8 |
| 2018 | 9.5 | 12.4 | 10.8 | 6.5 | 15.3 | 3.3 | 17.0 | 25.0 | 15.2 |
IT = information technology; KTI = knowledge and technology intensive; nec = not elsewhere classified.
Source(s):
Organisation for Economic Co-operation and Development, Trade in Value Added Principal Indicators (2021 edition), accessed 27 November 2021.
Science and Engineering Indicators
The computer, electronic, and optical products industry in the United States has a much smaller share of foreign content value in gross exports compared with other countries (15% at its highest [2005, 2006] and under 7% more recently [2017, 2018], compared to over 30% average across all countries). The foreign content share of this industry declined sharply in 2009—as it did in all other KTI industries during the Great Recession—and has continued to decline more recently. Increased domestic sourcing of intermediate inputs and changes in commodity prices are among factors that affect this ratio.
The IT and other information services industry in the United States has the lowest foreign content share of gross exports among KTI industries. The foreign content share of exports from this industry has been stable at 3%–4% since 2002.