 An official website of the United States government
 Production Patterns and Trends of Knowledge- and Technology-Intensive Industries
In this report, the featured measure of production for KTI industries is value added in current dollars (not adjusted for inflation). Value added is a net measure of output; it is the difference between the value of goods and services produced by an industry (gross output) and the total cost of intermediate inputs that were used in production, including energy, materials, and services purchased from other businesses. For production activities that take place within a country’s geographic borders, industry value added measures the contribution from each industry to overall GDP.
The U.S. data on value added by industry presented in the report are from the Industry and Regional Economic Accounts of the U.S. Bureau of Economic Analysis (BEA). The source for data for KTI employment is the U.S. Census Bureau’s 2019 American Community Survey (ACS). International data on value added of KTI industries are drawn from the Comparative Industry Service, a proprietary database from IHS Markit. A detailed description of these data sources is provided in the Technical Appendix.
KTI Industries in the United States
KTI industries perform and fund more than half of U.S. R&D (see Indicators 2020 report, “Research and Development: U.S. Trends and International Comparisons”). Much of the productivity growth in the United States since the late 1990s is attributable to three of the KTI industries: computer and electronic products, software publishing, and IT services (Nordhaus 2005; Baily and Montalbano 2016). The analysis in this report shows that, compared to other industries, U.S. KTI production has shown resilience to economic downturns (although that varies by disaggregated industries), including the downturn that resulted from the unfolding global COVID-19 pandemic beginning in 2020.
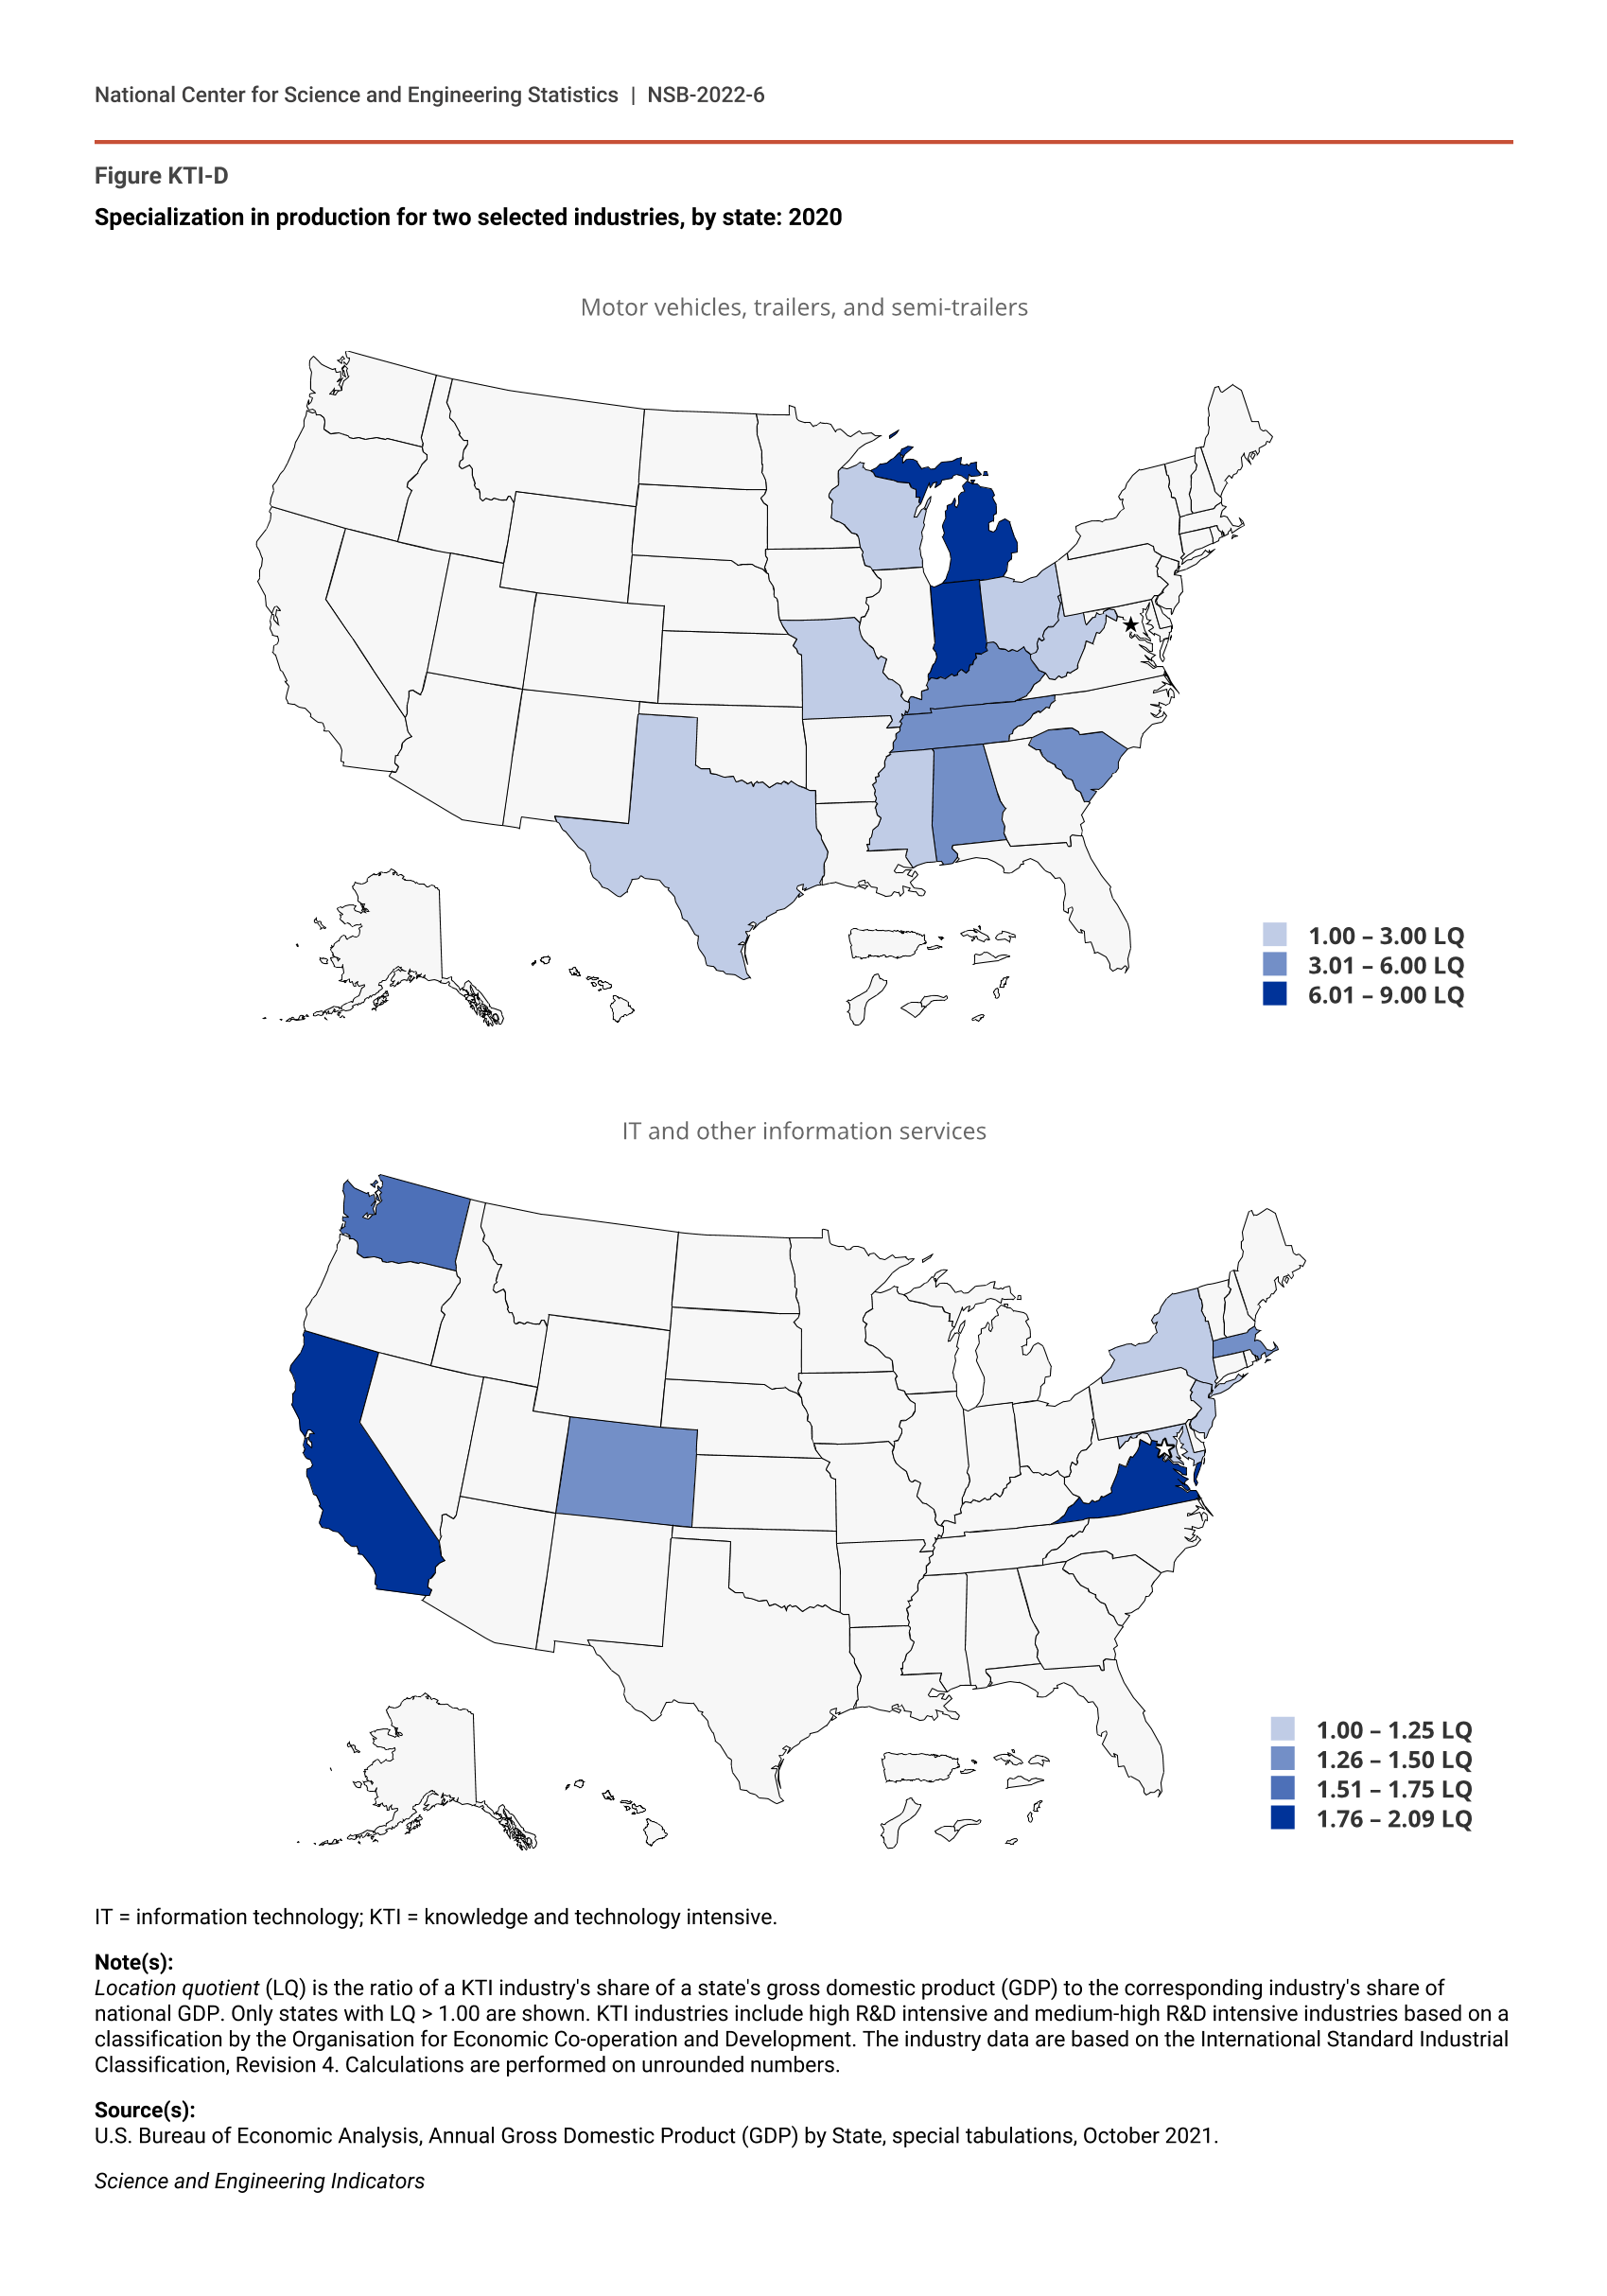
Along with the analysis of overall production trends, this section presents new analysis on the distribution of KTI production across the nation and the composition of KTI employment by STEM workforce categories. Specifically, the regional analysis examines the geographic distribution of U.S. KTI production, the contribution of KTI industries to states’ economies, and the regional specialization of KTI production. Even with globalization, geography remains important because competitive advantages often arise from concentrations of highly specialized skills and knowledge, access to institutions, specialized incentives, and other advantages of productivity and innovation that are difficult to access from a distance (Porter 2000).
The analysis on the composition of the KTI employment by STEM workforce categories focuses on underrepresentation of women, Blacks or African Americans, Hispanics or Latinos, and American Indians or Alaska Natives, and the concentration of foreign-born talent. Underrepresentation signals a lack of diversity in the workplace and can negatively impact productivity, innovation, and entrepreneurship (Hsieh et al. 2019; Bell et al. 2019; Flabbi et al. 2019). Because foreign-born workers are proportionately greater in the STEM occupations compared to the general population, immigration policies can affect the flow of this critical source of science and engineering (S&E) skills and knowledge (Kerr and Kerr 2020).
Trends in Value Added of KTI Industries
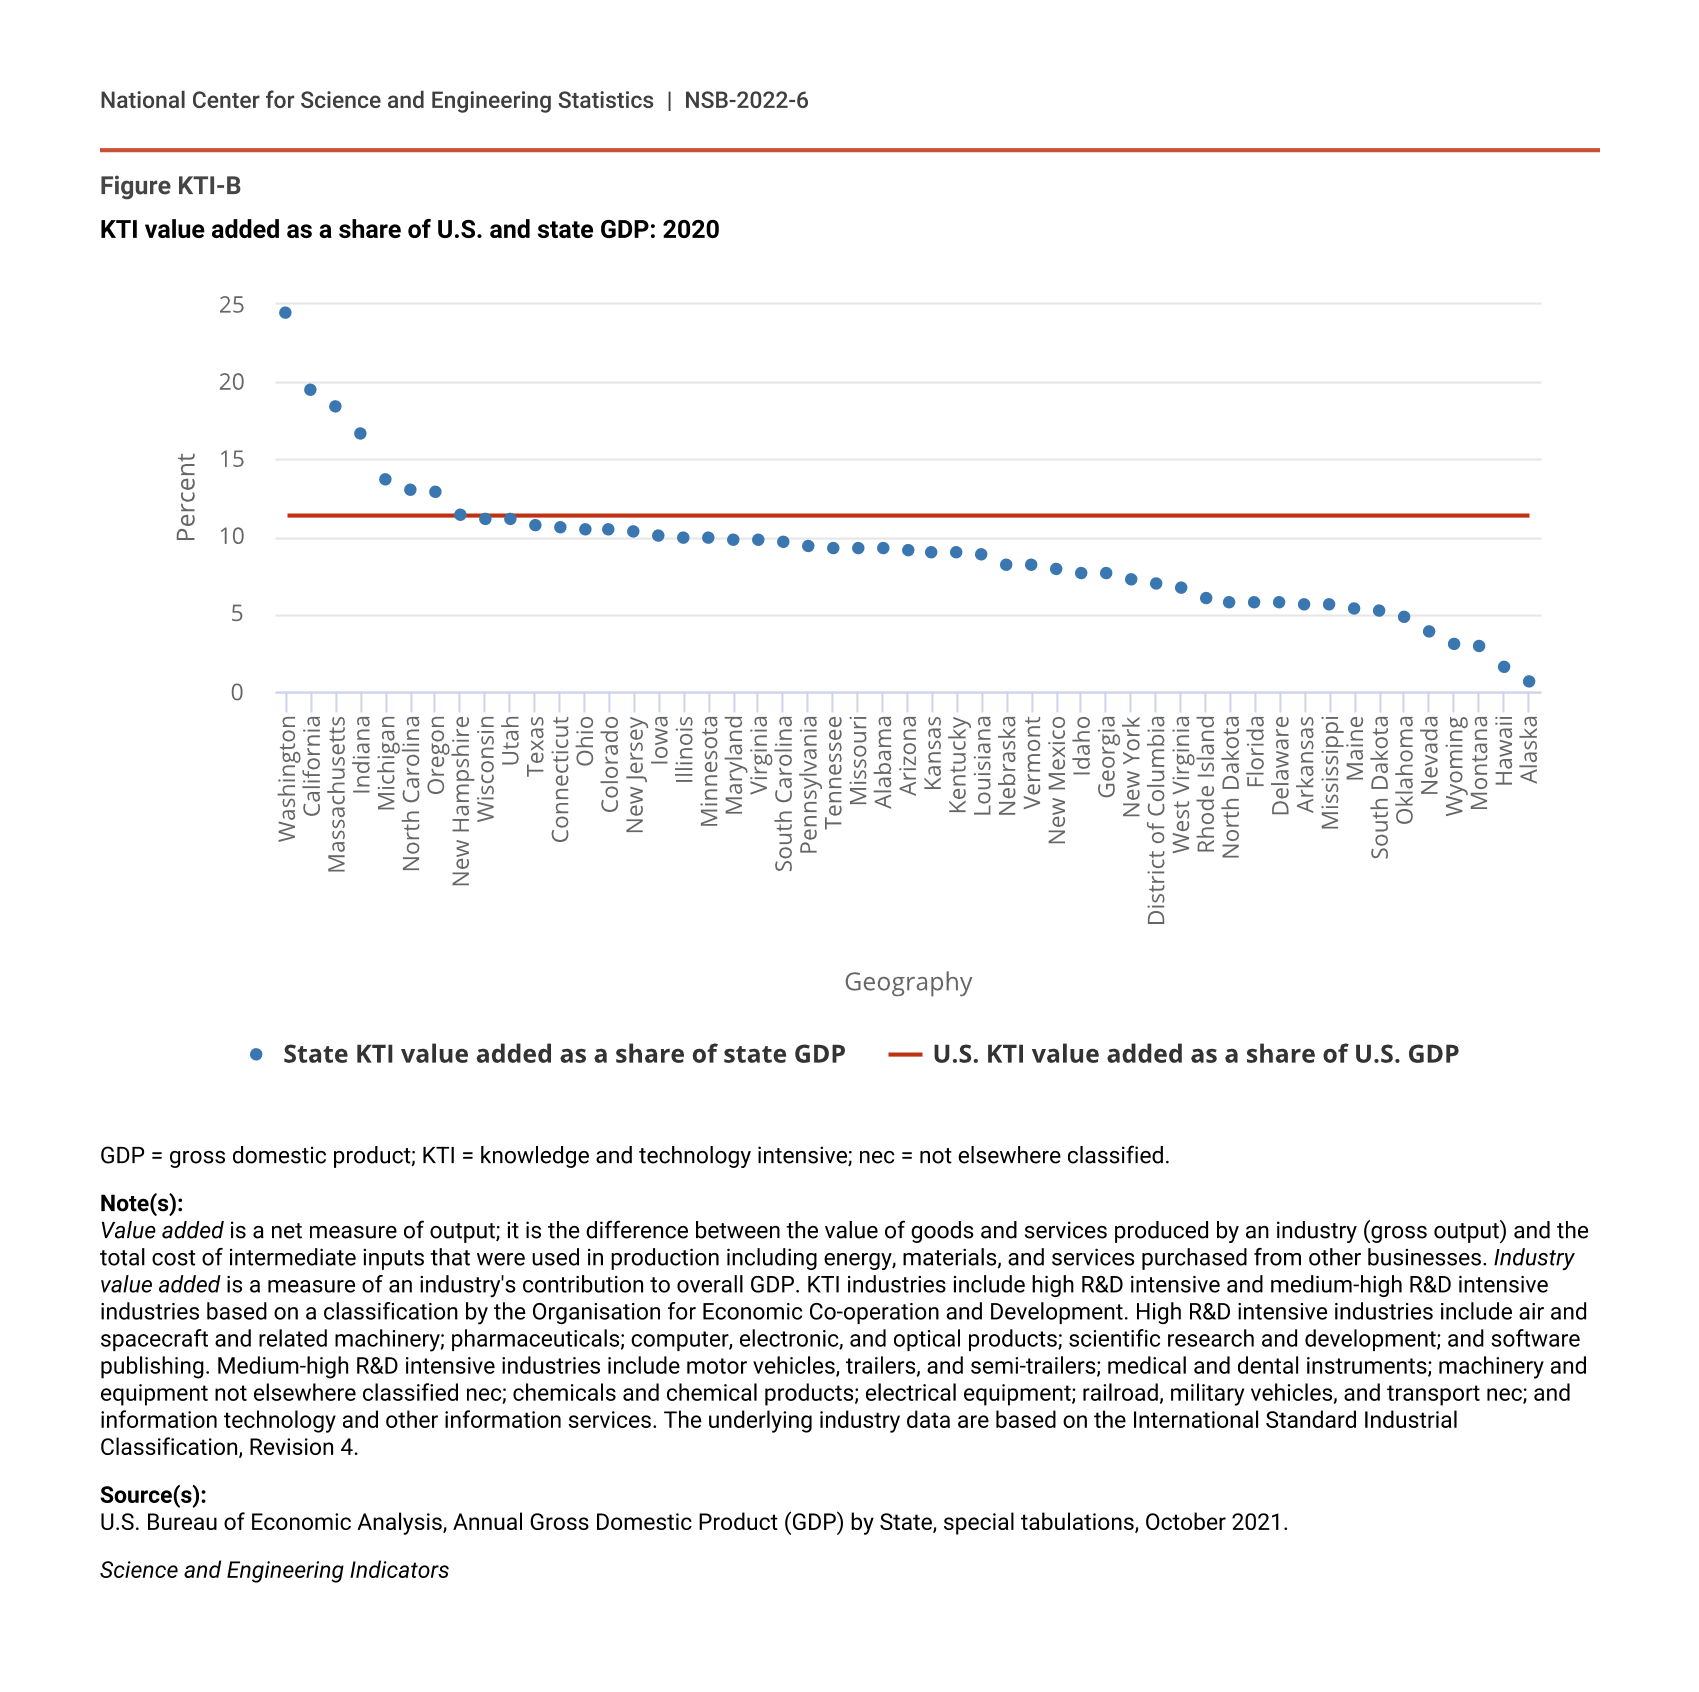
KTI industries generated nearly $2.4 trillion in value added in 2020 and accounted for over 11% of domestic GDP (Table KTI-1). The three largest KTI industries in the United States are IT and other information services; computer, electronic, and optical products; and software publishing. Jointly, they accounted for more than half of the total value added generated by U.S. KTI industries in 2020.
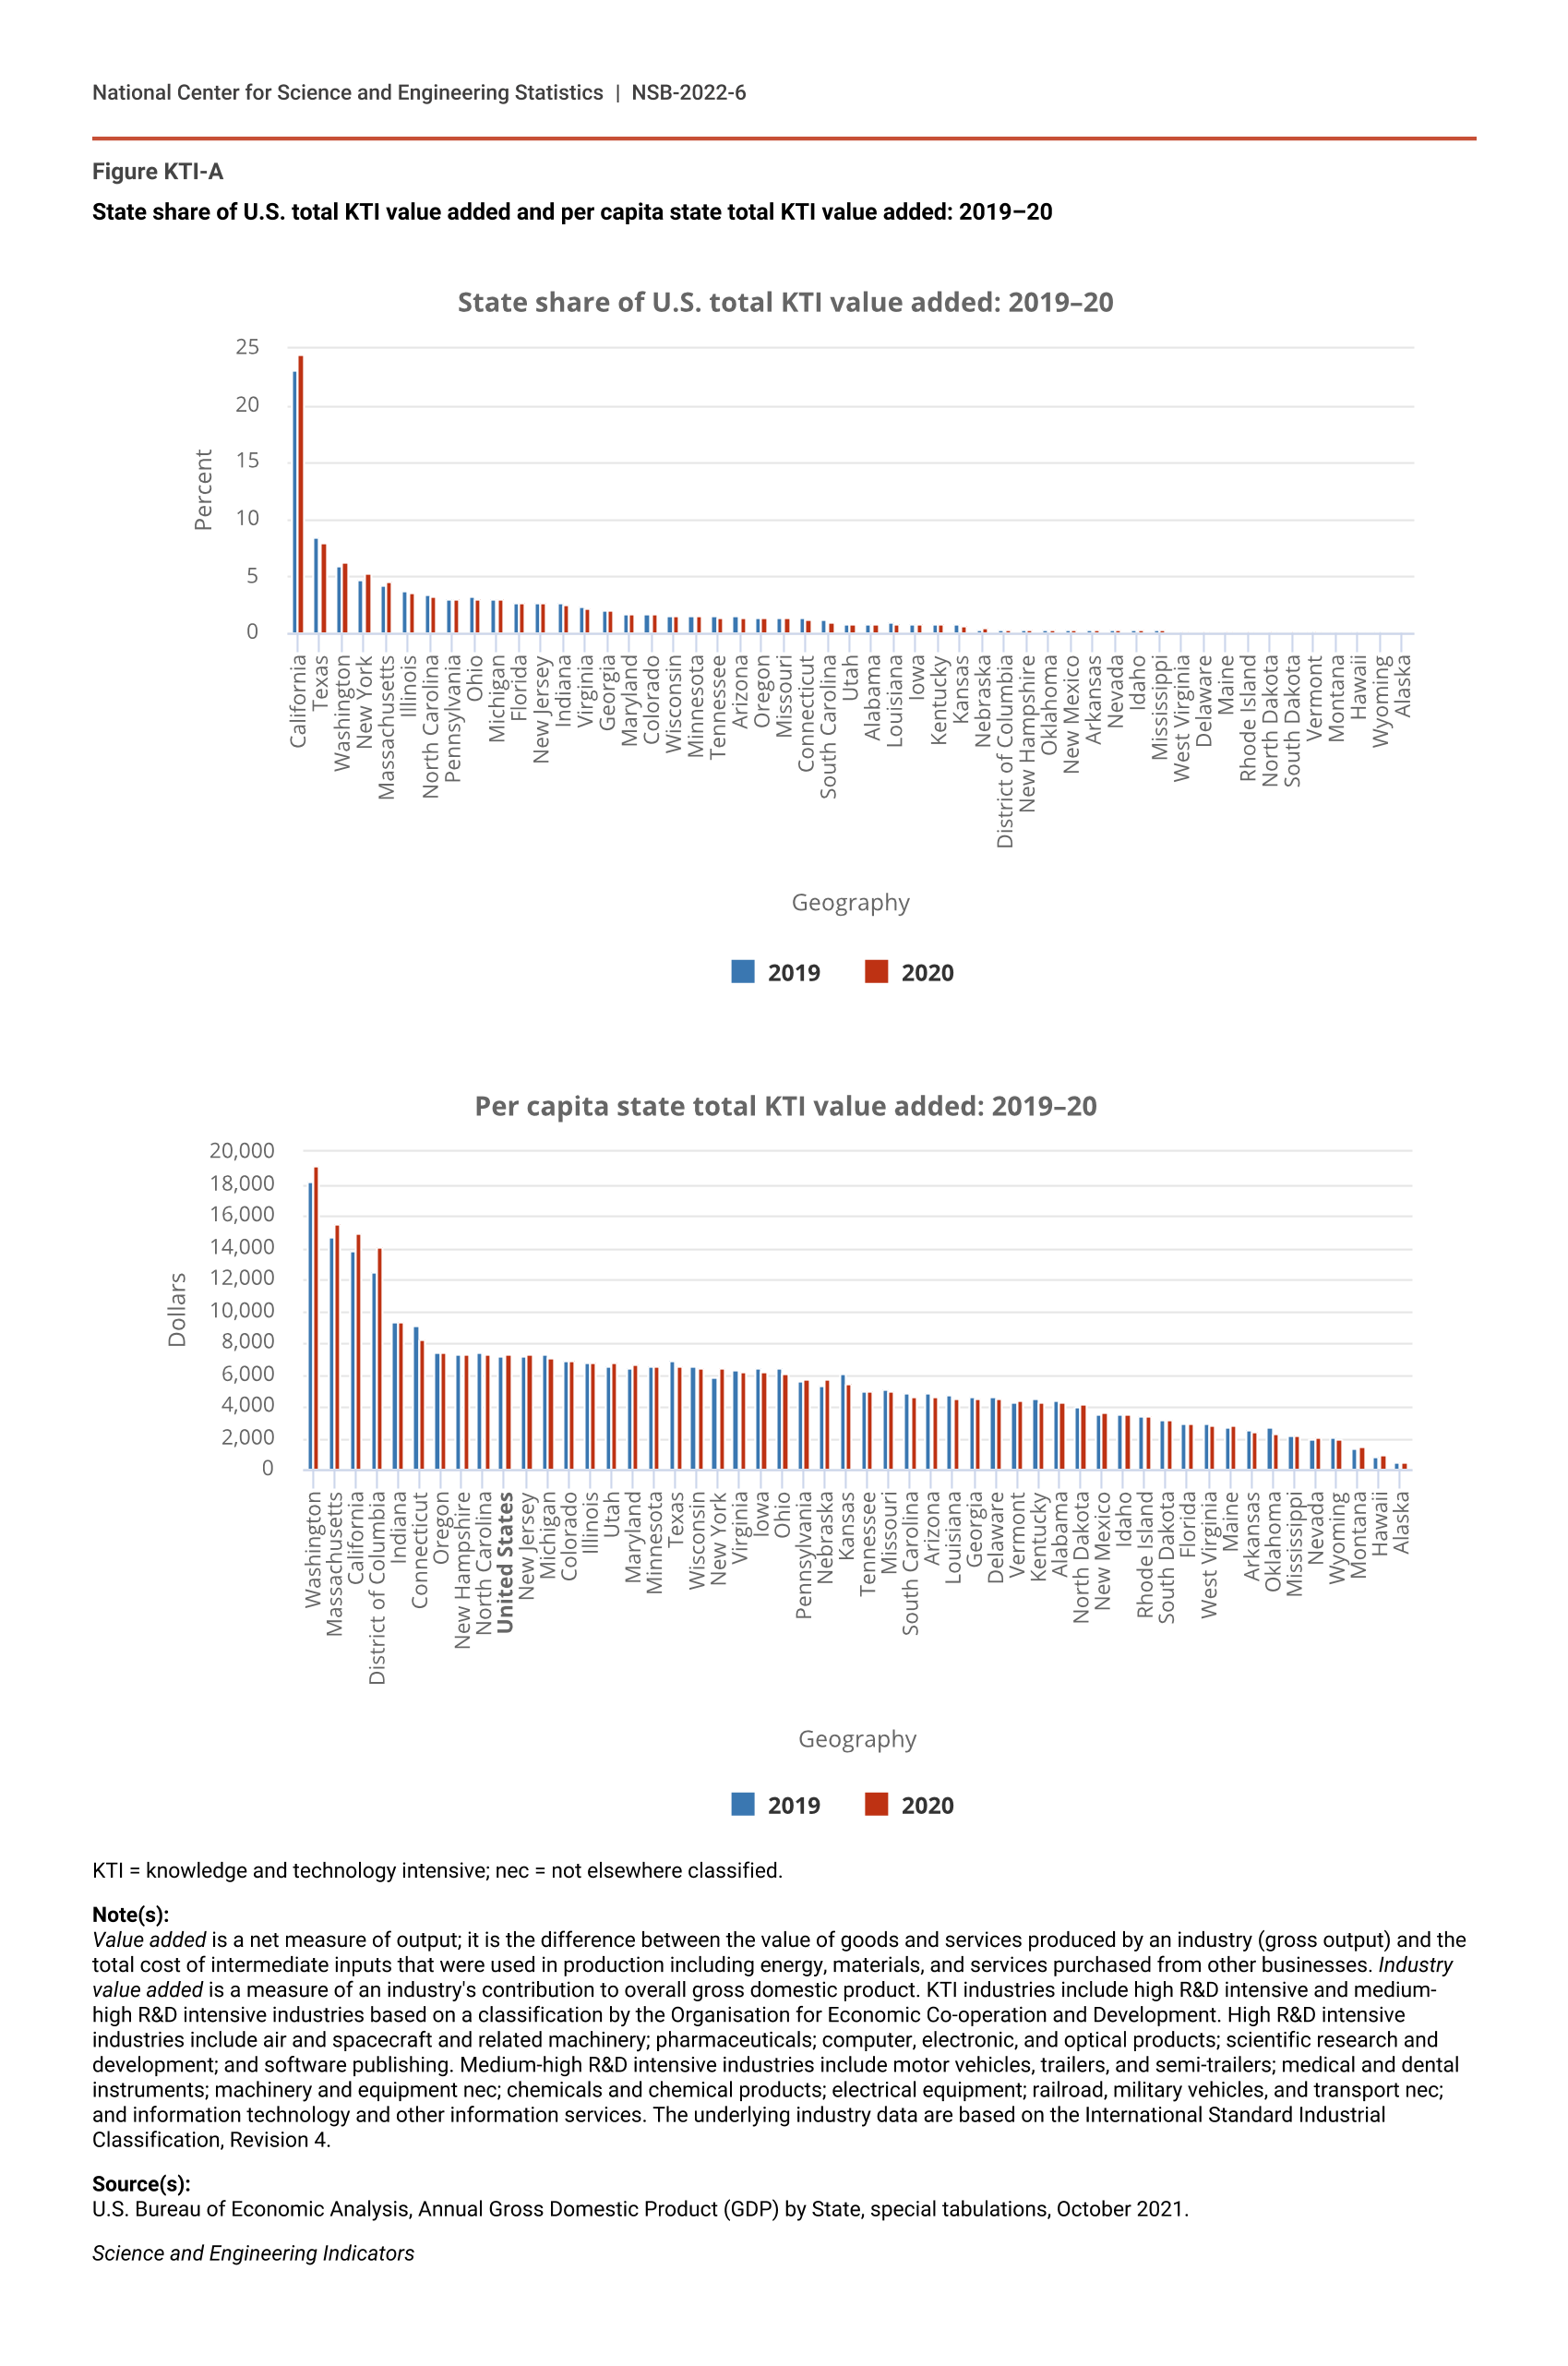
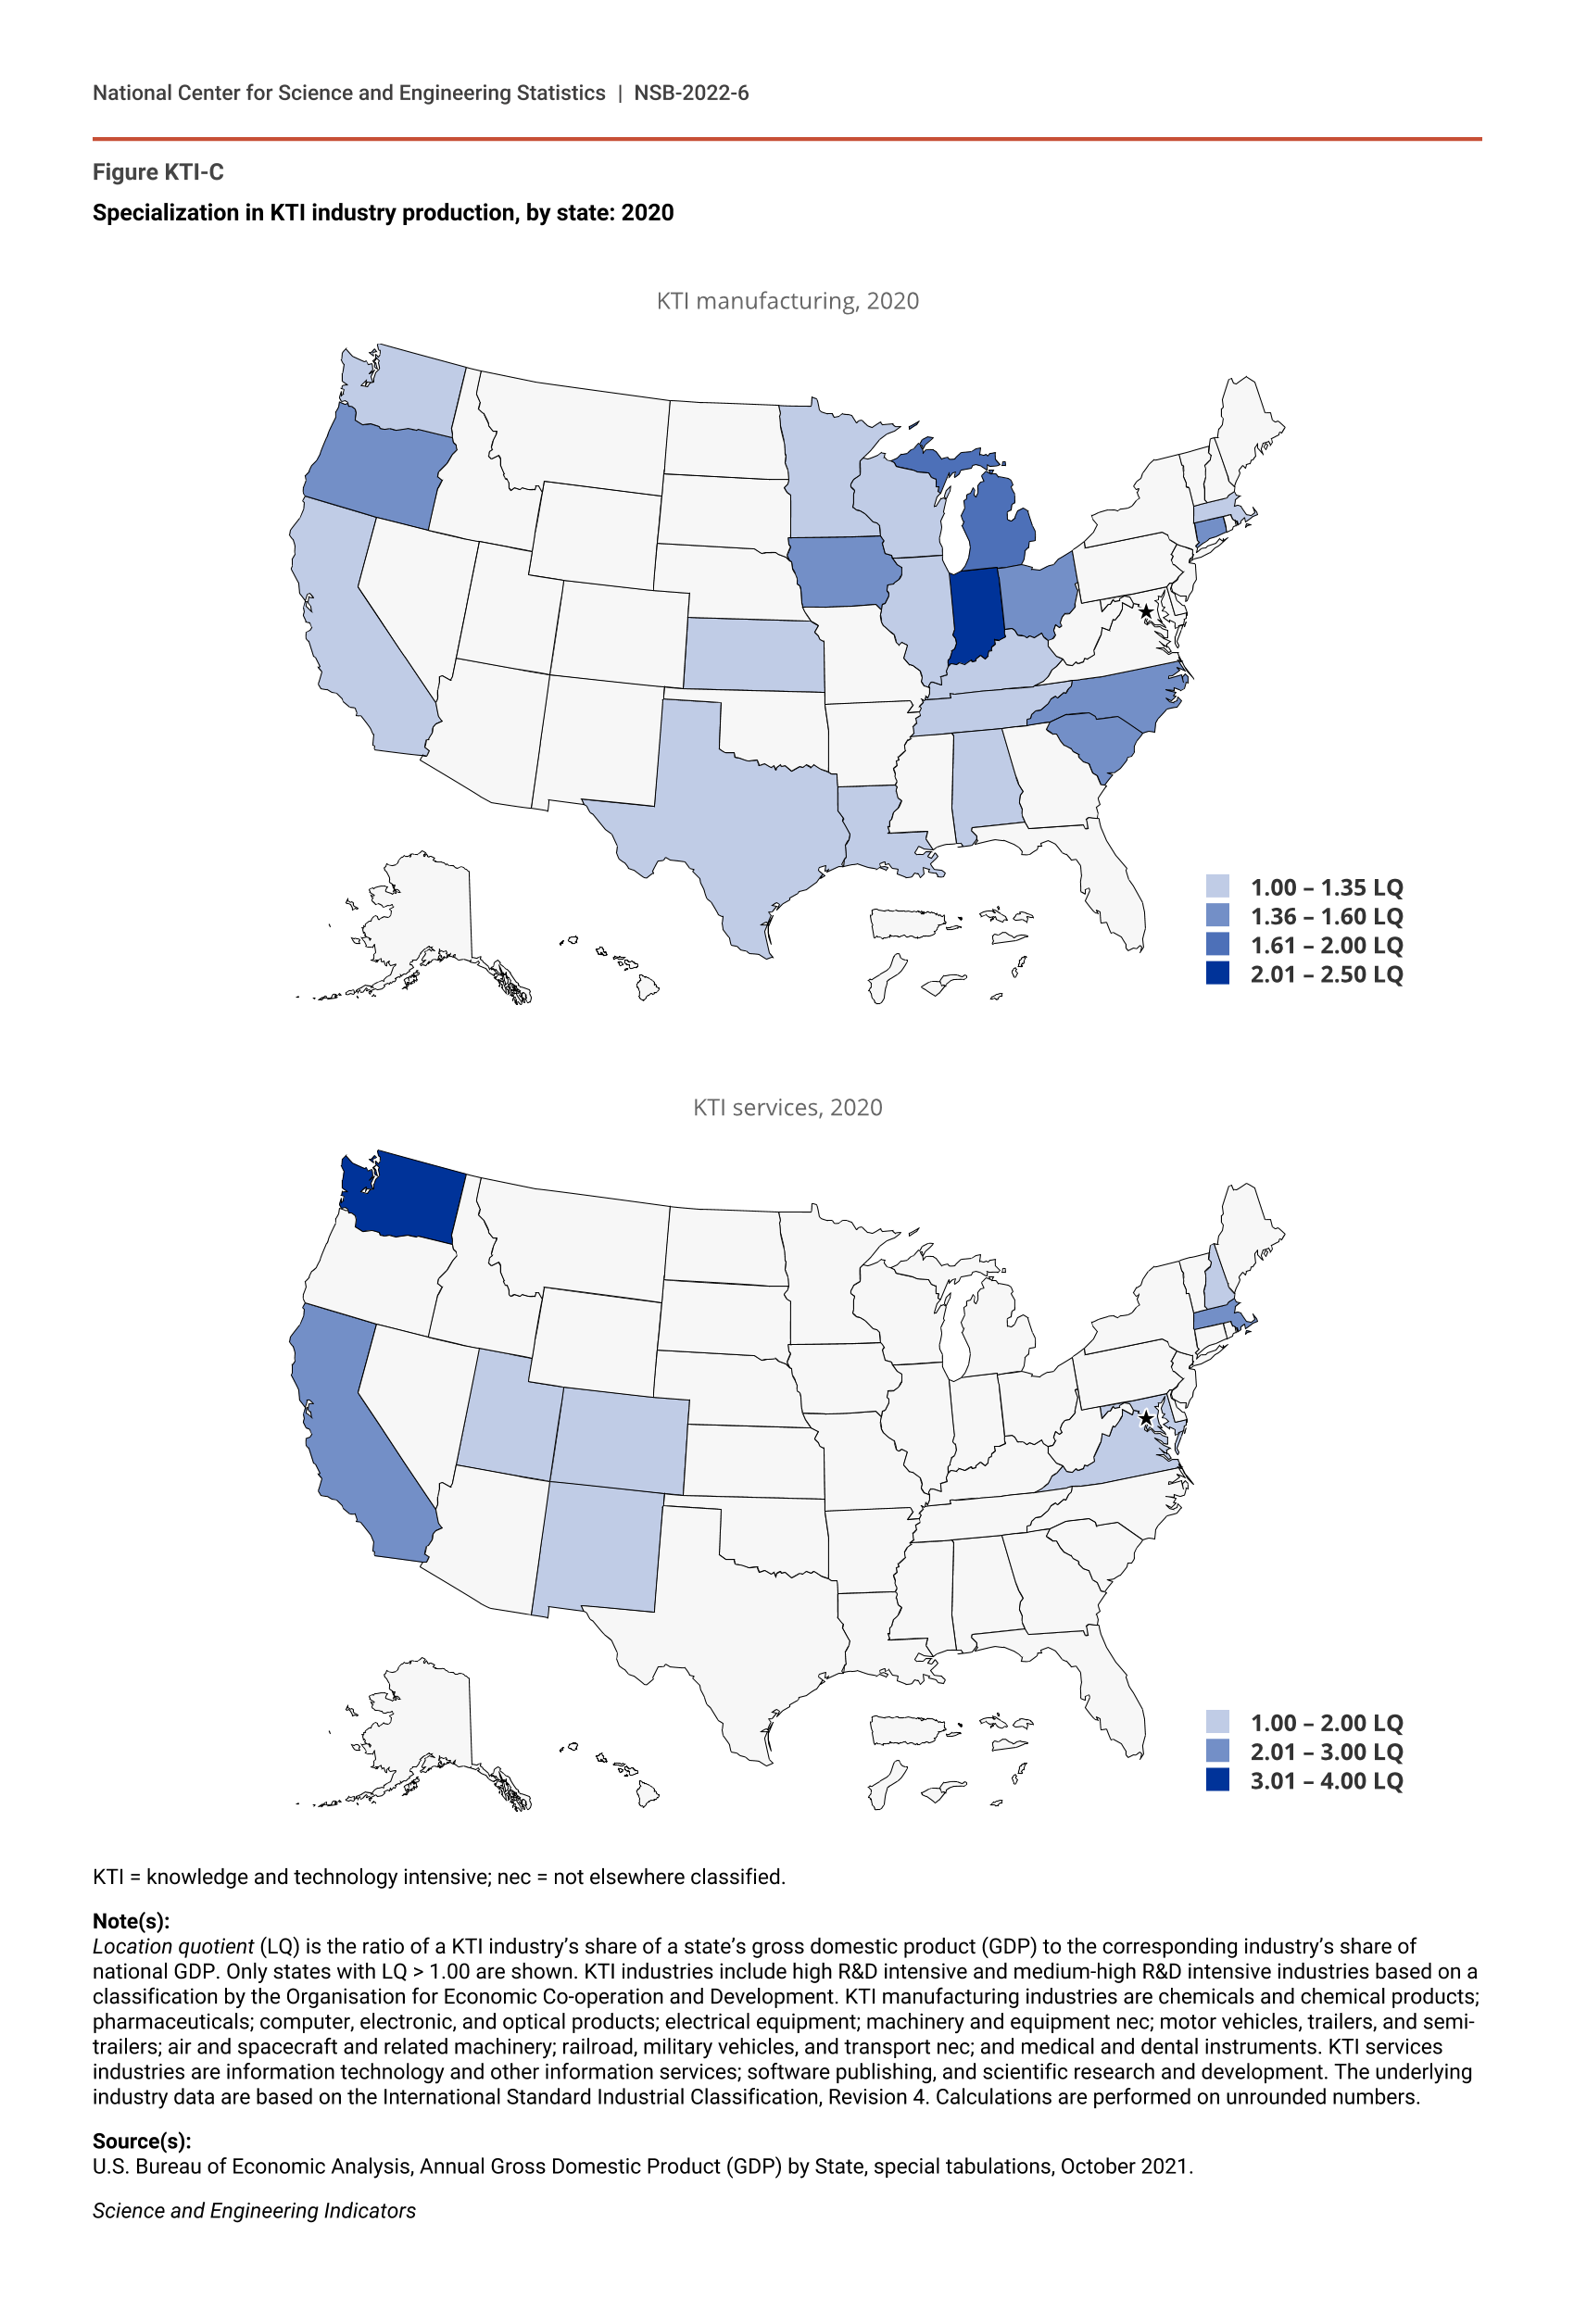
KTI manufacturing industries accounted for 53% of total U.S. KTI value added in 2020, while service industries accounted for the remaining 47% (Table KTI-1). Computer, electronic, and optical products; chemicals and chemical products; and pharmaceuticals led production among the KTI manufacturing industries, jointly accounting for 30% of the total value added generated by U.S. KTI industries in 2020. IT and other information services led production among the KTI services industries, followed by software publishing. These two services industries jointly accounted for 40% of U.S. total KTI value added. In addition to its concentration in a few industries, U.S. KTI production is highly concentrated and specialized geographically. (See sidebar Geography of KTI Production in the United States.)
U.S. KTI industries, by value added and share of GDP: 2019 and 2020
GDP = gross domestic product; ISIC, Rev.4 = International Standard Industrial Classification, Revision 4; IT = information technology; KTI = knowledge and technology intensive; nec = not elsewhere classified.
Note(s):
Value added is a net measure of output; it is the difference between the value of goods and services produced by an industry (gross output) and the total cost of intermediate inputs that were used in production, including energy, materials, and services purchased from other businesses. Industry value added is a measure of an industry's contribution to overall GDP. KTI industries include high R&D intensive and medium-high R&D intensive industries based on a classification by the Organisation for Economic Co-operation and Development. The data have been crosswalked to the ISIC, Rev.4, classification. See the Technical Appendix for the crosswalking method and Table SKTI-1 for historical data on these industries.
Source(s):
U.S. Bureau of Economic Analysis, Value Added by Industry, accessed 5 October 2021.
Science and Engineering Indicators
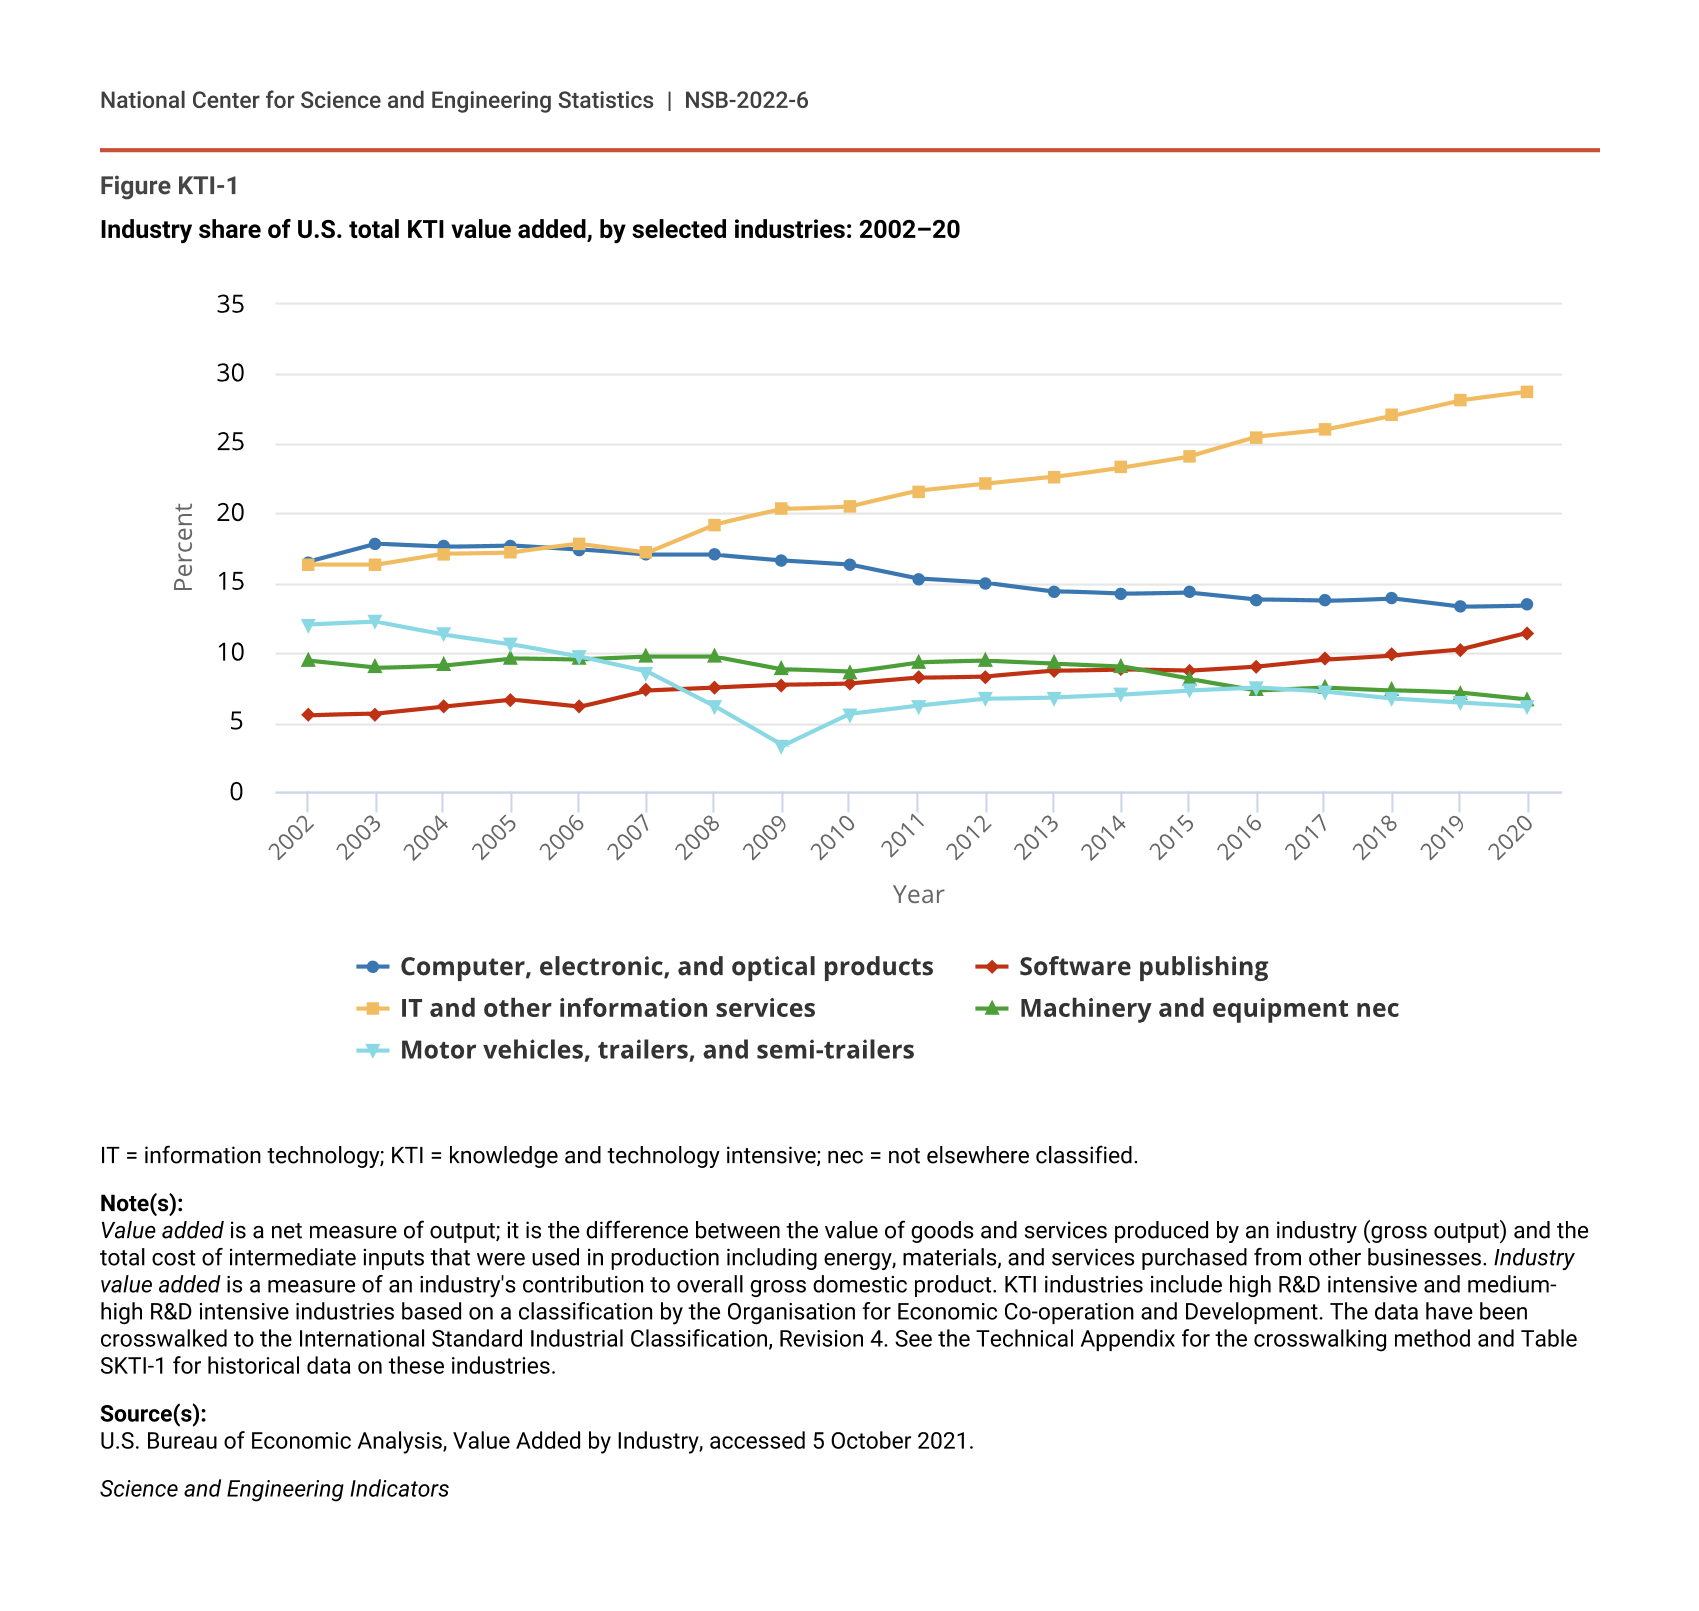
The composition of U.S. KTI production has notably changed since the early 2000s as the value added of KTI services industries has increased much faster than that of manufacturing industries, resulting in the services share of KTI value added increasing from 29% in 2002 to 47% in 2020 (Table SKTI-1). From 2002 to 2020, the share of total KTI value added for IT and other information services—the largest KTI service industry and the largest KTI industry overall—increased by more than 12 percentage points (Figure KTI-1). The share of total KTI value added for software publishing also increased by 6 percentage points. A major driver of the increase in software publishing has been the rise in U.S. business investment in software, which nearly tripled from 2002 to 2020 (from $152.5 billion to $453.4 billion) (BEA 2021a).
Industry share of U.S. total KTI value added, by selected industries: 2002–20
| Year | Computer, electronic, and optical products | Software publishing | IT and other information services | Machinery and equipment nec | Motor vehicles, trailers, and semi-trailers |
|---|---|---|---|---|---|
| 2002 | 16.5 | 5.5 | 16.3 | 9.4 | 12.0 |
| 2003 | 17.8 | 5.6 | 16.3 | 8.9 | 12.2 |
| 2004 | 17.6 | 6.1 | 17.1 | 9.1 | 11.3 |
| 2005 | 17.7 | 6.6 | 17.2 | 9.6 | 10.6 |
| 2006 | 17.4 | 6.1 | 17.8 | 9.5 | 9.7 |
| 2007 | 17.0 | 7.3 | 17.2 | 9.7 | 8.6 |
| 2008 | 17.0 | 7.5 | 19.2 | 9.7 | 6.1 |
| 2009 | 16.6 | 7.7 | 20.3 | 8.8 | 3.3 |
| 2010 | 16.3 | 7.8 | 20.5 | 8.6 | 5.6 |
| 2011 | 15.3 | 8.2 | 21.6 | 9.3 | 6.2 |
| 2012 | 15.0 | 8.3 | 22.1 | 9.4 | 6.7 |
| 2013 | 14.4 | 8.7 | 22.6 | 9.2 | 6.8 |
| 2014 | 14.2 | 8.8 | 23.3 | 9.0 | 7.0 |
| 2015 | 14.3 | 8.7 | 24.1 | 8.1 | 7.3 |
| 2016 | 13.8 | 9.0 | 25.5 | 7.3 | 7.5 |
| 2017 | 13.7 | 9.5 | 26.0 | 7.5 | 7.2 |
| 2018 | 13.9 | 9.8 | 27.0 | 7.3 | 6.7 |
| 2019 | 13.3 | 10.2 | 28.1 | 7.1 | 6.4 |
| 2020 | 13.4 | 11.4 | 28.7 | 6.6 | 6.1 |
IT = information technology; KTI = knowledge and technology intensive; nec = not elsewhere classified.
Note(s):
Value added is a net measure of output; it is the difference between the value of goods and services produced by an industry (gross output) and the total cost of intermediate inputs that were used in production including energy, materials, and services purchased from other businesses. Industry value added is a measure of an industry's contribution to overall gross domestic product. KTI industries include high R&D intensive and medium-high R&D intensive industries based on a classification by the Organisation for Economic Co-operation and Development. The data have been crosswalked to the International Standard Industrial Classification, Revision 4. See the Technical Appendix for the crosswalking method and Table SKTI-1 for historical data on these industries.
Source(s):
U.S. Bureau of Economic Analysis, Value Added by Industry, accessed 5 October 2021.
Science and Engineering Indicators
In contrast, the manufacturing share of total KTI value added declined from 71% in 2002 to 53% in 2020. The share of total KTI value added for computer, electronic, and optical products—the largest KTI manufacturing industry—declined by more than 3 percentage points during this period. Other notable declines include a 6 percentage points drop in the share of motor vehicles manufacturing and a drop of 3 percentage points in other machinery and equipment manufacturing.
The rate of increase in KTI value added has outpaced that of current dollar GDP for more than a decade (Table KTI-2). From 2005 to 2010—a period that includes the Great Recession—KTI value added increased on average 4.3%, moderately faster than the 2.9% average increase in GDP. The average annual increase in KTI value added was a full percentage point higher than the rate of GDP increase (4.9%, compared to 3.9%) from 2010 to 2015. Since 2015, KTI value added has increased faster than GDP each year, driven primarily by the KTI services industries with annual increases ranging from 7.3% to 11.1%. KTI value added continued to increase through 2020, albeit at a lower rate, despite the COVID-19 pandemic’s effect on the economy.
Annual rates of change in U.S. KTI value added and GDP: 2002–20
GDP = gross domestic product; ISIC, Rev.4 = International Standard Industrial Classification, Revision 4; IT = information technology; KTI = knowledge and technology intensive; nec = not elsewhere classified.
Note(s):
Value added is a net measure of output; it is the difference between the value of goods and services produced by an industry (gross output) and the total cost of intermediate inputs that were used in production, including energy, materials, and services purchased from other businesses. Industry value added is a measure of an industry's contribution to overall GDP. KTI industries include high R&D intensive and medium-high R&D intensive industries based on a classification by the Organisation for Economic Co-operation and Development. The data have been crosswalked to the ISIC, Rev.4, classification. See the Technical Appendix for the crosswalking method and Table SKTI-1 for historical data on these industries. Longer-term trend rates are calculated as compound annual growth rates.
Source(s):
U.S. Bureau of Economic Analysis, Value Added by Industry, accessed 5 October 2021.
Science and Engineering Indicators
In 2020, even as GDP declined by nearly half a trillion dollars (or 2.2%), KTI value added increased by over $50 billion (or 2.2%) (Figure KTI-2; Table SKTI-1). This increase was led by increases in value added generated by information and communications technology (ICT) industries (IT and other information services; software publishing; and computer, electronic, and optical products), scientific research and development, medical and dental instruments, and pharmaceuticals.
Percent change and contribution to percent change in KTI value added: 2019–20
| Industry | Percent change 2019–20 |
|---|---|
| Air and spacecraft and related machinery | -24.0 |
| Machinery and equipment nec | -6.1 |
| Chemicals and chemical products | -4.3 |
| Motor vehicles, trailers, and semi-trailers | -2.3 |
| Electrical equipment | -2.2 |
| Computer, electronic, and optical products | 3.1 |
| Railroad, military vehicles, and transport nec | 3.4 |
| IT and other information services | 4.4 |
| Pharmaceuticals | 7.0 |
| Medical and dental instruments | 10.1 |
| Scientific research and development | 12.1 |
| Software publishing | 14.1 |
| All KTI industries | 2.2 |
| Gross domestic product | -2.2 |
| Industry | Contribution to percent change 2019–20 |
|---|---|
| Air and spacecraft and related machinery | -1.5 |
| Machinery and equipment nec | -0.4 |
| Chemicals and chemical products | -0.4 |
| Motor vehicles, trailers, and semi-trailers | -0.1 |
| Electrical equipment | -0.1 |
| Railroad, military vehicles, and transport nec | 0.0 |
| Medical and dental instruments | 0.3 |
| Computer, electronic, and optical products | 0.4 |
| Pharmaceuticals | 0.5 |
| Scientific research and development | 0.7 |
| IT and other information services | 1.2 |
| Software publishing | 1.4 |
| All KTI industries | 2.2 |
IT = information technology; KTI = knowledge and technology intensive; nec = not elsewhere classified.
Note(s):
Value added is a net measure of output; it is the difference between the value of goods and services produced by an industry (gross output) and the total cost of intermediate inputs that were used in production including energy, materials, and services purchased from other businesses. Industry value added is a measure of an industry's contribution to overall gross domestic product. KTI industries include high R&D intensive and medium-high R&D intensive industries based on a classification by the Organisation for Economic Co-operation and Development. The data have been crosswalked to the International Standard Industrial Classification, Revision 4. See the Technical Appendix for the crosswalking method and Table SKTI-1 for historical data on these industries.
Source(s):
U.S. Bureau of Economic Analysis, Value Added by Industry, accessed 5 October 2021.
Science and Engineering Indicators
The single biggest increase was in the value added generated by the software publishing industry, which increased by over 14% (Figure KTI-2; Table KTI-2). The value added generated by IT and other information services and computer, electronic, and optical products also increased (4% and 3%, respectively); collectively, these industries contributed more than 3 percentage points to the increase in total KTI value added in 2020. ICT industries played a central role in many aspects of the pandemic, including supporting businesses and schools in the transition to remote work and remote learning as well as assisting medical professionals in the digital delivery of healthcare services (Brynjolfsson et al. 2020; Bacher-Hicks, Goodman, and Mulhern 2020; Bokolo 2020).
Other notable increases were in the value added generated by the scientific research and development (12%), medical and dental instruments (10%), and pharmaceuticals (7%) industries. These industries were essential to the production of medicine, medical equipment, and supplies needed to treat the virus and the development of COVID-19 vaccines. They jointly contributed 1.5 percentage points to the increase in total KTI value added as the surge in demand due to the COVID-19 pandemic caused significant shortages in medical supplies (Gereffi 2020; Nagurney, Salarpour, and Dong 2021).
The output of several KTI industries declined from 2019 to 2020, largely as a result of pandemic-induced supply chain disruptions. The value added generated by manufacturing of air and spacecraft, motor vehicles, electrical equipment, other machinery and equipment, and chemicals and chemical products declined (Figure KTI-2). Among these industries, the value added generated by the air and spacecraft industry had the largest decline (24%) and subtracted 1.5 percentage points from the increase in total KTI value added.
Employment in KTI Industries
KTI industries employed approximately 12 million workers, accounting for 8% of total U.S. employment in 2019 and 16% of the STEM workforce (Table SKTI-2). Among KTI industries, the IT and other information services industry employed the most workers, accounting for 32% of the total KTI workforce. The next three largest industries in terms of employment (motor vehicles; computer, electronic and optical products; and other machinery and equipment manufacturers) jointly employed another 32% of workers in KTI industries.
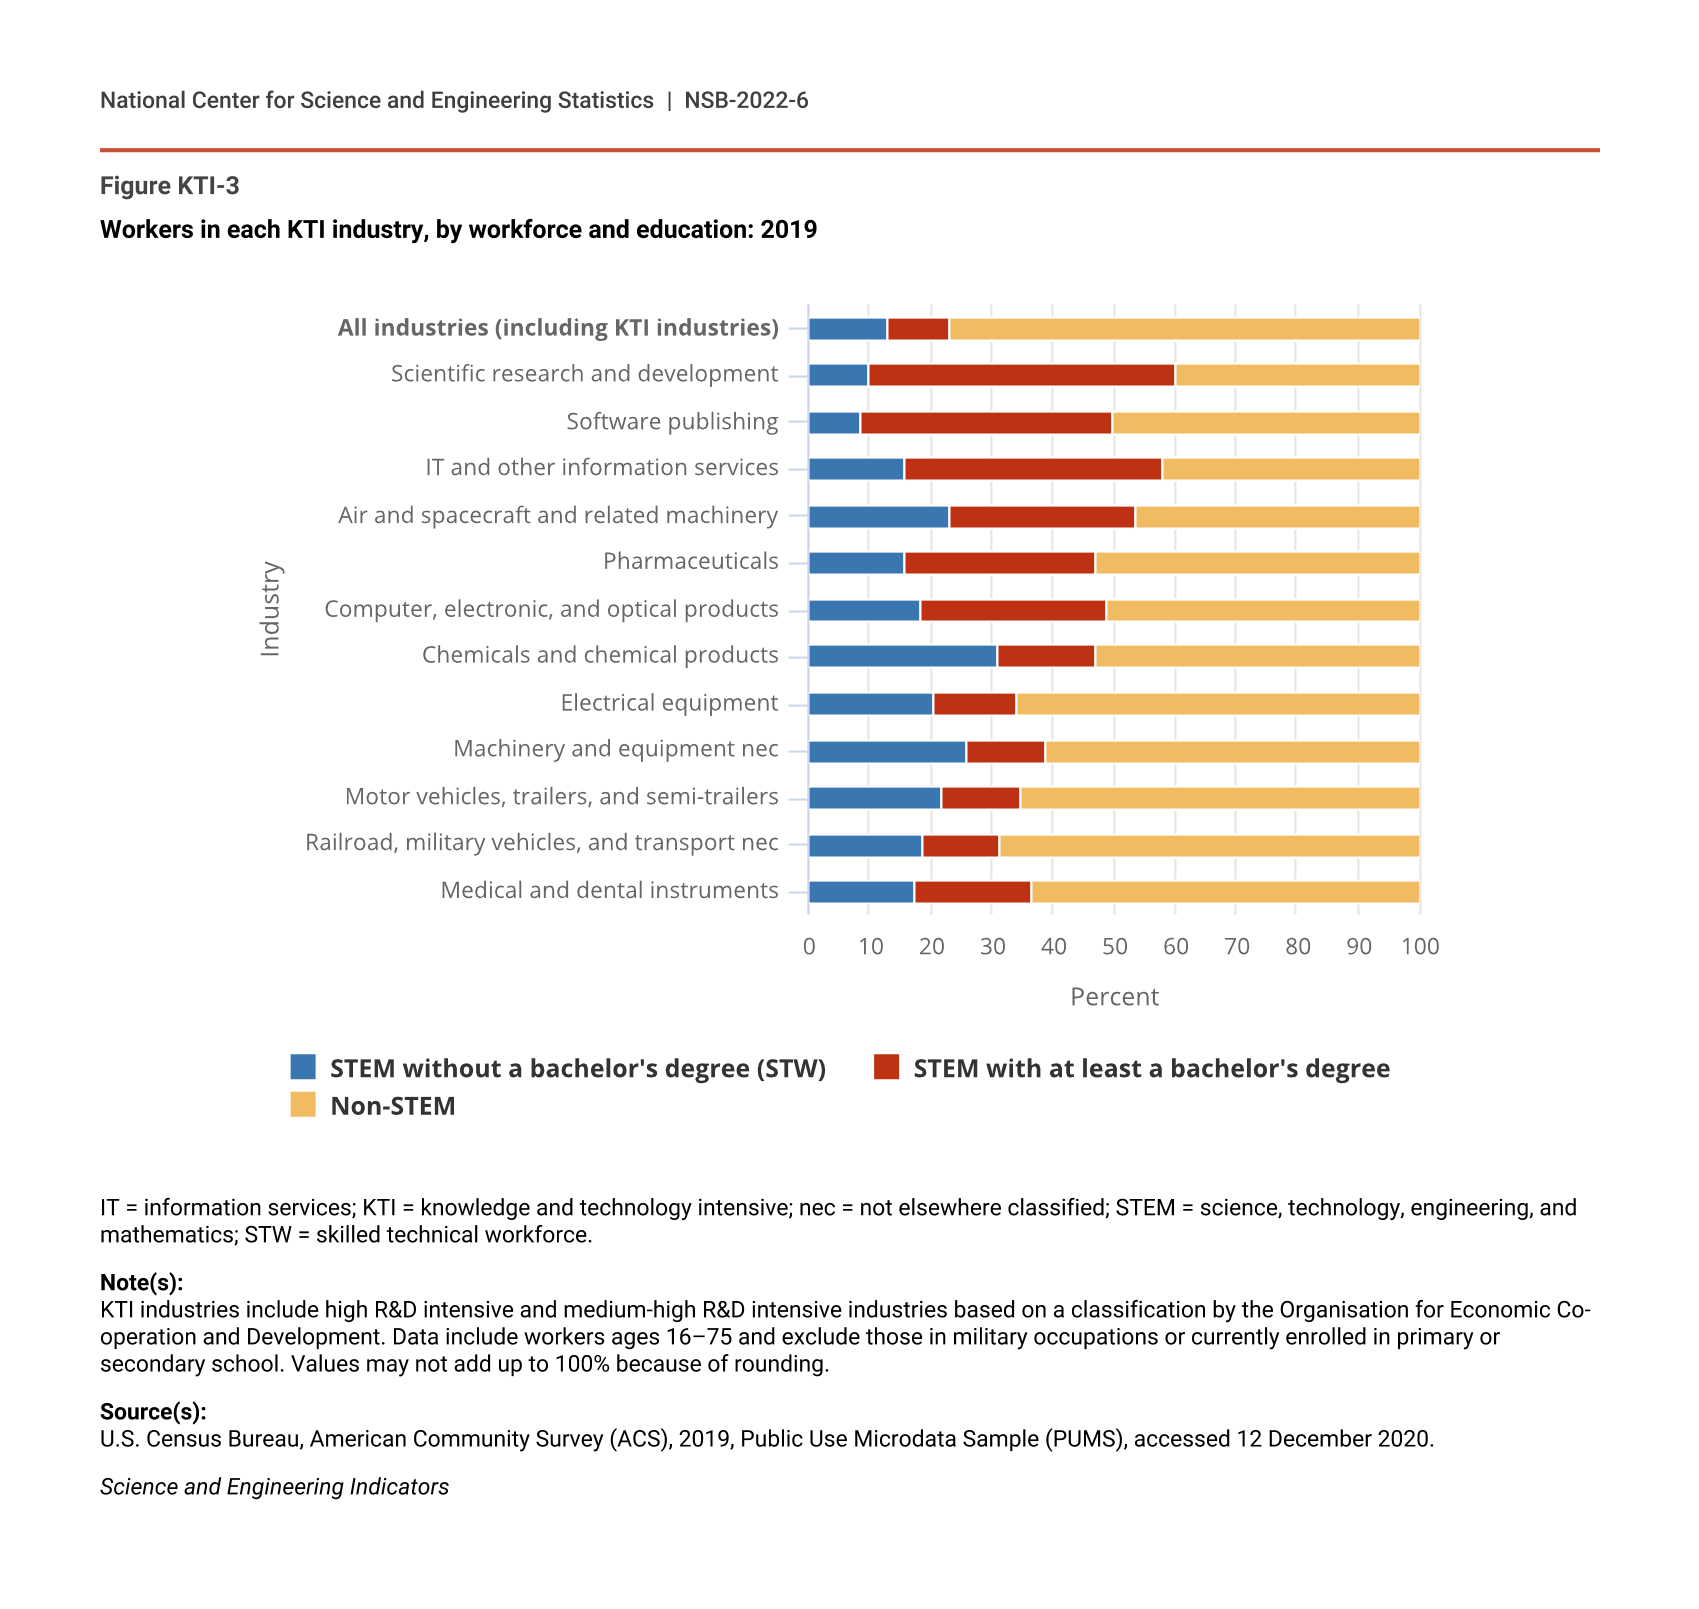
Compared to all industries, KTI industries employed disproportionately more workers in STEM occupations. At the low end, workers in STEM occupations comprised 35% of those employed by motor vehicle manufacturers. At the high end, they comprised 60% of those employed by the scientific research and development industry (Figure KTI-3). In comparison, workers in STEM occupations comprised about a quarter of the U.S. workers across all industries (see Indicators 2022 report, “The STEM Labor Force of Today: Scientists, Engineers, and Skilled Technical Workers”).
Workers in each KTI industry, by workforce and education: 2019
| Industry | STEM without a bachelor's degree (STW) | STEM with at least a bachelor's degree | Non-STEM |
|---|---|---|---|
| All industries (including KTI industries) | 12.8 | 10.4 | 76.8 |
| Scientific research and development | 10.0 | 50.2 | 39.8 |
| Software publishing | 8.4 | 41.5 | 50.0 |
| IT and other information services | 15.8 | 42.1 | 42.1 |
| Air and spacecraft and related machinery | 23.2 | 30.4 | 46.4 |
| Pharmaceuticals | 15.8 | 31.1 | 53.0 |
| Computer, electronic, and optical products | 18.3 | 30.6 | 51.1 |
| Chemicals and chemical products | 31.2 | 15.9 | 52.9 |
| Electrical equipment | 20.4 | 13.9 | 65.7 |
| Machinery and equipment nec | 25.8 | 13.0 | 61.2 |
| Motor vehicles, trailers, and semi-trailers | 21.9 | 13.0 | 65.1 |
| Railroad, military vehicles, and transport nec | 18.7 | 12.6 | 68.6 |
| Medical and dental instruments | 17.3 | 19.3 | 63.4 |
IT = information services; KTI = knowledge and technology intensive; nec = not elsewhere classified; STEM = science, technology, engineering, and mathematics; STW = skilled technical workforce.
Note(s):
KTI industries include high R&D intensive and medium-high R&D intensive industries based on a classification by the Organisation for Economic Co-operation and Development. Data include workers ages 16–75 and exclude those in military occupations or currently enrolled in primary or secondary school. Values may not add up to 100% because of rounding.
Source(s):
U.S. Census Bureau, American Community Survey (ACS), 2019, Public Use Microdata Sample (PUMS), accessed 12 December 2020.
Science and Engineering Indicators
STEM workers without a bachelor’s degree—also called the skilled technical workforce (STW)—were more concentrated in KTI manufacturing industries compared to KTI services industries (Table SKTI-2). The STW made up more than half of STEM workers in five of the nine KTI manufacturing industries. The manufacturing industries that have less than half of their STEM workers without a bachelor’s degree were air and spacecraft, pharmaceuticals, medical and dental instruments, and computer, electronic, and optical products. More than half of STEM workers in the service KTI industries (scientific research and development, software publishing, and IT and other information services) have at least a bachelor’s degree.
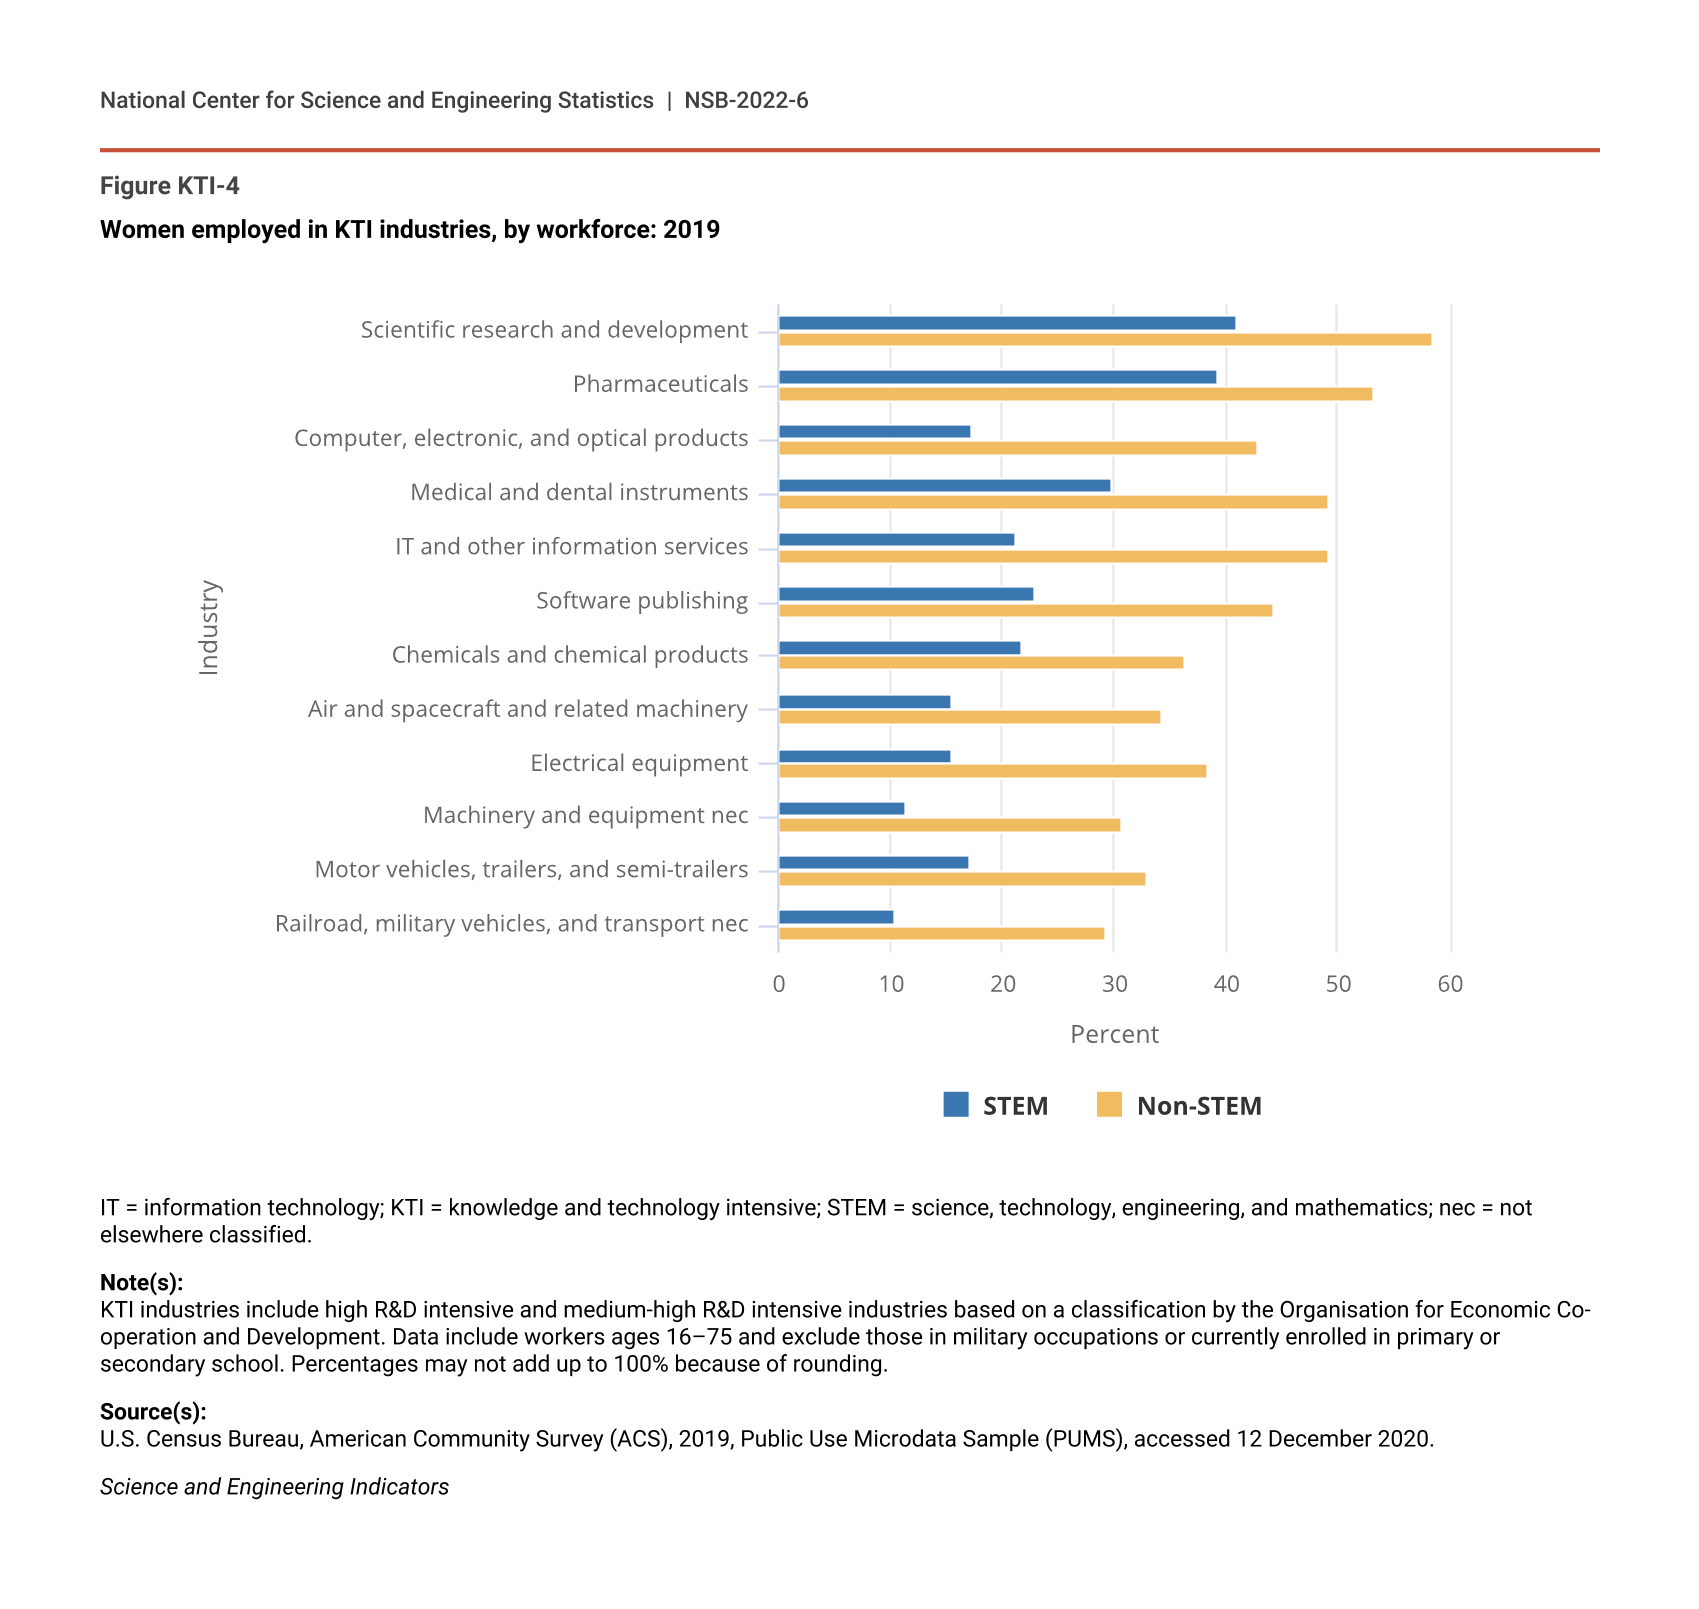
There were disproportionately less women in most KTI industries than in the U.S. population in 2019 (Table SKTI-3). However, the proportions of women employed in the pharmaceuticals (47%) and scientific research and development industries (48%) were similar to the resident U.S. population (51%) (NCSES WMPD 2021: Table 1-1). The proportion of women in the pharmaceuticals and scientific research and development industries falls 7–8 percentage points when analyzing those in STEM occupations only (Figure KTI-4). Overrepresentation of women in non-STEM occupations drives the comparatively large proportion of women in these industries.
Women employed in KTI industries, by workforce: 2019
| Industry | STEM | Non-STEM |
|---|---|---|
| Scientific research and development | 41.0 | 58.5 |
| Pharmaceuticals | 39.3 | 53.2 |
| Computer, electronic, and optical products | 17.4 | 42.8 |
| Medical and dental instruments | 29.9 | 49.1 |
| IT and other information services | 21.2 | 49.1 |
| Software publishing | 22.9 | 44.3 |
| Chemicals and chemical products | 21.8 | 36.3 |
| Air and spacecraft and related machinery | 15.4 | 34.2 |
| Electrical equipment | 15.4 | 38.4 |
| Machinery and equipment nec | 11.3 | 30.8 |
| Motor vehicles, trailers, and semi-trailers | 17.2 | 33.0 |
| Railroad, military vehicles, and transport nec | 10.4 | 29.3 |
IT = information technology; KTI = knowledge and technology intensive; STEM = science, technology, engineering, and mathematics; nec = not elsewhere classified.
Note(s):
KTI industries include high R&D intensive and medium-high R&D intensive industries based on a classification by the Organisation for Economic Co-operation and Development. Data include workers ages 16–75 and exclude those in military occupations or currently enrolled in primary or secondary school. Percentages may not add up to 100% because of rounding.
Source(s):
U.S. Census Bureau, American Community Survey (ACS), 2019, Public Use Microdata Sample (PUMS), accessed 12 December 2020.
Science and Engineering Indicators
Other underrepresented groups, including Blacks or African Americans, Hispanics or Latinos, and American Indians or Alaska Natives—also known as underrepresented minorities—are also less represented in KTI industries (19%) compared to their representation in the resident U.S. population (32%) (NCSES WMPD 2021: Table 1-2). The highest proportion of underrepresented minorities employed in KTI are in the motor vehicles (27%), chemicals (26%) and the electrical equipment (24%) industries across all occupations (Table SKTI-3). Among occupations categorized as STEM, underrepresented minorities make up a lower proportion (16%) of workers in KTI industries.
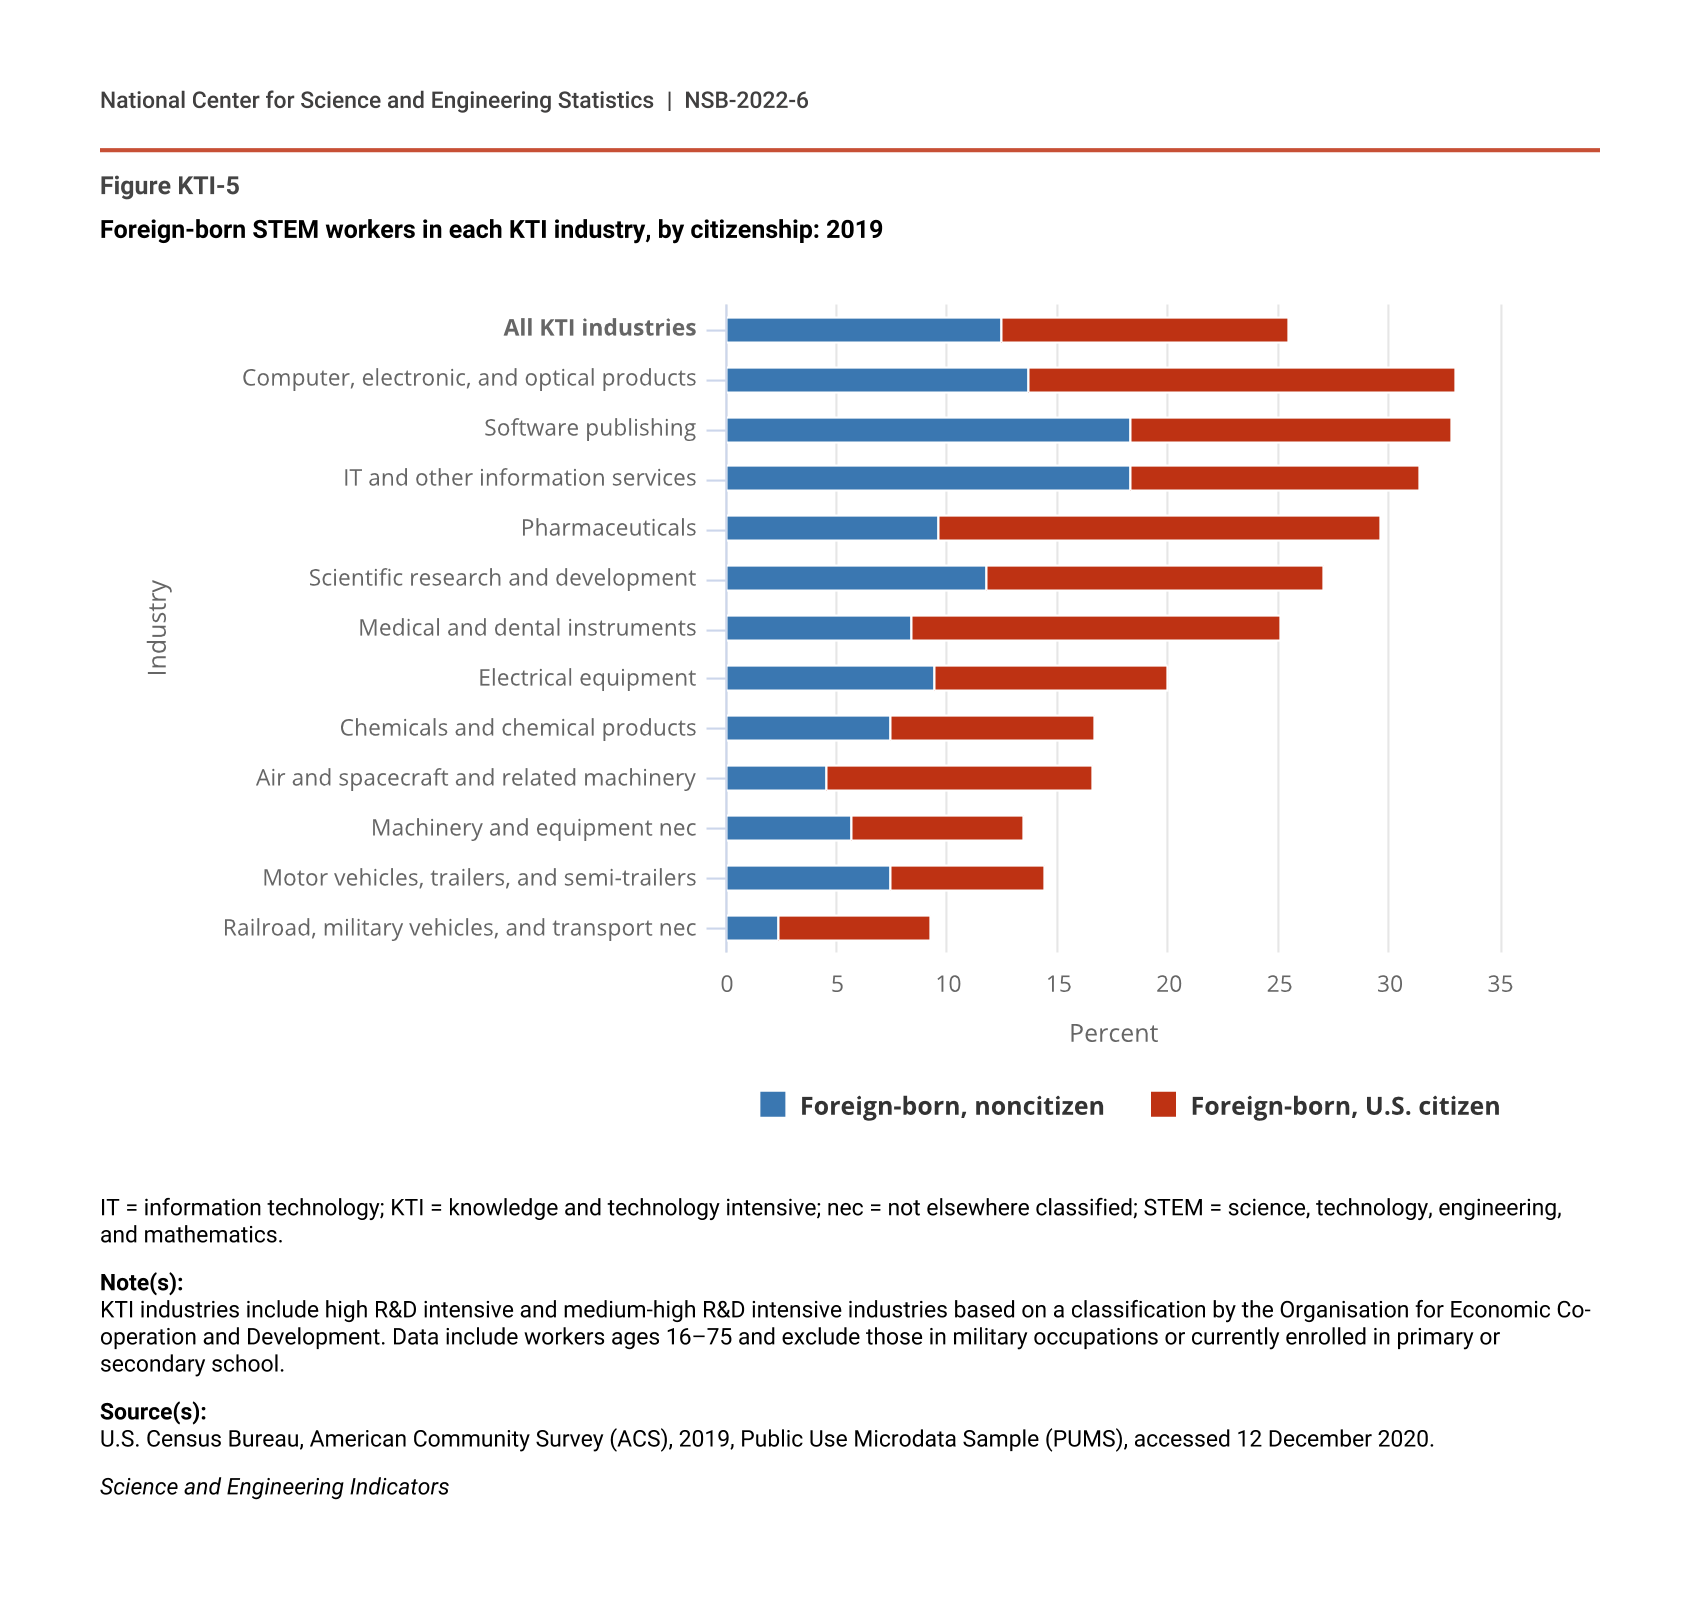
Foreign-born workers are a large proportion of STEM workers across all KTI industries (26%) (Figure KTI-5). However, foreign-born workers make up proportionately more than the average in all the service KTI industries (IT and other information services, scientific research and development, and software publishing); pharmaceuticals; and computer, electronic, and optical products. This relationship holds for workers in non-STEM occupations as well, although the prevalence of foreign-born workers in STEM occupations is generally higher than in the non-STEM occupations (Table SKTI-3). In general, KTI industries with the highest concentrations of foreign-born workers are those industries with the highest concentrations of workers with at least a bachelor’s degree.
Foreign-born STEM workers in each KTI industry, by citizenship: 2019
| Industry | Foreign-born, noncitizen | Foreign-born, U.S. citizen |
|---|---|---|
| All KTI industries | 12.5 | 13.0 |
| Computer, electronic, and optical products | 13.7 | 19.3 |
| Software publishing | 18.3 | 14.5 |
| IT and other information services | 18.3 | 13.1 |
| Pharmaceuticals | 9.6 | 20.0 |
| Scientific research and development | 11.8 | 15.3 |
| Medical and dental instruments | 8.4 | 16.7 |
| Electrical equipment | 9.4 | 10.6 |
| Chemicals and chemical products | 7.5 | 9.2 |
| Air and spacecraft and related machinery | 4.5 | 12.1 |
| Machinery and equipment nec | 5.7 | 7.8 |
| Motor vehicles, trailers, and semi-trailers | 7.5 | 6.9 |
| Railroad, military vehicles, and transport nec | 2.4 | 6.8 |
IT = information technology; KTI = knowledge and technology intensive; nec = not elsewhere classified; STEM = science, technology, engineering, and mathematics.
Note(s):
KTI industries include high R&D intensive and medium-high R&D intensive industries based on a classification by the Organisation for Economic Co-operation and Development. Data include workers ages 16–75 and exclude those in military occupations or currently enrolled in primary or secondary school.
Source(s):
U.S. Census Bureau, American Community Survey (ACS), 2019, Public Use Microdata Sample (PUMS), accessed 12 December 2020.
Science and Engineering Indicators
Although most foreign-born workers in KTI industries are U.S. citizens, software publishing and IT and other information services had higher than average rates of noncitizen workers (Table SKTI-3). Among STEM workers in the IT and other information services industry, which is the largest employer among the KTI industries, 31% are foreign born—with 13% being U.S. citizens, and 18% being noncitizens (Figure KTI-5). Foreign-born and noncitizen STEM workers in the software publishing industry are similarly distributed.
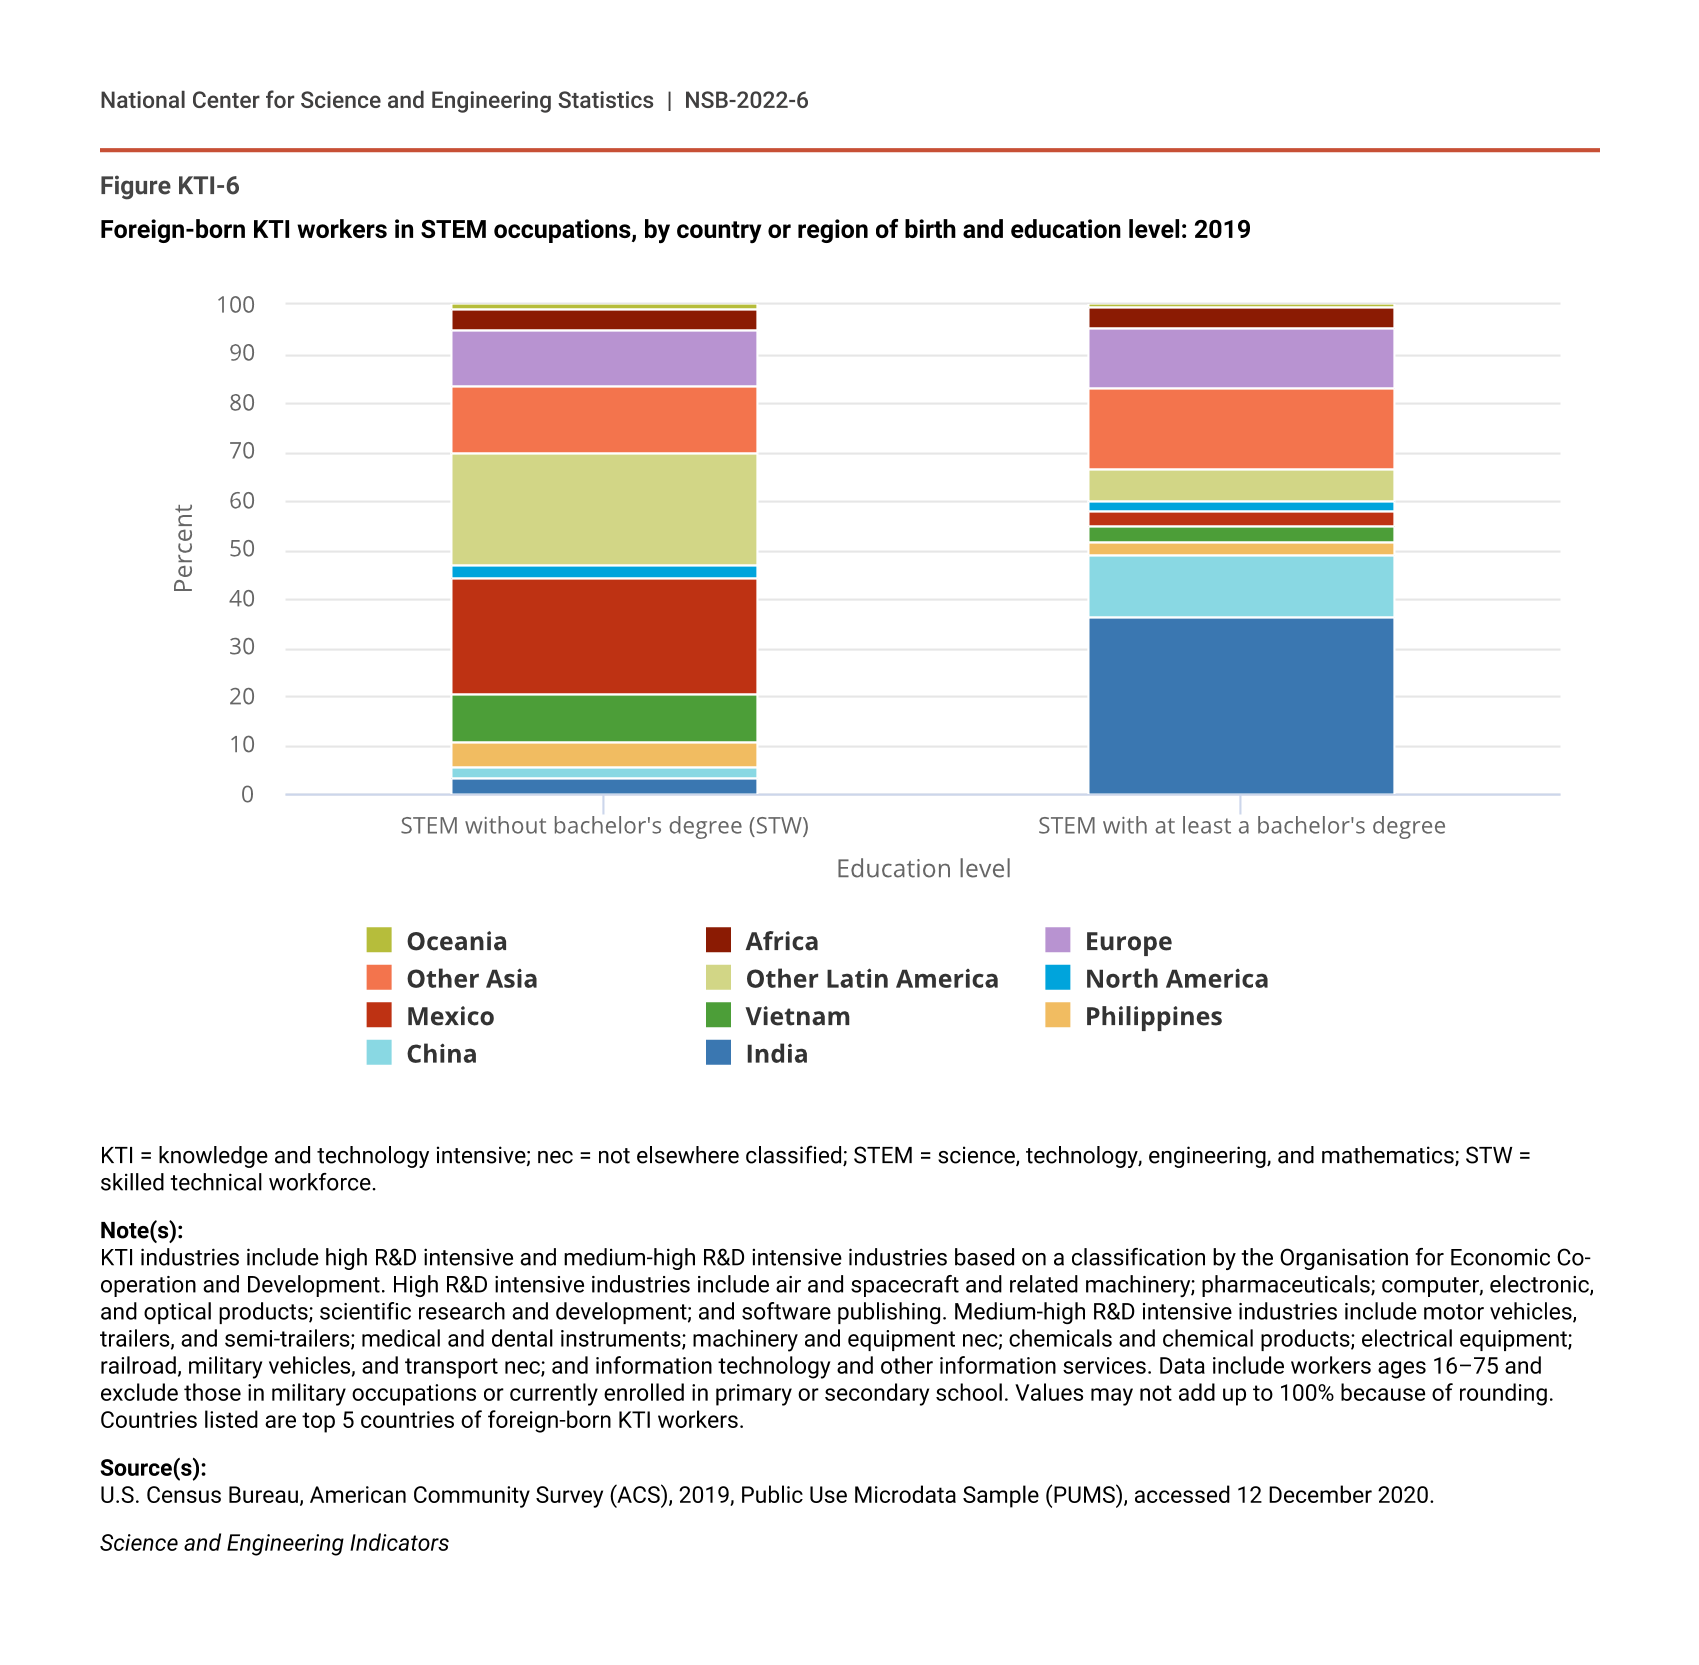
Most foreign-born workers in KTI industries in the STW are from Mexico and other Latin American countries, whereas China, India, and other Asian countries are the primary birth places of those in STEM occupations with a bachelor’s degree or above. In 2019, the top 5 countries of birth for foreign-born workers in all KTI industries were India, China, the Philippines, Vietnam, and Mexico. Almost half of foreign-born STEM workers with a bachelor’s degree or above working in KTI industries were from China and India (Figure KTI-6). Another 29% of these workers were from European and other Asian countries. In contrast, almost a quarter of STEM foreign-born workers without a bachelor’s degree were from Mexico, with almost another fourth from other Latin American countries. Foreign-born workers from Mexico worked proportionately more in non-STEM occupations within KTI industries as well.
Foreign-born KTI workers in STEM occupations, by country or region of birth and education level: 2019
| Education level | India | China | Philippines | Vietnam | Mexico | North America | Other Latin America | Other Asia | Europe | Africa | Oceania |
|---|---|---|---|---|---|---|---|---|---|---|---|
| STEM without bachelor's degree (STW) | 3.2 | 2.2 | 5.3 | 9.6 | 24.1 | 2.3 | 23.1 | 13.6 | 11.7 | 4.2 | 0.8 |
| STEM with at least a bachelor's degree | 36.1 | 12.7 | 2.6 | 3.4 | 3.2 | 2.1 | 6.3 | 16.7 | 12.5 | 3.9 | 0.6 |
KTI = knowledge and technology intensive; nec = not elsewhere classified; STEM = science, technology, engineering, and mathematics; STW = skilled technical workforce.
Note(s):
KTI industries include high R&D intensive and medium-high R&D intensive industries based on a classification by the Organisation for Economic Co-operation and Development. High R&D intensive industries include air and spacecraft and related machinery; pharmaceuticals; computer, electronic, and optical products; scientific research and development; and software publishing. Medium-high R&D intensive industries include motor vehicles, trailers, and semi-trailers; medical and dental instruments; machinery and equipment nec; chemicals and chemical products; electrical equipment; railroad, military vehicles, and transport nec; and information technology and other information services. Data include workers ages 16–75 and exclude those in military occupations or currently enrolled in primary or secondary school. Values may not add up to 100% because of rounding. Countries listed are top 5 countries of foreign-born KTI workers.
Source(s):
U.S. Census Bureau, American Community Survey (ACS), 2019, Public Use Microdata Sample (PUMS), accessed 12 December 2020.
Science and Engineering Indicators
KTI Industries in the Global Economy
Globally, KTI industries generated $9.2 trillion in value added in 2019, accounting for almost 12% of global GDP (Table KTI-3). KTI manufacturing industries generated 70% of global KTI value added. However, among the individual industries, IT services led production of KTI output (19% of global KTI value added). Computer, electronic, and optical products (14%), other machinery and equipment (13%), motor vehicles (12%), and chemicals and chemical products (11%) followed as the next-largest global KTI industries. These five industries jointly accounted for 68% of global KTI value added in 2019.
Global KTI industries, by value added and share of global GDP: 2019
GDP = gross domestic product; ISIC, Rev.4 = International Standard Industrial Classification, Revision 4; IT = information technology; KTI = knowledge and technology intensive; nec = not elsewhere classified.
Note(s):
Value added is the amount contributed by a country, an industry, or other entity to the value of a good or service and excludes purchases of domestic and imported materials and inputs. KTI industries include high R&D intensive and medium-high R&D intensive industries based on a classification by the Organisation for Economic Co-operation and Development. The global values above do not include all countries and economies due to limitations in data availability. See Table SKTI-4 for a list of countries and economies for which data are available and Table SKTI-5 through Table SKTI-19 for historical country-level data on these industries.
Source(s):
U.S. Bureau of Economic Analysis, Value Added by Industry, accessed 5 October 2021; IHS Markit, special tabulations (2021) of the Comparative Industry Service.
Science and Engineering Indicators
Global KTI production is highly concentrated geographically (Table SKTI-5). The United States and China were the world’s largest producers of KTI output in 2019, each with a 25% share of global KTI value added. Japan (8%) and Germany (6%) came next, followed by South Korea (4%), the United Kingdom (3%), and France (2%). These top 7 countries accounted for almost three-fourths (73%) of global KTI value added. Other countries with sizable KTI production in 2019 were India, Italy, and Taiwan, each with a global value-added share between 1.5% and 2.5%.
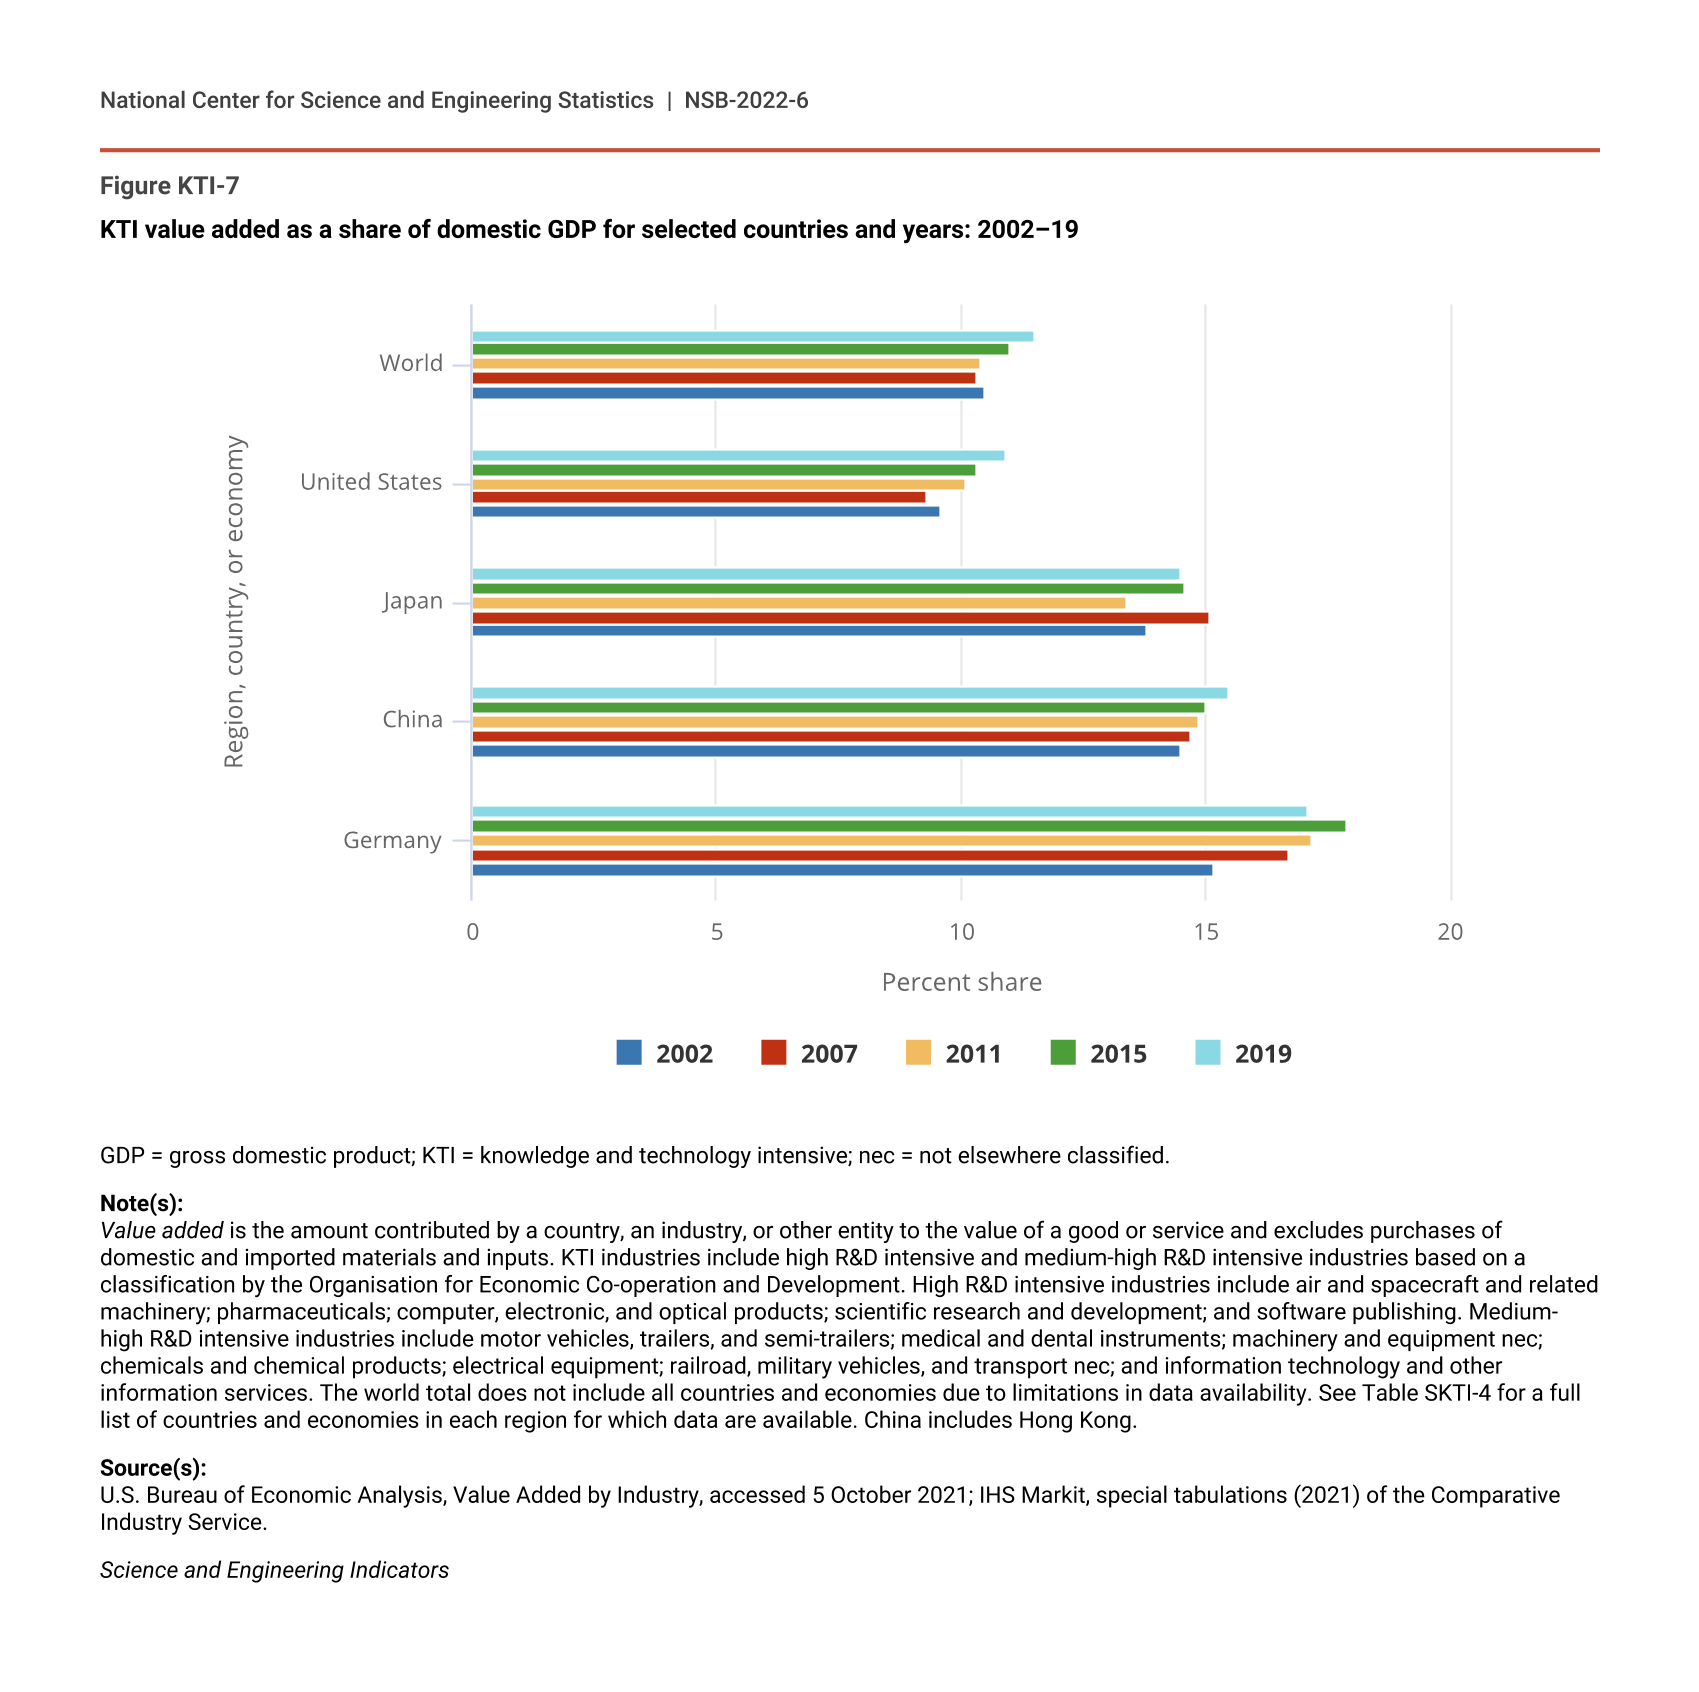
The contribution of KTI industries to a nation’s economy varies among the top KTI producers. In 2019, the KTI share of U.S. GDP was near the global average (11% of GDP) (Figure KTI-7). In contrast, Germany’s share was considerably larger at 17%. China and Japan also had KTI shares of national GDP that are larger (14%–15%) than the global average. These shares have been slowly increasing in the United States and China. Germany’s share has increased from 15% in 2002 to 17% in 2019, and Japan’s share has fluctuated between 13% and 15% during this period.
KTI value added as a share of domestic GDP for selected countries and years: 2002–19
| Region, country, or economy | 2002 | 2007 | 2011 | 2015 | 2019 |
|---|---|---|---|---|---|
| Germany | 15.2 | 16.7 | 17.2 | 17.9 | 17.1 |
| China | 14.5 | 14.7 | 14.9 | 15.0 | 15.5 |
| Japan | 13.8 | 15.1 | 13.4 | 14.6 | 14.5 |
| United States | 9.6 | 9.3 | 10.1 | 10.3 | 10.9 |
| World | 10.5 | 10.3 | 10.4 | 11.0 | 11.5 |
GDP = gross domestic product; KTI = knowledge and technology intensive; nec = not elsewhere classified.
Note(s):
Value added is the amount contributed by a country, an industry, or other entity to the value of a good or service and excludes purchases of domestic and imported materials and inputs. KTI industries include high R&D intensive and medium-high R&D intensive industries based on a classification by the Organisation for Economic Co-operation and Development. High R&D intensive industries include air and spacecraft and related machinery; pharmaceuticals; computer, electronic, and optical products; scientific research and development; and software publishing. Medium-high R&D intensive industries include motor vehicles, trailers, and semi-trailers; medical and dental instruments; machinery and equipment nec; chemicals and chemical products; electrical equipment; railroad, military vehicles, and transport nec; and information technology and other information services. The world total does not include all countries and economies due to limitations in data availability. See Table SKTI-4 for a full list of countries and economies in each region for which data are available. China includes Hong Kong.
Source(s):
U.S. Bureau of Economic Analysis, Value Added by Industry, accessed 5 October 2021; IHS Markit, special tabulations (2021) of the Comparative Industry Service.
Science and Engineering Indicators
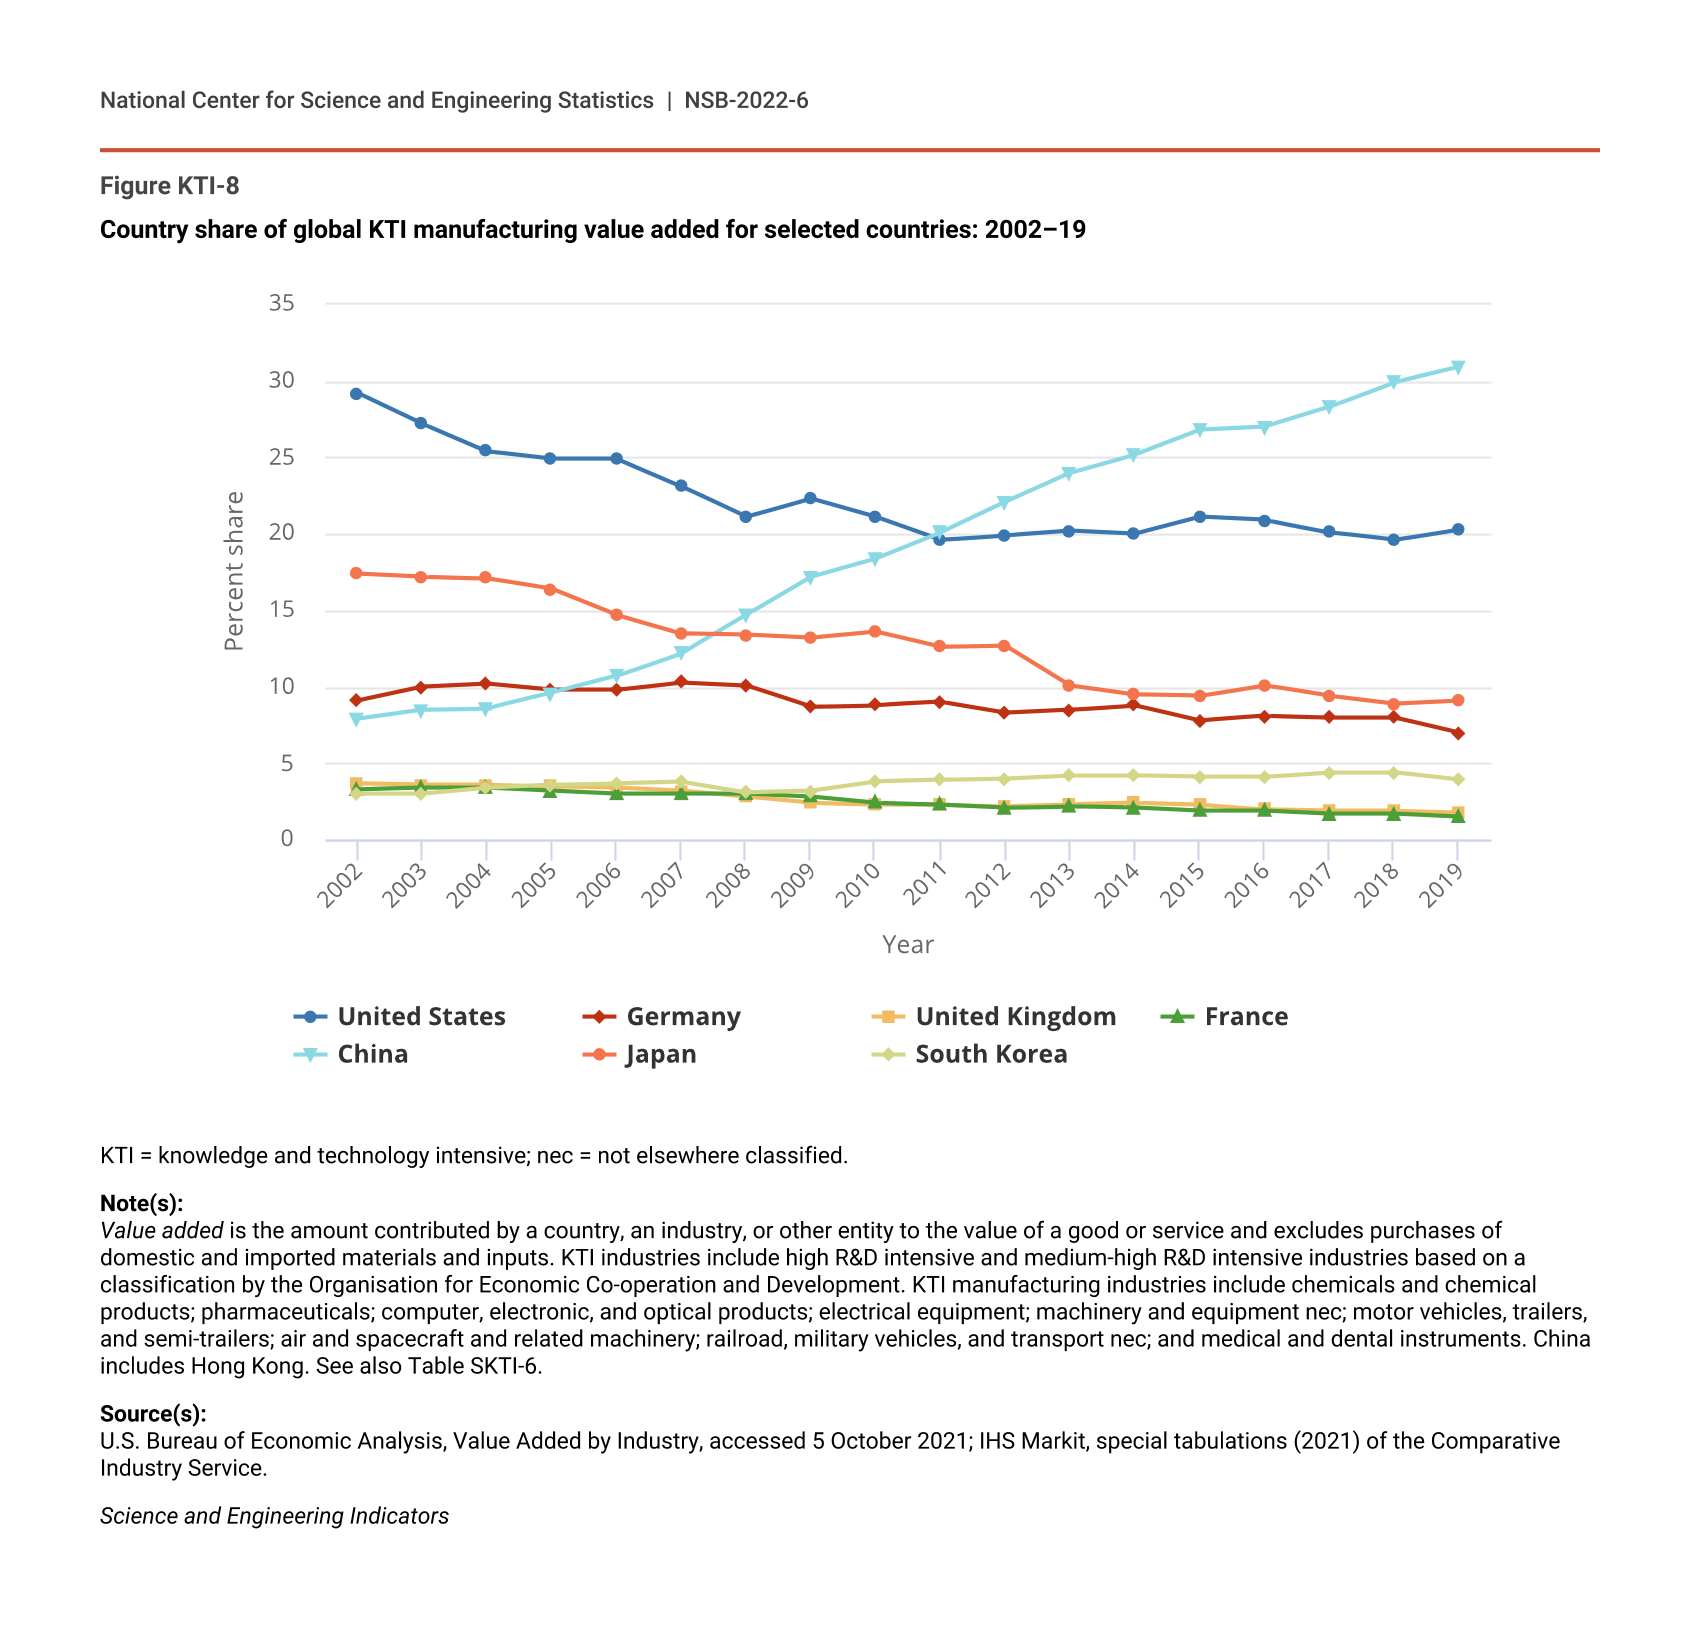
The global value added by KTI manufacturing industries has more than doubled since 2002, most of which is attributable to China (Figure KTI-8; Table SKTI-6). China has emerged as a major producer in these industries over the last decade as its global value-added share has increased rapidly from 8% in 2002 to 31% in 2019. The U.S. global share has fluctuated between 20% and 21% since 2011, having declined from 29% in 2002. Japan is also a major producer; however, Japan’s production of KTI manufacturing output has experienced declines over this period, and its global share has declined sharply from 17% in 2002 to 9% in 2019. Japan’s declines in these industries coincide with slow labor force and economic growth as well as the transfer of production to China and other countries (Funabashi and Kushner 2015).
Country share of global KTI manufacturing value added for selected countries: 2002–19
| Year | United States | Germany | United Kingdom | France | China | Japan | South Korea |
|---|---|---|---|---|---|---|---|
| 2002 | 29.2 | 9.1 | 3.7 | 3.3 | 7.9 | 17.4 | 3.0 |
| 2003 | 27.2 | 10.0 | 3.6 | 3.4 | 8.5 | 17.2 | 3.0 |
| 2004 | 25.4 | 10.2 | 3.6 | 3.4 | 8.6 | 17.1 | 3.4 |
| 2005 | 24.9 | 9.8 | 3.5 | 3.2 | 9.6 | 16.4 | 3.6 |
| 2006 | 24.9 | 9.8 | 3.4 | 3.0 | 10.7 | 14.7 | 3.7 |
| 2007 | 23.1 | 10.3 | 3.2 | 3.0 | 12.2 | 13.5 | 3.8 |
| 2008 | 21.1 | 10.1 | 2.8 | 3.0 | 14.7 | 13.4 | 3.1 |
| 2009 | 22.3 | 8.7 | 2.4 | 2.8 | 17.2 | 13.2 | 3.2 |
| 2010 | 21.1 | 8.8 | 2.3 | 2.4 | 18.4 | 13.6 | 3.8 |
| 2011 | 19.6 | 9.0 | 2.3 | 2.3 | 20.1 | 12.6 | 3.9 |
| 2012 | 19.9 | 8.3 | 2.2 | 2.1 | 22.1 | 12.7 | 4.0 |
| 2013 | 20.2 | 8.5 | 2.3 | 2.2 | 24.0 | 10.1 | 4.2 |
| 2014 | 20.0 | 8.8 | 2.4 | 2.1 | 25.2 | 9.5 | 4.2 |
| 2015 | 21.1 | 7.8 | 2.3 | 1.9 | 26.8 | 9.4 | 4.1 |
| 2016 | 20.9 | 8.1 | 2.0 | 1.9 | 27.0 | 10.1 | 4.1 |
| 2017 | 20.1 | 8.0 | 1.9 | 1.7 | 28.3 | 9.4 | 4.4 |
| 2018 | 19.6 | 8.0 | 1.9 | 1.7 | 29.9 | 8.9 | 4.4 |
| 2019 | 20.3 | 7.0 | 1.8 | 1.5 | 30.9 | 9.1 | 3.9 |
KTI = knowledge and technology intensive; nec = not elsewhere classified.
Note(s):
Value added is the amount contributed by a country, an industry, or other entity to the value of a good or service and excludes purchases of domestic and imported materials and inputs. KTI industries include high R&D intensive and medium-high R&D intensive industries based on a classification by the Organisation for Economic Co-operation and Development. KTI manufacturing industries include chemicals and chemical products; pharmaceuticals; computer, electronic, and optical products; electrical equipment; machinery and equipment nec; motor vehicles, trailers, and semi-trailers; air and spacecraft and related machinery; railroad, military vehicles, and transport nec; and medical and dental instruments. China includes Hong Kong. See also Table SKTI-6.
Source(s):
U.S. Bureau of Economic Analysis, Value Added by Industry, accessed 5 October 2021; IHS Markit, special tabulations (2021) of the Comparative Industry Service.
Science and Engineering Indicators
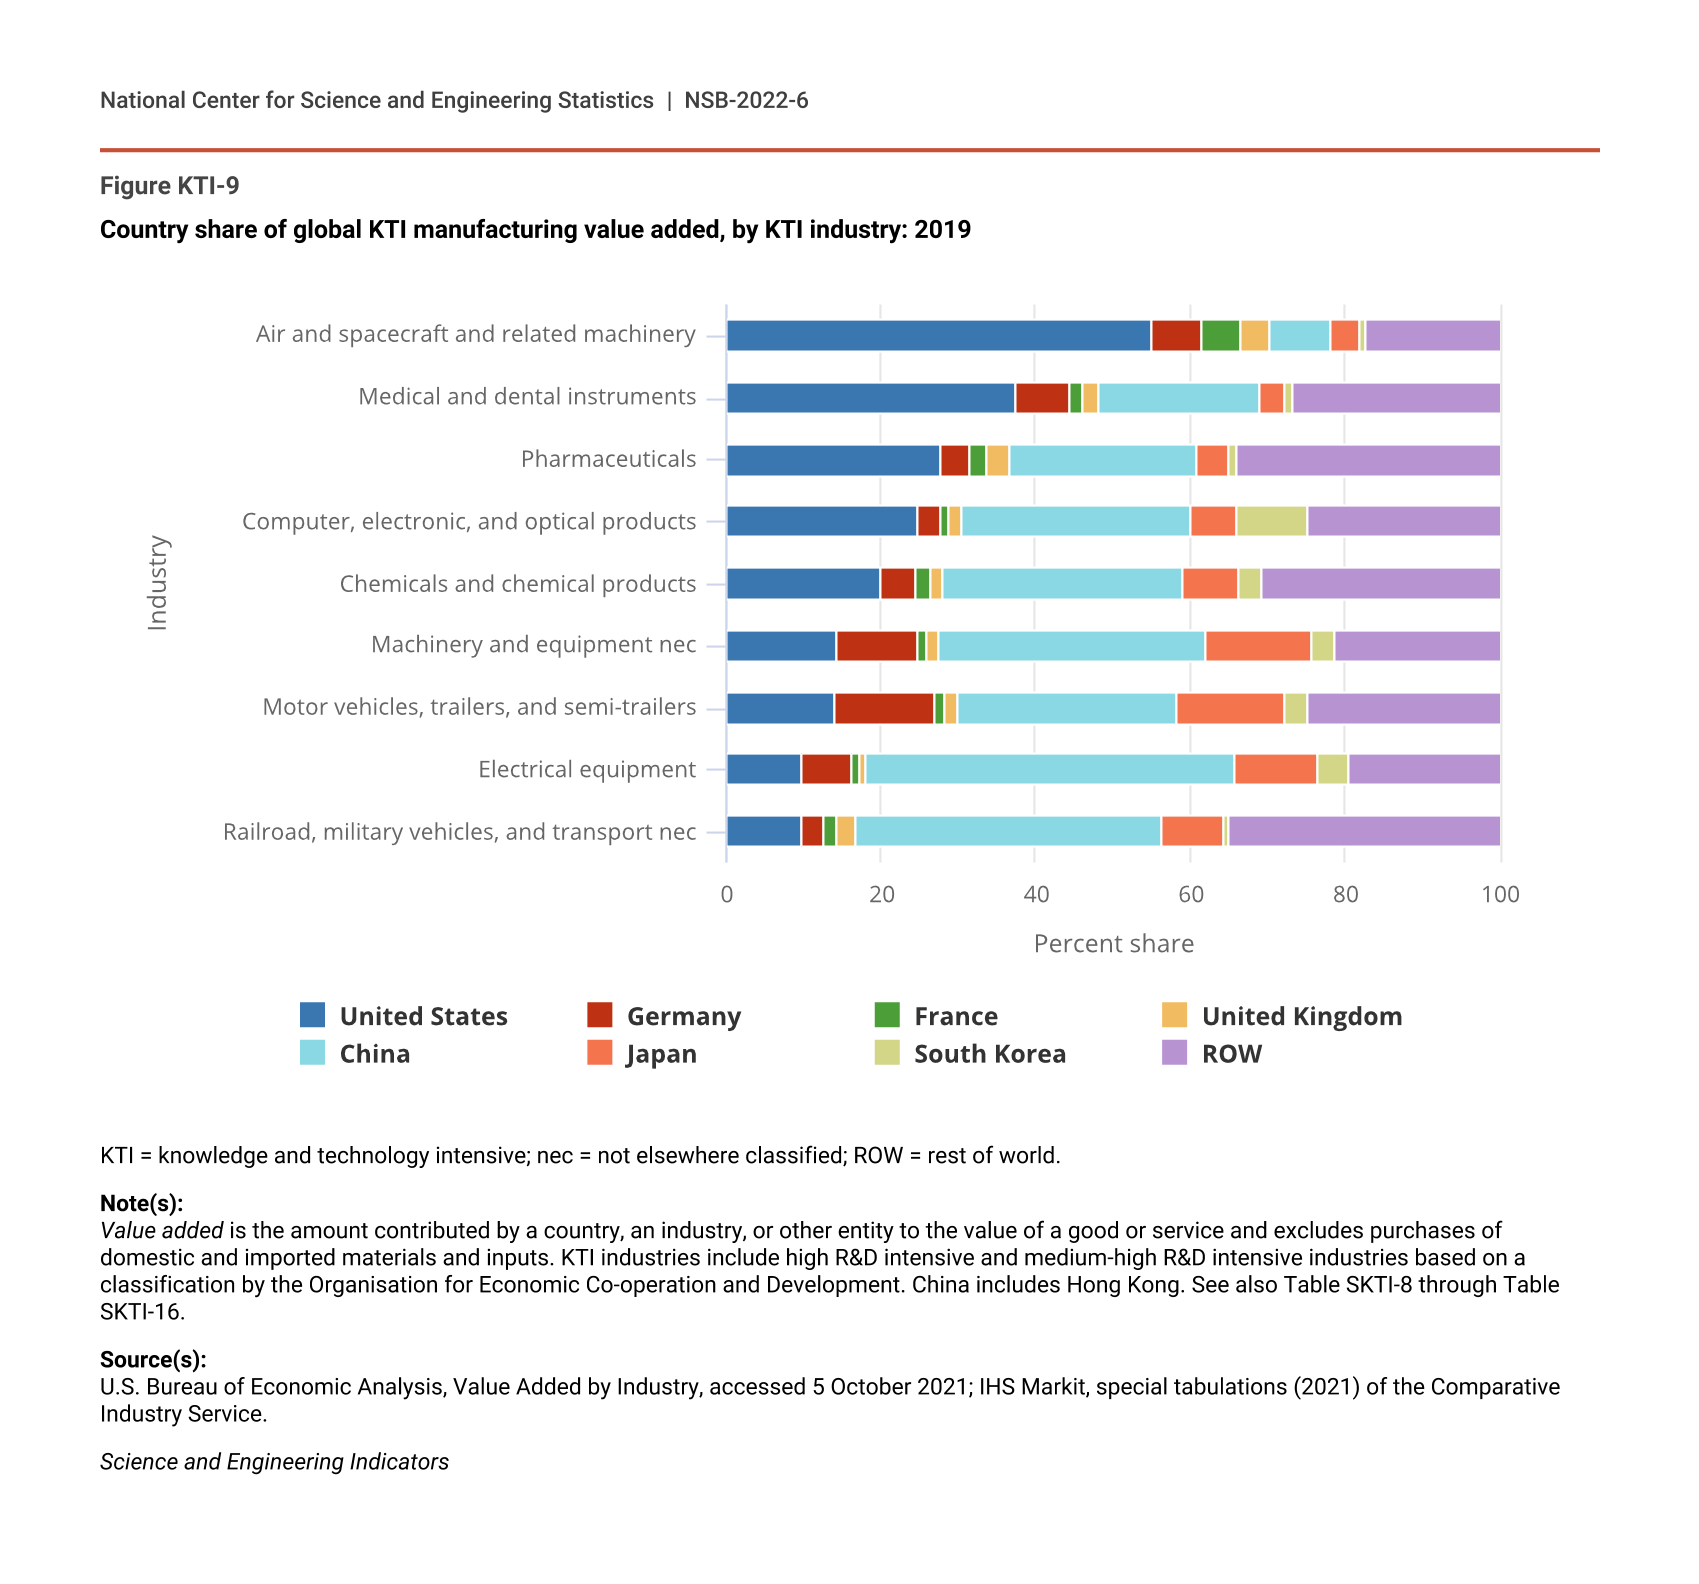
The United States accounted for the largest shares of value added generated by three KTI manufacturing industries worldwide—air and spacecraft, medical and dental instruments, and pharmaceuticals (Figure KTI-9; Table SKTI-9, Table SKTI-14, and Table SKTI-16). The United States accounts for 55% of the global value added generated by the air and spacecraft industry, 38% of medical and dental instruments, and 28% of pharmaceuticals. China continues to have a small global presence in manufacturing of air and spacecraft (8% of global value added in 2019) but has markedly increased its global presence in production of medical and dental instruments (from 8% in 2002 to 21% in 2019) as well as pharmaceuticals (from 6% in 2002 to 24% in 2019). The rapidly expanding middle class, reform of China’s health care system, and increasing demand for health care have fueled the rapid expansion of China’s pharmaceuticals industry (Hsu 2015). Many multinational biopharmaceutical companies have established R&D facilities in China to access the country’s domestic market, and a growing number of Chinese companies have increased their investment in R&D (Chen and Zhao 2018).
Country share of global KTI manufacturing value added, by KTI industry: 2019
| Industry | United States | Germany | France | United Kingdom | China | Japan | South Korea | ROW |
|---|---|---|---|---|---|---|---|---|
| Railroad, military vehicles, and transport nec | 9.6 | 3.1 | 1.5 | 2.5 | 39.8 | 8.1 | 0.6 | 35.0 |
| Electrical equipment | 9.8 | 6.4 | 1.0 | 0.8 | 47.8 | 10.7 | 4.0 | 19.5 |
| Motor vehicles, trailers, and semi-trailers | 14.1 | 12.9 | 1.2 | 1.8 | 28.2 | 14.0 | 2.8 | 24.9 |
| Machinery and equipment nec | 14.4 | 10.4 | 1.1 | 1.7 | 34.5 | 13.6 | 3.2 | 21.2 |
| Chemicals and chemical products | 19.8 | 4.8 | 1.9 | 1.5 | 31.0 | 7.2 | 2.9 | 30.8 |
| Computer, electronic, and optical products | 24.7 | 3.1 | 1.1 | 1.4 | 29.7 | 6.1 | 8.9 | 24.9 |
| Pharmaceuticals | 27.7 | 3.8 | 2.2 | 2.9 | 24.2 | 4.1 | 1.1 | 34.0 |
| Medical and dental instruments | 37.5 | 6.8 | 1.8 | 2.2 | 20.6 | 3.2 | 1.2 | 26.6 |
| Air and spacecraft and related machinery | 55.0 | 6.7 | 5.1 | 3.6 | 8.0 | 3.6 | 0.8 | 17.4 |
KTI = knowledge and technology intensive; nec = not elsewhere classified; ROW = rest of world.
Note(s):
Value added is the amount contributed by a country, an industry, or other entity to the value of a good or service and excludes purchases of domestic and imported materials and inputs. KTI industries include high R&D intensive and medium-high R&D intensive industries based on a classification by the Organisation for Economic Co-operation and Development. China includes Hong Kong. See also Table SKTI-8 through Table SKTI-16.
Source(s):
U.S. Bureau of Economic Analysis, Value Added by Industry, accessed 5 October 2021; IHS Markit, special tabulations (2021) of the Comparative Industry Service.
Science and Engineering Indicators
In 2019, China accounted for the largest global shares of value added generated by electrical equipment (48%), railroad and other transport equipment (40%), other machinery and equipment (34%), computer, electronic, and optical products (30%), motor vehicles (28%), and chemicals and chemical products (31%) (Figure KTI-9). Much of these industries’ rapid growth over the last decade is attributable to China. The value added generated by the electrical equipment industry worldwide grew nearly threefold since 2002, with China’s global share quadrupling from 12% to 48% (Table SKTI-11). China’s global share also more than quadrupled in the other machinery and equipment industry, from 8% in 2002 to 34% in 2019 (Table SKTI-12).
China’s computer, electronic, and optical products value added has grown nearly eightfold since 2002, becoming the world’s largest producer in 2014 and remaining so ever since (Table SKTI-10). The United States is the second-largest producer (25% global value-added share). Japan’s value added in this industry has declined, and so has its global share (from 18% in 2002 to 6% in 2019). Other Asian countries—South Korea, Taiwan, India, Indonesia, Malaysia, the Philippines, Singapore, Thailand, and Vietnam—have also increased production in this industry, jointly accounting for 23% of the global value added in 2019.
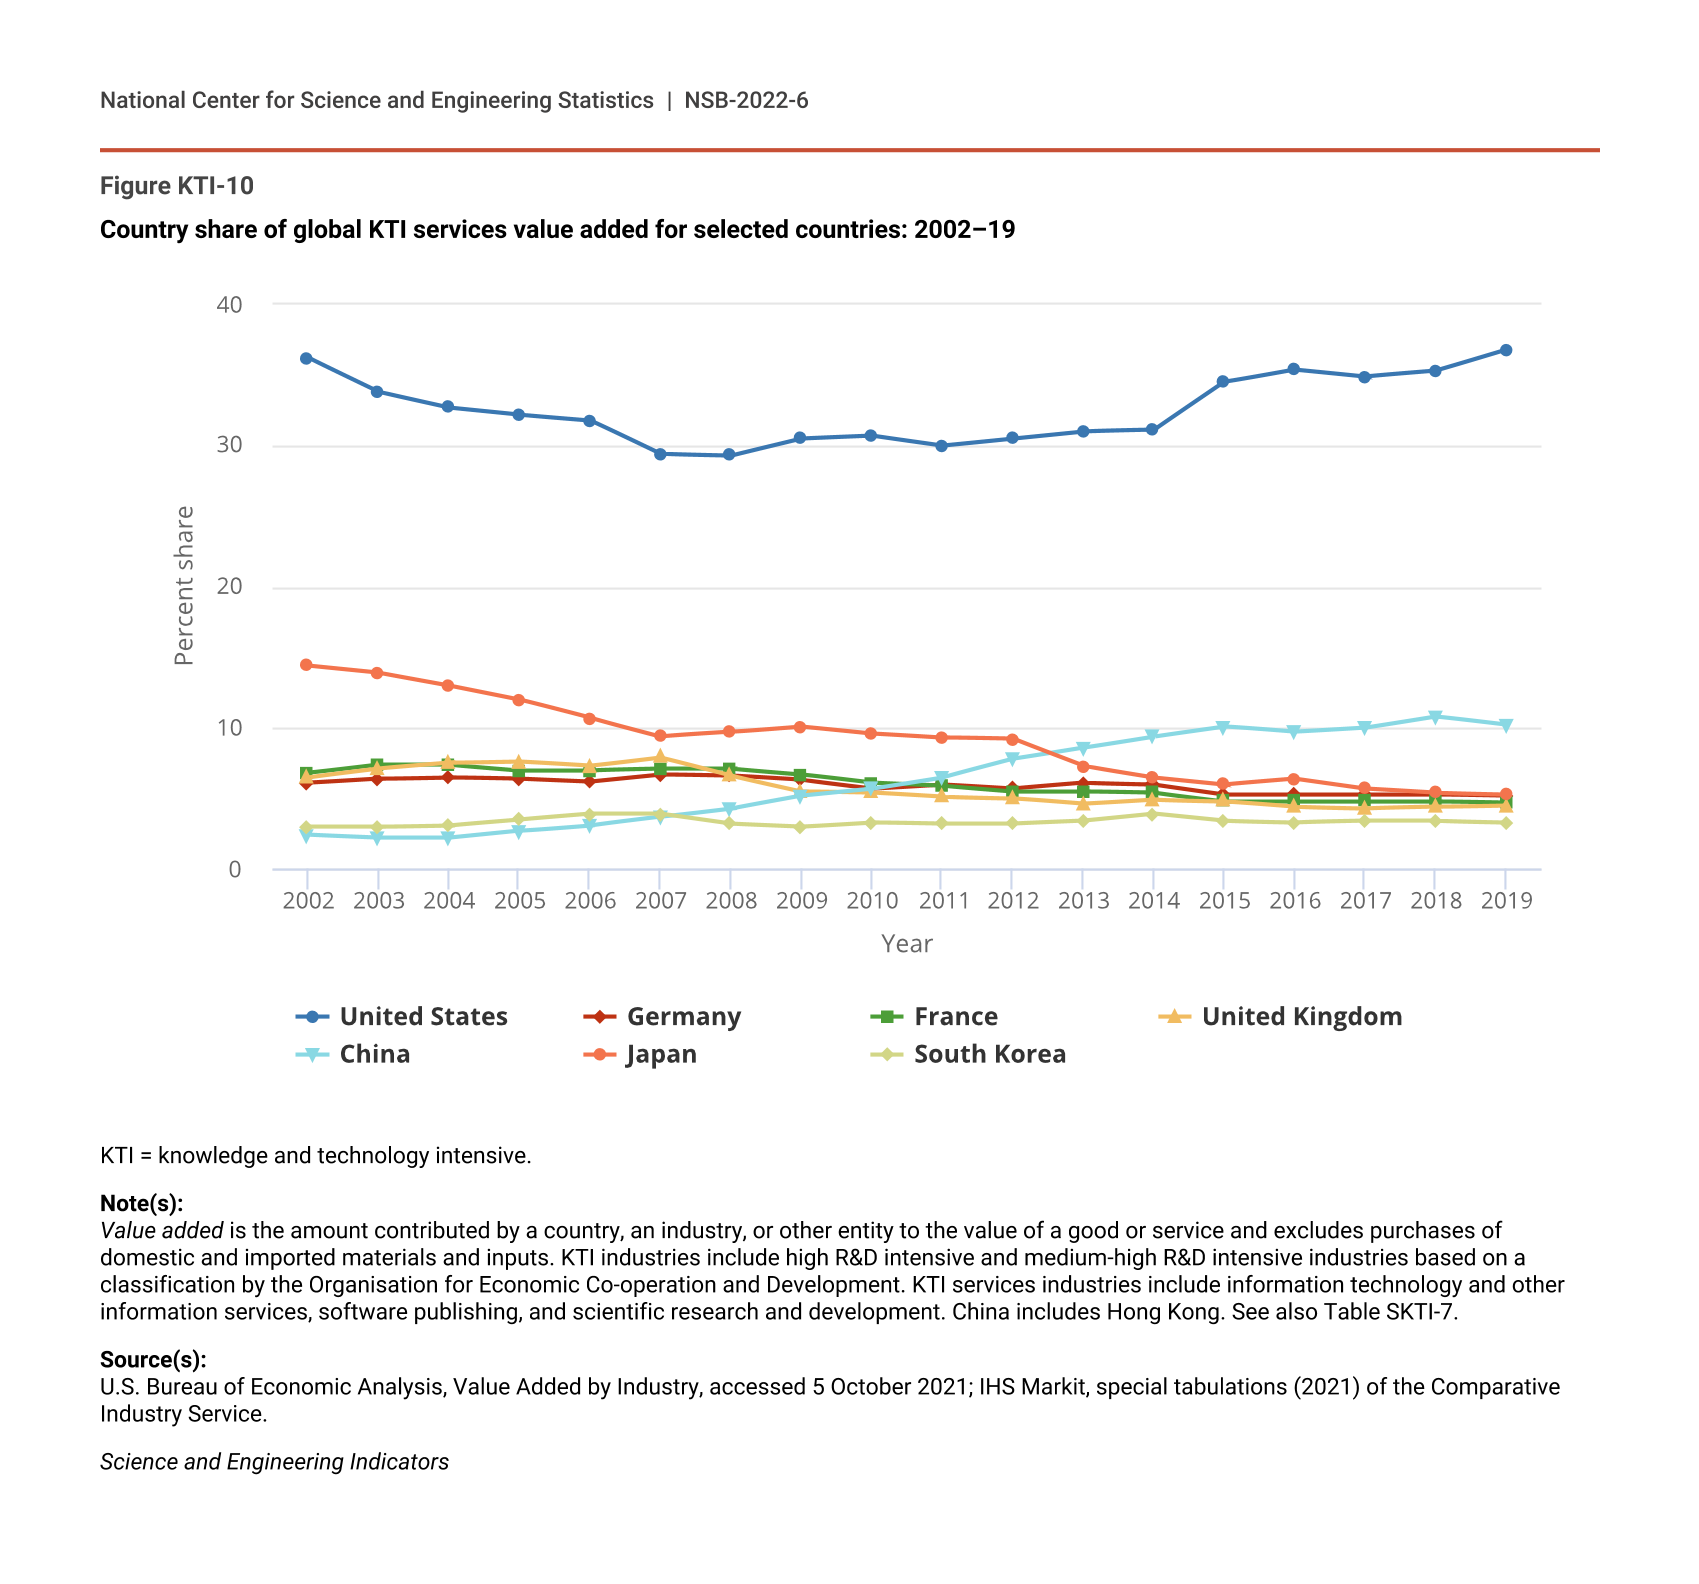
The United States leads global production in KTI services industries, accounting for 37% of the global value added generated by these industries in 2019 (Figure KTI-10; Table SKTI-7). The U.S. global share of value added generated by KTI services has increased over the last decade after a decline in the early 2000s and stabilization around 30%. Other major KTI producers have global shares that are much lower. Germany, France, and the United Kingdom have global shares that have remained around 4%–6% since 2010. China’s global share has fluctuated between 10% and 11% since 2015, having increased from 2% in 2002. In contrast, Japan’s share has declined substantially, from 14% in 2002 to 5% in 2019.
Country share of global KTI services value added for selected countries: 2002–19
| Year | United States | Germany | France | United Kingdom | China | Japan | South Korea |
|---|---|---|---|---|---|---|---|
| 2002 | 36.2 | 6.1 | 6.8 | 6.5 | 2.4 | 14.4 | 3.0 |
| 2003 | 33.8 | 6.4 | 7.4 | 7.1 | 2.2 | 13.9 | 3.0 |
| 2004 | 32.7 | 6.5 | 7.4 | 7.5 | 2.2 | 13.0 | 3.1 |
| 2005 | 32.2 | 6.4 | 7.0 | 7.6 | 2.7 | 12.0 | 3.5 |
| 2006 | 31.8 | 6.2 | 7.0 | 7.3 | 3.1 | 10.7 | 3.9 |
| 2007 | 29.4 | 6.7 | 7.1 | 7.9 | 3.7 | 9.4 | 3.9 |
| 2008 | 29.3 | 6.6 | 7.1 | 6.6 | 4.3 | 9.7 | 3.2 |
| 2009 | 30.5 | 6.3 | 6.7 | 5.5 | 5.2 | 10.1 | 3.0 |
| 2010 | 30.7 | 5.7 | 6.1 | 5.4 | 5.7 | 9.6 | 3.3 |
| 2011 | 30.0 | 6.0 | 5.9 | 5.1 | 6.5 | 9.3 | 3.2 |
| 2012 | 30.5 | 5.7 | 5.5 | 5.0 | 7.8 | 9.2 | 3.2 |
| 2013 | 31.0 | 6.1 | 5.5 | 4.6 | 8.6 | 7.3 | 3.4 |
| 2014 | 31.1 | 6.0 | 5.4 | 4.9 | 9.4 | 6.5 | 3.9 |
| 2015 | 34.5 | 5.3 | 4.8 | 4.8 | 10.1 | 6.0 | 3.4 |
| 2016 | 35.4 | 5.3 | 4.8 | 4.4 | 9.7 | 6.4 | 3.3 |
| 2017 | 34.9 | 5.3 | 4.8 | 4.3 | 10.0 | 5.7 | 3.4 |
| 2018 | 35.3 | 5.3 | 4.8 | 4.4 | 10.8 | 5.4 | 3.4 |
| 2019 | 36.8 | 5.2 | 4.7 | 4.5 | 10.2 | 5.3 | 3.3 |
KTI = knowledge and technology intensive.
Note(s):
Value added is the amount contributed by a country, an industry, or other entity to the value of a good or service and excludes purchases of domestic and imported materials and inputs. KTI industries include high R&D intensive and medium-high R&D intensive industries based on a classification by the Organisation for Economic Co-operation and Development. KTI services industries include information technology and other information services, software publishing, and scientific research and development. China includes Hong Kong. See also Table SKTI-7.
Source(s):
U.S. Bureau of Economic Analysis, Value Added by Industry, accessed 5 October 2021; IHS Markit, special tabulations (2021) of the Comparative Industry Service.
Science and Engineering Indicators
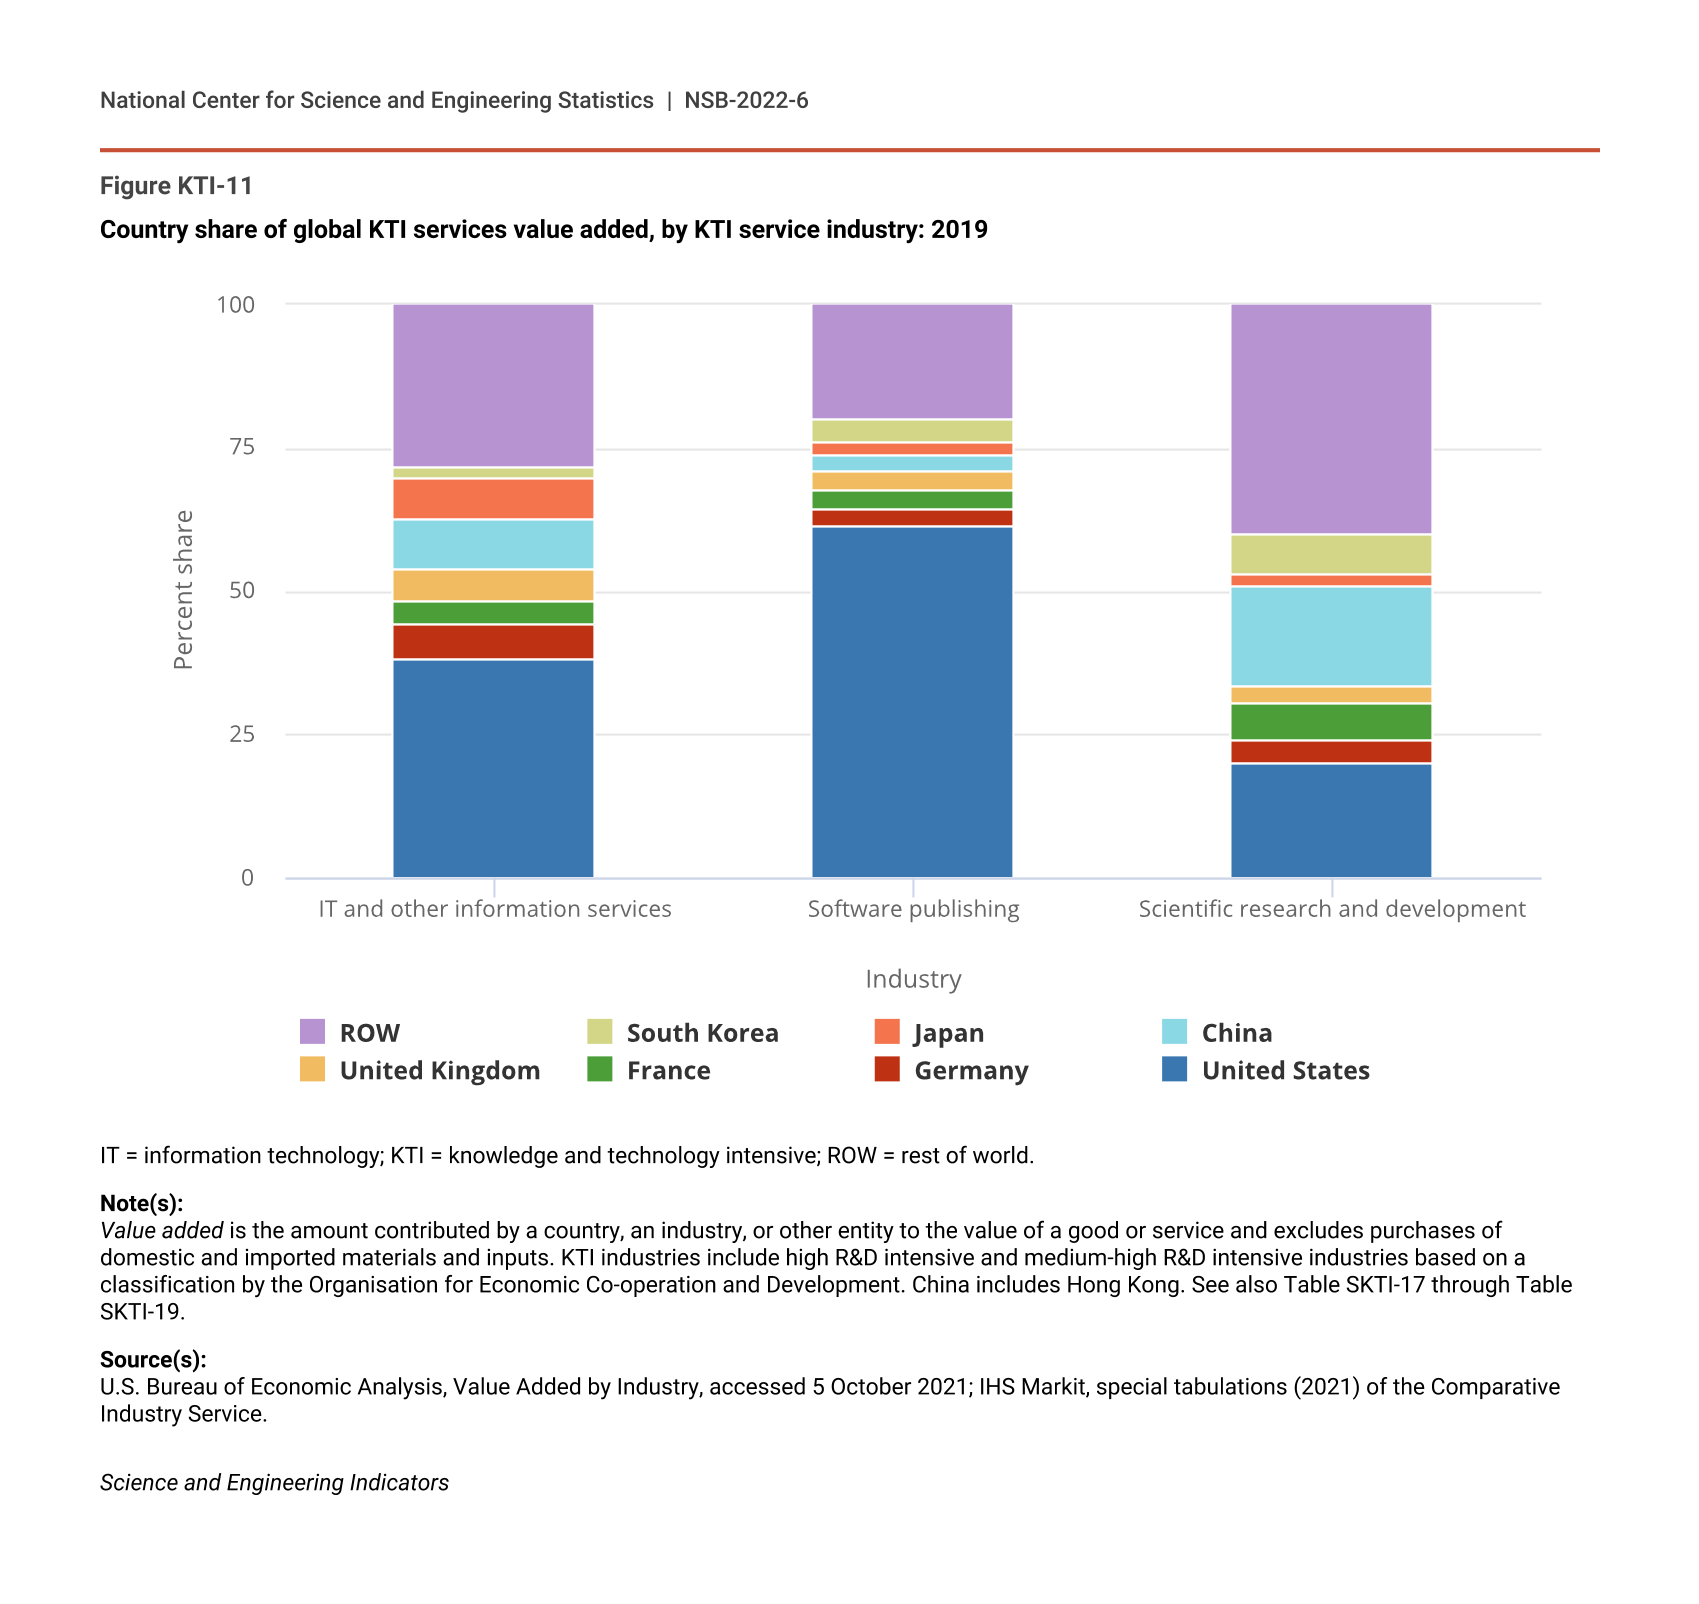
The United States accounted for the largest shares of value added generated worldwide by each of the three KTI services industries in 2019: software publishing (61% global share), IT and other information services (38%), and scientific research and development (20%) (Figure KTI-11; Table SKTI-18, Table SKTI-17, and Table SKTI-19). China and the other major KTI producers each accounted for 2%–4% of the global software publishing value added. These countries had larger shares of global value added that were generated by IT and other information services compared to software publishing (4%–9% each in 2019), except for South Korea (2%). The 2019 value added generated by the scientific research and development industry was more widely spread geographically; China’s global value-added share (18%) was just below that of the United States (20%), whereas South Korea and France each had global shares of 6%–7%.
Country share of global KTI services value added, by KTI service industry: 2019
| Industry | United States | Germany | France | United Kingdom | China | Japan | South Korea | ROW |
|---|---|---|---|---|---|---|---|---|
| IT and other information services | 38.1 | 6.1 | 4.3 | 5.5 | 8.7 | 7.3 | 1.7 | 28.3 |
| Software publishing | 61.3 | 3.2 | 3.1 | 3.3 | 3.1 | 1.9 | 4.0 | 20.1 |
| Scientific research and development | 19.9 | 4.1 | 6.4 | 2.9 | 17.6 | 2.2 | 6.8 | 40.1 |
IT = information technology; KTI = knowledge and technology intensive; ROW = rest of world.
Note(s):
Value added is the amount contributed by a country, an industry, or other entity to the value of a good or service and excludes purchases of domestic and imported materials and inputs. KTI industries include high R&D intensive and medium-high R&D intensive industries based on a classification by the Organisation for Economic Co-operation and Development. China includes Hong Kong. See also Table SKTI-17 through Table SKTI-19.
Source(s):
U.S. Bureau of Economic Analysis, Value Added by Industry, accessed 5 October 2021; IHS Markit, special tabulations (2021) of the Comparative Industry Service.
Science and Engineering Indicators