 An official website of the United States government
 Post–High School Transitions
Transition to Postsecondary Education
The U.S. education system strives to prepare every high school graduate for a career or for college, although studies suggest that more progress is needed in preparing students for these pathways after high school. Research shows that fewer than half of students may have the skills needed to succeed in college coursework or in the workforce (ACT, Inc. 2019; Cushing et al. 2019). In recent years, preparation for postsecondary education and work has also been substantially affected by the COVID-19 pandemic and its associated school disruptions. In addition to declines observed in student achievement at the elementary and middle school levels (Kuhfeld, Soland, and Lewis 2022; Schneider 2022), reports indicate that high school students were less prepared for college and less likely to enroll immediately in college compared with high school students before the pandemic (ACT, Inc. 2022; Harris and Chen 2022). At the same time, the long-term trend prior to the pandemic involved increasing academic coursetaking and performance in high school, which may serve as a bulwark against lasting learning achievement declines.
Readiness for College
The first step toward preparing for college requires graduating from high school. The national graduation rate for public high school students in 2019–20, the last year with federal data available, was 87%, the highest since the current measure was created in 2010–11 (NCES 2023). Initial research on whether graduation rates changed during the pandemic suggests that graduation rates in many states remained relatively stable in 2019–20, partly because schools relaxed graduation standards for students affected by the pandemic (Harris and Chen 2022). Rates began to dip in the 2020–21 school year, however, as students experienced the first full school year of disruptions caused by the pandemic. An analysis of state graduation rates showed declines in 20 of the 26 states that reported results in 2021 (Barnum, Belsha, and Wilburn 2022).
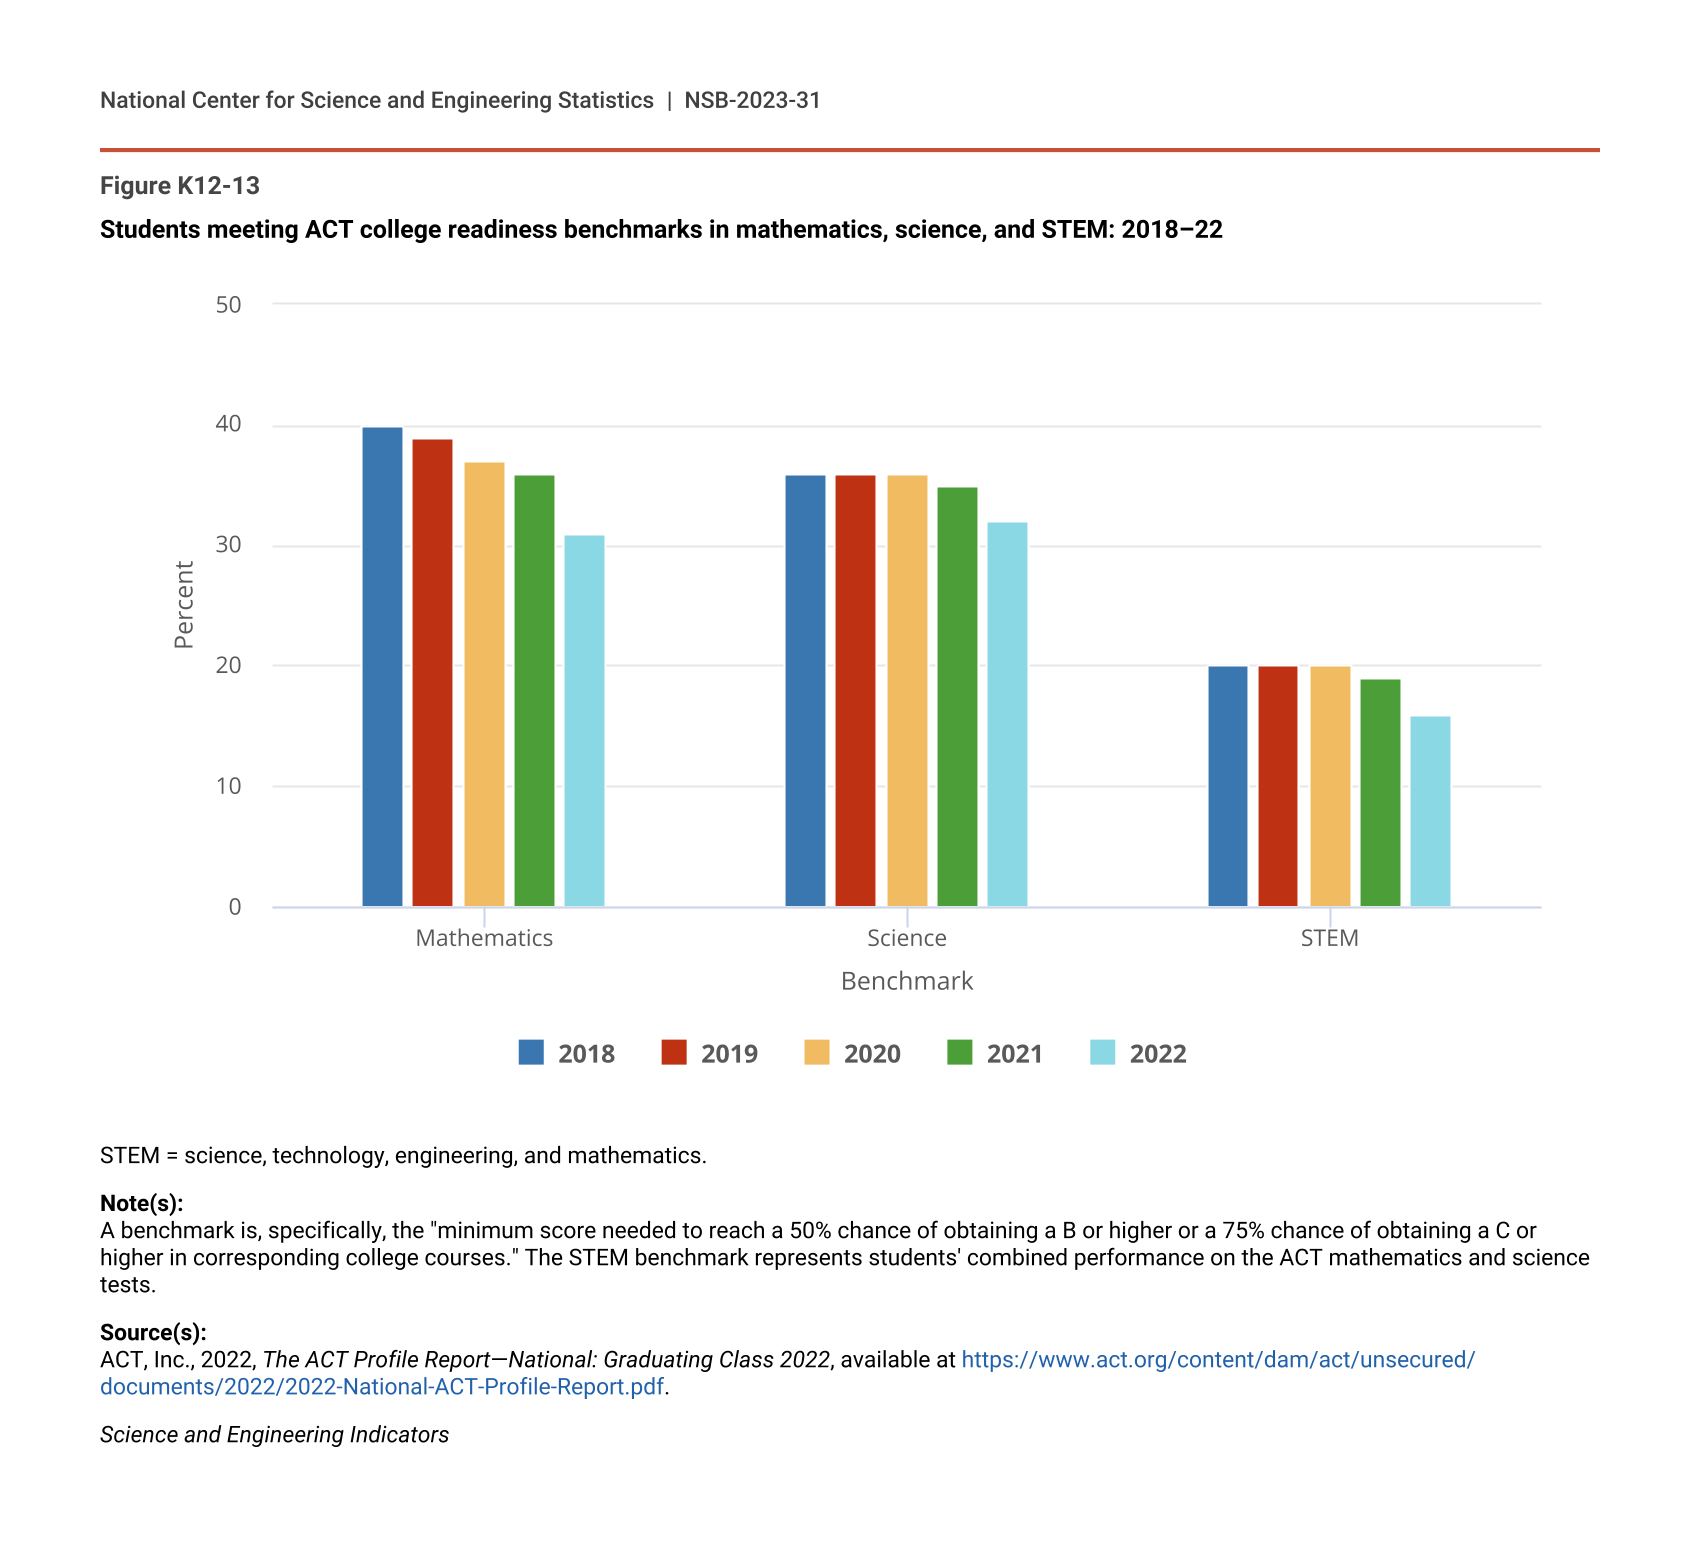
Although high school completion represents a major milestone for adolescents, most of today’s fastest-growing, well-paying jobs—especially those in STEM fields—require at least some postsecondary education, including attainment of nondegree credentials (Carnevale et al. 2020; NASEM 2017; NSB 2019). The ACT, a standardized college admissions test, provides information on the academic readiness of high school students for college, including the percentage of students reaching college readiness benchmarks in STEM subjects. Along with recent NAEP results, the ACT scores indicate the impact of disrupted learning on student outcomes, with the percentage of students meeting STEM readiness benchmarks dropping from 2021 to 2022 (Figure K12-13). The percentage of graduates meeting each benchmark dropped from 36% to 31% in mathematics, from 35% to 32% in science, and from 19% to 16% in STEM (combined mathematics and science performance). Low percentages of students reaching college readiness benchmarks declined further during the pandemic.
Students meeting ACT college readiness benchmarks in mathematics, science, and STEM: 2018–22
| Benchmark | 2018 | 2019 | 2020 | 2021 | 2022 |
|---|---|---|---|---|---|
| Mathematics | 40 | 39 | 37 | 36 | 31 |
| Science | 36 | 36 | 36 | 35 | 32 |
| STEM | 20 | 20 | 20 | 19 | 16 |
STEM = science, technology, engineering, and mathematics.
Note(s):
A benchmark is, specifically, the "minimum score needed to reach a 50% chance of obtaining a B or higher or a 75% chance of obtaining a C or higher in corresponding college courses." The STEM benchmark represents students' combined performance on the ACT mathematics and science tests.
Source(s):
ACT, Inc., 2022, The ACT Profile Report—National: Graduating Class 2022, available at https://www.act.org/content/dam/act/unsecured/documents/2022/2022-National-ACT-Profile-Report.pdf.
Science and Engineering Indicators
Immediate Enrollment in Postsecondary Education
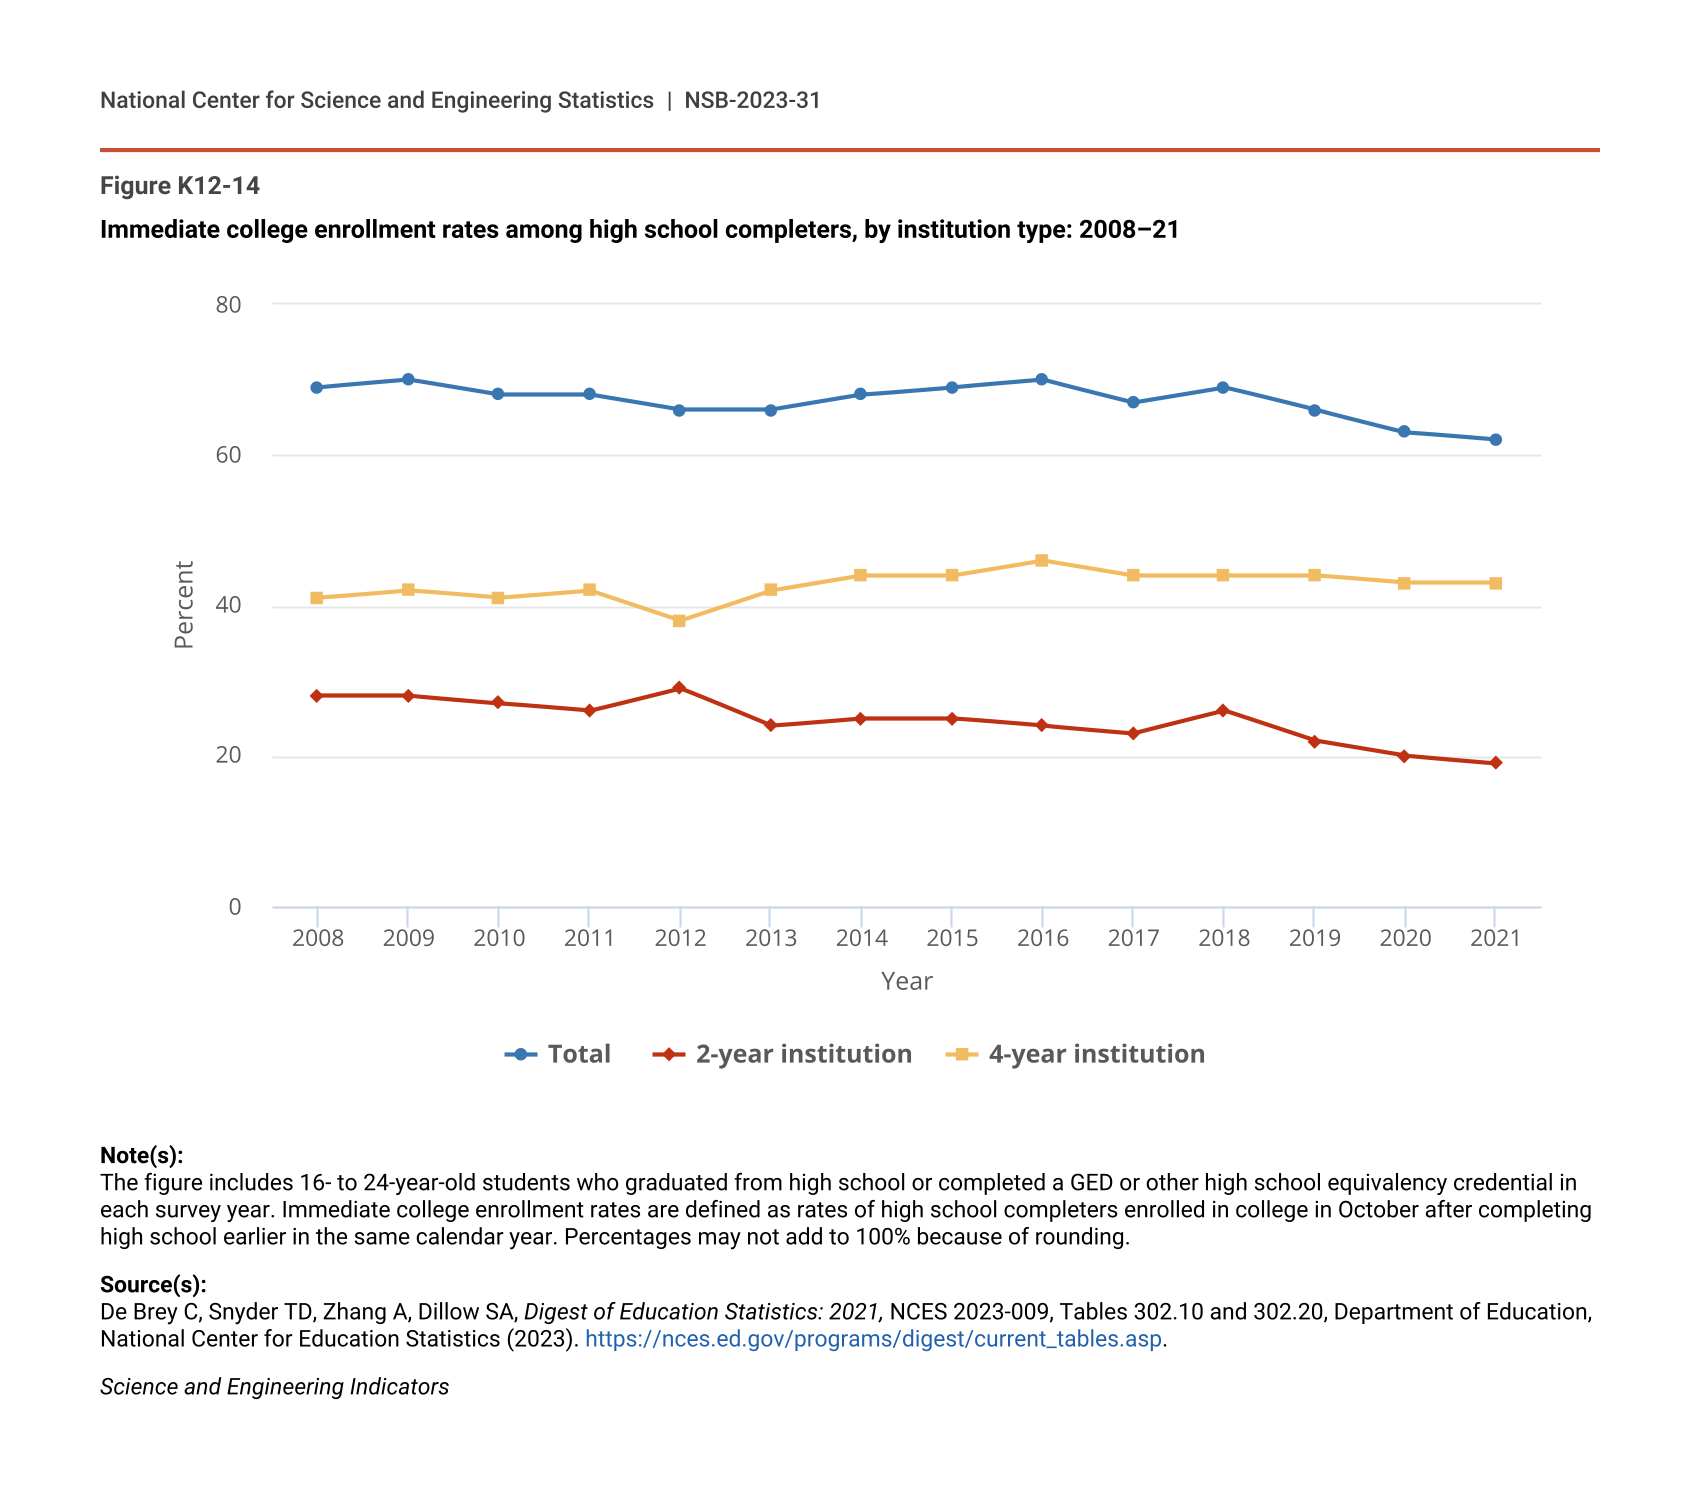
Estimates from the Census Bureau’s Current Population Survey indicate that about 62% of students who completed high school were enrolled in college by October 2021 (Figure K12-14). This represents a drop of about 7 percentage points since 2018. Given that enrollment in 4-year institutions has remained stable since 2018, most of this change is due to a decline in enrollment rates at 2-year institutions. In 2021, 19% of high school completers were enrolled in a 2-year institution, compared with 26% in 2018.
Immediate college enrollment rates among high school completers, by institution type: 2008–21
| Year | Total | 2-year institution | 4-year institution |
|---|---|---|---|
| 2008 | 69 | 28 | 41 |
| 2009 | 70 | 28 | 42 |
| 2010 | 68 | 27 | 41 |
| 2011 | 68 | 26 | 42 |
| 2012 | 66 | 29 | 38 |
| 2013 | 66 | 24 | 42 |
| 2014 | 68 | 25 | 44 |
| 2015 | 69 | 25 | 44 |
| 2016 | 70 | 24 | 46 |
| 2017 | 67 | 23 | 44 |
| 2018 | 69 | 26 | 44 |
| 2019 | 66 | 22 | 44 |
| 2020 | 63 | 20 | 43 |
| 2021 | 62 | 19 | 43 |
Note(s):
The figure includes 16- to 24-year-old students who graduated from high school or completed a GED or other high school equivalency credential in each survey year. Immediate college enrollment rates are defined as rates of high school completers enrolled in college in October after completing high school earlier in the same calendar year. Percentages may not add to 100% because of rounding.
Source(s):
De Brey C, Snyder TD, Zhang A, Dillow SA, Digest of Education Statistics: 2021, NCES 2023-009, Tables 302.10 and 302.20, Department of Education, National Center for Education Statistics (2023). https://nces.ed.gov/programs/digest/current_tables.asp.
Science and Engineering Indicators
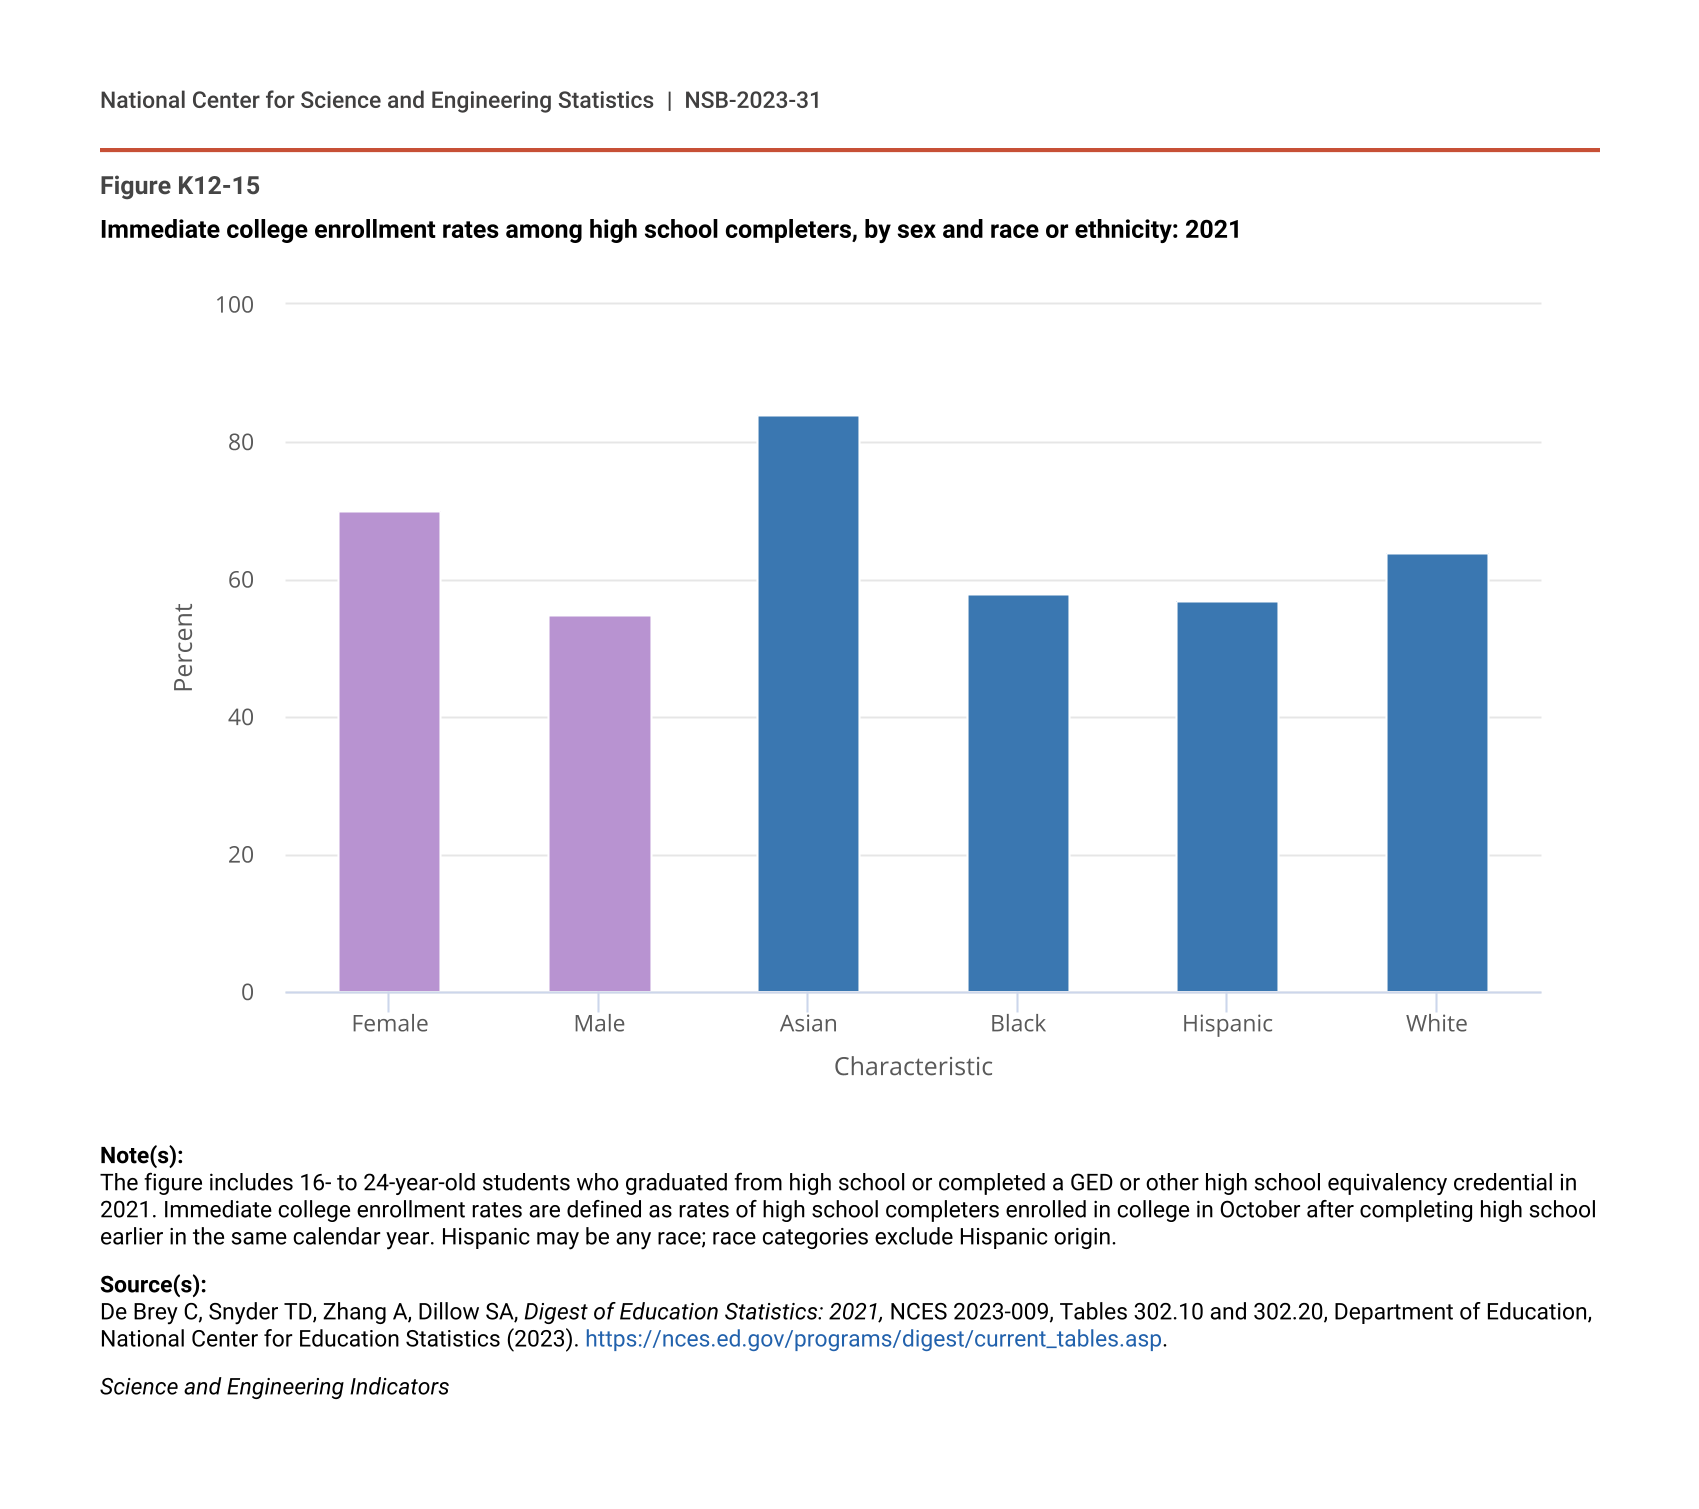
Immediate college enrollment rates in 2021 continued to show differences by student groups. Rates were higher for female students than for male students (70% and 55%, respectively) (Figure K12-15). Asian students enrolled at a substantially higher rate (84%) than students from other racial or ethnic groups, including White students (64%), Black students (58%), and Hispanic students (57%).
Immediate college enrollment rates among high school completers, by sex and race or ethnicity: 2021
| Characteristic | Percent |
|---|---|
| Female | 70 |
| Male | 55 |
| Asian | 84 |
| Black | 58 |
| Hispanic | 57 |
| White | 64 |
Note(s):
The figure includes 16- to 24-year-old students who graduated from high school or completed a GED or other high school equivalency credential in 2021. Immediate college enrollment rates are defined as rates of high school completers enrolled in college in October after completing high school earlier in the same calendar year. Hispanic may be any race; race categories exclude Hispanic origin.
Source(s):
De Brey C, Snyder TD, Zhang A, Dillow SA, Digest of Education Statistics: 2021, NCES 2023-009, Tables 302.10 and 302.20, Department of Education, National Center for Education Statistics (2023). https://nces.ed.gov/programs/digest/current_tables.asp.
Science and Engineering Indicators
STEM Coursetaking in High School
High school preparation in STEM subjects is the first step in ensuring that students are entering postsecondary education or the workforce with the STEM knowledge needed to be successful. This section reviews recent data on high school STEM coursetaking from the 2019 NAEP High School Transcript Study (HSTS) and shows that, prior to the pandemic, students were earning more credits in mathematics than at any other time in the past three decades. Credits earned in science improved over the two decades from 1990 to 2009 but have remained stable since 2009.
Overall STEM Coursetaking in High School
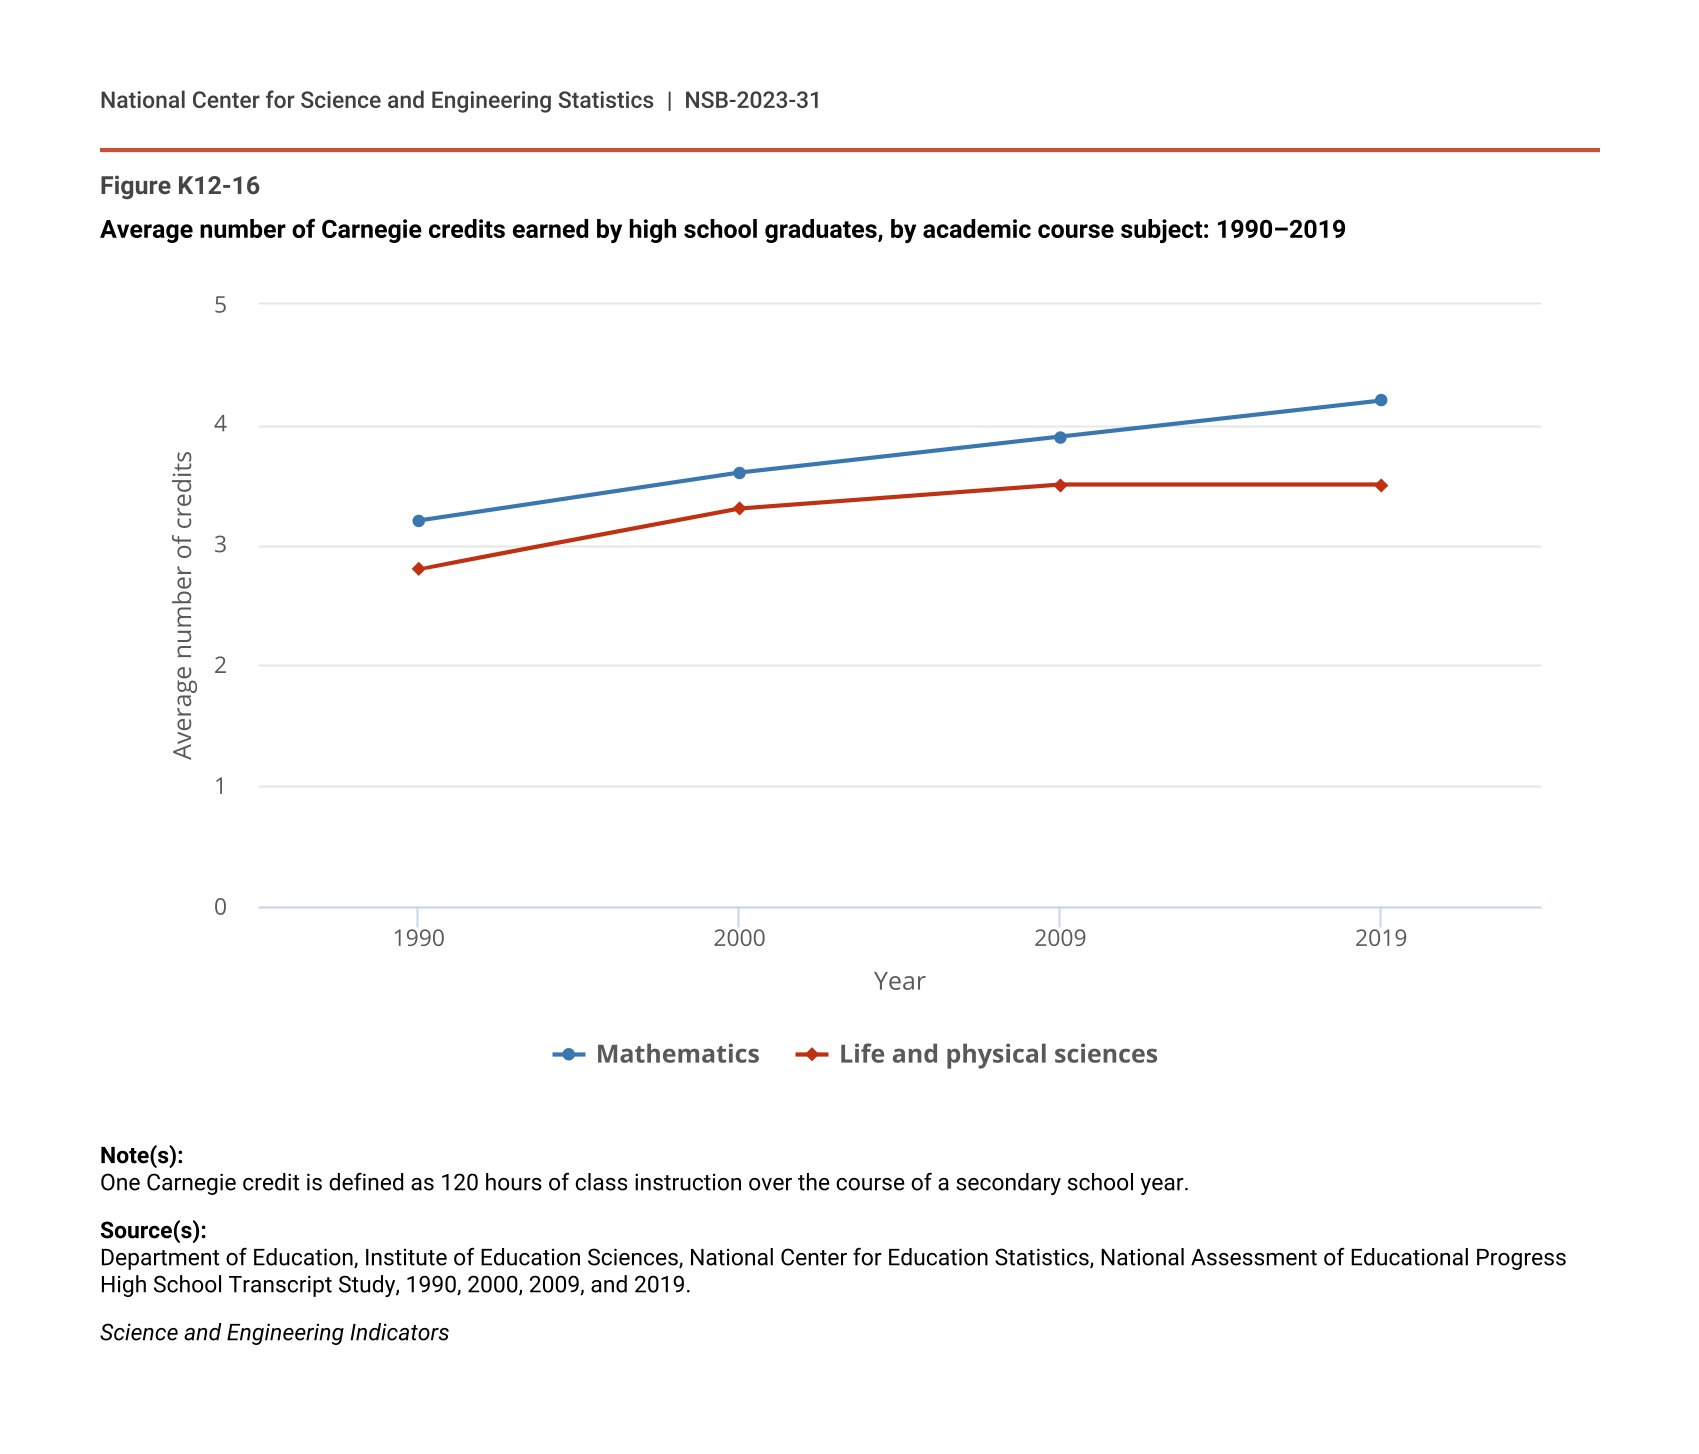
The average number of credits earned by high school graduates grew from 1990 to 2019 (1.0 credit generally equals one year-long course). In 2019, graduates earned an average of 4.2 credits in mathematics and 3.5 in science, about 1.0 credit more than the average earned in 1990 (3.2 and 2.8, respectively) (Figure K12-16). Thus, students took approximately 1 full year more in mathematics and science coursework in 2019 than in 1990.
Average number of Carnegie credits earned by high school graduates, by academic course subject: 1990–2019
| Year | Mathematics | Life and physical sciences |
|---|---|---|
| 1990 | 3.2 | 2.8 |
| 2000 | 3.6 | 3.3 |
| 2009 | 3.9 | 3.5 |
| 2019 | 4.2 | 3.5 |
Note(s):
One Carnegie credit is defined as 120 hours of class instruction over the course of a secondary school year.
Source(s):
Department of Education, Institute of Education Sciences, National Center for Education Statistics, National Assessment of Educational Progress High School Transcript Study, 1990, 2000, 2009, and 2019.
Science and Engineering Indicators
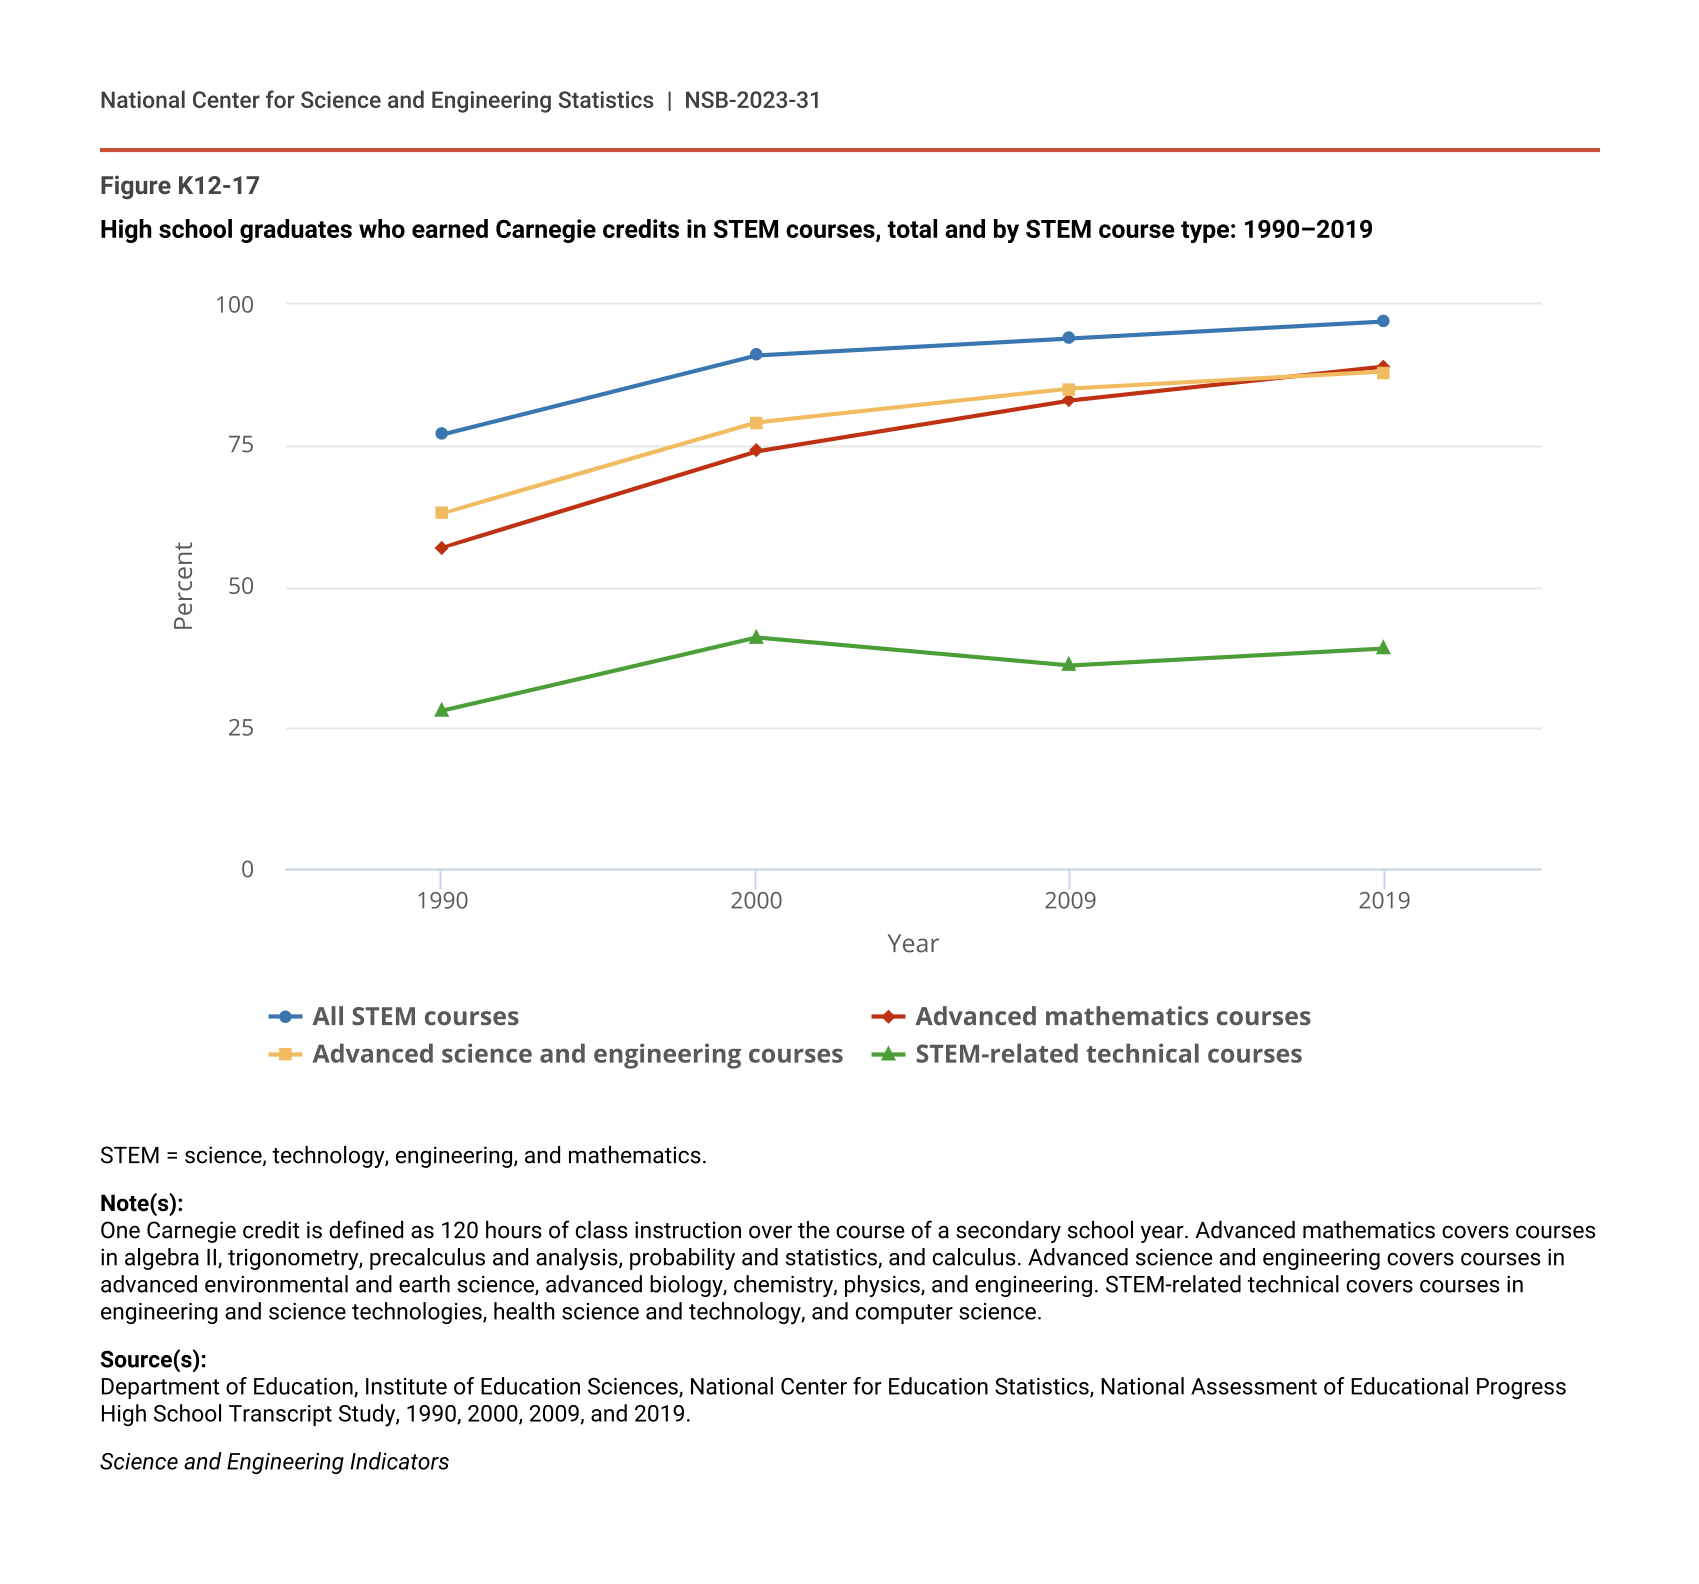
The percentage of high school graduates who earned credits in STEM courses has also increased since 1990 (Figure K12-17), with almost all graduates now earning some STEM credits. Between 1990 and 2019, the percentage of graduates earning credits in STEM grew from 77% to 97%. The data also show increases in other course types tracked by HSTS. For example, the percentage of graduates earning credits grew from 57% to 89% in advanced mathematics and from 63% to 88% in advanced science and engineering (S&E).
High school graduates who earned Carnegie credits in STEM courses, total and by STEM course type: 1990–2019
| Year | All STEM courses | Advanced mathematics courses | Advanced science and engineering courses | STEM-related technical courses |
|---|---|---|---|---|
| 1990 | 77 | 57 | 63 | 28 |
| 2000 | 91 | 74 | 79 | 41 |
| 2009 | 94 | 83 | 85 | 36 |
| 2019 | 97 | 89 | 88 | 39 |
STEM = science, technology, engineering, and mathematics.
Note(s):
One Carnegie credit is defined as 120 hours of class instruction over the course of a secondary school year. Advanced mathematics covers courses in algebra II, trigonometry, precalculus and analysis, probability and statistics, and calculus. Advanced science and engineering covers courses in advanced environmental and earth science, advanced biology, chemistry, physics, and engineering. STEM-related technical covers courses in engineering and science technologies, health science and technology, and computer science.
Source(s):
Department of Education, Institute of Education Sciences, National Center for Education Statistics, National Assessment of Educational Progress High School Transcript Study, 1990, 2000, 2009, and 2019.
Science and Engineering Indicators
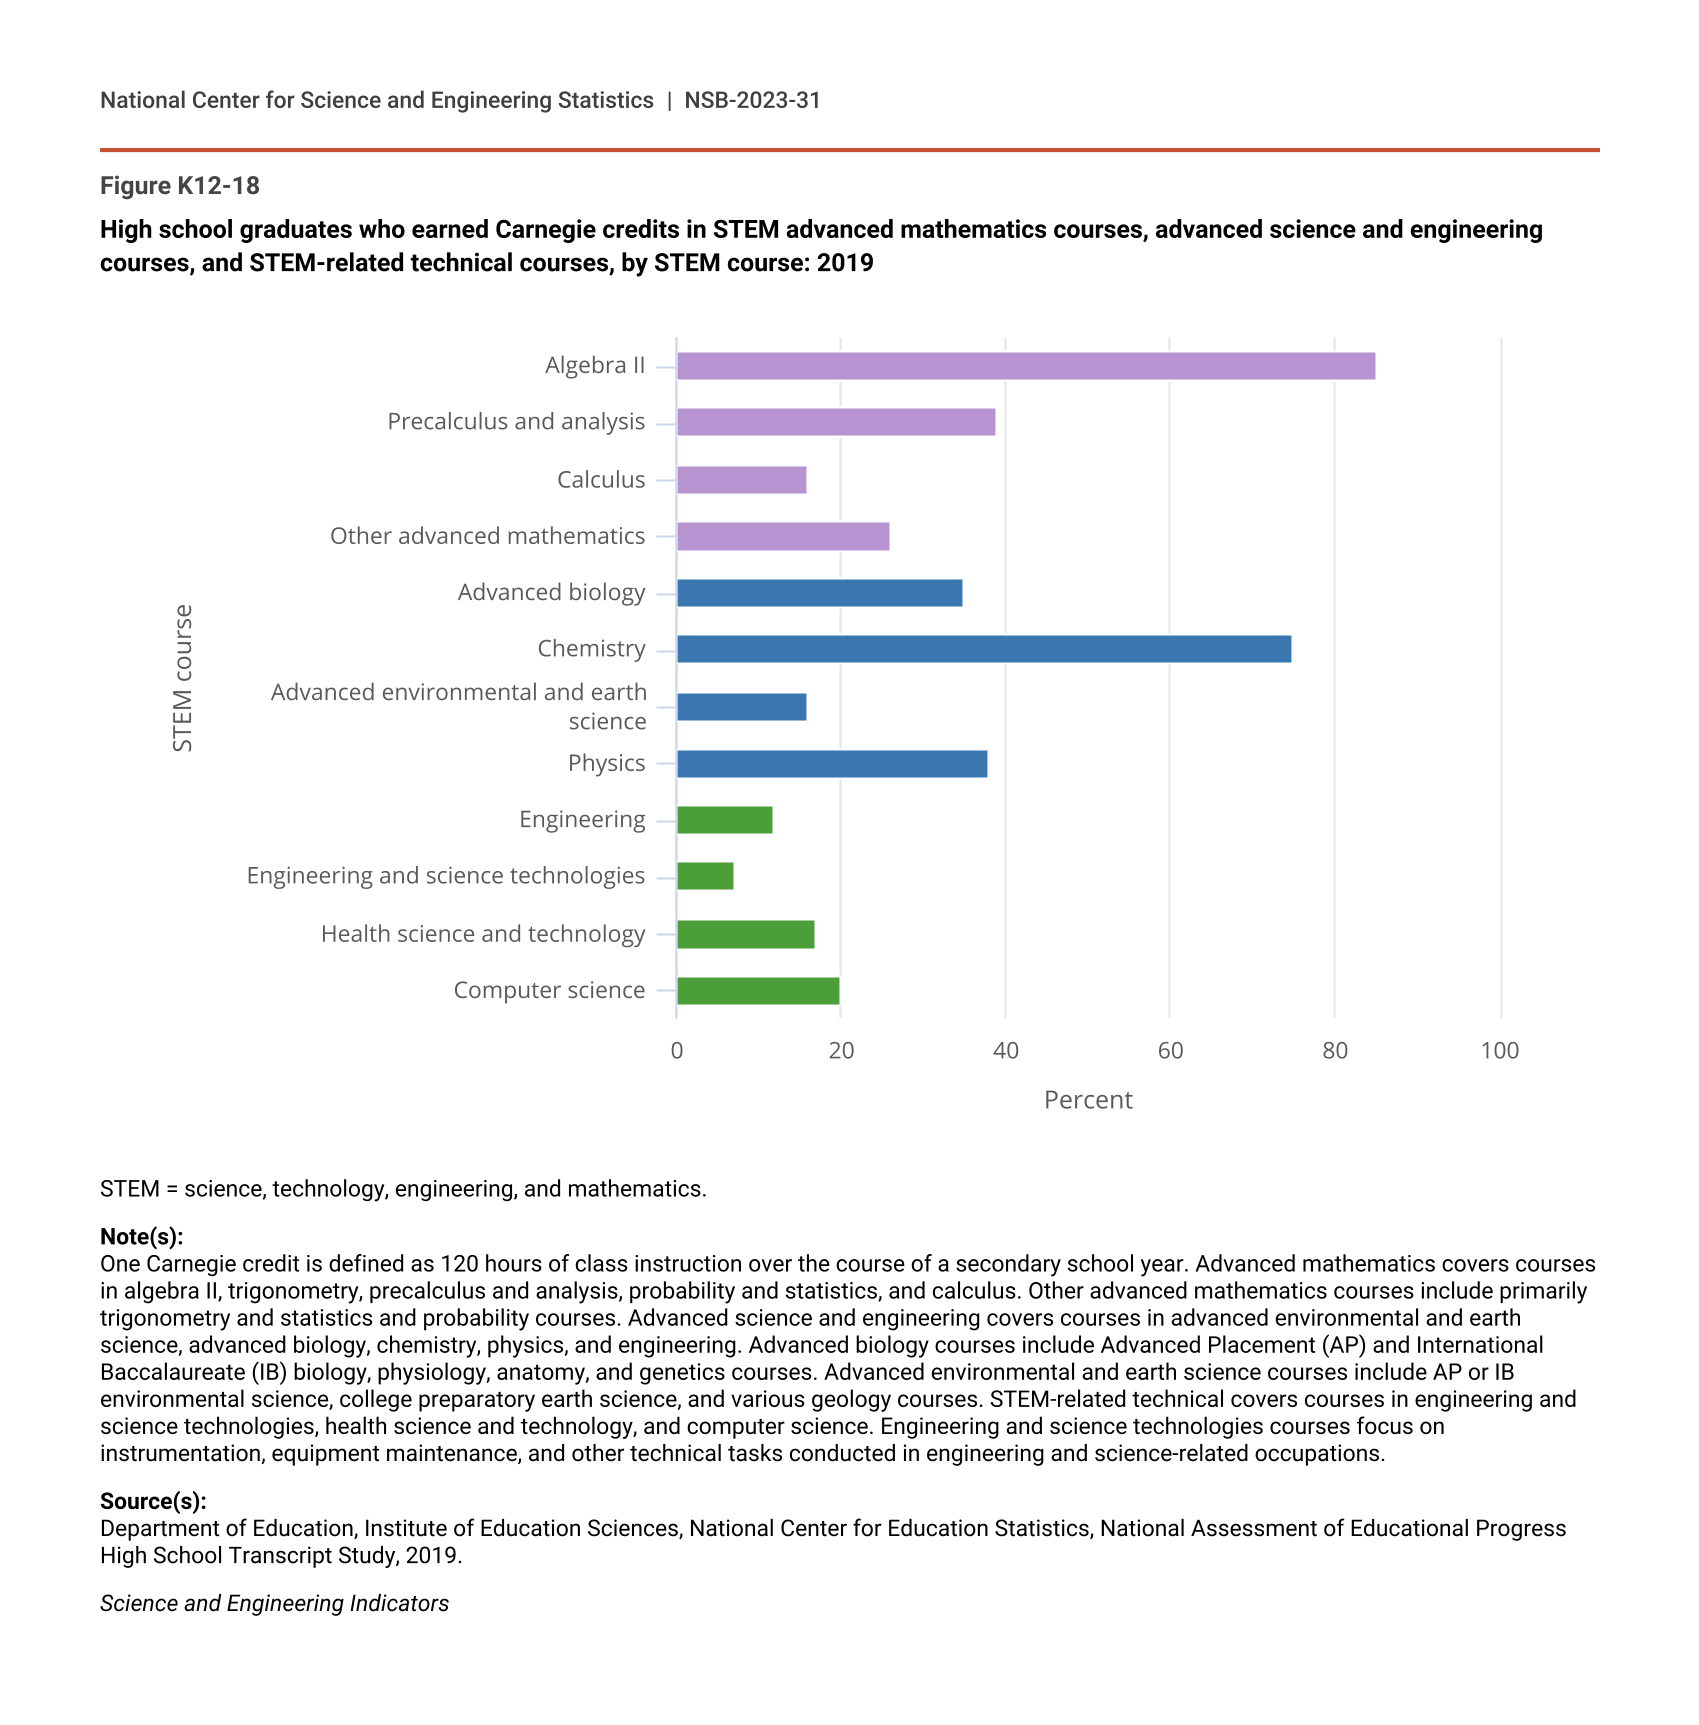
The percentage of graduates earning STEM credits in 2019 varied by course type (Figure K12-18). In advanced mathematics, algebra II was the most common course, completed by 85% of students. Calculus was the least common advanced mathematics course, with 16% of students completing it in 2019. In advanced S&E, chemistry was the most common course, with 75% of graduates earning a credit in it. Advanced biology and physics were the next most common, with about a third of students earning credits in those courses. Although the percentage of students earning a credit in engineering was low at 12%, it has increased from almost no students earning such credit in 1990 (Table SK12-10). Among STEM-related technical coursetaking in 2019, computer science was the most common course, with 20% of high school graduates completing it.
High school graduates who earned Carnegie credits in STEM advanced mathematics courses, advanced science and engineering courses, and STEM-related technical courses, by STEM course: 2019
| STEM course | 2019 |
|---|---|
| Algebra II | 85 |
| Precalculus and analysis | 39 |
| Calculus | 16 |
| Other advanced mathematics | 26 |
| Advanced biology | 35 |
| Chemistry | 75 |
| Advanced environmental and earth science | 16 |
| Physics | 38 |
| Engineering | 12 |
| Engineering and science technologies | 7 |
| Health science and technology | 17 |
| Computer science | 20 |
STEM = science, technology, engineering, and mathematics.
Note(s):
One Carnegie credit is defined as 120 hours of class instruction over the course of a secondary school year. Advanced mathematics covers courses in algebra II, trigonometry, precalculus and analysis, probability and statistics, and calculus. Other advanced mathematics courses include primarily trigonometry and statistics and probability courses. Advanced science and engineering covers courses in advanced environmental and earth science, advanced biology, chemistry, physics, and engineering. Advanced biology courses include Advanced Placement (AP) and International Baccalaureate (IB) biology, physiology, anatomy, and genetics courses. Advanced environmental and earth science courses include AP or IB environmental science, college preparatory earth science, and various geology courses. STEM-related technical covers courses in engineering and science technologies, health science and technology, and computer science. Engineering and science technologies courses focus on instrumentation, equipment maintenance, and other technical tasks conducted in engineering and science-related occupations.
Source(s):
Department of Education, Institute of Education Sciences, National Center for Education Statistics, National Assessment of Educational Progress High School Transcript Study, 2019.
Science and Engineering Indicators
STEM Coursetaking in High School, by Sex and Race or Ethnicity
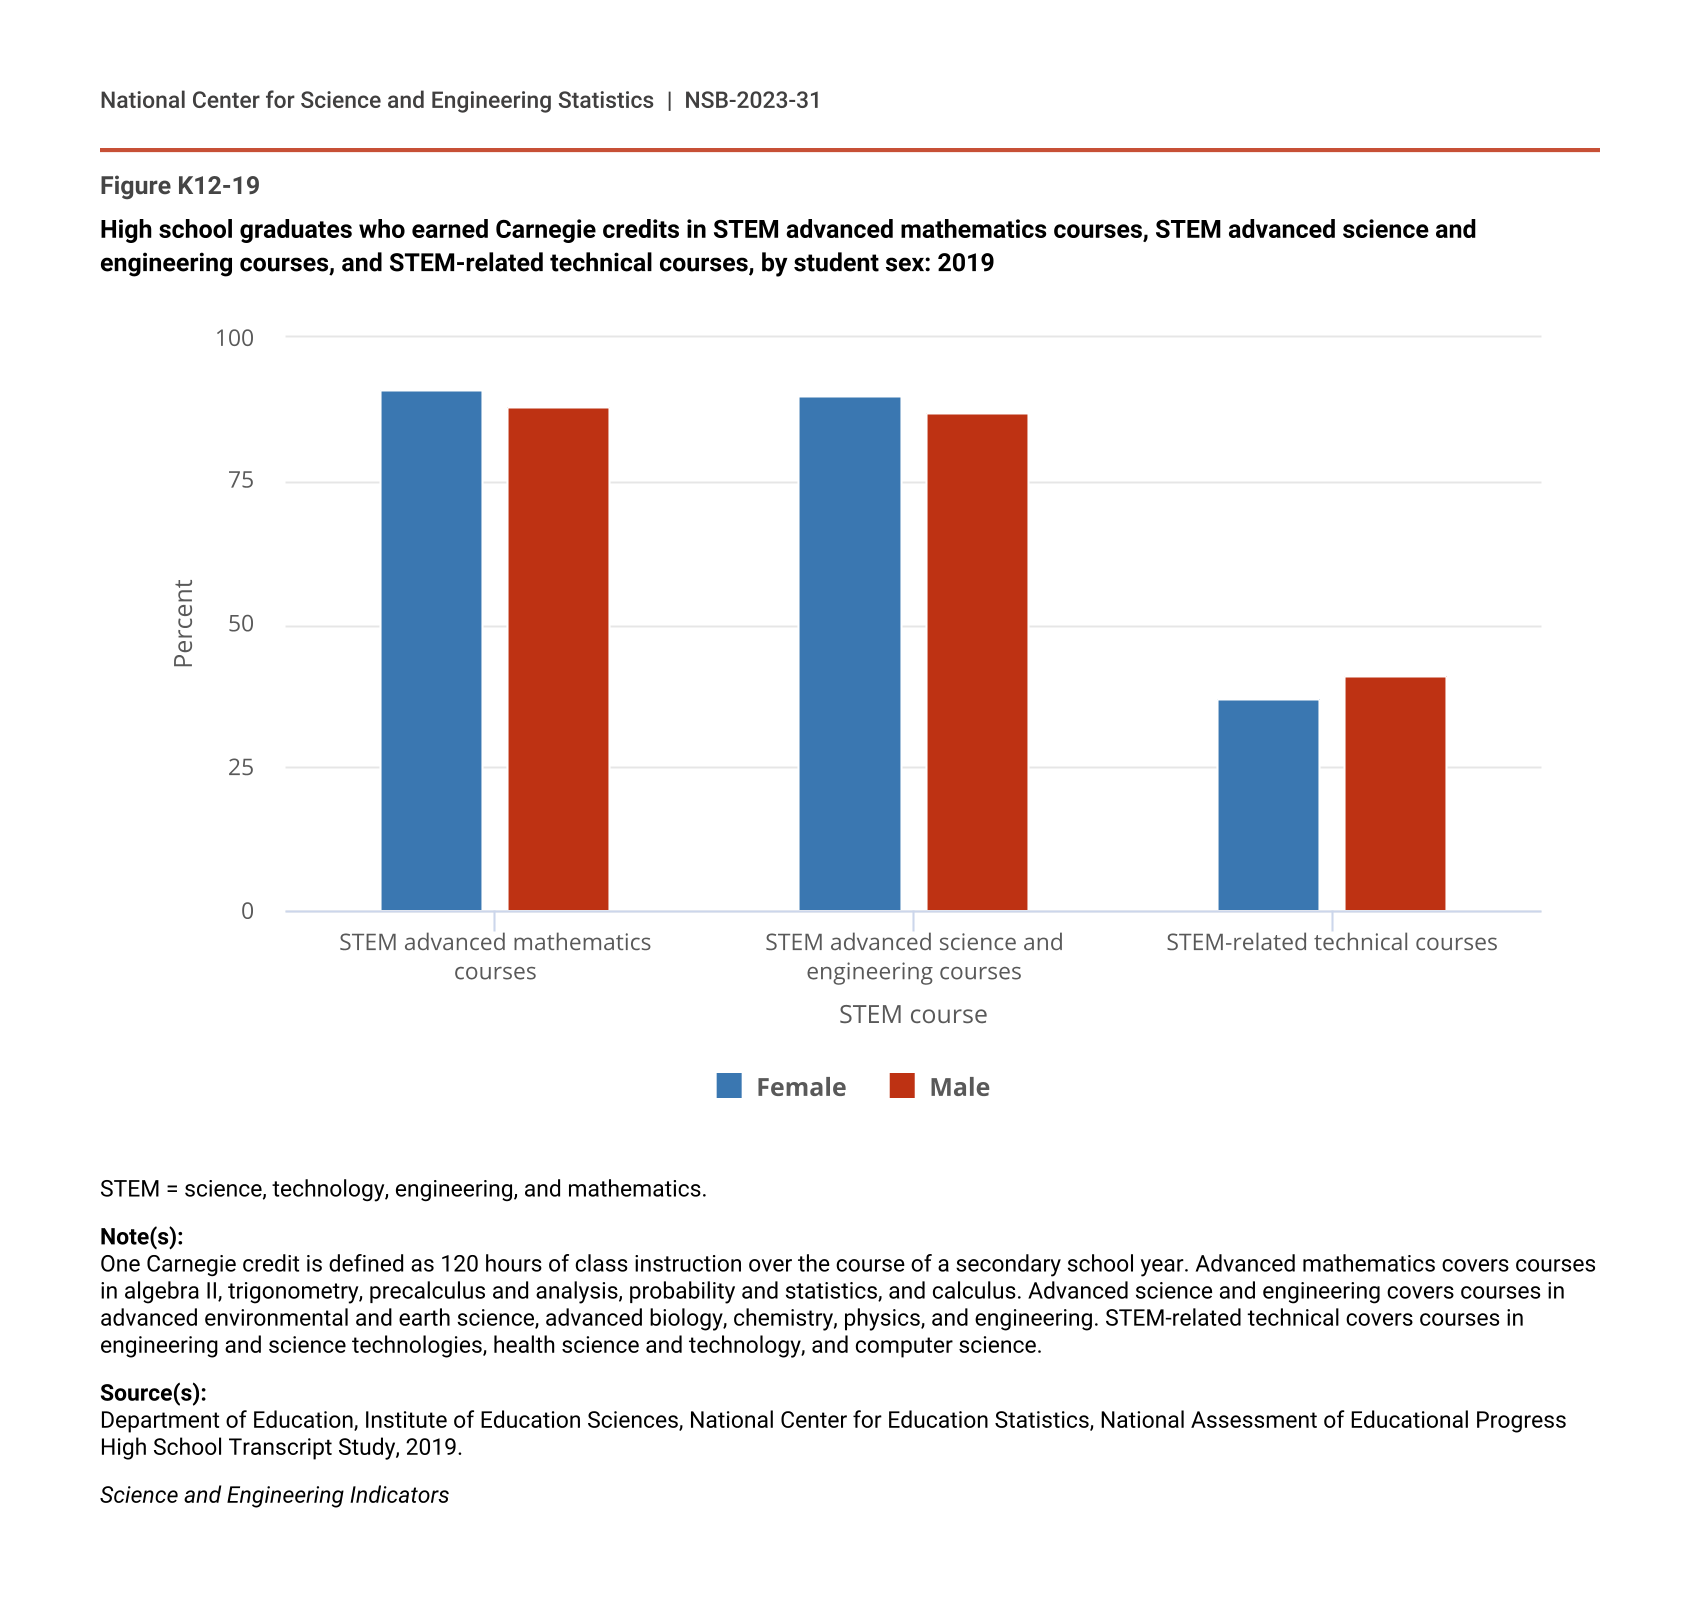
Although studies show that women are underrepresented in S&E occupations (National Center for Science and Engineering Statistics 2023), in 2019, female graduates earned credits in advanced mathematics and S&E courses at higher rates than men did. Male graduates earned more credits in STEM-related technical courses than women did (Figure K12-19).
High school graduates who earned Carnegie credits in STEM advanced mathematics courses, STEM advanced science and engineering courses, and STEM-related technical courses, by student sex: 2019
| STEM course | Female | Male |
|---|---|---|
| STEM advanced mathematics courses | 91 | 88 |
| STEM advanced science and engineering courses | 90 | 87 |
| STEM-related technical courses | 37 | 41 |
STEM = science, technology, engineering, and mathematics.
Note(s):
One Carnegie credit is defined as 120 hours of class instruction over the course of a secondary school year. Advanced mathematics covers courses in algebra II, trigonometry, precalculus and analysis, probability and statistics, and calculus. Advanced science and engineering covers courses in advanced environmental and earth science, advanced biology, chemistry, physics, and engineering. STEM-related technical covers courses in engineering and science technologies, health science and technology, and computer science.
Source(s):
Department of Education, Institute of Education Sciences, National Center for Education Statistics, National Assessment of Educational Progress High School Transcript Study, 2019.
Science and Engineering Indicators
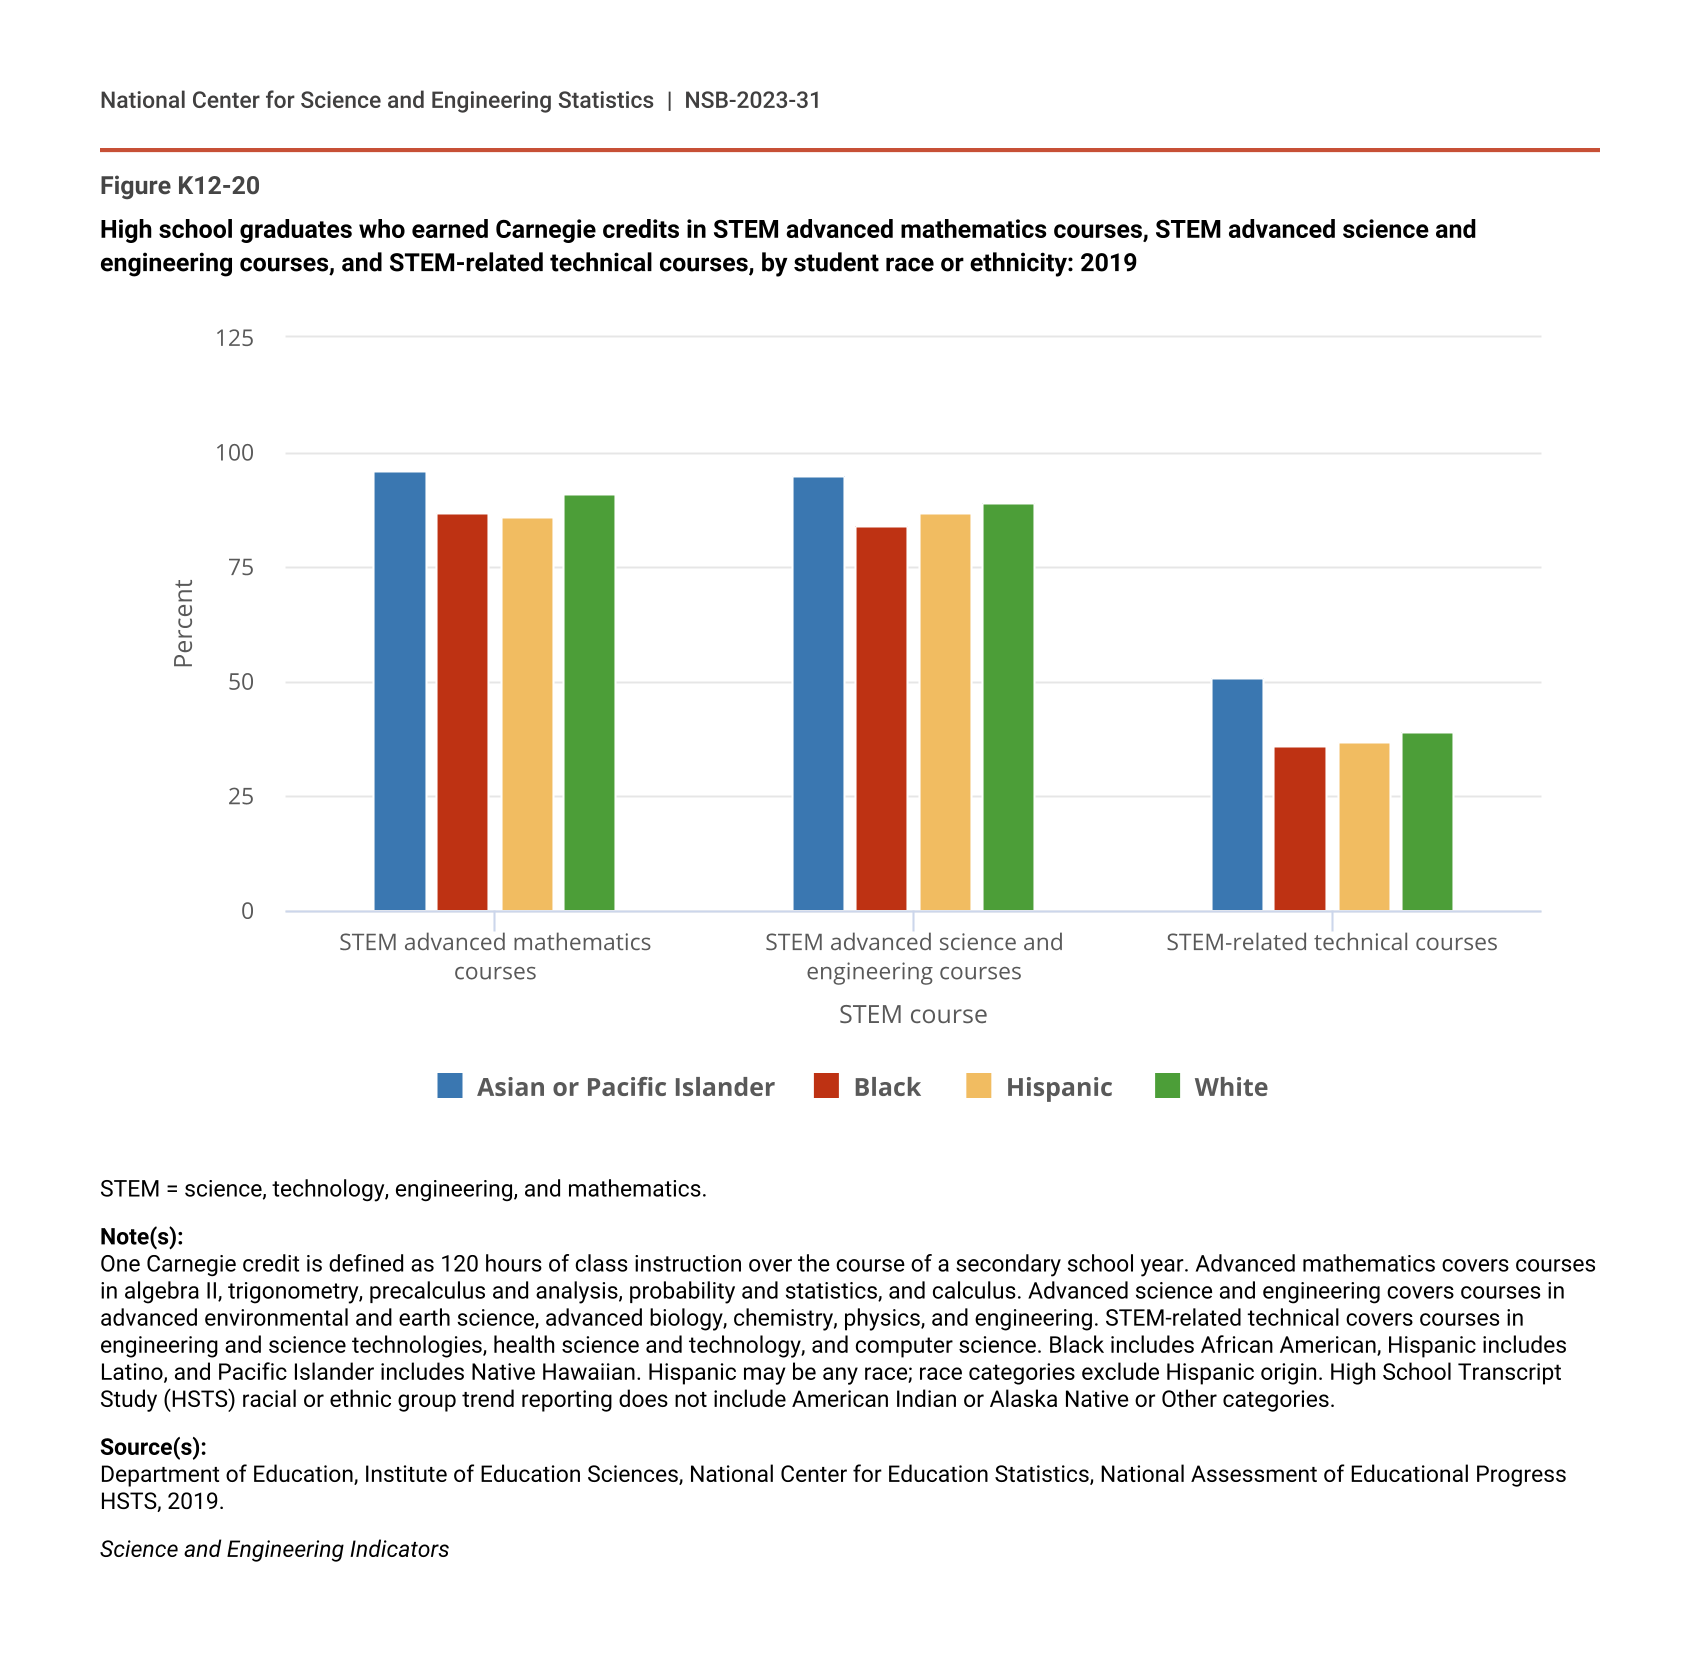
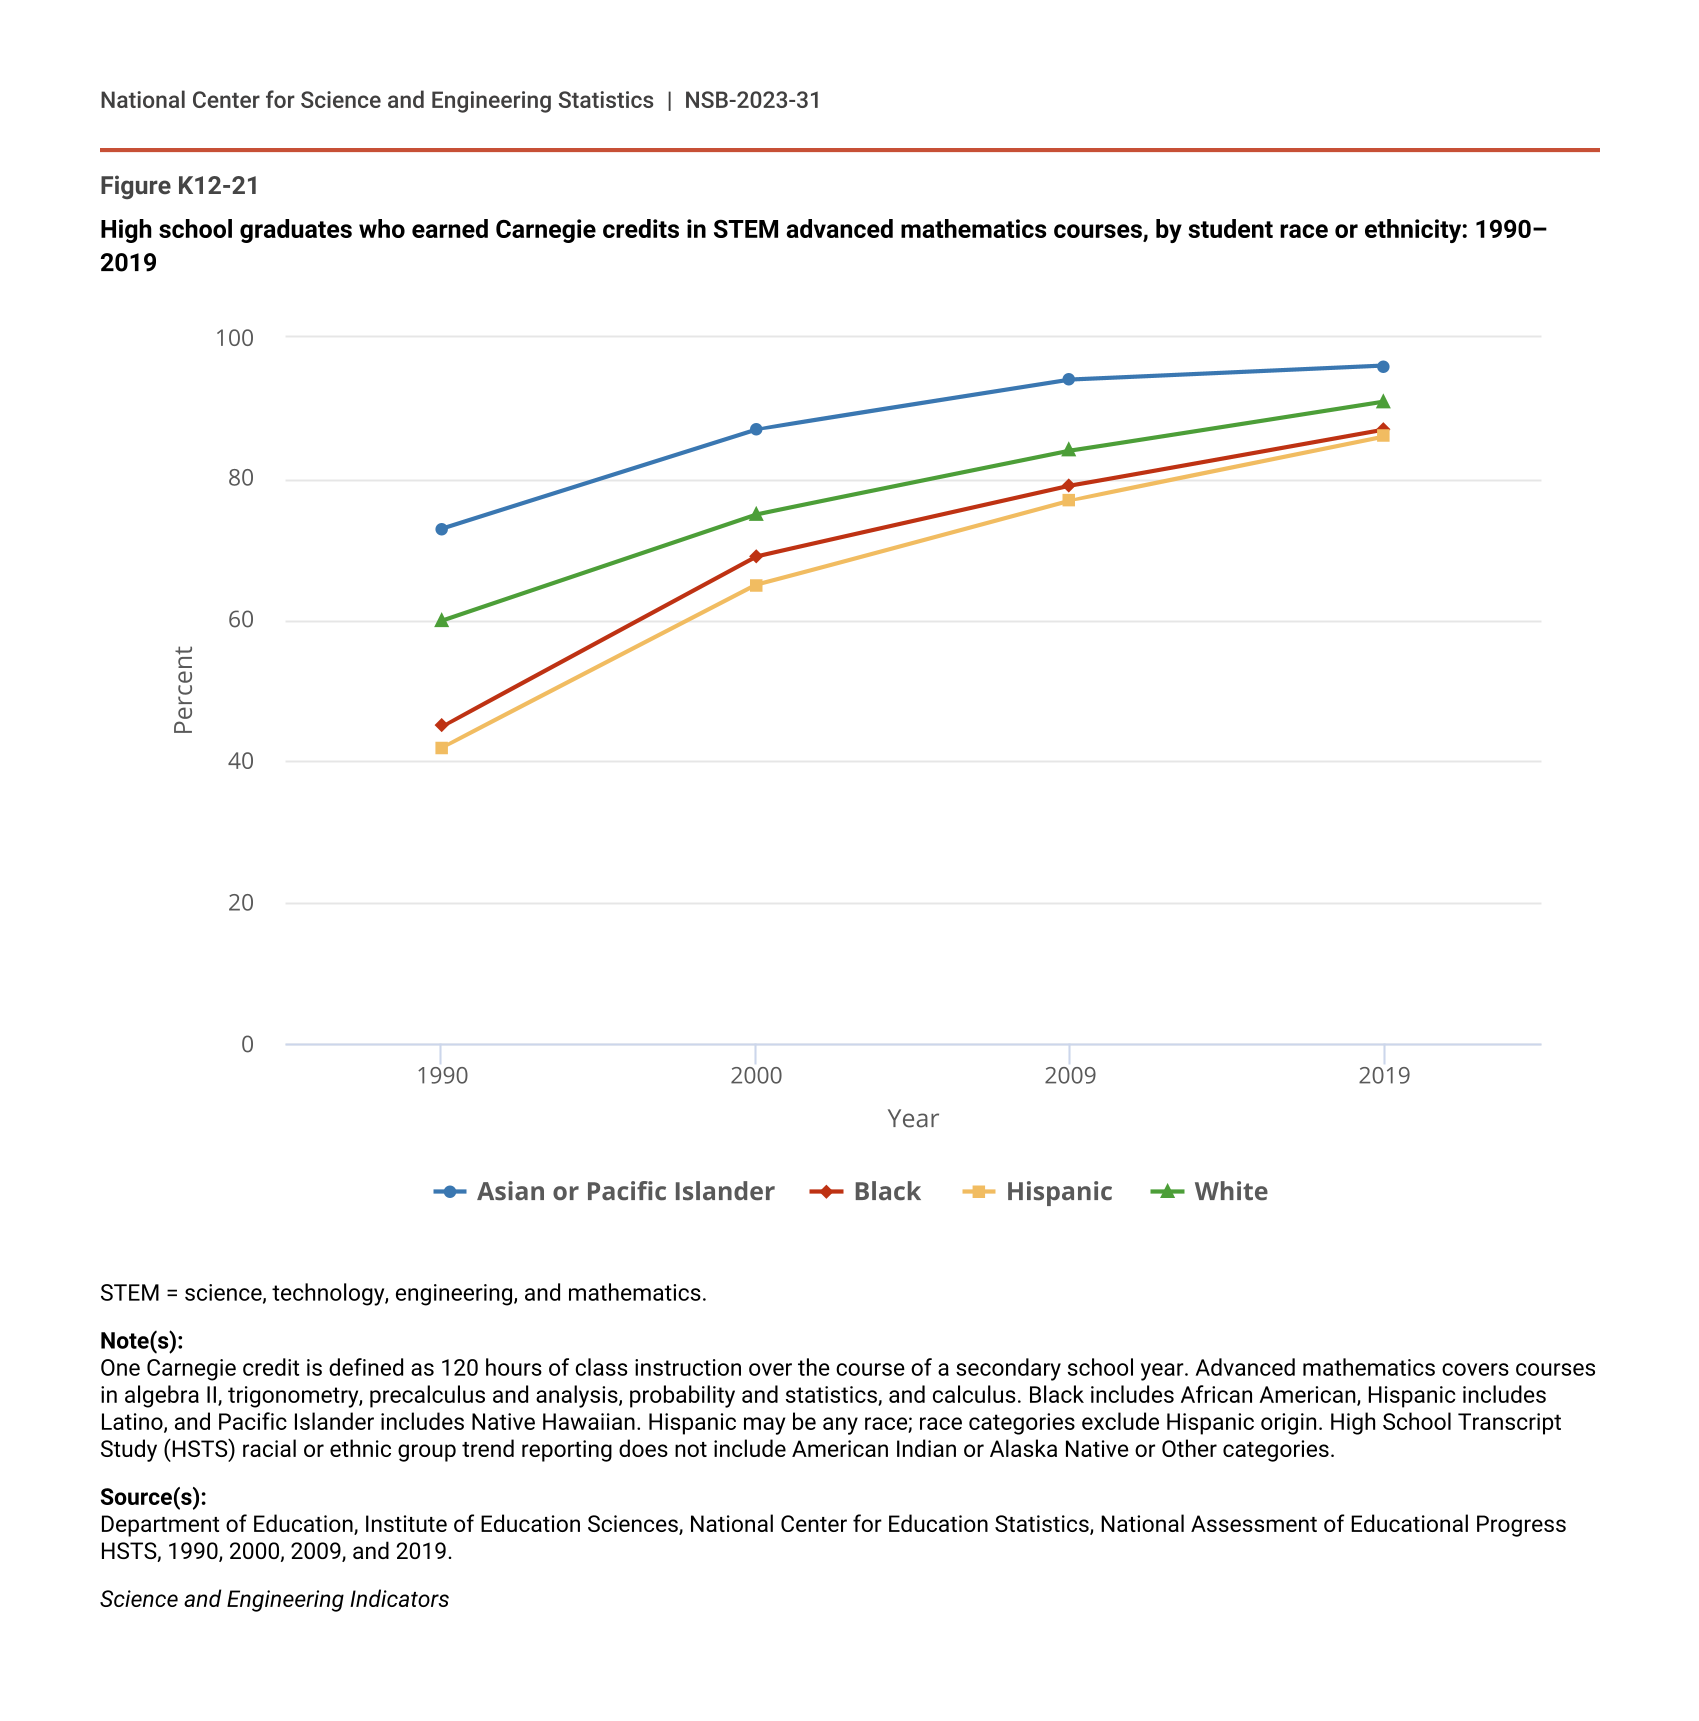
As with male and female graduates, nearly all graduates from racial or ethnic groups earned credits in any STEM course in 2019 (Table SK12-11). Differences appear, however, when examining credits earned in specific courses. For example, 95% of Asian or Pacific Islander students earned credits in advanced S&E courses, compared with 89% of White students, 87% of Hispanic students, and 84% of Black students (Figure K12-20). Although parity has not yet been reached in STEM coursetaking among racial and ethnic groups, progress has been made since 1990 (Figure K12-21). For example, about 45% of Black graduates and 42% of Hispanic graduates earned credits in advanced mathematics in 1990, compared with 87% and 86%, respectively, of those graduates in 2019.
High school graduates who earned Carnegie credits in STEM advanced mathematics courses, STEM advanced science and engineering courses, and STEM-related technical courses, by student race or ethnicity: 2019
| STEM course | Asian or Pacific Islander | Black | Hispanic | White |
|---|---|---|---|---|
| STEM advanced mathematics courses | 96 | 87 | 86 | 91 |
| STEM advanced science and engineering courses | 95 | 84 | 87 | 89 |
| STEM-related technical courses | 51 | 36 | 37 | 39 |
STEM = science, technology, engineering, and mathematics.
Note(s):
One Carnegie credit is defined as 120 hours of class instruction over the course of a secondary school year. Advanced mathematics covers courses in algebra II, trigonometry, precalculus and analysis, probability and statistics, and calculus. Advanced science and engineering covers courses in advanced environmental and earth science, advanced biology, chemistry, physics, and engineering. STEM-related technical covers courses in engineering and science technologies, health science and technology, and computer science. Black includes African American, Hispanic includes Latino, and Pacific Islander includes Native Hawaiian. Hispanic may be any race; race categories exclude Hispanic origin. High School Transcript Study (HSTS) racial or ethnic group trend reporting does not include American Indian or Alaska Native or Other categories.
Source(s):
Department of Education, Institute of Education Sciences, National Center for Education Statistics, National Assessment of Educational Progress HSTS, 2019.
Science and Engineering Indicators
High school graduates who earned Carnegie credits in STEM advanced mathematics courses, by student race or ethnicity: 1990–2019
| Year | Asian or Pacific Islander | Black | Hispanic | White |
|---|---|---|---|---|
| 1990 | 73 | 45 | 42 | 60 |
| 2000 | 87 | 69 | 65 | 75 |
| 2009 | 94 | 79 | 77 | 84 |
| 2019 | 96 | 87 | 86 | 91 |
STEM = science, technology, engineering, and mathematics.
Note(s):
One Carnegie credit is defined as 120 hours of class instruction over the course of a secondary school year. Advanced mathematics covers courses in algebra II, trigonometry, precalculus and analysis, probability and statistics, and calculus. Black includes African American, Hispanic includes Latino, and Pacific Islander includes Native Hawaiian. Hispanic may be any race; race categories exclude Hispanic origin. High School Transcript Study (HSTS) racial or ethnic group trend reporting does not include American Indian or Alaska Native or Other categories.
Source(s):
Department of Education, Institute of Education Sciences, National Center for Education Statistics, National Assessment of Educational Progress HSTS, 1990, 2000, 2009, and 2019.
Science and Engineering Indicators
Because the NAEP HSTS collects transcripts for students who participate in the 12th-grade main NAEP mathematics assessment, it is possible to compare changes in advanced mathematics coursetaking with changes in NAEP assessment scores. Such an examination shows that NAEP mathematics scores have not increased compared with 2005, although the percentage of students completing advanced mathematics courses has increased. The average NAEP mathematics score for 12th graders in 2019 was the same as the score in 2005 (Table SK12-2).