 An official website of the United States government
 Talent: U.S. and Global STEM Education and Labor Force
A globally competitive STEM education system equips Americans with the skills and knowledge needed to participate in the STEM workforce. STEM workers with a broad range of educational credentials sustain the U.S. research enterprise and drive innovation in critical and emerging technologies, supporting the nation’s competitiveness in the global economy.
Elementary and Secondary Mathematics and Science
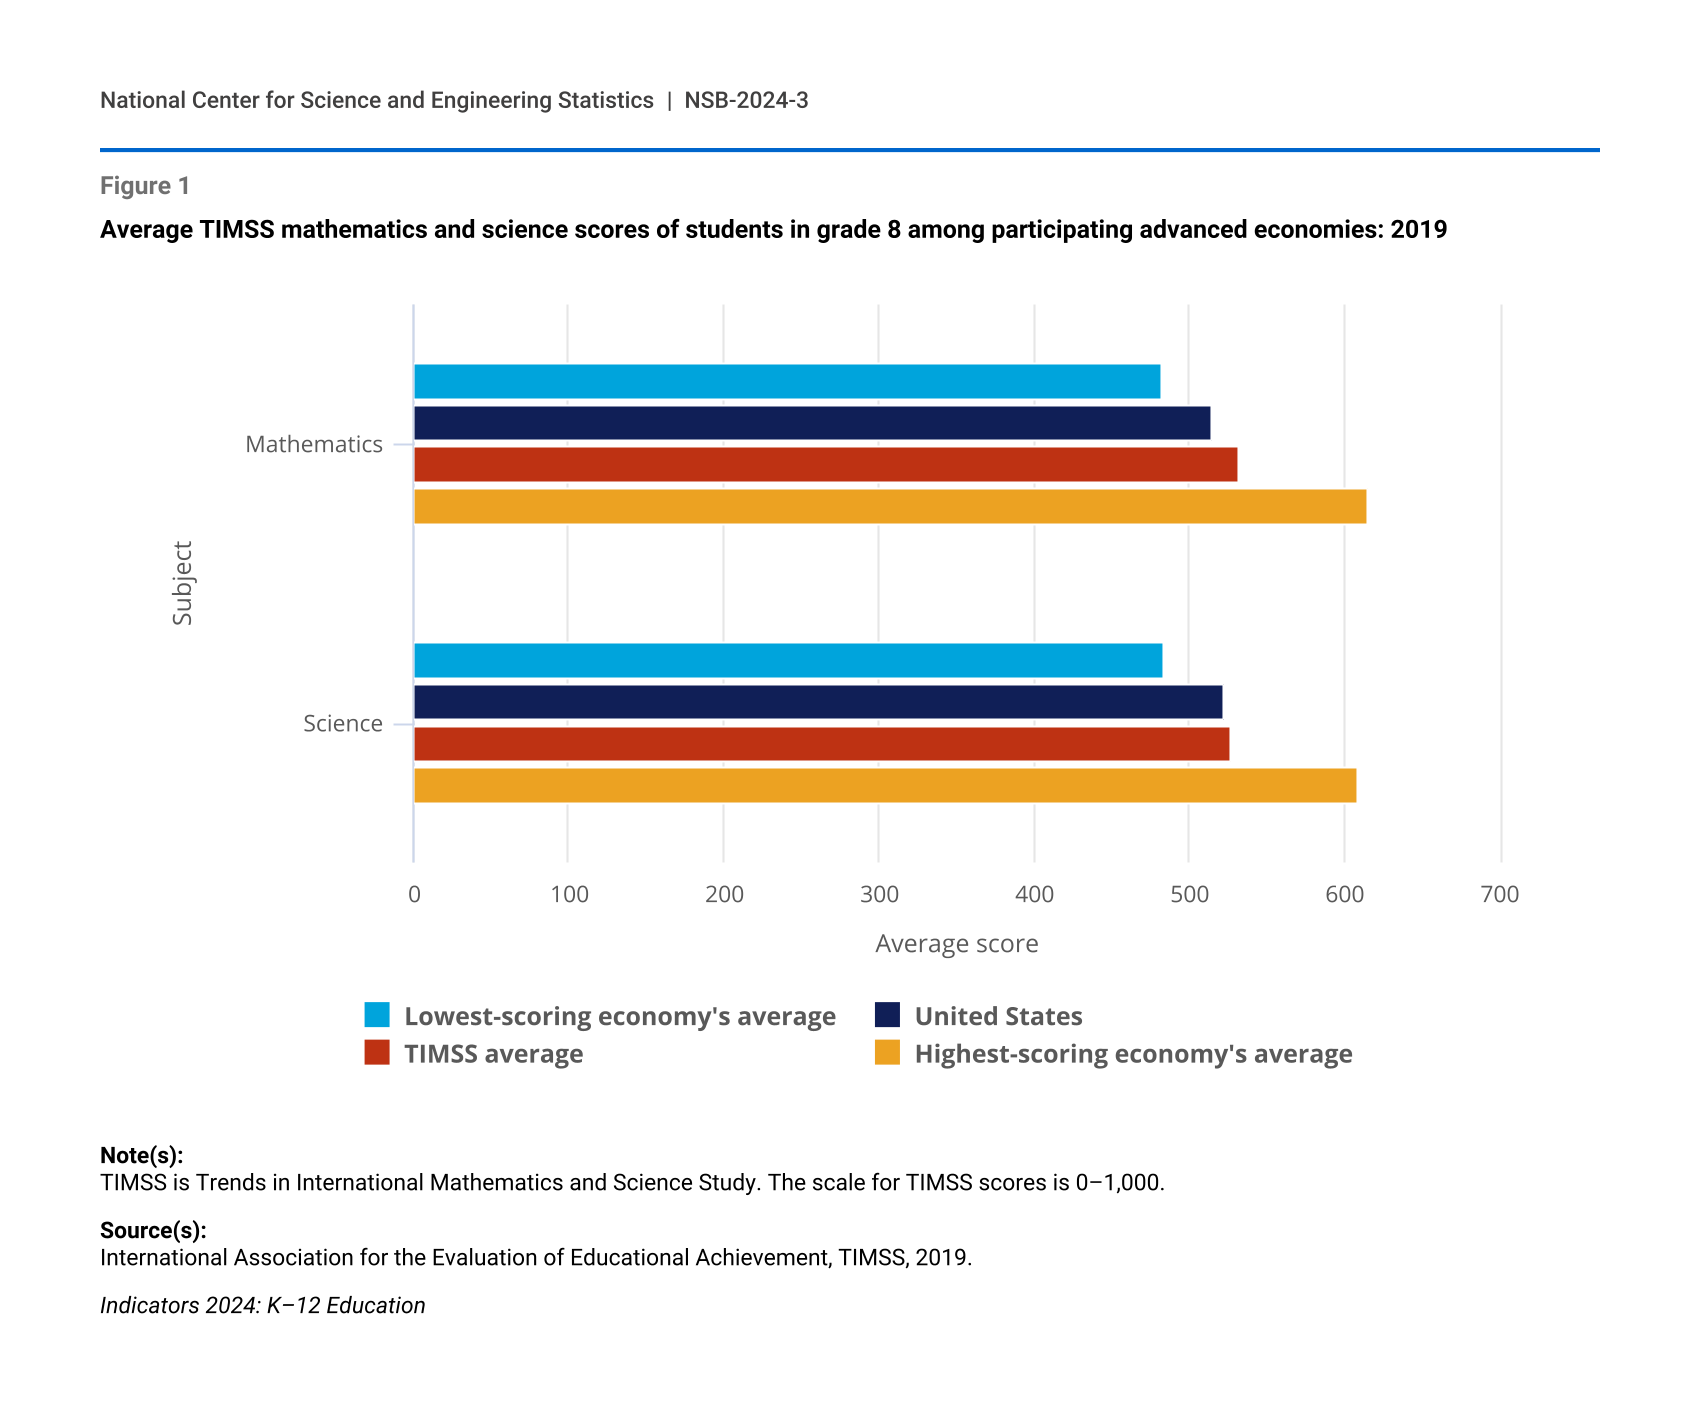
Elementary and secondary education in mathematics and science are the foundation for entry into postsecondary STEM majors and STEM-related occupations. Prior to the COVID-19 pandemic, the United States ranked near the middle of advanced economies based on international mathematics and science assessments of students (Figure 1). In 2019, average Trends in International Mathematics and Science Study (TIMSS) assessment scores of U.S. eighth grade students in mathematics (515) and science (522) were similar to the average among advanced economies (532 in mathematics and 527 in science). Average scores of students from advanced economies in East and Southeast Asia—Singapore, Taiwan, South Korea, Japan—were among the highest and were significantly higher than average scores of U.S. students in both mathematics and science.
Average TIMSS mathematics and science scores of students in grade 8 among participating advanced economies: 2019
| Subject | Lowest-scoring economy's average | United States | TIMSS average | Highest-scoring economy's average |
|---|---|---|---|---|
| Mathematics | 482 | 515 | 532 | 616 |
| Science | 484 | 522 | 527 | 608 |
Note(s):
TIMSS is Trends in International Mathematics and Science Study. The scale for TIMSS scores is 0–1,000.
Source(s):
International Association for the Evaluation of Educational Achievement, TIMSS, 2019.
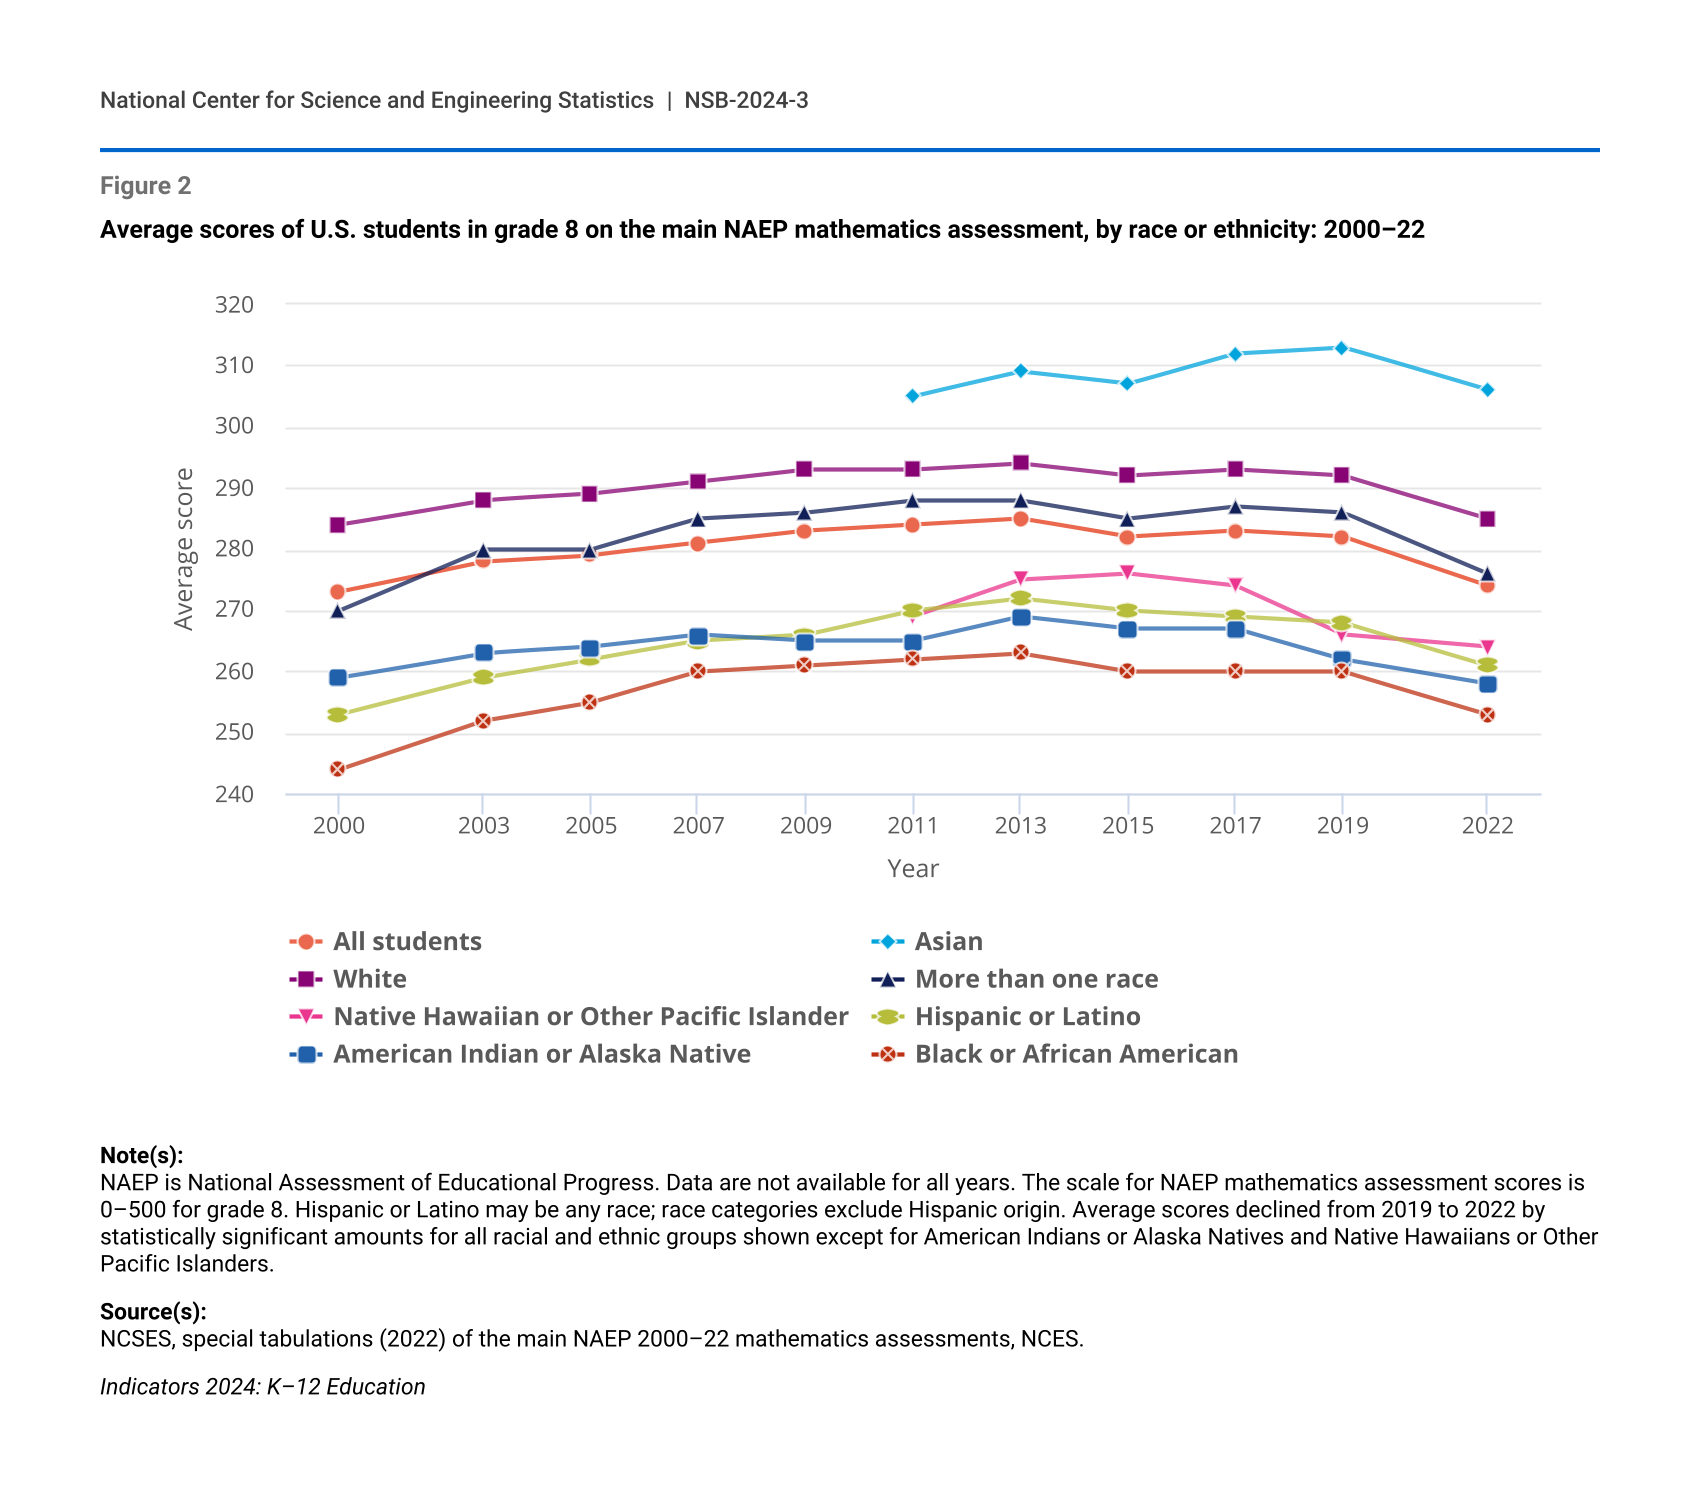
The COVID-19 pandemic led to severe disruptions in elementary and secondary student learning in the United States, beginning with the abrupt switch to remote instruction for many students in March 2020. Student mathematics performance showed a sharp decline in 2022, compared with pre-pandemic performance in 2019. From 2019 to 2022, the overall average scores for eighth graders on the main National Assessment of Educational Progress (NAEP) mathematics assessment dropped for all students, although the decline was not statistically significant for all racial and ethnic groups (Figure 2). Average scores in mathematics for all students in 2022 were lower than all previous assessments since 2005 for fourth graders and since 2003 for eighth graders.
Average scores of U.S. students in grade 8 on the main NAEP mathematics assessment, by race or ethnicity: 2000–22
| Year | All students | Asian | White | More than one race | Native Hawaiian or Other Pacific Islander | Hispanic or Latino | American Indian or Alaska Native | Black or African American |
|---|---|---|---|---|---|---|---|---|
| 2000 | 273 | NA | 284 | 270 | NA | 253 | 259 | 244 |
| 2003 | 278 | NA | 288 | 280 | NA | 259 | 263 | 252 |
| 2005 | 279 | NA | 289 | 280 | NA | 262 | 264 | 255 |
| 2007 | 281 | NA | 291 | 285 | NA | 265 | 266 | 260 |
| 2009 | 283 | NA | 293 | 286 | NA | 266 | 265 | 261 |
| 2011 | 284 | 305 | 293 | 288 | 269 | 270 | 265 | 262 |
| 2013 | 285 | 309 | 294 | 288 | 275 | 272 | 269 | 263 |
| 2015 | 282 | 307 | 292 | 285 | 276 | 270 | 267 | 260 |
| 2017 | 283 | 312 | 293 | 287 | 274 | 269 | 267 | 260 |
| 2019 | 282 | 313 | 292 | 286 | 266 | 268 | 262 | 260 |
| 2022 | 274 | 306 | 285 | 276 | 264 | 261 | 258 | 253 |
Note(s):
NAEP is National Assessment of Educational Progress. Data are not available for all years. The scale for NAEP mathematics assessment scores is 0–500 for grade 8. Hispanic or Latino may be any race; race categories exclude Hispanic origin. Average scores declined from 2019 to 2022 by statistically significant amounts for all racial and ethnic groups shown except for American Indians or Alaska Natives and Native Hawaiians or Other Pacific Islanders.
Source(s):
NCSES, special tabulations (2022) of the main NAEP 2000–22 mathematics assessments, NCES.
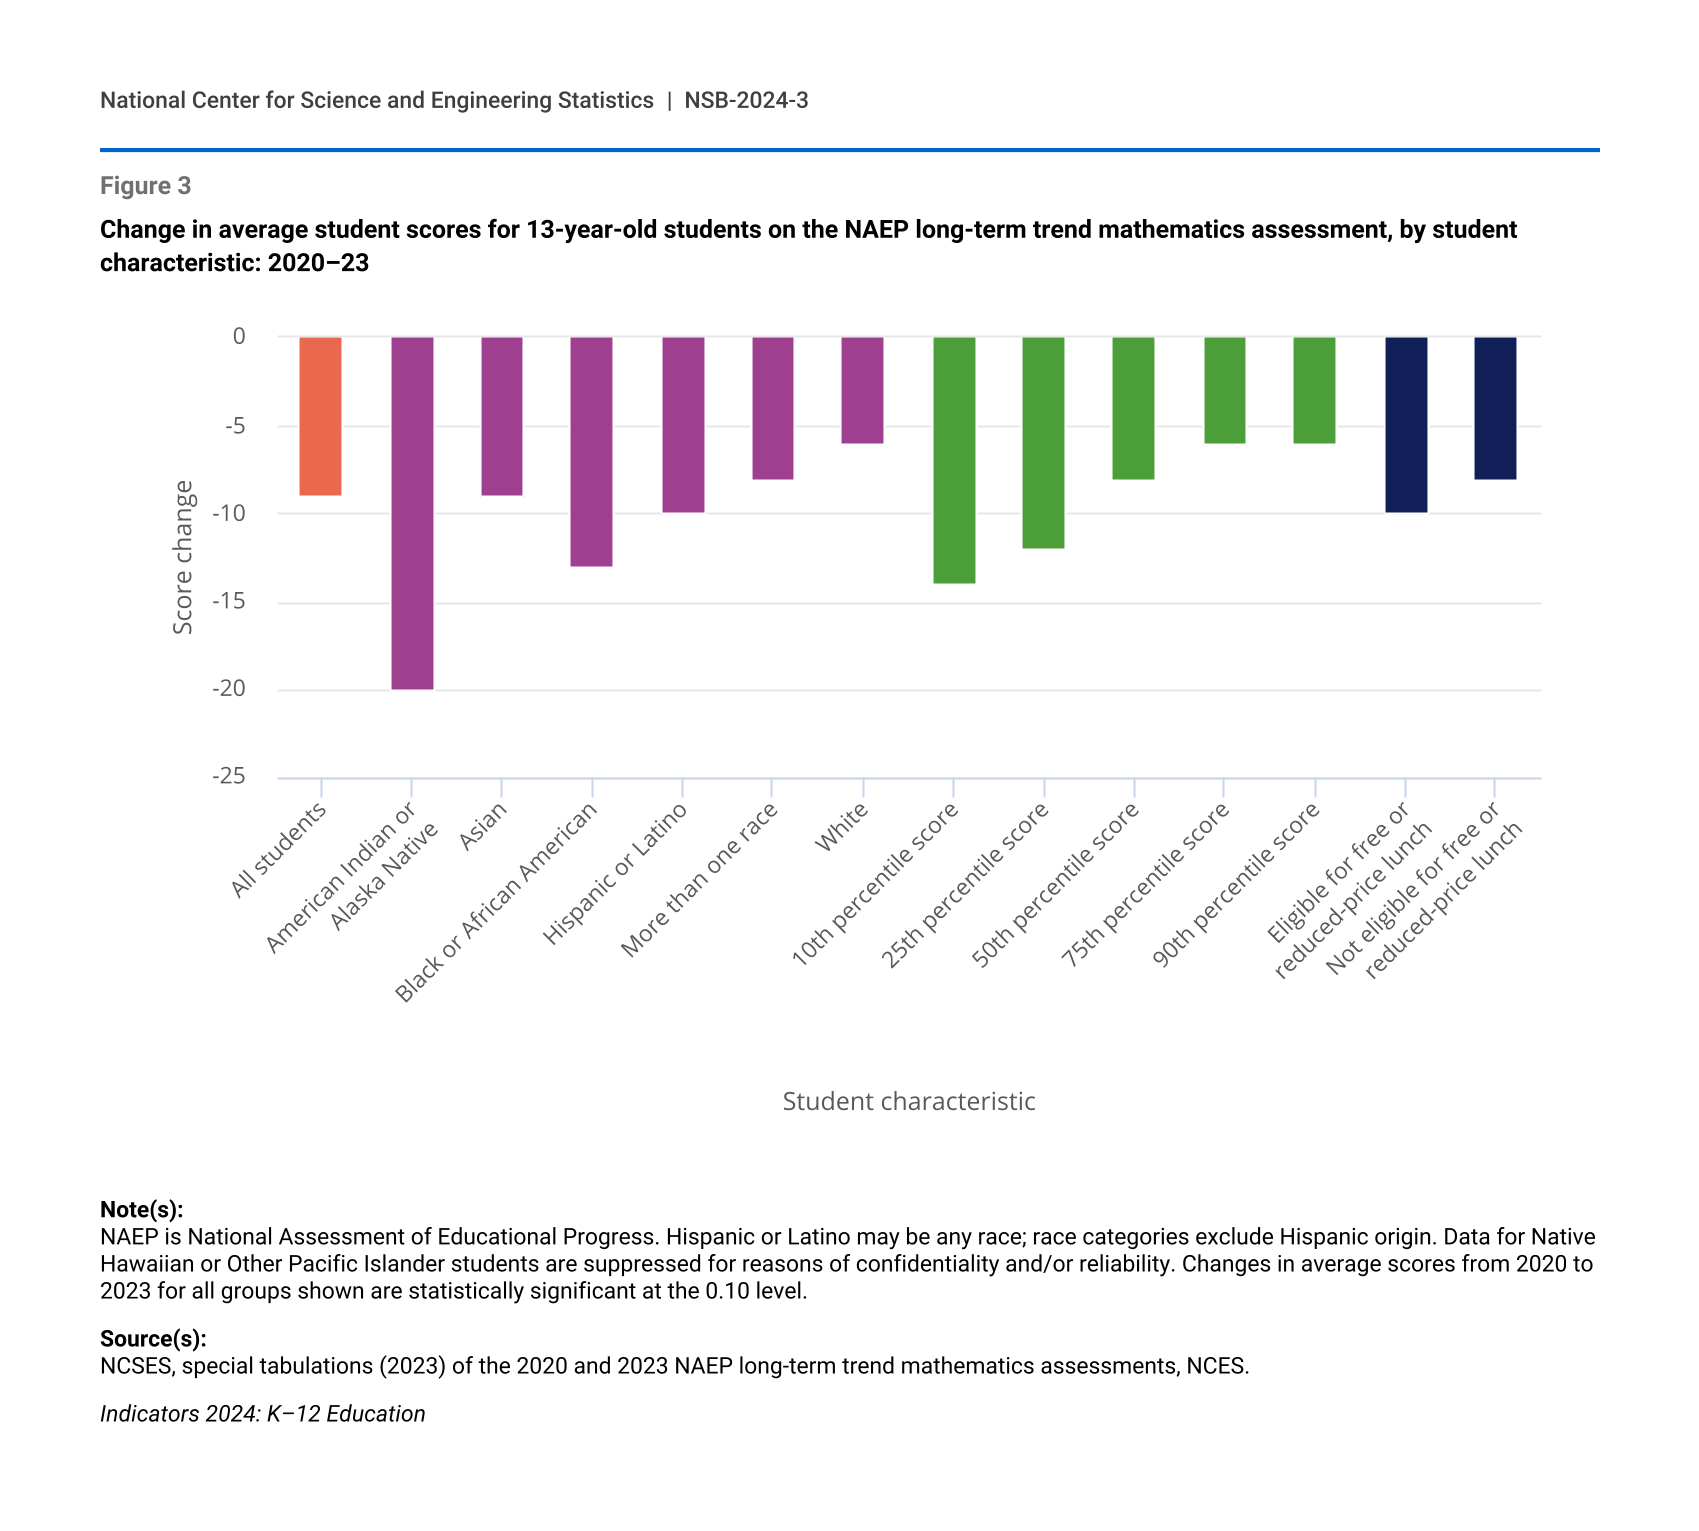
The NAEP long-term trend mathematics assessment, another national assessment of mathematics, also shows a significant post-pandemic decline in student scores (Figure 3). From 2020 to 2023, the average score for all 13-year-old students dropped by 9 points. Among student racial and ethnic groups, score declines included a 20-point drop for American Indian or Alaska Native students and a 6-point drop for White students. Scores for students in the 10th percentile—those scoring near the low end of all assessment takers—dropped by 14 points, whereas scores for students in the 90th percentile dropped by 6 points. As a result, the gap between students scoring in the 10th percentile (213) and the 90th percentile (322) widened to 109 points, the largest it has been since the assessment began in 1978. With respect to student socioeconomic status, students eligible for free or reduced-price lunch—a commonly used indicator of family poverty—scored significantly lower in 2023 (253) than students ineligible for the program (287). Both groups of students experienced significant declines in test scores from 2020 to 2023.
Change in average student scores for 13-year-old students on the NAEP long-term trend mathematics assessment, by student characteristic: 2020–23
| Student characteristic | Score change between 2020 and 2023 |
|---|---|
| All students | -9 |
| American Indian or Alaska Native | -20 |
| Asian | -9 |
| Black or African American | -13 |
| Hispanic or Latino | -10 |
| More than one race | -8 |
| White | -6 |
| 10th percentile score | -14 |
| 25th percentile score | -12 |
| 50th percentile score | -8 |
| 75th percentile score | -6 |
| 90th percentile score | -6 |
| Eligible for free or reduced-price lunch | -10 |
| Not eligible for free or reduced-price lunch | -8 |
Note(s):
NAEP is National Assessment of Educational Progress. Hispanic or Latino may be any race; race categories exclude Hispanic origin. Data for Native Hawaiian or Other Pacific Islander students are suppressed for reasons of confidentiality and/or reliability. Changes in average scores from 2020 to 2023 for all groups shown are statistically significant at the 0.10 level.
Source(s):
NCSES, special tabulations (2023) of the 2020 and 2023 NAEP long-term trend mathematics assessments, NCES.
Indicators 2024: K–12 Education
S&E Higher Education in the United States
Although some students transition directly from high school to the STEM labor force, the nation’s S&E enterprise depends heavily on recipients of higher education degrees in S&E fields (see Glossary section for a list of S&E fields). The number of certificates and degrees awarded in S&E fields increased at each degree level in the past decade, with total S&E awards (including all certificates and associate’s, bachelor’s, master’s, and doctoral degrees) increasing from 982,000 in 2012 to 1,310,000 in 2021. The share of degrees awarded in S&E fields increased for all levels except doctoral degrees; however, the share of degrees awarded in S&E fields was the highest at the doctoral level, with 66% of doctoral degrees awarded in S&E fields.
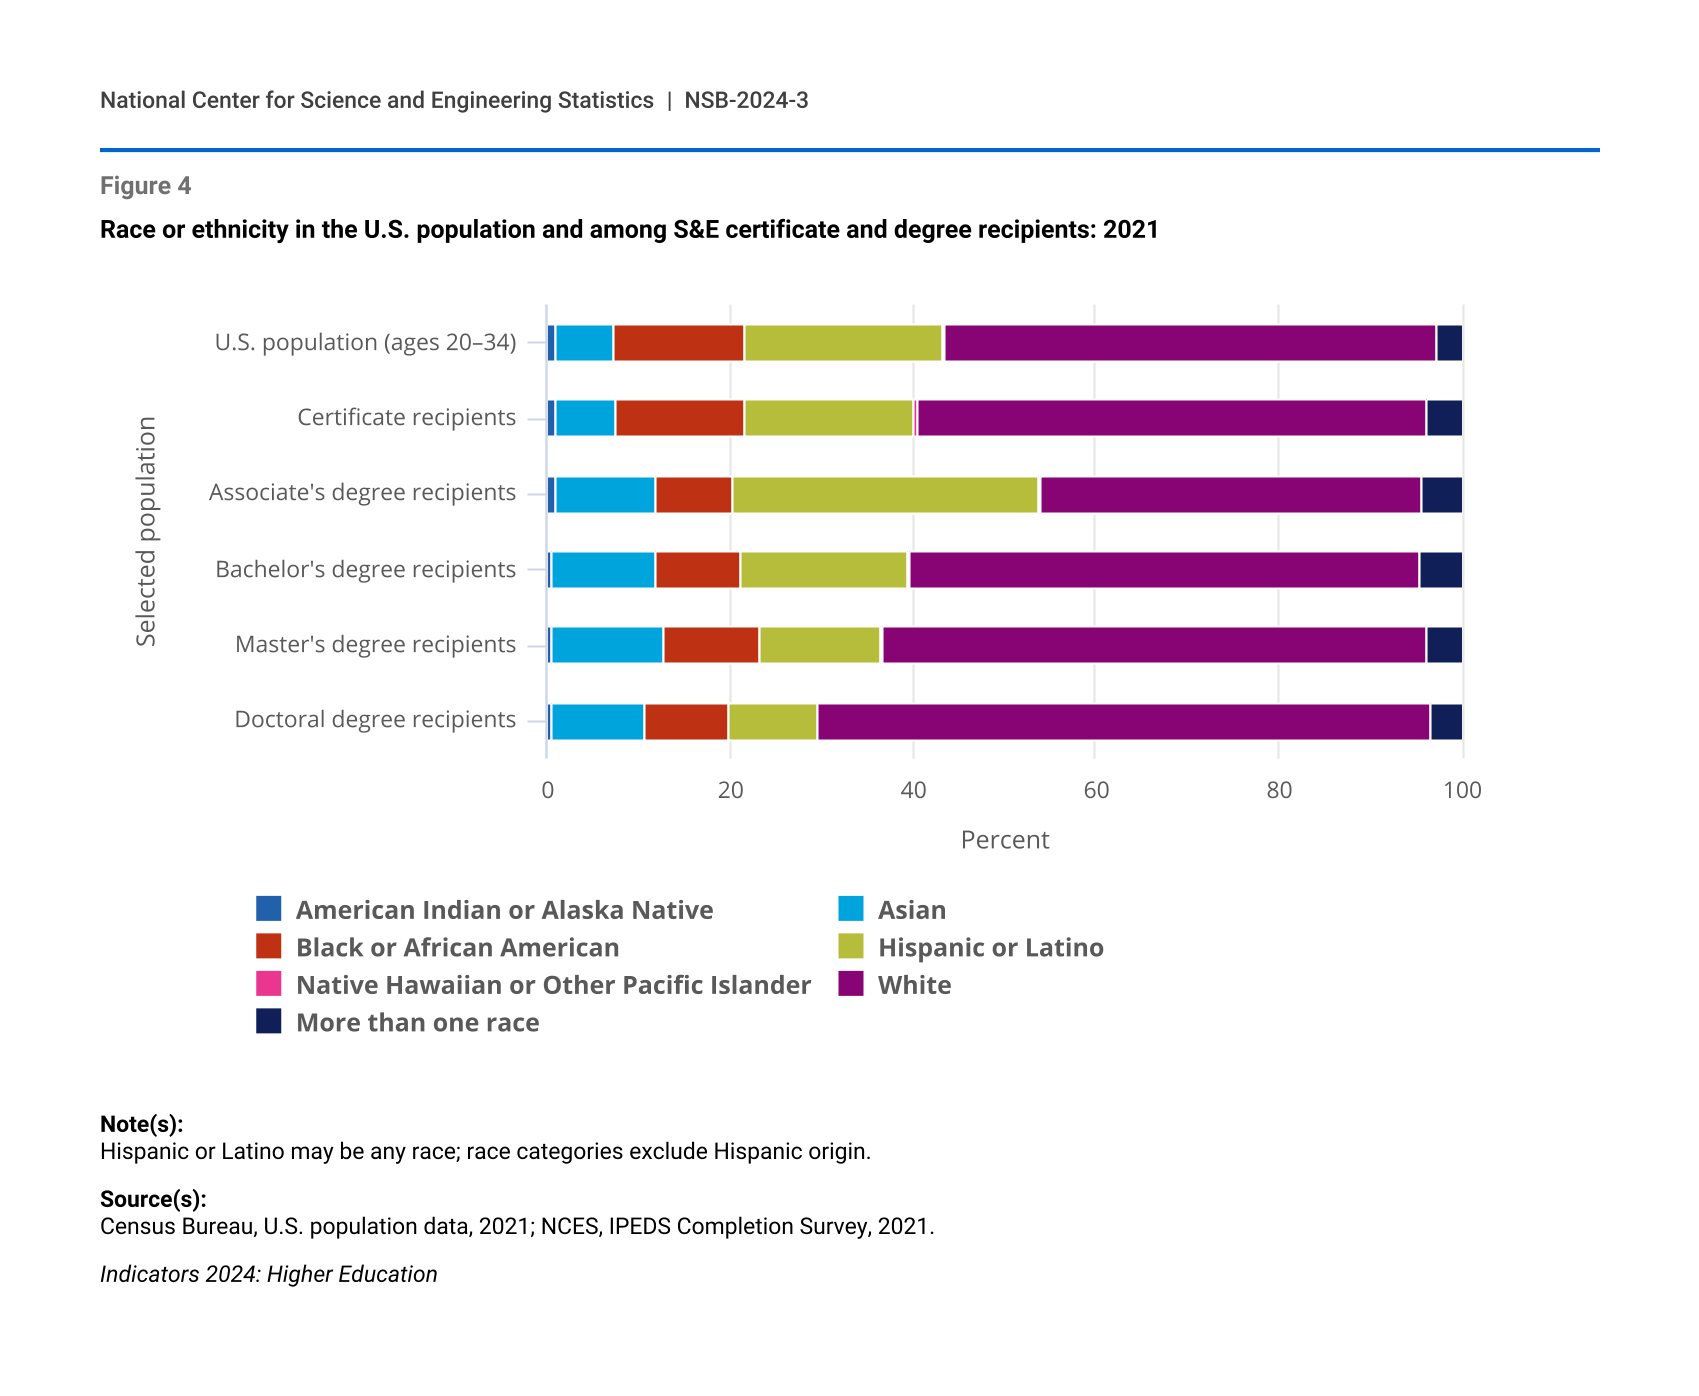
Many groups of Americans remained underrepresented among S&E degree recipients when compared to their share of the U.S. population ages 20–34 years old. The percentage of women varied significantly depending on S&E field, with women accounting for the lowest shares of degree recipients in engineering (24% of bachelor’s degrees in 2021) and computer and information sciences (22%). In 2021, American Indian or Alaska Native, Black or African American, and Hispanic or Latino students were underrepresented among S&E degree recipients at the bachelor’s level and above. Hispanic or Latino students were overrepresented among S&E associate’s degree recipients (Figure 4).
Race or ethnicity in the U.S. population and among S&E certificate and degree recipients: 2021
| Selected population | American Indian or Alaska Native | Asian | Black or African American | Hispanic or Latino | Native Hawaiian or Other Pacific Islander | White | More than one race |
|---|---|---|---|---|---|---|---|
| U.S. population (ages 20–34) | 0.8 | 6.5 | 14.3 | 21.7 | 0.2 | 53.7 | 2.7 |
| Certificate recipients | 0.9 | 6.6 | 14.1 | 18.6 | 0.3 | 55.7 | 3.8 |
| Associate's degree recipients | 0.8 | 11.1 | 8.3 | 33.5 | 0.4 | 41.7 | 4.3 |
| Bachelor's degree recipients | 0.4 | 11.5 | 9.2 | 18.3 | 0.2 | 55.9 | 4.6 |
| Master's degree recipients | 0.4 | 12.3 | 10.5 | 13.2 | 0.2 | 59.6 | 3.8 |
| Doctoral degree recipients | 0.4 | 10.2 | 9.2 | 9.7 | 0.1 | 66.9 | 3.5 |
Note(s):
Hispanic or Latino may be any race; race categories exclude Hispanic origin.
Source(s):
Census Bureau, U.S. population data, 2021; NCES, IPEDS Completion Survey, 2021.
Many students enter higher education through community colleges, which specialize in providing relatively affordable programs of study, including certificate and associate’s degree programs that require 2 years or less to complete. These institutions prepare students to enter the workforce directly or to transition to primarily 4-year institutions. Community colleges awarded half (50%) of the 79,000 S&E certificates and three-fourths (76%) of the 155,000 S&E associate’s degrees awarded by U.S. institutions in 2021.
The number and growth of higher education degrees awarded in S&E fields vary depending on the degree level. Bachelor’s degrees accounted for 66% of all S&E degrees awarded in 2021, with the largest numbers of bachelor’s degrees awarded in social sciences, followed by psychology, biological and biomedical sciences, and engineering. Master’s degrees either prepare students for advanced STEM careers or mark a step toward obtaining a doctoral degree. The number of master’s degrees awarded in S&E fields increased by 41% from 2012 to 2021, the greatest percentage growth of all degree levels. Master’s degrees awarded in computer and information sciences—53% of which went to students on temporary visas in 2021—increased rapidly during this time to reach 54,000, surpassing the number awarded in engineering (47,000). Engineering was the most common field of S&E doctorate in 2021 (11,000 awarded), and health sciences was the fastest-growing field of S&E doctorate, increasing from over 4,000 degrees in 2012 to over 7,000 in 2021.
The cost of higher education, levels of student borrowing required to pay this cost, and students’ ability to repay student loan debt are topics of discussion among the public and policymakers. In 2020, the median amount borrowed among all 2015–16 bachelor’s degree recipients who had taken out federal student loans was $30,000 and the average was $41,000, indicating that some students borrowed much higher amounts. The total amount borrowed includes borrowing for education after completing the 2015–16 bachelor's degree: graduates who had enrolled for an additional postsecondary degree or certificate had borrowed a median amount of $43,500, compared with a $27,000 median amount among students who had no further enrollment. By 2020, the median amount that 2015–16 bachelor’s degree recipients owed in education loans was 92% of what they had borrowed. Progress in repaying loans for this group of bachelor’s degree recipients differed by S&E degree field. For example, in 2020, median amounts owed were 59% of the amount borrowed for engineering and engineering technology, 74% for computer and information sciences, and 101% for social sciences.
Most S&E doctorate recipients do not incur student debt to support their graduate education. In 2021, large majorities (73% and above) of doctorate recipients in the following fields reported holding no debt related to their graduate education: physical sciences; computer and information sciences; mathematics and statistics; engineering; biological and biomedical sciences; geosciences, atmospheric sciences, and ocean sciences; multidisciplinary and interdisciplinary sciences; and agricultural sciences and natural resources (NCSES 2022a). These are also fields that tend to receive the support of the federal government and academic institutions. In social sciences and in health sciences, the proportion of doctorate recipients with no debt ranged between 53% and 63%; in psychology, it was 48%.
International S&E Higher Education and Student Mobility
The world’s three most populous countries award the highest numbers of S&E first university degrees, roughly equivalent to bachelor’s degrees (see Glossary section for definition of first university degrees). India awarded 2.5 million first university degrees in S&E in 2020, followed by China (2.0 million) and the United States (900,000). On a percentage basis, Mexico and Turkey experienced the most rapid growth in S&E first university degree awards from 2011 to 2020.
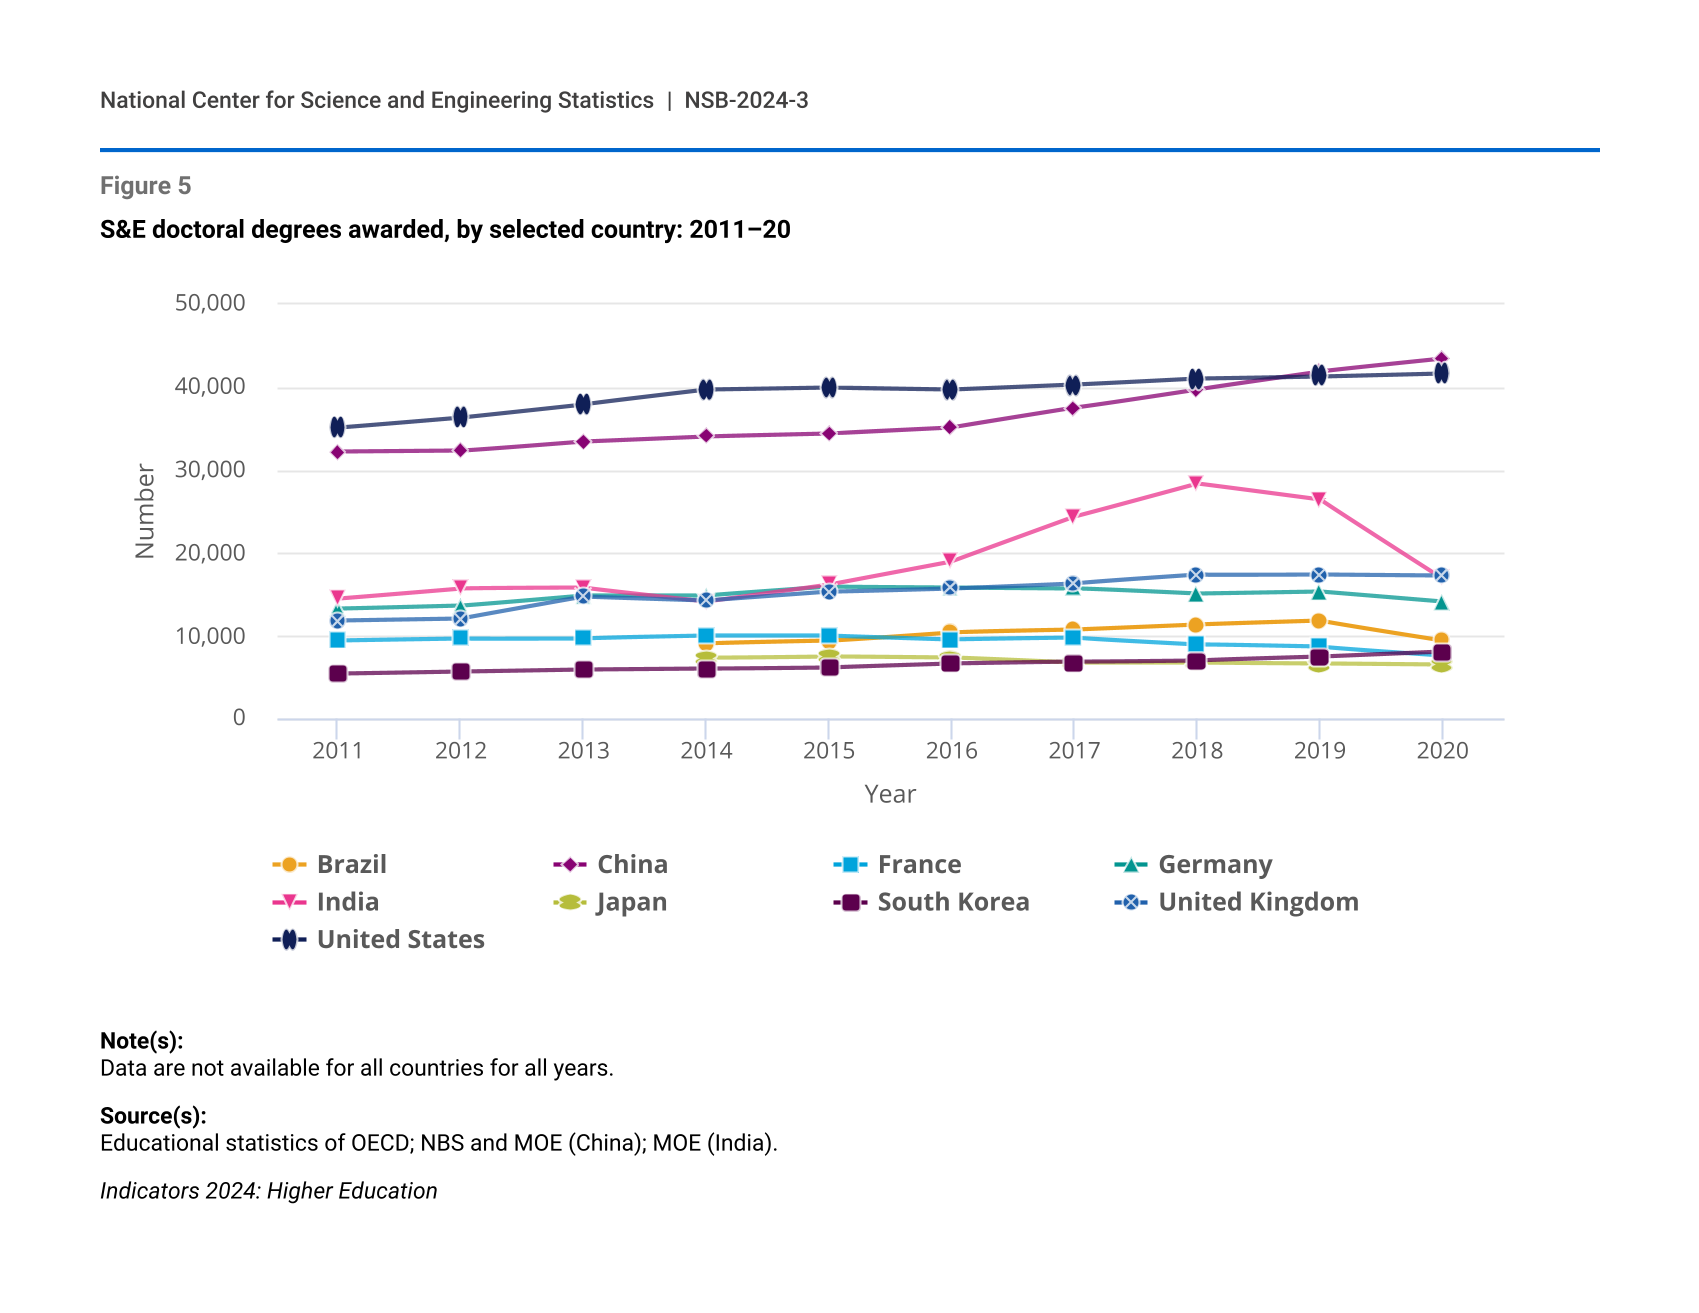
The United States had been a long-standing world leader in S&E doctorate awards but was surpassed by China in 2019. In 2020, China awarded 43,000 S&E doctorates, followed closely by the United States with 42,000 S&E doctorates awarded (Figure 5). China has been the top producer of doctorates in the natural sciences fields (i.e., S&E fields excluding social and behavioral sciences) and engineering since 2007. The number of S&E doctorates awarded in India grew rapidly in the mid-2010s but dropped from 26,000 in 2019 to 17,000 in 2020 amid COVID-19 pandemic-related disruptions—slightly below the number awarded in the United Kingdom. The United States measures far higher than China and India in the share of its postsecondary-age population (individuals ages 20–34 years old) earning S&E degrees; however, the share of the U.S. population earning S&E doctorates is lower than that of the United Kingdom or Germany.
S&E doctoral degrees awarded, by selected country: 2011–20
| Year | Brazil | China | France | Germany | India | Japan | South Korea | United Kingdom | United States |
|---|---|---|---|---|---|---|---|---|---|
| 2011 | NA | 32,208 | 9,466 | 13,281 | 14,498 | NA | 5,454 | 11,859 | 35,113 |
| 2012 | NA | 32,331 | 9,692 | 13,666 | 15,730 | NA | 5,713 | 12,103 | 36,356 |
| 2013 | NA | 33,490 | 9,731 | 14,936 | 15,786 | NA | 5,963 | 14,732 | 37,951 |
| 2014 | 9,124 | 34,103 | 10,023 | 14,912 | 14,163 | 7,357 | 6,087 | 14,271 | 39,682 |
| 2015 | 9,414 | 34,440 | 10,020 | 15,957 | 16,216 | 7,540 | 6,240 | 15,337 | 39,933 |
| 2016 | 10,469 | 35,147 | 9,564 | 15,871 | 19,001 | 7,391 | 6,689 | 15,757 | 39,710 |
| 2017 | 10,752 | 37,506 | 9,755 | 15,761 | 24,383 | 6,745 | 6,903 | 16,372 | 40,319 |
| 2018 | 11,365 | 39,768 | 8,987 | 15,061 | 28,394 | 6,754 | 7,077 | 17,366 | 41,071 |
| 2019 | 11,817 | 41,890 | 8,683 | 15,309 | 26,443 | 6,646 | 7,504 | 17,438 | 41,333 |
| 2020 | 9,492 | 43,399 | 7,691 | 14,092 | 16,968 | 6,506 | 8,125 | 17,312 | 41,701 |
Note(s):
Data are not available for all countries for all years.
Source(s):
Educational statistics of OECD; NBS and MOE (China); MOE (India).
The United States is the most popular destination for internationally mobile students, hosting 15% of all international students worldwide in 2020. Students on temporary visas studying in the United States earn a small proportion of S&E undergraduate degrees but a much higher share of S&E graduate degrees. In 2021, temporary visa holders earned 3% of S&E associate’s degrees, 7% of S&E bachelor’s degrees, 34% of S&E master’s degrees, and 35% of S&E doctoral degrees. Between 2012 and 2021, the shares of S&E degrees earned by temporary visa holders increased for all degree levels, although most substantially at the master’s level.
Among postsecondary degree recipients, those on temporary visas are more likely than U.S. citizens and permanent residents to earn their degree in S&E fields, especially at advanced degree levels. In 2021, 57% of master’s degrees awarded to temporary visa holders were in S&E fields, compared with 19% for U.S. citizens and permanent residents. Among doctoral degree recipients, the vast majority (83%) of temporary visa holders earned degrees in S&E fields, compared with 59% of U.S. citizens and permanent residents. The overall high representation of temporary visa holders among S&E advanced degree recipients varies greatly by S&E field. In 2021, temporary visa holders earned 7% of doctoral degrees in psychology. In contrast, they earned more than half of doctoral degrees in computer and information sciences (59%), engineering (60%), and mathematics and statistics (54%), all S&E fields that the National Science Board has linked to critical and emerging technologies crucial for national security and economic prosperity (NSB 2022).
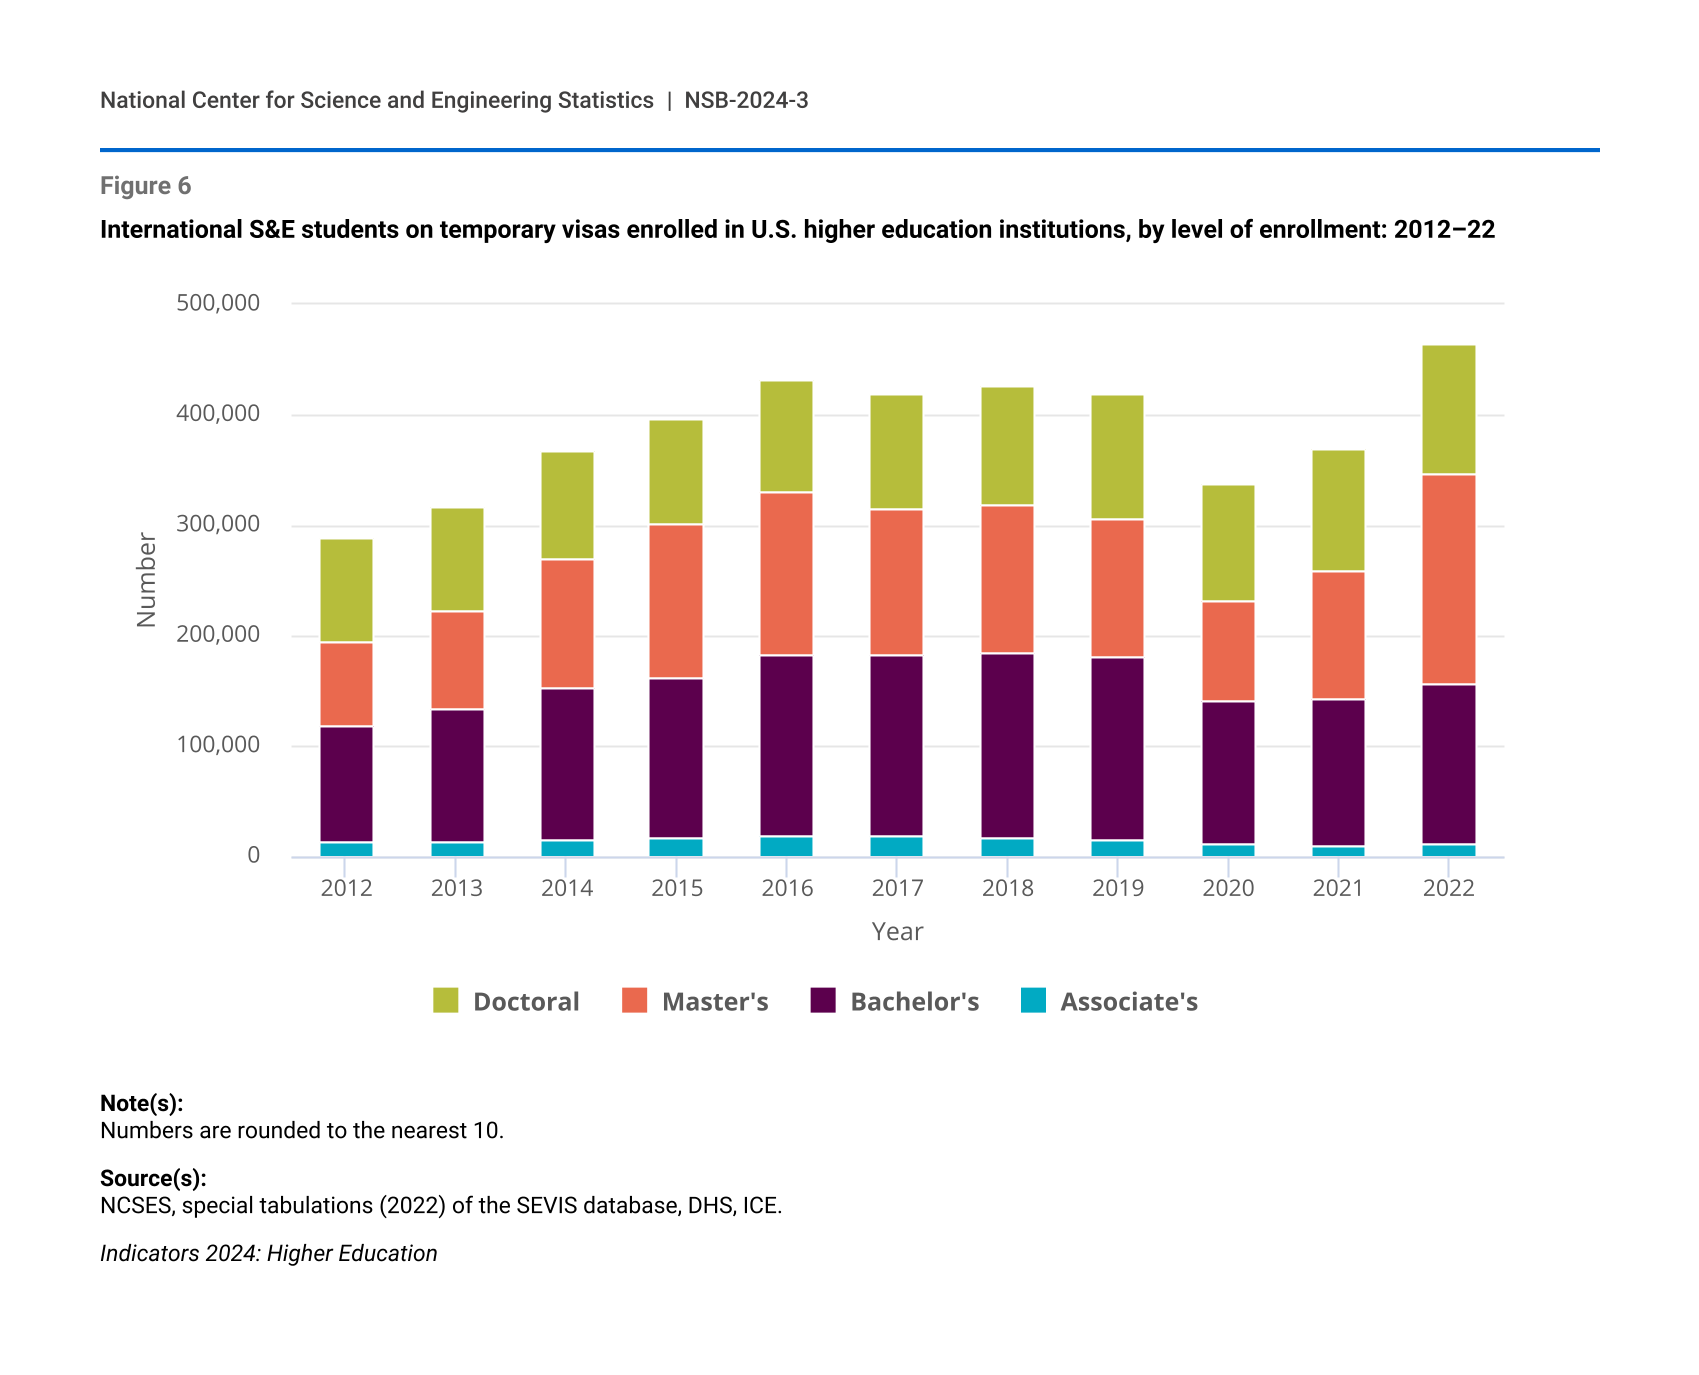
The number of international students on temporary visas who travel to the United States to earn postsecondary degrees in S&E fields has increased substantially since the first year of the COVID-19 pandemic in 2020, up by 37% (almost 130,000 students) from fall 2020 to fall 2022 (Figure 6). International S&E master’s enrollment more than doubled from 2020 to 2022, pushing total international S&E graduate enrollment to nearly 310,000 in 2022, the highest level in the past decade. This increase has been driven by rapid growth in enrollment of S&E master’s students from India, who are concentrated in computer sciences and engineering. Enrollment of S&E graduate students from China, the most common country of origin at the doctoral level, has also increased since 2020, but not to the extent as enrollment of students from India.
International S&E students on temporary visas enrolled in U.S. higher education institutions, by level of enrollment: 2012–22
| Year | Associate's | Bachelor's | Master's | Doctoral |
|---|---|---|---|---|
| 2012 | 12,910 | 106,290 | 75,280 | 94,130 |
| 2013 | 13,650 | 120,030 | 88,960 | 93,410 |
| 2014 | 15,490 | 136,560 | 118,640 | 96,370 |
| 2015 | 17,130 | 145,530 | 138,460 | 94,590 |
| 2016 | 19,770 | 162,490 | 148,450 | 102,240 |
| 2017 | 18,920 | 164,240 | 132,340 | 104,290 |
| 2018 | 17,520 | 168,090 | 132,460 | 108,490 |
| 2019 | 15,720 | 165,630 | 124,240 | 114,140 |
| 2020 | 11,550 | 130,620 | 89,370 | 106,580 |
| 2021 | 8,830 | 134,370 | 115,530 | 110,150 |
| 2022 | 10,660 | 145,660 | 190,760 | 117,390 |
Note(s):
Numbers are rounded to the nearest 10.
Source(s):
NCSES, special tabulations (2022) of the SEVIS database, DHS, ICE.
The STEM Labor Market and the Economy
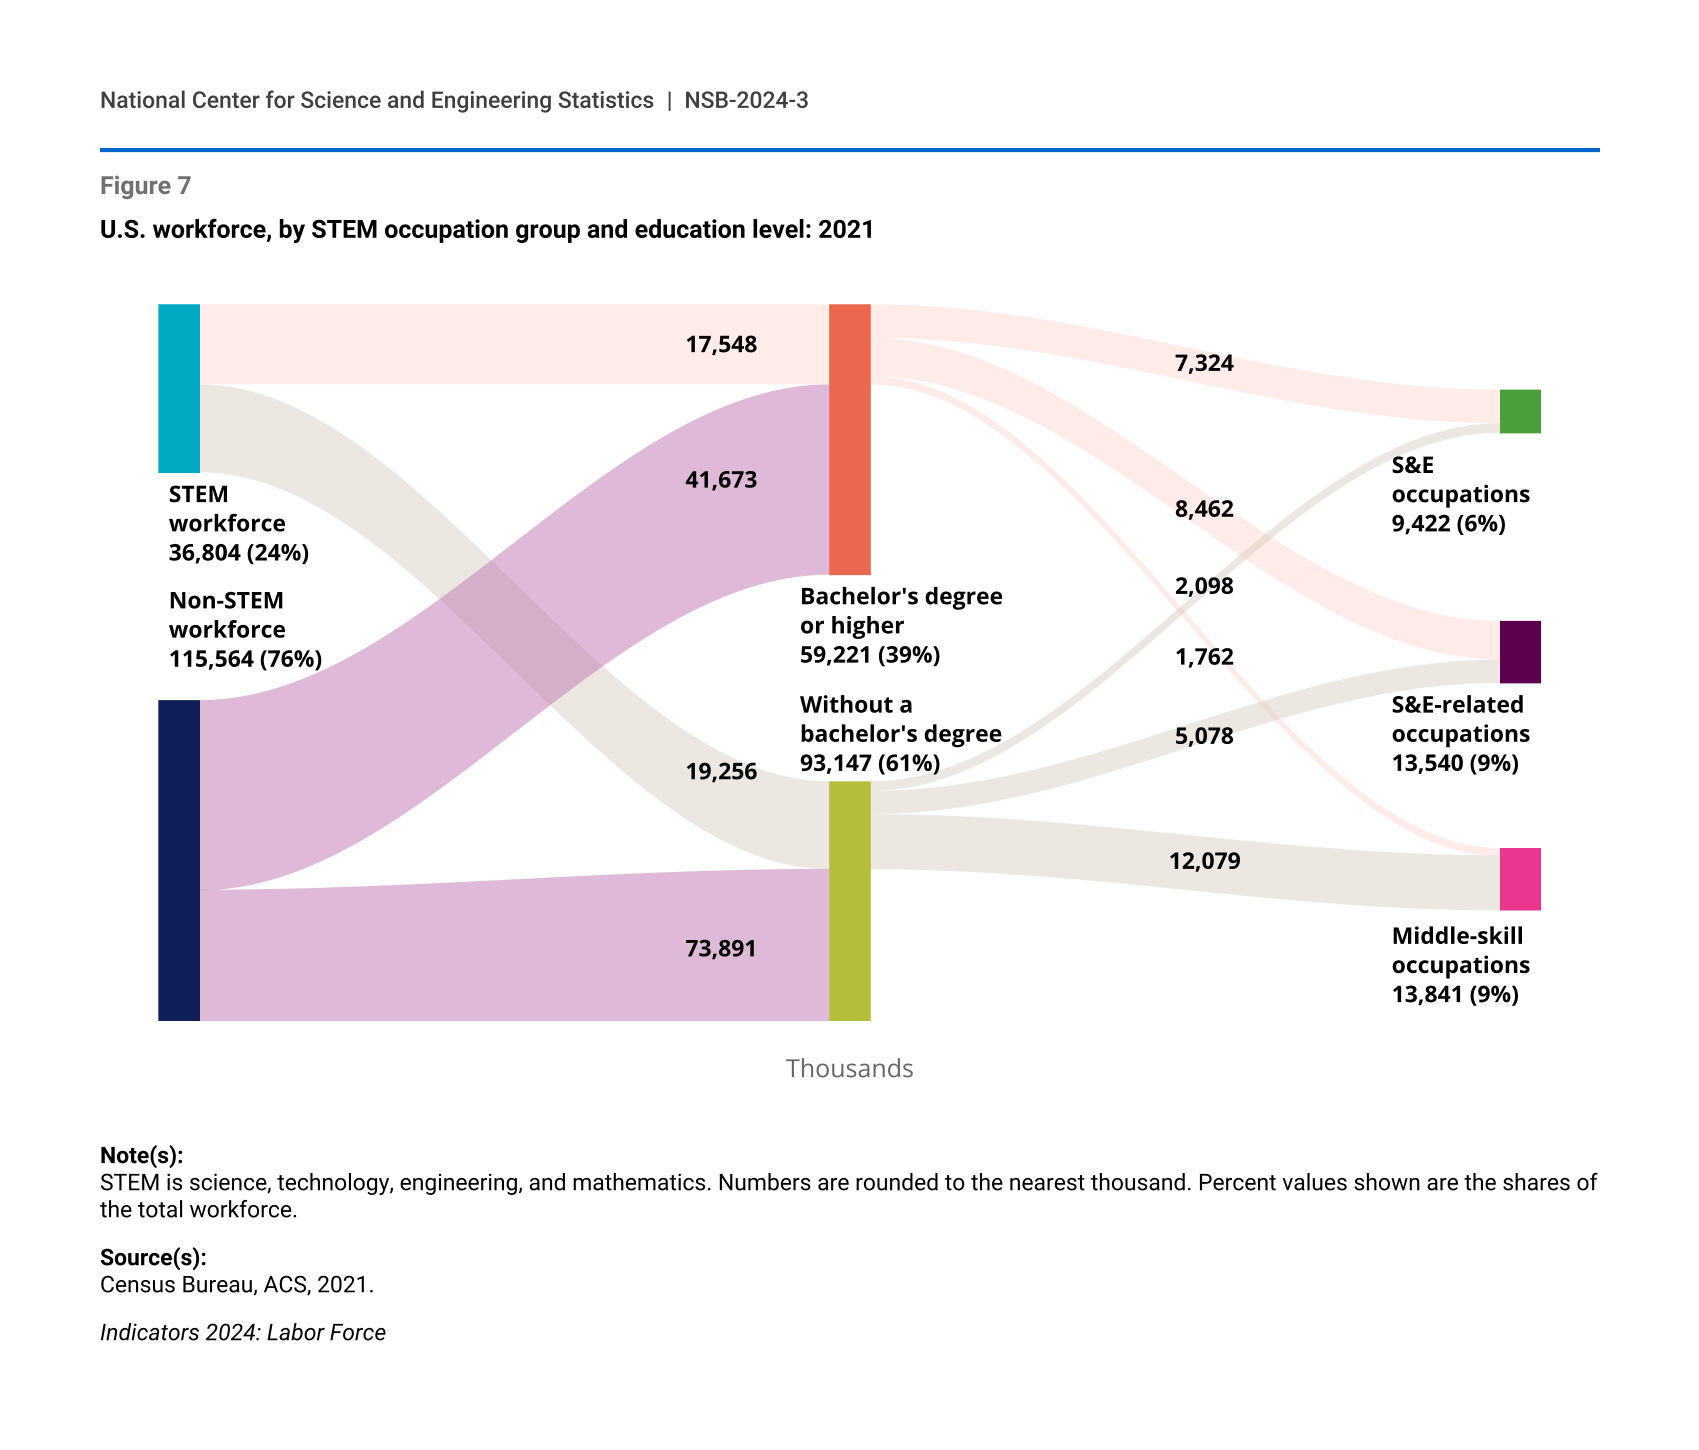
The U.S. STEM workforce comprised 36.8 million people in diverse occupations that require STEM knowledge and expertise in 2021, constituting 24% of the total U.S. workforce (Figure 7). The STEM workforce encompasses all workers who use STEM skills in their jobs, regardless of degree level. It includes 17.5 million workers with at least a bachelor’s degree and 19.3 million workers without a bachelor’s degree. The latter subgroup is defined as the skilled technical workforce (STW).
U.S. workforce, by STEM occupation group and education level: 2021
| Education level and STEM occupation group | Total |
|---|---|
| Total | 152,368 |
| STEM workforce | 36,804 |
| Bachelor's degree or higher | 17,548 |
| S&E occupations | 7,324 |
| S&E-related occupations | 8,462 |
| Middle-skill occupations | 1,762 |
| Without a bachelor's degree | 19,256 |
| S&E occupations | 2,098 |
| S&E-related occupations | 5,078 |
| Middle-skill occupations | 12,079 |
| Non-STEM workforce | 115,564 |
| Bachelor's degree or higher | 41,673 |
| Without a bachelor's degree | 73,891 |
Note(s):
STEM is science, technology, engineering, and mathematics. Numbers are rounded to the nearest thousand. Percent values shown are the shares of the total workforce.
Source(s):
Census Bureau, ACS, 2021.
The STEM workforce includes S&E occupations and S&E-related occupations, as well as middle-skill occupations that require STEM skills but typically do not require a bachelor’s degree for entry (see Glossary section for definitions of S&E, S&E-related, and middle-skill occupations). Of the 9.4 million workers in S&E occupations, 7.3 million (78%) hold at least a bachelor’s degree (Figure 7). Most (62%) of the 13.5 million workers in S&E-related occupations also hold at least a bachelor’s degree. In contrast, of the 13.8 million workers in middle-skill occupations, only 1.8 million (13%) have at least a bachelor’s degree.
Over the past decade, the STEM workforce grew both in number and in the percentage of the total workforce. Between 2011 and 2021, STEM workers increased from 22% to 24% of the U.S. workforce. By educational attainment, the STEM workforce with a bachelor’s degree or higher increased more (growth of 5.7 million workers) than the STW (growth of 1.4 million workers). The expansion of the STEM workforce during this period was also unequally distributed among the different types of STEM occupations. From 2011 to 2021, the number of workers in S&E occupations increased by 62% (3.6 million), whereas S&E-related occupations increased by 26% (2.8 million) and middle-skill occupations increased by 6% (0.8 million).
Workers in STEM occupations have higher employment rates and higher median earnings than their non-STEM counterparts. During the economic downturn associated with the coronavirus pandemic, STEM workers experienced a smaller decrease in their employment rate than non-STEM workers between 2019 and 2021. By 2021, the employment rate of the STEM labor force remained higher than that of the non-STEM labor force (86% versus 79%). STEM workers also earned a higher median annual salary than non-STEM workers in 2021 ($69,000 versus $50,000).
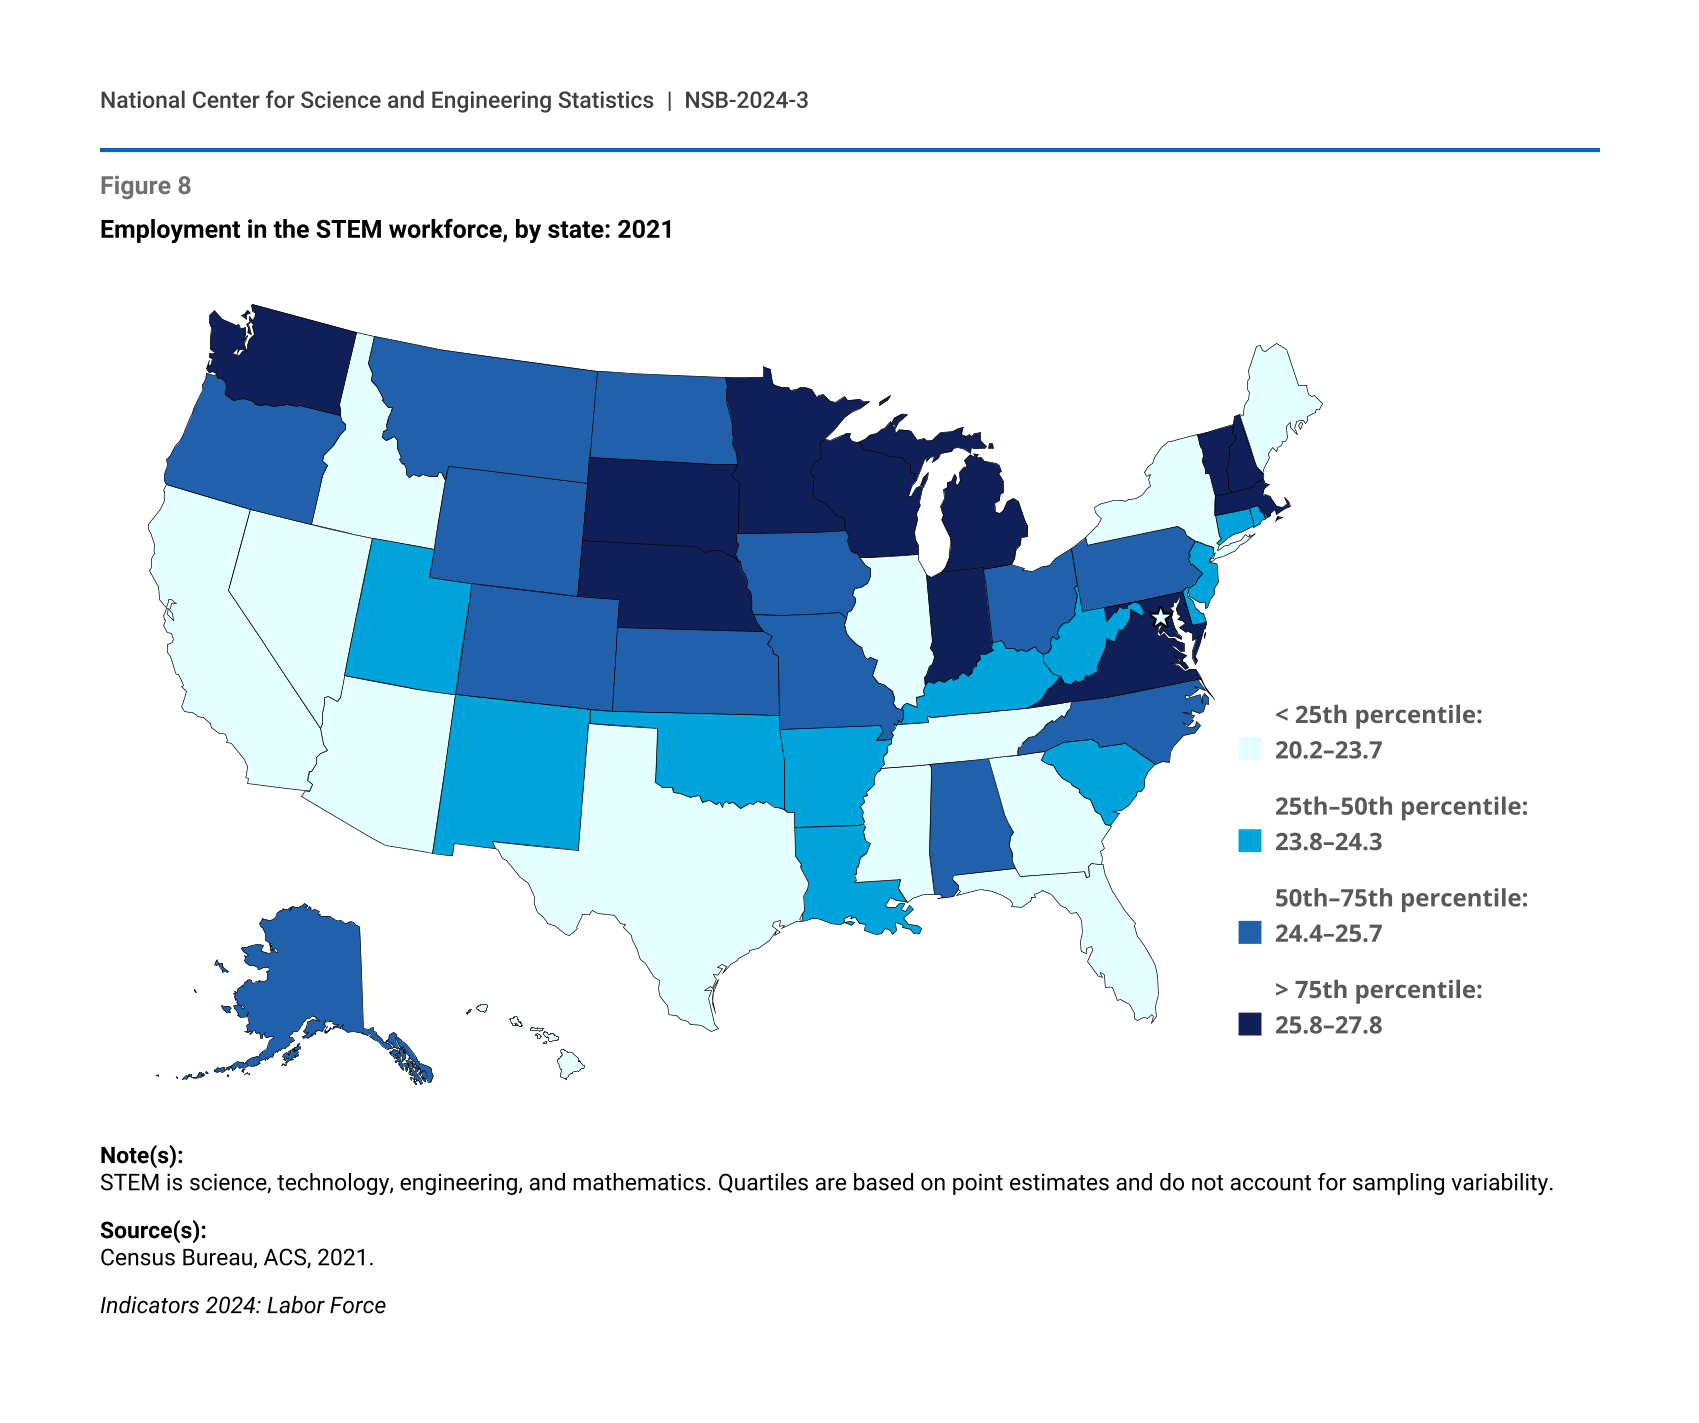
The prevalence of STEM workers throughout the United States is uneven. In 2021, the national share of workers employed in STEM occupations was 24%, with STEM employment shares at the state level ranging from 20% to 28% (Figure 8). States with the highest shares (top quartile) of STEM workers with a bachelor’s degree or higher were primarily located on the West Coast and in the Northeast corridor from the Washington, DC, area to New England. States in the top quartile of shares of the STW (STEM workers without a bachelor’s degree or higher) employment were mostly in the South and Midwest.
Employment in the STEM workforce, by state: 2021
| State | STEM workforce as a percentage of total workforce |
|---|---|
| Alabama | 25.0 |
| Alaska | 24.8 |
| Arizona | 23.6 |
| Arkansas | 24.0 |
| California | 23.3 |
| Colorado | 25.7 |
| Connecticut | 24.3 |
| Delaware | 24.2 |
| District of Columbia | 20.2 |
| Florida | 21.6 |
| Georgia | 23.3 |
| Hawaii | 21.2 |
| Idaho | 23.3 |
| Illinois | 23.7 |
| Indiana | 25.8 |
| Iowa | 25.0 |
| Kansas | 25.5 |
| Kentucky | 24.2 |
| Louisiana | 23.8 |
| Maine | 23.7 |
| Maryland | 26.8 |
| Massachusetts | 26.5 |
| Michigan | 25.9 |
| Minnesota | 26.2 |
| Mississippi | 23.1 |
| Missouri | 24.7 |
| Montana | 24.5 |
| Nebraska | 26.5 |
| Nevada | 20.3 |
| New Hampshire | 27.8 |
| New Jersey | 23.8 |
| New Mexico | 24.1 |
| New York | 21.7 |
| North Carolina | 25.2 |
| North Dakota | 25.7 |
| Ohio | 25.0 |
| Oklahoma | 23.9 |
| Oregon | 24.8 |
| Pennsylvania | 25.2 |
| Rhode Island | 24.0 |
| South Carolina | 24.3 |
| South Dakota | 26.8 |
| Tennessee | 23.6 |
| Texas | 23.5 |
| Utah | 24.3 |
| Vermont | 26.4 |
| Virginia | 26.0 |
| Washington | 27.0 |
| West Virginia | 24.2 |
| Wisconsin | 26.1 |
| Wyoming | 25.0 |
Note(s):
STEM is science, technology, engineering, and mathematics. Quartiles are based on point estimates and do not account for sampling variability.
Source(s):
Census Bureau, ACS, 2021.
Demographic Composition of the STEM Workforce
Women made up 35% of the STEM workforce in 2021, less than their share of the employed U.S. population (47%). Women made up 44% of STEM workers with bachelor’s degrees or higher and about a quarter of the STW (26%). With respect to type of STEM occupations, women accounted for a minority of workers in S&E occupations (27%) and in middle-skill occupations (10%) but a majority of workers in S&E-related occupations (65%).
Racial and ethnic representation also varies in the STEM workforce and within types of STEM occupations. Black or African American, Hispanic or Latino, and American Indian or Alaska Native individuals collectively accounted for 23% of the STEM workforce in 2021, compared with 30% of the total U.S. workforce (Table 1). Each of these groups was underrepresented in the STEM workforce relative to their share of the total U.S. workforce and had the lowest levels of representation in S&E occupations in particular. For example, in 2021, Black or African American individuals made up 11% of all workers, 8% of STEM workers, and 7% of workers in S&E occupations. In contrast, Asian individuals accounted for 18% of S&E workers, almost triple their share of the total workforce. Despite the underrepresentation of Hispanic or Latino workers in the overall STEM workforce, they accounted for a higher share of middle-skill STEM workers (22%) than their share of the total workforce (18%).
Distribution of select racial and ethnic groups in the workforce, by occupational group: 2021
Note(s):
STEM is science, technology, engineering, and mathematics. Hispanic or Latino may be any race; race categories exclude Hispanic origin.
Source(s):
Census Bureau, ACS, 2021.
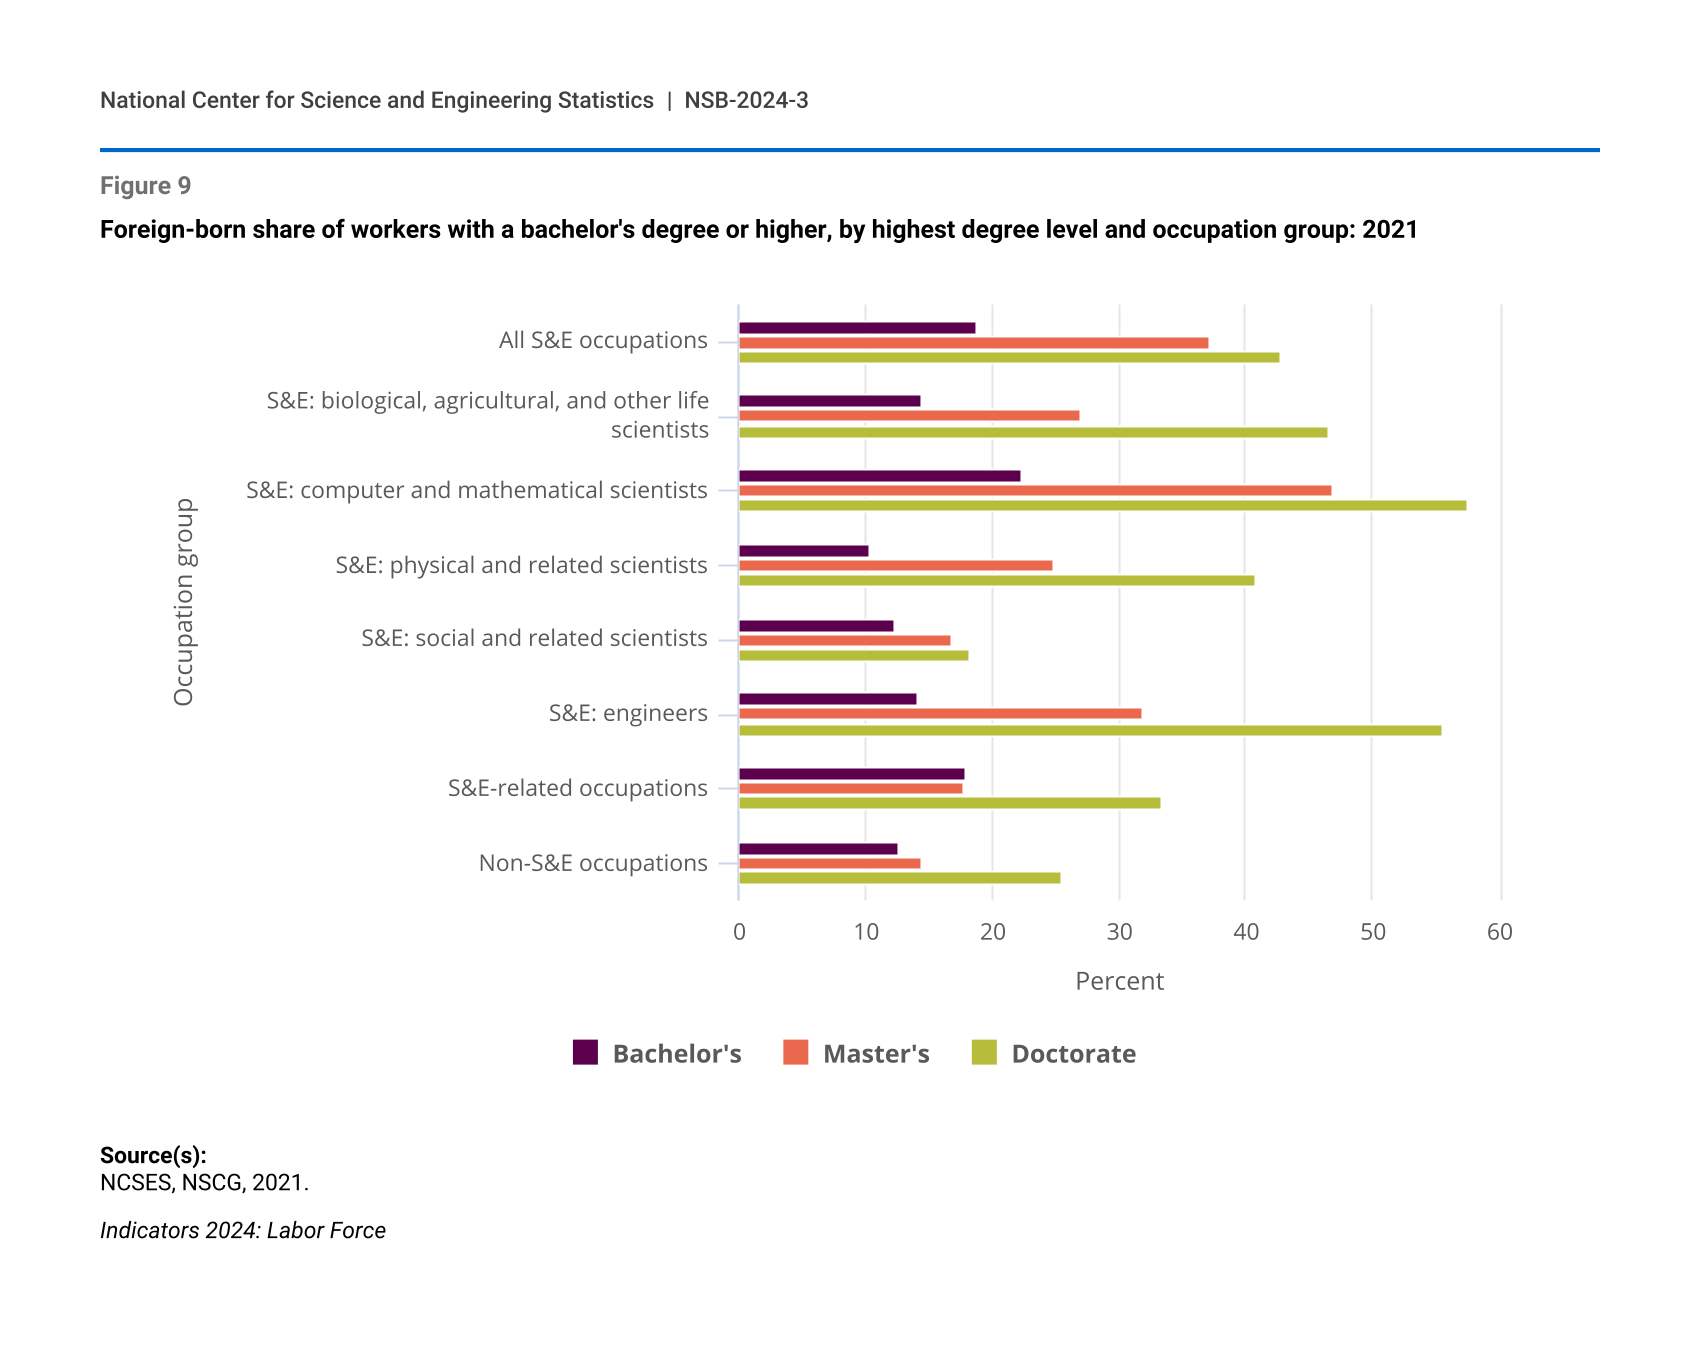
In 2021, foreign-born workers (regardless of citizenship status) accounted for 19% of the STEM workforce. Foreign-born workers accounted for 19% of workers in S&E occupations at the bachelor’s degree level, 37% at the master’s degree level, and 43% at the doctorate level (Figure 9). More than half of doctorate-level computer and mathematical scientists and engineers—occupations associated with critical and emerging technologies by the National Science Board (NSB 2022)—working in the United States were born outside the country. Including workers of all education levels, India and China were the leading birthplaces of foreign-born S&E workers in the United States, accounting for 29% and 12%, respectively, of all foreign-born S&E workers.
Foreign-born share of workers with a bachelor's degree or higher, by highest degree level and occupation group: 2021
| Occupation group | Bachelor's | Master's | Doctorate |
|---|---|---|---|
| All S&E occupations | 18.7 | 37.2 | 42.8 |
| S&E: biological, agricultural, and other life scientists | 14.4 | 26.9 | 46.6 |
| S&E: computer and mathematical scientists | 22.3 | 46.8 | 57.6 |
| S&E: physical and related scientists | 10.3 | 24.9 | 40.8 |
| S&E: social and related scientists | 12.3 | 16.7 | 18.2 |
| S&E: engineers | 14.2 | 31.9 | 55.5 |
| S&E-related occupations | 17.9 | 17.7 | 33.3 |
| Non-S&E occupations | 12.7 | 14.5 | 25.4 |
Source(s):
NCSES, NSCG, 2021.
U.S.-trained S&E doctorate recipients who were on temporary visas at the time of graduation are a vital source of STEM workers for the U.S. economy. From 2018 to 2021, temporary visa holders—most commonly from China or India—accounted for 37% of U.S. S&E research doctorate recipients, and over 70% of these S&E doctorate recipients stated that they intend to live in the United States in the year after graduation. NCSES surveys of S&E doctorate recipients 5 years and 10 years after receiving their doctorates show that a majority of those who were on temporary visas at the time of graduation remained in the United States for significant amounts of time. When S&E doctorate recipients were surveyed in 2021 across all countries of citizenship and degree fields, the 5-year stay rate for those who were on temporary visas at graduation was 71% and the 10-year stay rate was 65%.
Stay rates varied by doctoral field of degree as well as by country of citizenship at degree award. The 10-year stay rate for engineering, the most common S&E doctoral field of temporary visa holders, was 72%. In contrast, the 10-year stay rate for degree holders in social sciences, a less common doctoral field for temporary visa holders, was 41%, the only field with a 10-year stay rate below 50%. S&E doctorate recipients with Chinese citizenship at graduation had higher than average 5-year and 10-year stay rates (88% and 81%, respectively).
Americans’ Perceptions about Scientists
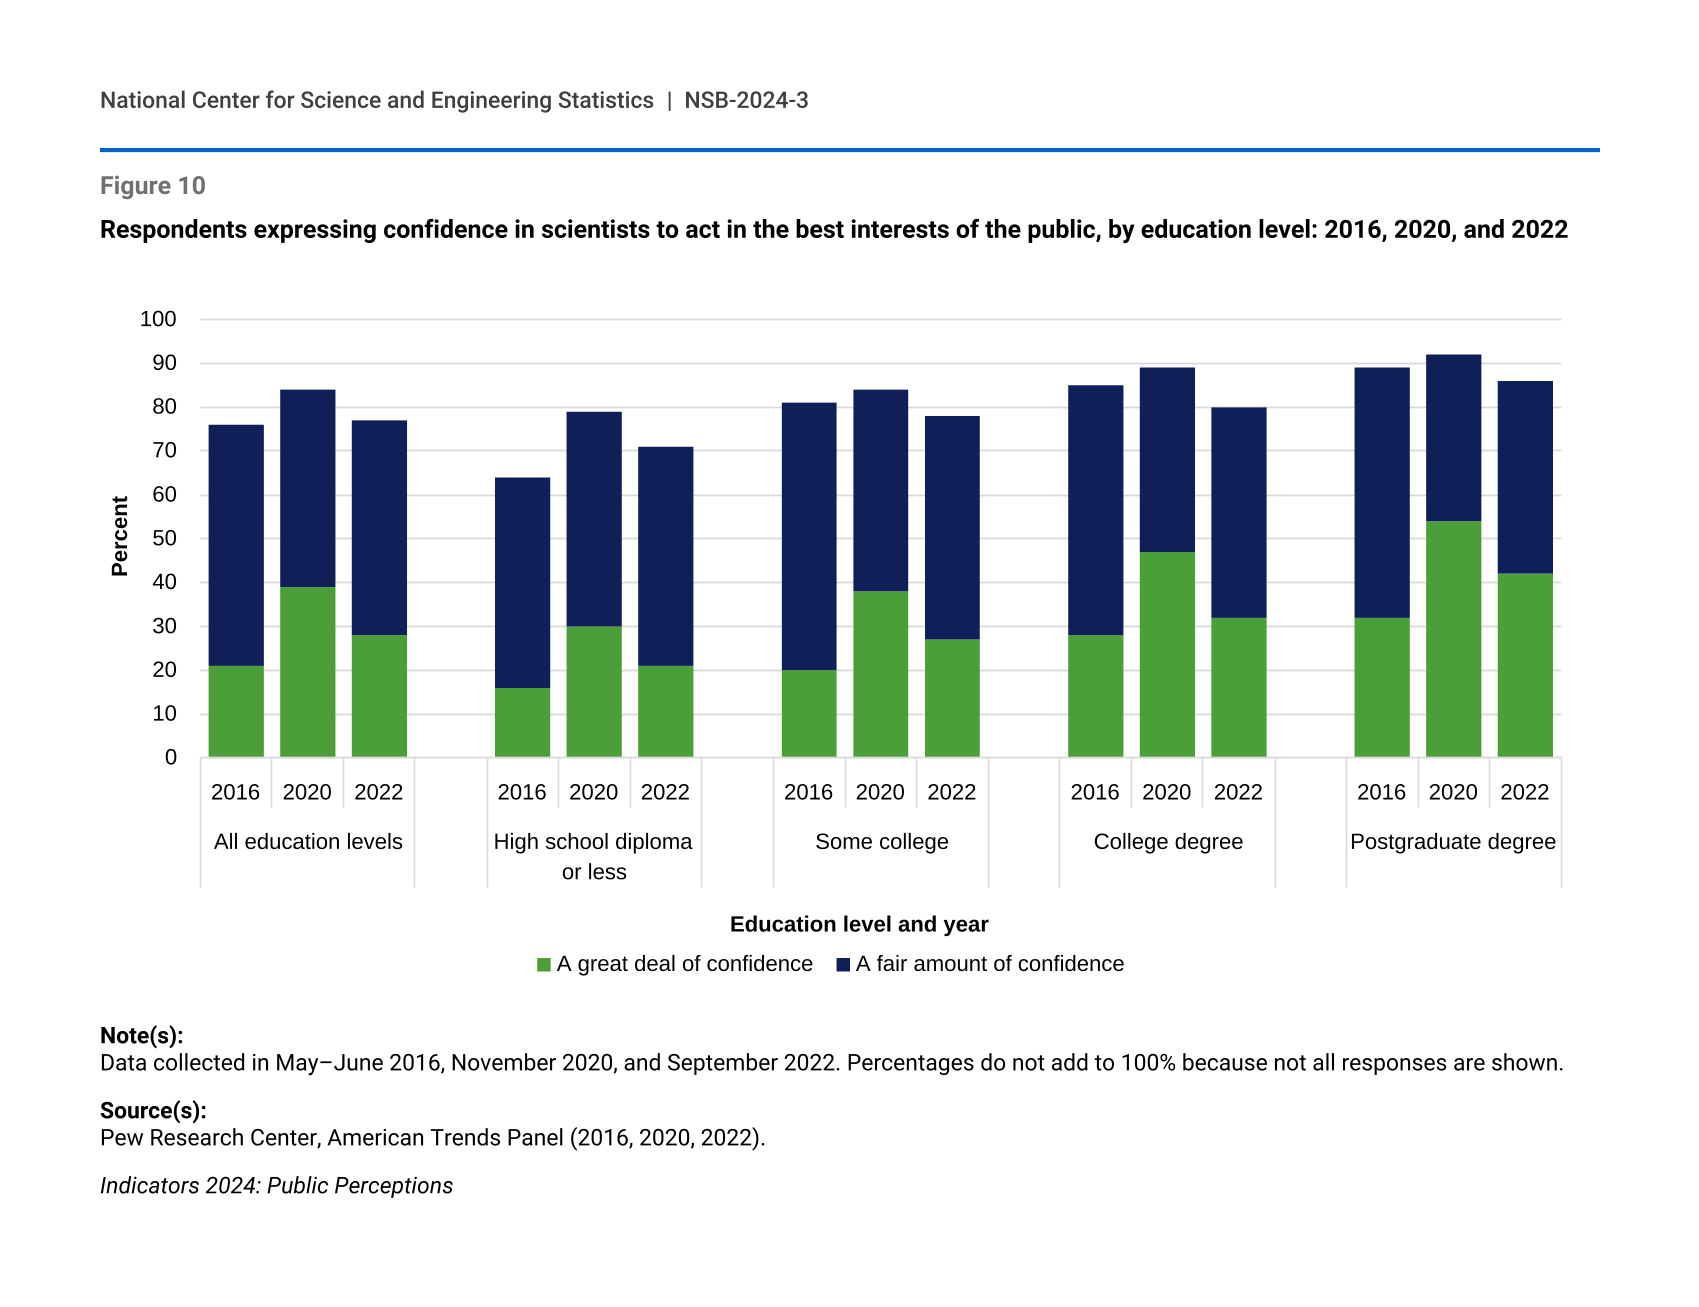
Americans’ degree of trust in scientists has remained high for decades, although it varies by level of education and has fluctuated in recent years. In 2022, 77% of adults in the United States expressed either “a great deal” or “a fair amount” of confidence in scientists to act in the best interests of the public (Figure 10). Looking at just the response of “a great deal,” 21% of adults overall indicated this level of confidence in 2016; this share increased to 39% in 2020 (after the onset of the COVID-19 pandemic) but then decreased to 28% in 2022.
Respondents expressing confidence in scientists to act in the best interests of the public, by education level: 2016, 2020, and 2022
Note(s):
Data collected in May–June 2016, November 2020, and September 2022. Percentages do not add to 100% because not all responses are shown.
Source(s):
Pew Research Center, American Trends Panel (2016, 2020, 2022).
Adults with higher levels of education typically express the greatest degree of trust in scientists, and those with the lowest level of education express the least trust. For example, in 2022, 42% of adults with postgraduate degrees expressed “a great deal” of confidence in scientists to act in the best interests of the public (Figure 10). This share was higher than the share of adults with a college degree (32%) and those with some college (27%) who expressed the same degree of confidence, and it was double the share of adults with a high school diploma or less (21%).