 An official website of the United States government
 Discovery: U.S. and Global R&D
The global competitiveness of the United States in STI is driven not only by the country’s development of a workforce equipped to perform technologically advanced activities but also by its investments in R&D. R&D—creative and systematic work undertaken to increase knowledge and devise new applications for knowledge—fosters scientific and technological breakthroughs and leads to the development of new and improved processes, services, and products. STI competitiveness encourages a strengthened market and workforce, prompting improvements to national living standards, economic sectors, and infrastructure.
Global R&D
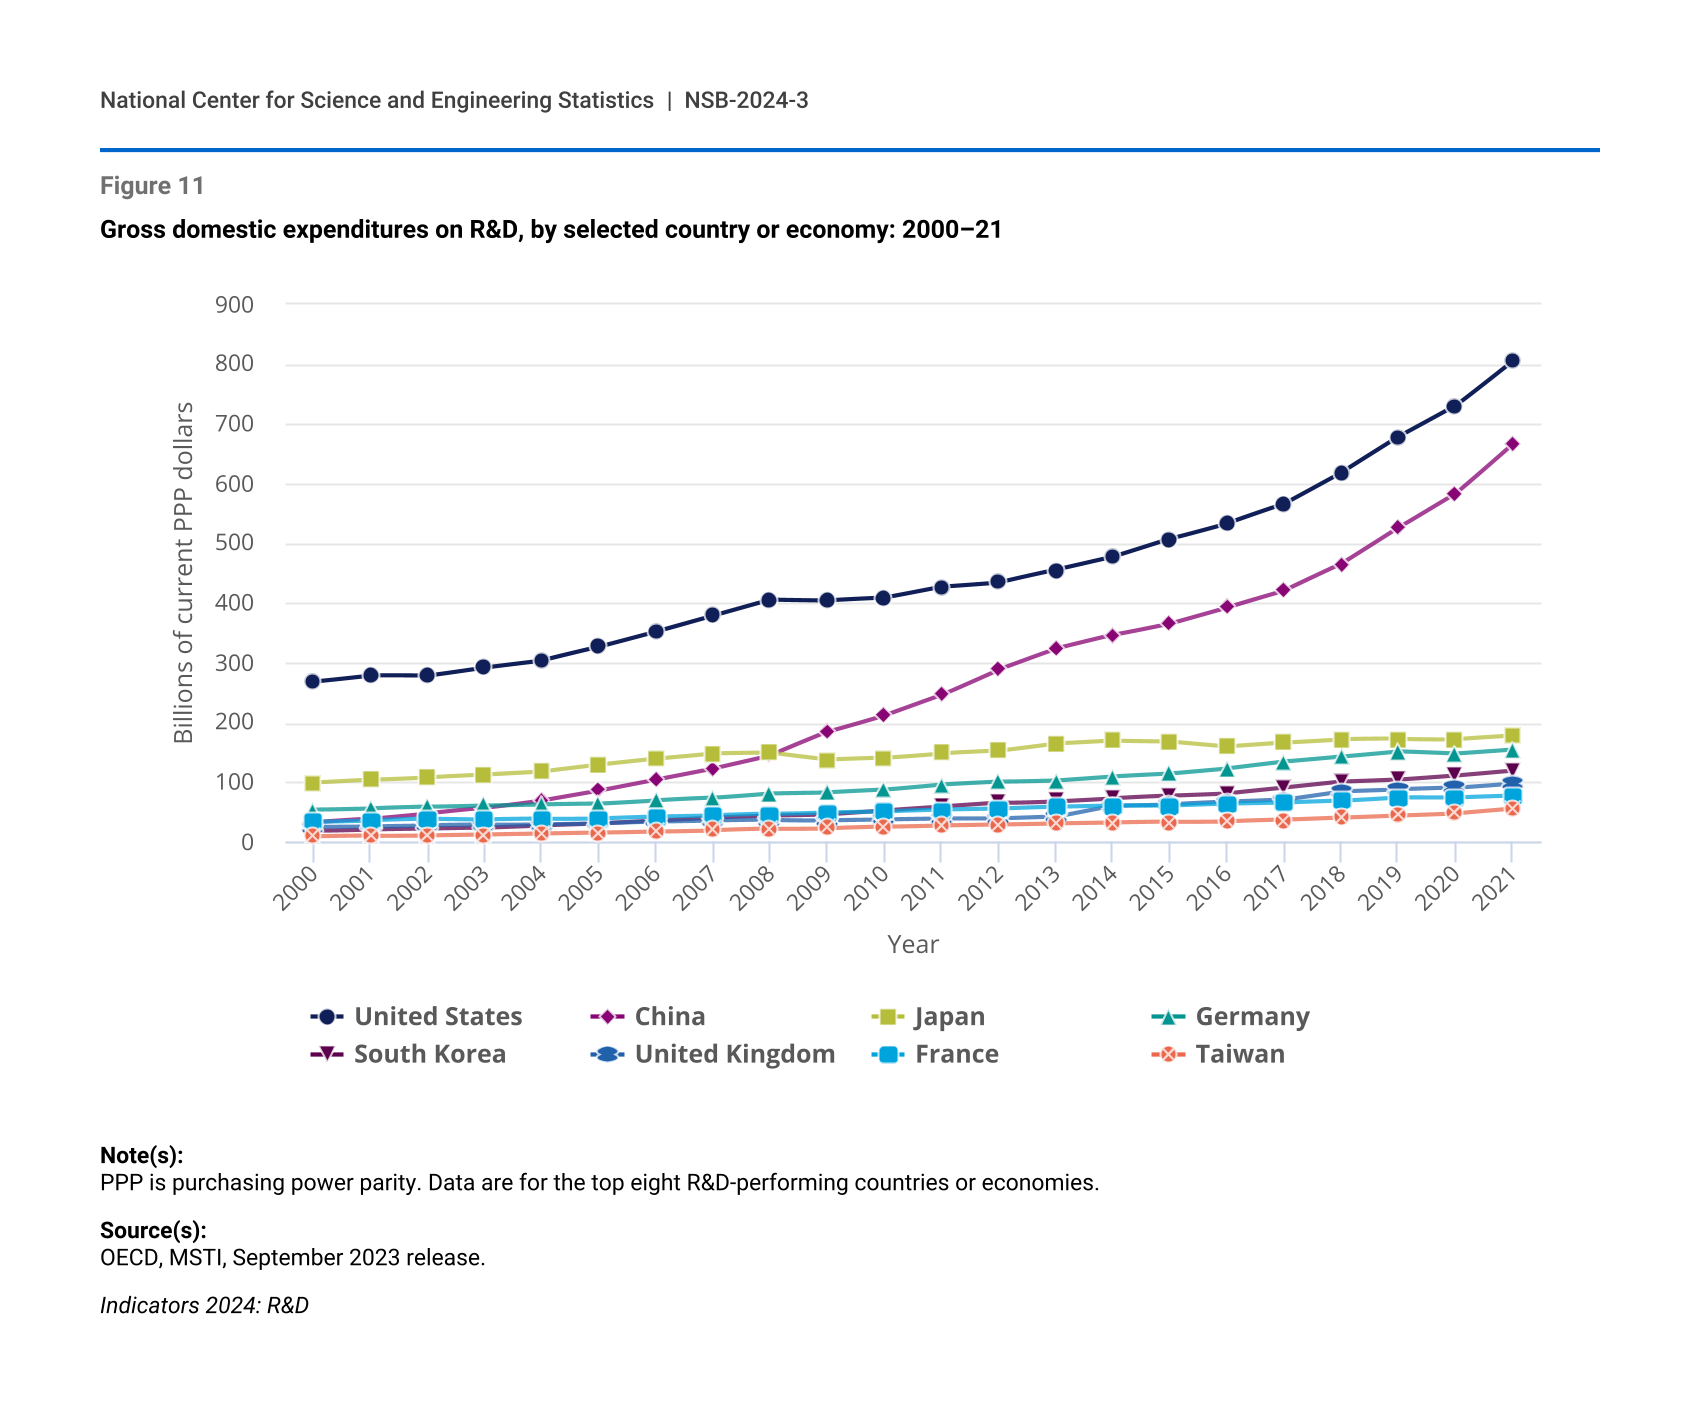
The United States is the top performer of R&D, with $806 billion in gross domestic expenditures on R&D in 2021, according to statistics from the Organisation for Economic Co-operation and Development (OECD) (Figure 11). The other top R&D-performing economies are located in East and Southeast Asia and in Europe. China, the second-highest R&D performer, had $668 billion in R&D expenditures in 2021. The United States and China each have much greater R&D expenditures than the remaining top R&D performers, which include Japan ($177 billion), Germany ($154 billion), and South Korea ($120 billion).
Gross domestic expenditures on R&D, by selected country or economy: 2000–21
| Year | United States | China | Japan | Germany | South Korea | United Kingdom | France | Taiwan |
|---|---|---|---|---|---|---|---|---|
| 2000 | 268.6 | 32.9 | 98.9 | 53.9 | 18.5 | 25.2 | 33.3 | 9.1 |
| 2001 | 279.1 | 38.4 | 103.9 | 56.2 | 21.3 | 26.3 | 36.1 | 9.8 |
| 2002 | 278.4 | 47.8 | 108.2 | 58.6 | 22.5 | 27.9 | 38.3 | 10.9 |
| 2003 | 292.2 | 56.9 | 112.4 | 61.1 | 24.1 | 28.6 | 37.2 | 12.2 |
| 2004 | 303.8 | 69.7 | 117.4 | 63.0 | 27.9 | 29.4 | 38.2 | 13.7 |
| 2005 | 326.2 | 86.2 | 128.7 | 64.0 | 30.6 | 30.6 | 39.5 | 15.3 |
| 2006 | 351.7 | 104.8 | 138.8 | 69.6 | 35.4 | 33.3 | 42.4 | 17.4 |
| 2007 | 378.5 | 123.4 | 147.6 | 73.5 | 40.6 | 35.2 | 44.2 | 19.5 |
| 2008 | 405.4 | 145.2 | 148.7 | 81.2 | 43.9 | 36.5 | 46.6 | 21.5 |
| 2009 | 404.2 | 184.1 | 137.3 | 82.7 | 45.8 | 36.4 | 49.6 | 22.7 |
| 2010 | 408.5 | 212.2 | 140.5 | 87.0 | 52.1 | 37.5 | 50.9 | 25.0 |
| 2011 | 427.1 | 246.5 | 148.4 | 95.8 | 58.4 | 38.8 | 53.6 | 27.4 |
| 2012 | 434.4 | 289.2 | 152.3 | 100.5 | 64.9 | 38.5 | 55.1 | 28.8 |
| 2013 | 455.1 | 323.4 | 164.7 | 102.9 | 68.2 | 41.5 | 58.4 | 30.5 |
| 2014 | 477.0 | 346.3 | 169.6 | 109.6 | 73.1 | 60.4 | 60.6 | 31.8 |
| 2015 | 507.4 | 366.1 | 168.5 | 114.1 | 76.9 | 63.0 | 60.5 | 33.1 |
| 2016 | 533.5 | 393.0 | 160.3 | 122.5 | 80.8 | 67.1 | 63.7 | 34.3 |
| 2017 | 565.7 | 420.8 | 166.6 | 133.7 | 90.3 | 70.8 | 65.6 | 36.5 |
| 2018 | 618.1 | 465.3 | 172.0 | 142.3 | 100.3 | 84.9 | 68.7 | 40.3 |
| 2019 | 677.9 | 526.2 | 172.3 | 151.1 | 104.0 | 87.8 | 74.6 | 44.1 |
| 2020 | 730.3 | 583.8 | 172.0 | 147.0 | 111.1 | 90.2 | 74.2 | 47.7 |
| 2021 | 806.0 | 667.6 | 177.4 | 153.7 | 119.6 | 97.8 | 77.2 | 55.6 |
Note(s):
PPP is purchasing power parity. Data are for the top eight R&D-performing countries or economies.
Source(s):
OECD, MSTI, September 2023 release.
In recent years, growth in R&D expenditures has varied considerably among the top R&D performers. According to OECD statistics, gross domestic expenditures on R&D began increasing rapidly in the mid-2000s in China, which surpassed Japan in 2009 and the combined R&D expenditures of the European Union (EU-27) countries in 2013 (see Glossary section for definition of EU-27). From 2011 to 2021, U.S. R&D expenditures increased by 89%, greater growth than France (44%) and Germany (60%) but less growth than South Korea and Taiwan, which both doubled R&D expenditures. Japan experienced the slowest rate of growth among the top R&D-performing countries, with R&D expenditures increasing by 20% from 2011 to 2021.
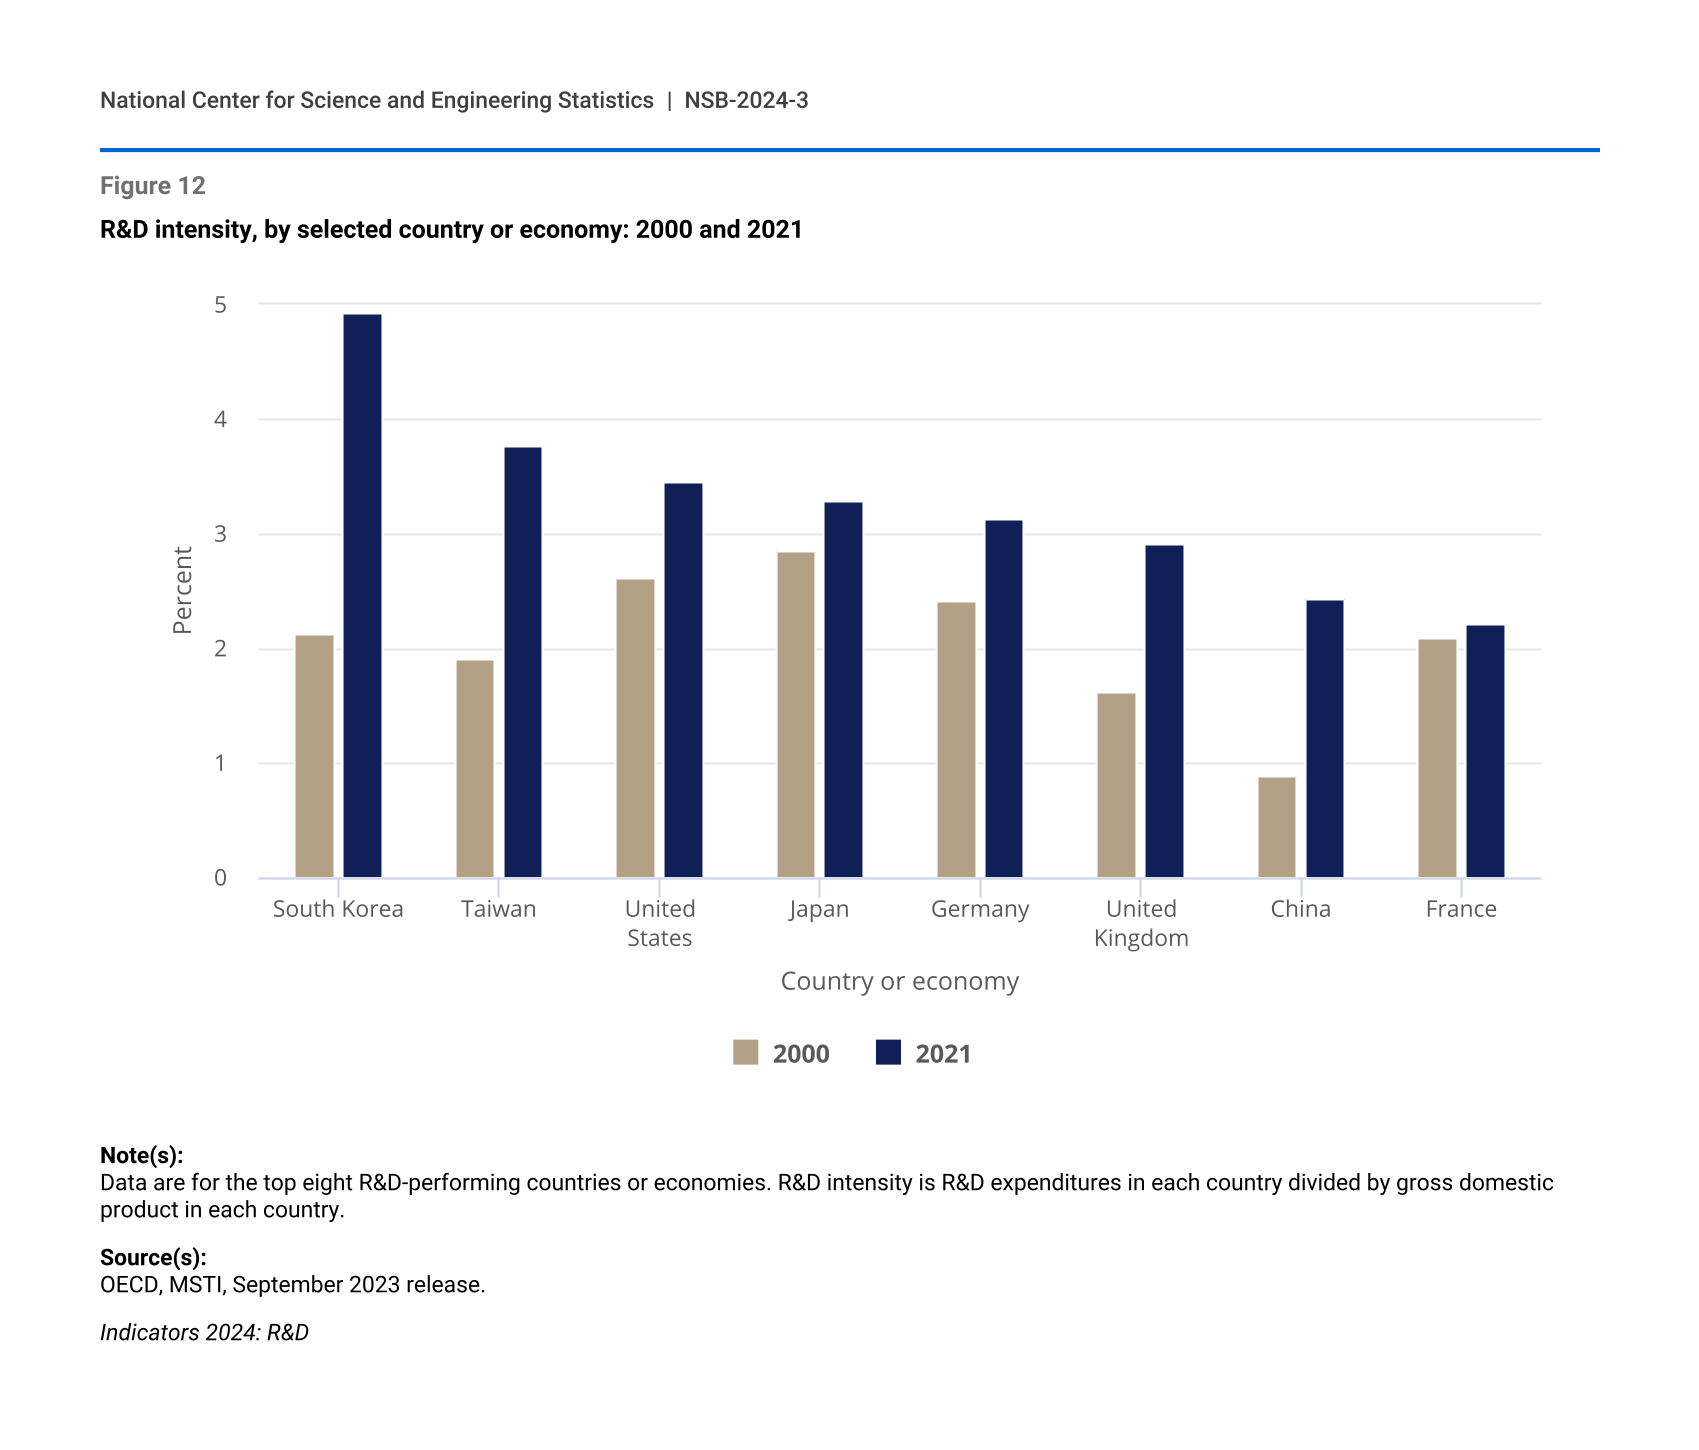
The major R&D-performing countries vary in their R&D-to-gross domestic product (GDP) ratios, known as R&D intensities (see Glossary section for definition). The United States, which has the highest level of R&D expenditures, had an R&D intensity of 3.5% in 2021 (Figure 12). However, several smaller economies with lower total R&D expenditures than the United States have higher R&D intensities, such as South Korea (4.9%) and Taiwan (3.8%). Although R&D intensities of all the major R&D performers increased from 2000 to 2021, they increased to different extents over this period. The United States increased R&D intensity from 2.6% in 2000 to 3.5% in 2021, surpassing Japan, which exhibited comparatively slower growth in R&D intensity. In 2000, South Korea and Taiwan both had lower R&D intensities than the United States. However, after experiencing the greatest percentage point increases in R&D intensity among the top R&D performers, South Korea and Taiwan had the highest R&D intensities by 2021.
R&D intensity, by selected country or economy: 2000 and 2021
| Country or economy | 2000 | 2021 |
|---|---|---|
| South Korea | 2.13 | 4.93 |
| Taiwan | 1.91 | 3.77 |
| United States | 2.62 | 3.46 |
| Japan | 2.86 | 3.30 |
| Germany | 2.41 | 3.13 |
| United Kingdom | 1.61 | 2.91 |
| China | 0.89 | 2.43 |
| France | 2.09 | 2.22 |
Note(s):
Data are for the top eight R&D-performing countries or economies. R&D intensity is R&D expenditures in each country divided by gross domestic product in each country.
Source(s):
OECD, MSTI, September 2023 release.
Countries allocate different shares of their R&D expenditures across three types of R&D: basic research, applied research, and experimental development (see Glossary section for definitions). In 2021, the United States spent 15% ($119 billion) of its total R&D expenditures on basic research, 18% ($146 billion) on applied research, and 67% ($540 billion) on experimental development. South Korea and Japan were similar to the United States in their distributions of R&D expenditures across the three types of R&D. Compared with the United States, Taiwan dedicated a lower share of its R&D expenditures to basic research (7%), and France dedicated a higher share (23%); however, in absolute terms, the United States spent far more on basic research than any other economy.
The business sector is the largest funder of R&D in the top R&D-performing countries, with lower shares funded by government, higher education, and private nonprofit institutions. In each of the leading R&D performers in East and Southeast Asia—China, Japan, South Korea, and Taiwan—the domestic business sector accounted for at least 75% of R&D funding in 2021. The domestic business share of R&D funding is lower but still a substantial majority in the United States (68%); among the top R&D performers in Europe (Germany, United Kingdom, France), the business share of R&D funding is closer to 60%.
U.S. R&D Performance and Funding Trends
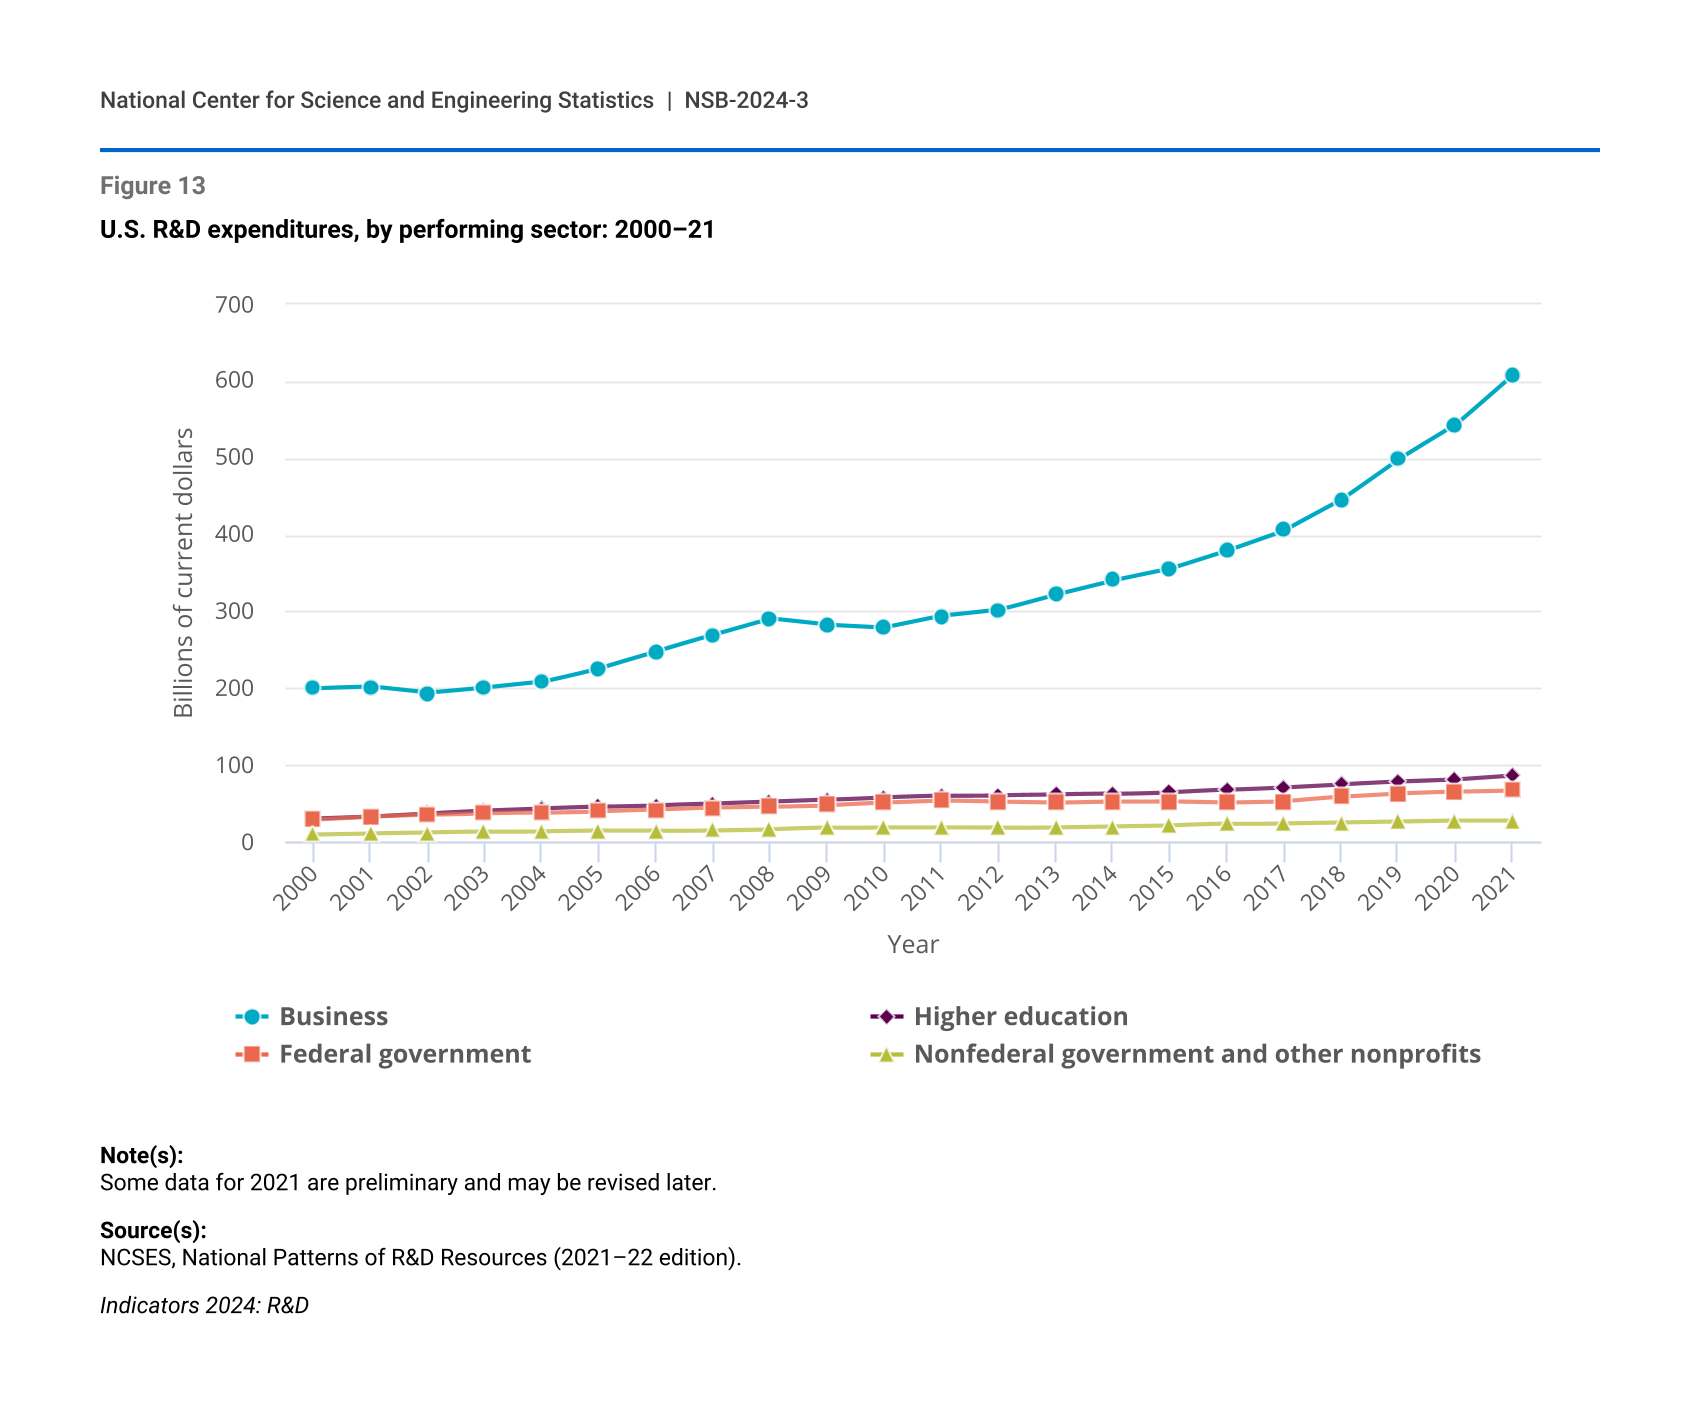
Although the U.S. business sector performs (or conducts) the most R&D, other sectors—including federal, state, and local governments; higher education institutions; and nonacademic, nonprofit organizations—also perform and fund domestic R&D. R&D performed in the United States totaled $717 billion in 2020 and, according to preliminary data, $789 billion in 2021. The business sector was the main driver of R&D performance. R&D performed by businesses accounted for 87% of increased R&D from 2011 to 2021 (Figure 13).
U.S. R&D expenditures, by performing sector: 2000–21
| Year | Business | Higher education | Federal government | Nonfederal government and other nonprofits |
|---|---|---|---|---|
| 2000 | 200.0 | 29.9 | 28.5 | 9.6 |
| 2001 | 202.0 | 32.7 | 32.8 | 11.0 |
| 2002 | 193.9 | 36.7 | 35.5 | 11.9 |
| 2003 | 200.7 | 40.6 | 37.2 | 12.8 |
| 2004 | 208.3 | 43.3 | 37.7 | 13.4 |
| 2005 | 226.2 | 45.5 | 39.6 | 14.1 |
| 2006 | 247.7 | 47.4 | 41.6 | 14.3 |
| 2007 | 269.3 | 49.4 | 44.1 | 15.1 |
| 2008 | 290.7 | 52.1 | 45.6 | 16.4 |
| 2009 | 282.4 | 54.9 | 47.6 | 18.1 |
| 2010 | 279.0 | 58.1 | 50.8 | 18.7 |
| 2011 | 294.1 | 60.1 | 53.5 | 18.5 |
| 2012 | 302.3 | 60.9 | 52.1 | 18.4 |
| 2013 | 322.5 | 61.5 | 51.1 | 19.1 |
| 2014 | 340.7 | 62.3 | 52.7 | 20.2 |
| 2015 | 355.8 | 64.6 | 52.8 | 21.2 |
| 2016 | 379.5 | 67.8 | 51.2 | 23.2 |
| 2017 | 405.8 | 71.1 | 52.6 | 24.2 |
| 2018 | 445.6 | 74.9 | 58.4 | 25.2 |
| 2019 | 498.2 | 78.2 | 62.8 | 26.4 |
| 2020 | 543.2 | 80.8 | 65.1 | 27.7 |
| 2021 | 608.6 | 85.8 | 66.8 | 27.9 |
Note(s):
Some data for 2021 are preliminary and may be revised later.
Source(s):
NCSES, National Patterns of R&D Resources (2021–22 edition).
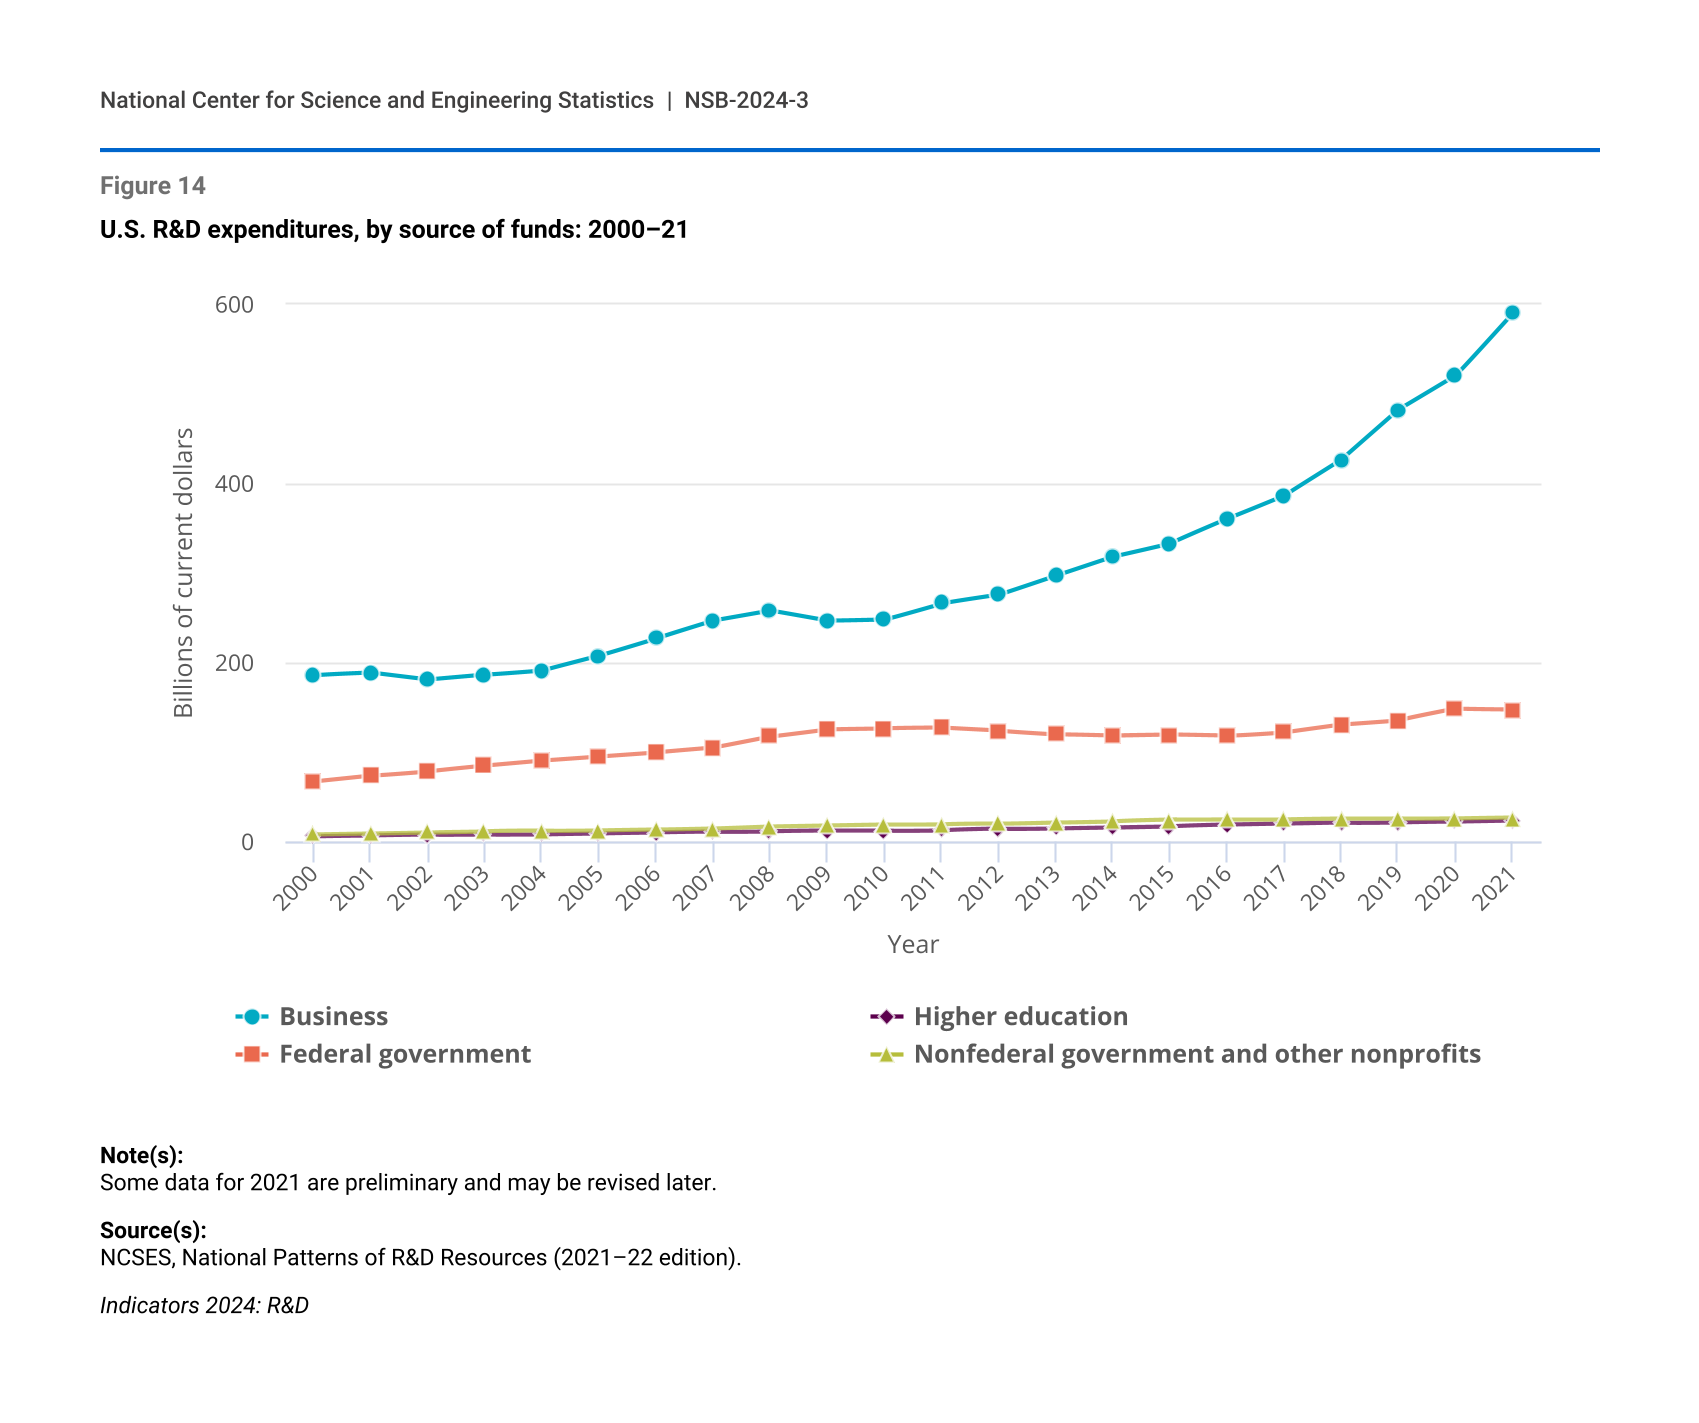
The business sector funds (or pays for) most of the R&D performed in the United States, accounting for 75% of U.S. R&D funding in 2021, followed by the federal government, which funded 19% of R&D (Figure 14). Nearly all (99%) of the business sector’s R&D funding supports R&D performance within the business sector. In contrast, the federal government supports R&D performed by all sectors. In 2021, the federal government funded 52% of the R&D performed by the higher education sector, 43% by nonprofits, and 4% by businesses. Because a substantial share of federal R&D funding is directed toward R&D performed by other sectors, especially academic institutions, the federal government performs less R&D than the higher education sector but funds over six times more R&D than the higher education sector.
U.S. R&D expenditures, by source of funds: 2000–21
| Year | Business | Higher education | Federal government | Nonfederal government and other nonprofits |
|---|---|---|---|---|
| 2000 | 186.0 | 6.3 | 67.2 | 8.5 |
| 2001 | 188.4 | 6.9 | 73.8 | 9.5 |
| 2002 | 180.7 | 7.7 | 78.9 | 10.7 |
| 2003 | 186.2 | 8.3 | 85.1 | 11.8 |
| 2004 | 191.3 | 8.6 | 90.8 | 12.0 |
| 2005 | 207.8 | 9.4 | 95.4 | 12.7 |
| 2006 | 227.2 | 10.2 | 99.9 | 13.6 |
| 2007 | 246.8 | 10.9 | 105.1 | 15.0 |
| 2008 | 258.0 | 11.7 | 117.6 | 17.4 |
| 2009 | 246.6 | 12.1 | 125.8 | 18.5 |
| 2010 | 248.1 | 12.3 | 126.6 | 19.6 |
| 2011 | 266.4 | 13.1 | 127.0 | 19.7 |
| 2012 | 275.7 | 14.3 | 123.8 | 19.9 |
| 2013 | 297.2 | 15.3 | 120.1 | 21.6 |
| 2014 | 318.4 | 16.2 | 118.4 | 23.0 |
| 2015 | 333.2 | 17.3 | 119.5 | 24.4 |
| 2016 | 360.3 | 18.7 | 118.2 | 24.5 |
| 2017 | 386.5 | 19.9 | 122.5 | 24.7 |
| 2018 | 426.5 | 21.0 | 131.1 | 25.5 |
| 2019 | 482.2 | 21.9 | 135.8 | 25.7 |
| 2020 | 520.4 | 22.6 | 148.2 | 25.8 |
| 2021 | 591.0 | 23.8 | 147.5 | 26.7 |
Note(s):
Some data for 2021 are preliminary and may be revised later.
Source(s):
NCSES, National Patterns of R&D Resources (2021–22 edition).
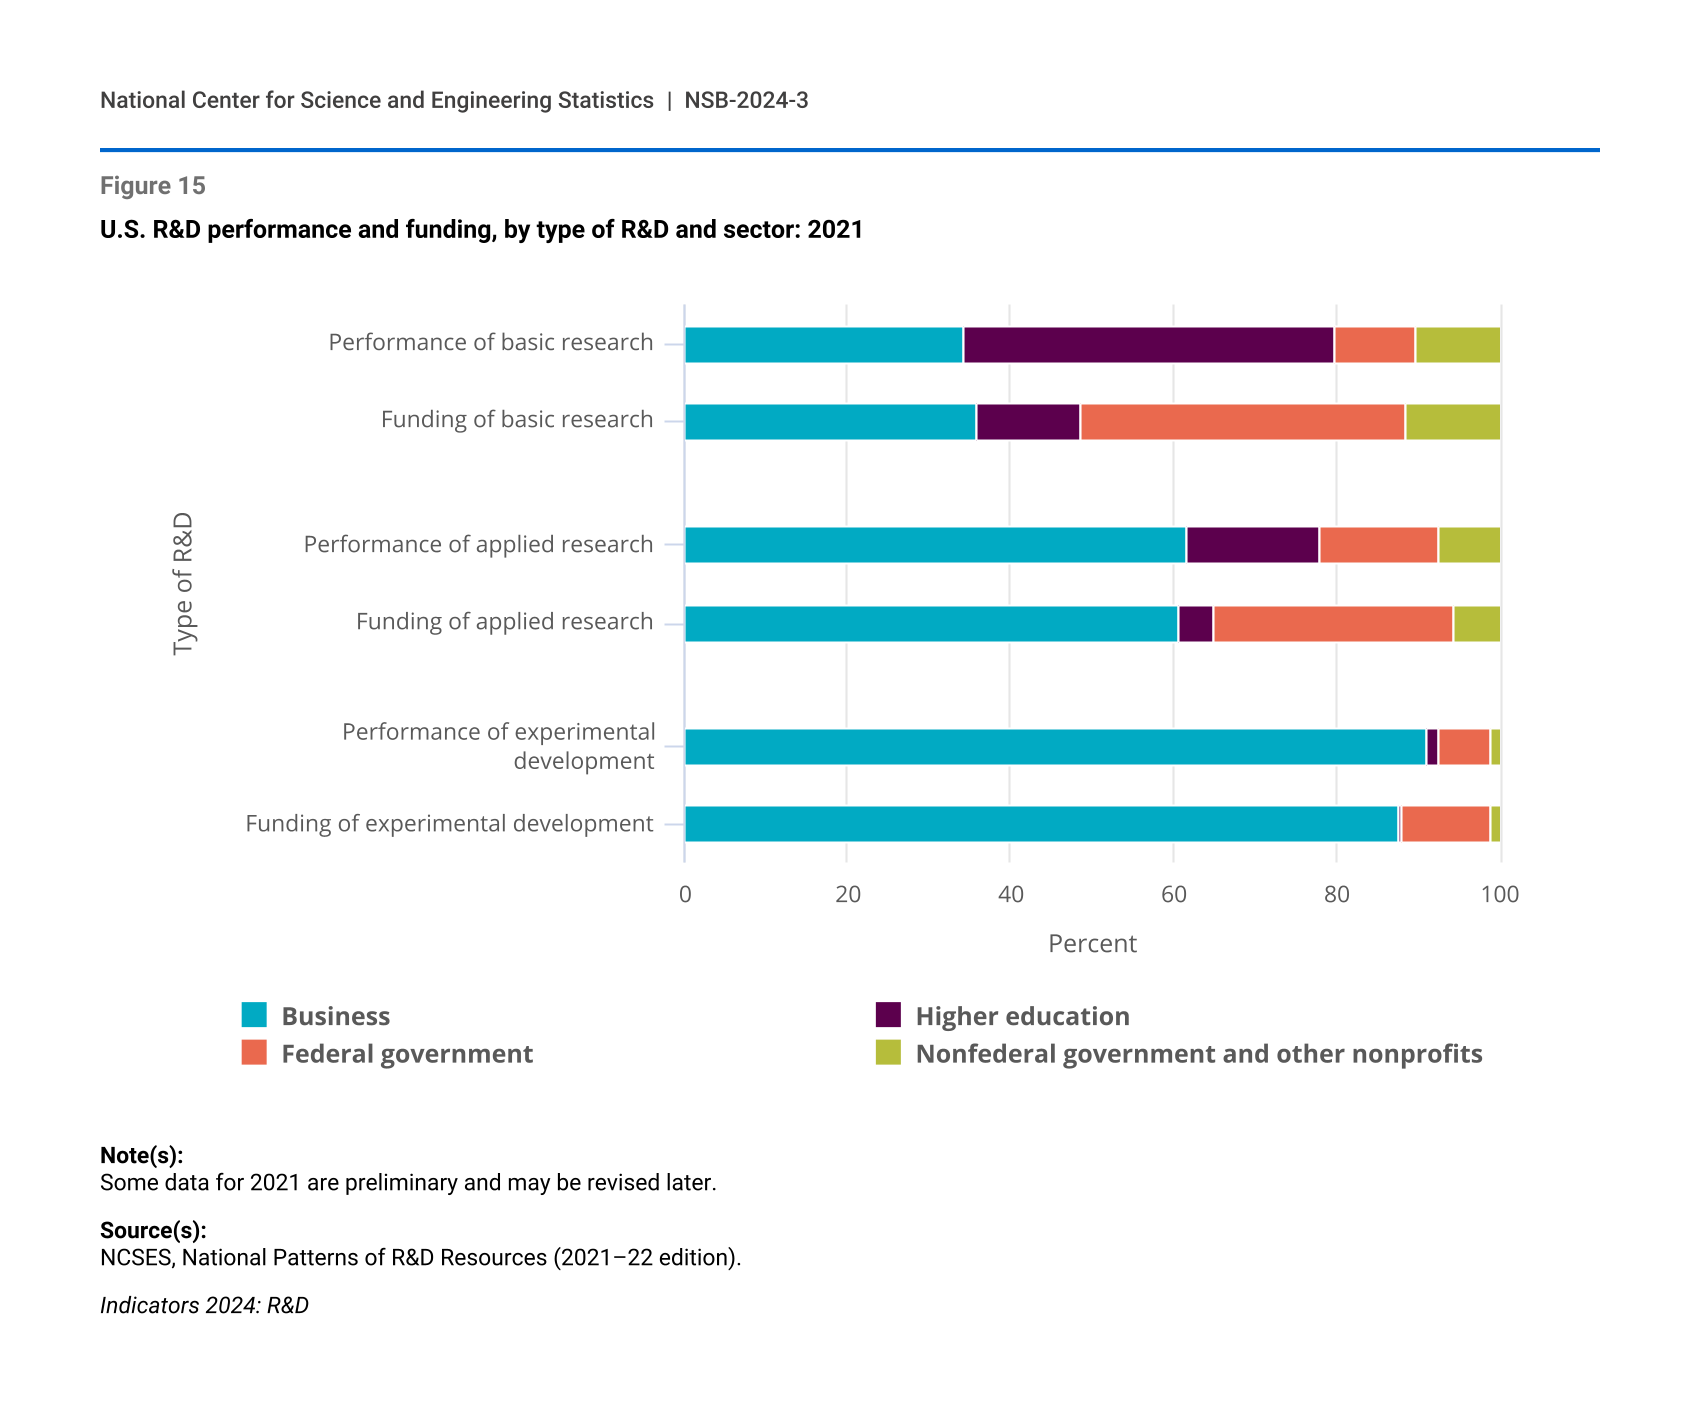
The majority of U.S. R&D performance is in experimental development (67%) and applied research (18%), and the business sector is the most active in both of these types of R&D. With its focus on new and improved goods, services, and processes, the business sector performs 91% of experimental development and 62% of applied research performed in the United States (Figure 15). Several industries—chemicals manufacturing (including pharmaceuticals and medicine); computer and electronic products; transportation equipment; professional, scientific, and technical services; and information services—account for the vast majority of R&D performed by the business sector. The higher education sector is the largest performer of basic research (46%), and the federal government performs low shares of all types of R&D.
U.S. R&D performance and funding, by type of R&D and sector: 2021
| Type of R&D | Business | Higher education | Federal government | Nonfederal government and other nonprofits |
|---|---|---|---|---|
| Performance of basic research | 34.4 | 45.6 | 9.9 | 10.2 |
| Funding of basic research | 35.9 | 12.6 | 40.0 | 11.5 |
| Performance of applied research | 61.6 | 16.3 | 14.8 | 7.3 |
| Funding of applied research | 60.6 | 4.4 | 29.3 | 5.7 |
| Performance of experimental development | 91.0 | 1.6 | 6.4 | 1.0 |
| Funding of experimental development | 87.6 | 0.5 | 11.0 | 0.9 |
Note(s):
Some data for 2021 are preliminary and may be revised later.
Source(s):
NCSES, National Patterns of R&D Resources (2021–22 edition).
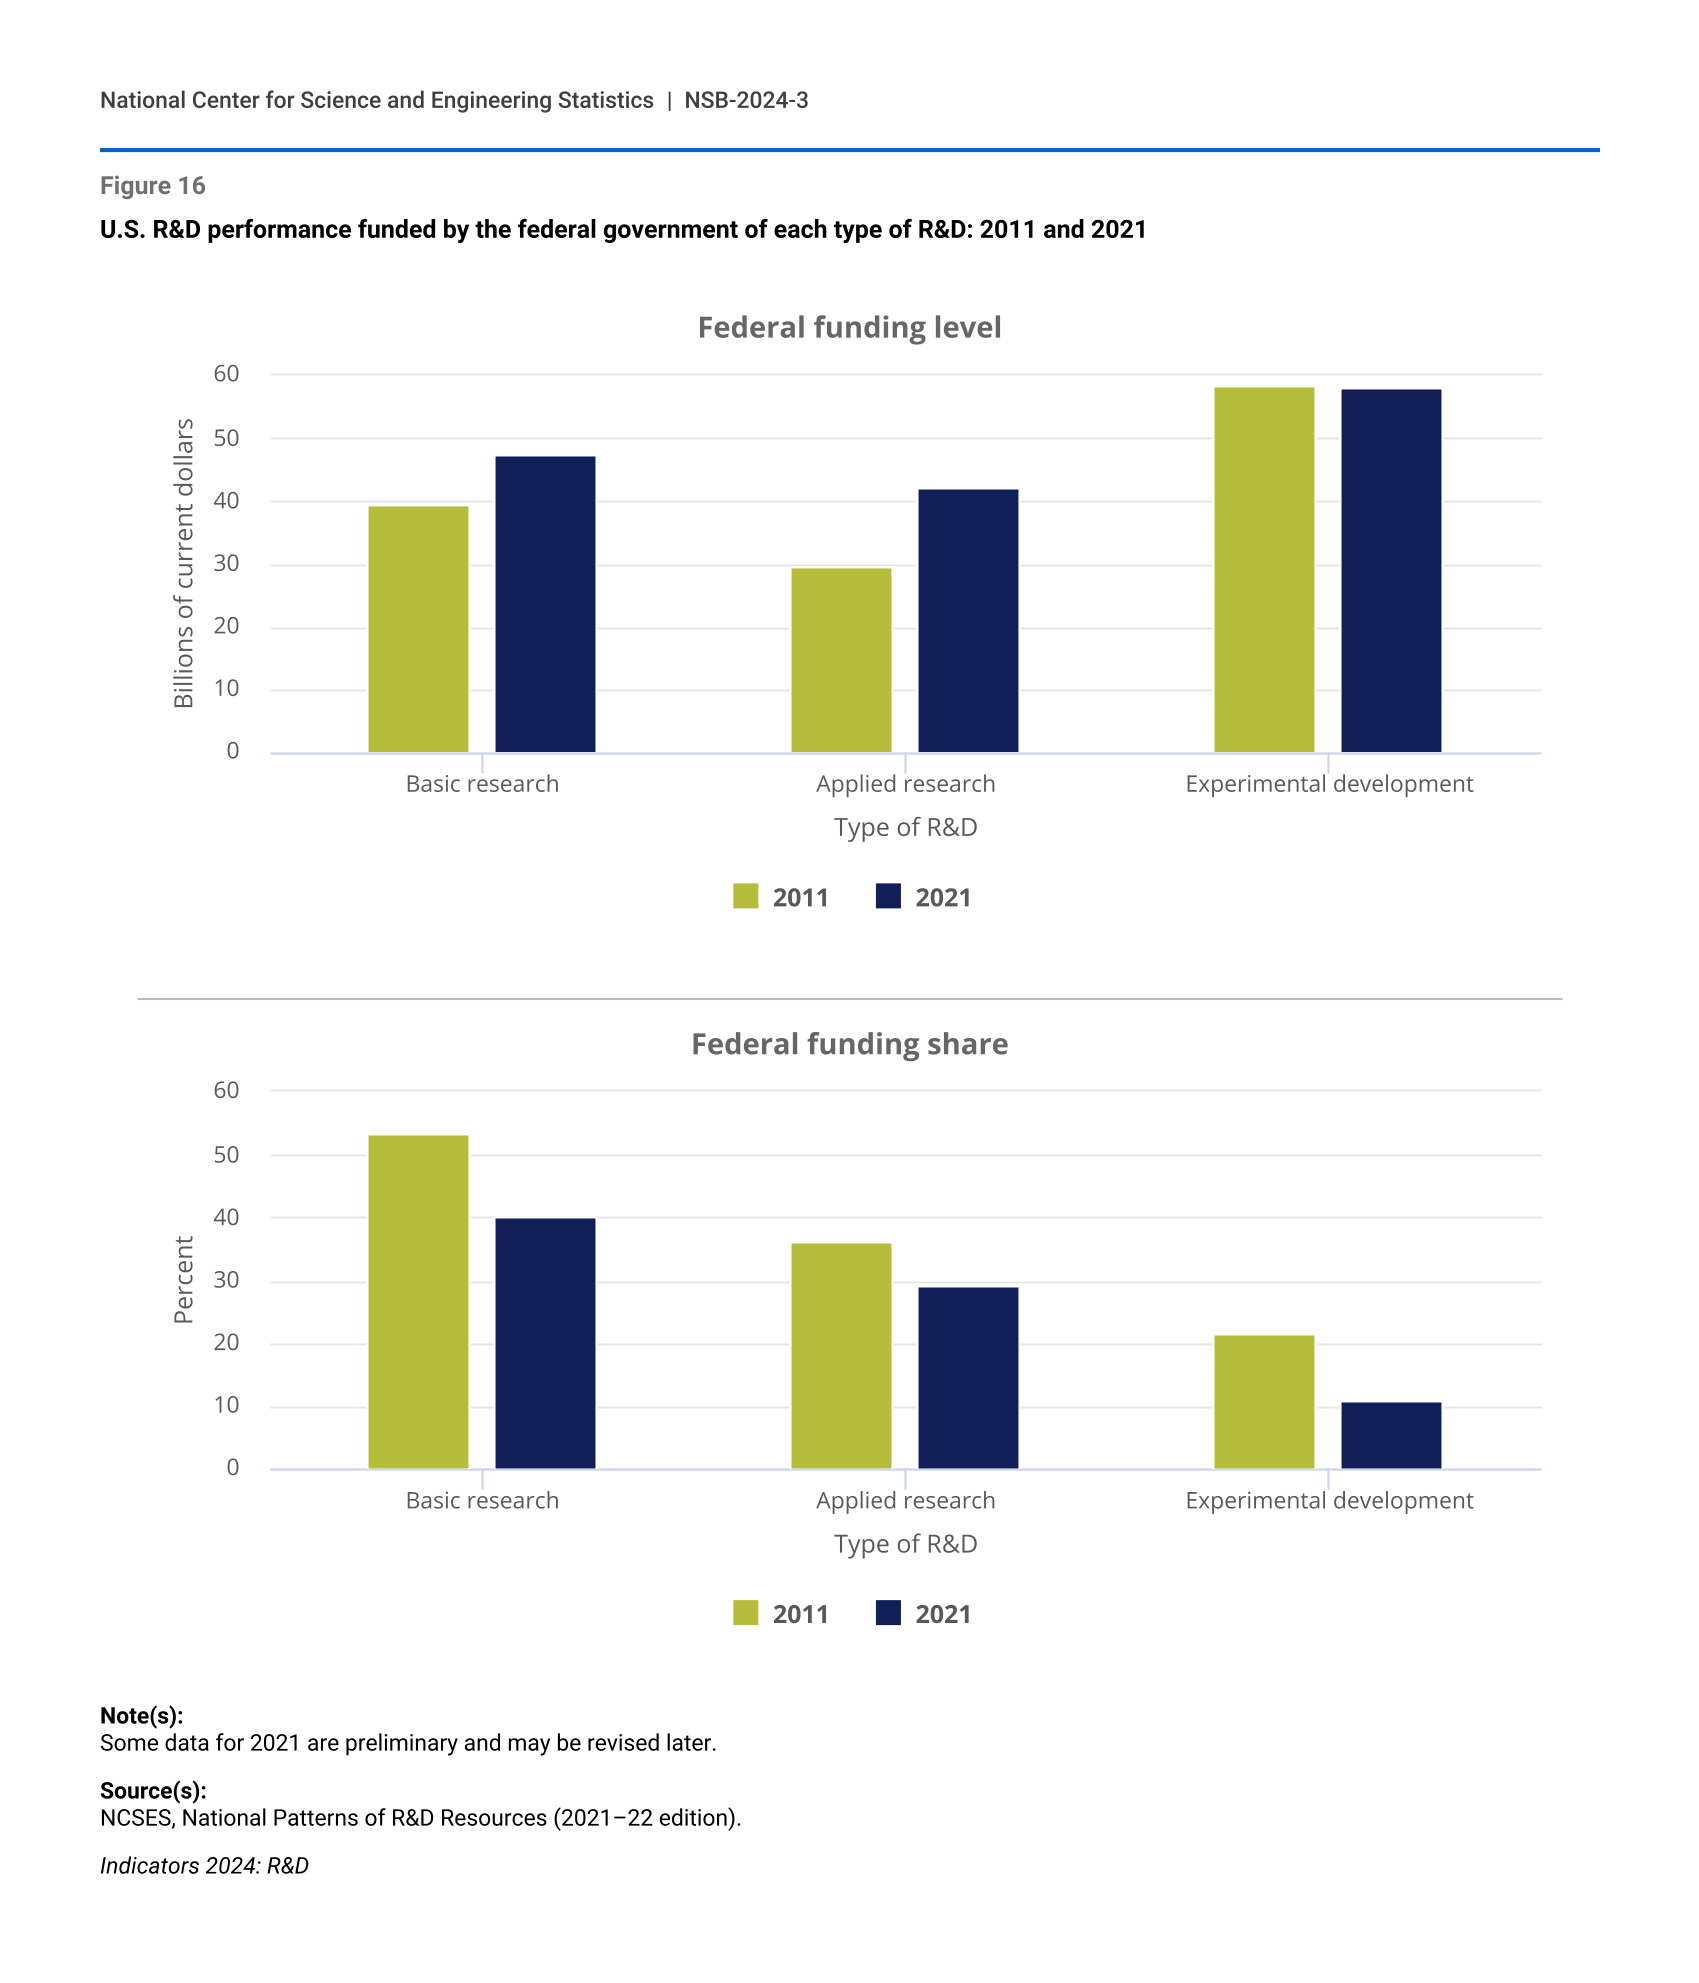
Federal funding of R&D increased from $127 billion in 2011 to $148 billion in 2021, but the share of total R&D funded by the federal government declined from 30% to 19%. This decline in the federal share of R&D funding occurred across all types of R&D (Figure 16). The federal government funded a majority of basic research performed in the United States from the early 1950s to the early 2010s. Although it is still the largest funder of basic research (40% in 2021), the federal government’s share of basic research funding is now only slightly higher than the share funded by the business sector, which increased from 20% in 2011 to 36% in 2021.
Higher education institutions, which are the most significant performers of basic research, rely heavily on federal support for R&D. Federal funding of R&D performed by the higher education sector increased in dollar amount from 2011 to 2021—from $35.7 billion to $44.7 billion—but the proportion of higher education R&D funded by the federal government declined from 59% to 52% over the same period. In contrast, the proportion of higher education R&D funded by higher education institutions themselves increased from 22% to 27%. The remainder of R&D performed by the higher education sector in 2021 was funded by nonprofit organizations (9%), businesses (6%), and nonfederal governments (5%).
U.S. R&D performance funded by the federal government of each type of R&D: 2011 and 2021
| Type of R&D | 2011 | 2021 |
|---|---|---|
| Basic research | 39.3 | 47.4 |
| Applied research | 29.4 | 42.2 |
| Experimental development | 58.3 | 57.9 |
| Type of R&D | 2011 | 2021 |
|---|---|---|
| Basic research | 53.3 | 40.0 |
| Applied research | 36.0 | 29.3 |
| Experimental development | 21.5 | 11.0 |
Note(s):
Some data for 2021 are preliminary and may be revised later.
Source(s):
NCSES, National Patterns of R&D Resources (2021–22 edition).
Federal Agency Funding of R&D and S&E Graduate Students
In 2021, a large majority of the federal government’s R&D budget was obligated to the Department of Health and Human Services (HHS) (40%), the parent agency of the National Institutes of Health (NIH), and to the Department of Defense (DOD) (37%). Most of the remaining federal R&D budget was allocated to the Department of Energy (DOE) (7%), the National Aeronautics and Space Administration (NASA) (6%), and the National Science Foundation (NSF) (4%). DOD directs the bulk of its R&D budget toward experimental development (86% in 2021). In comparison, DOE and NASA are more evenly distributed between basic research, applied research, and experimental development. Supplemental COVID-19 pandemic-related stimulus funding has vastly increased the share of HHS R&D obligations directed toward experimental development (44%), which accounted for very little of total HHS R&D in the years prior to the pandemic. NSF focuses on basic research, which accounted for 86% of its R&D obligations in 2021.
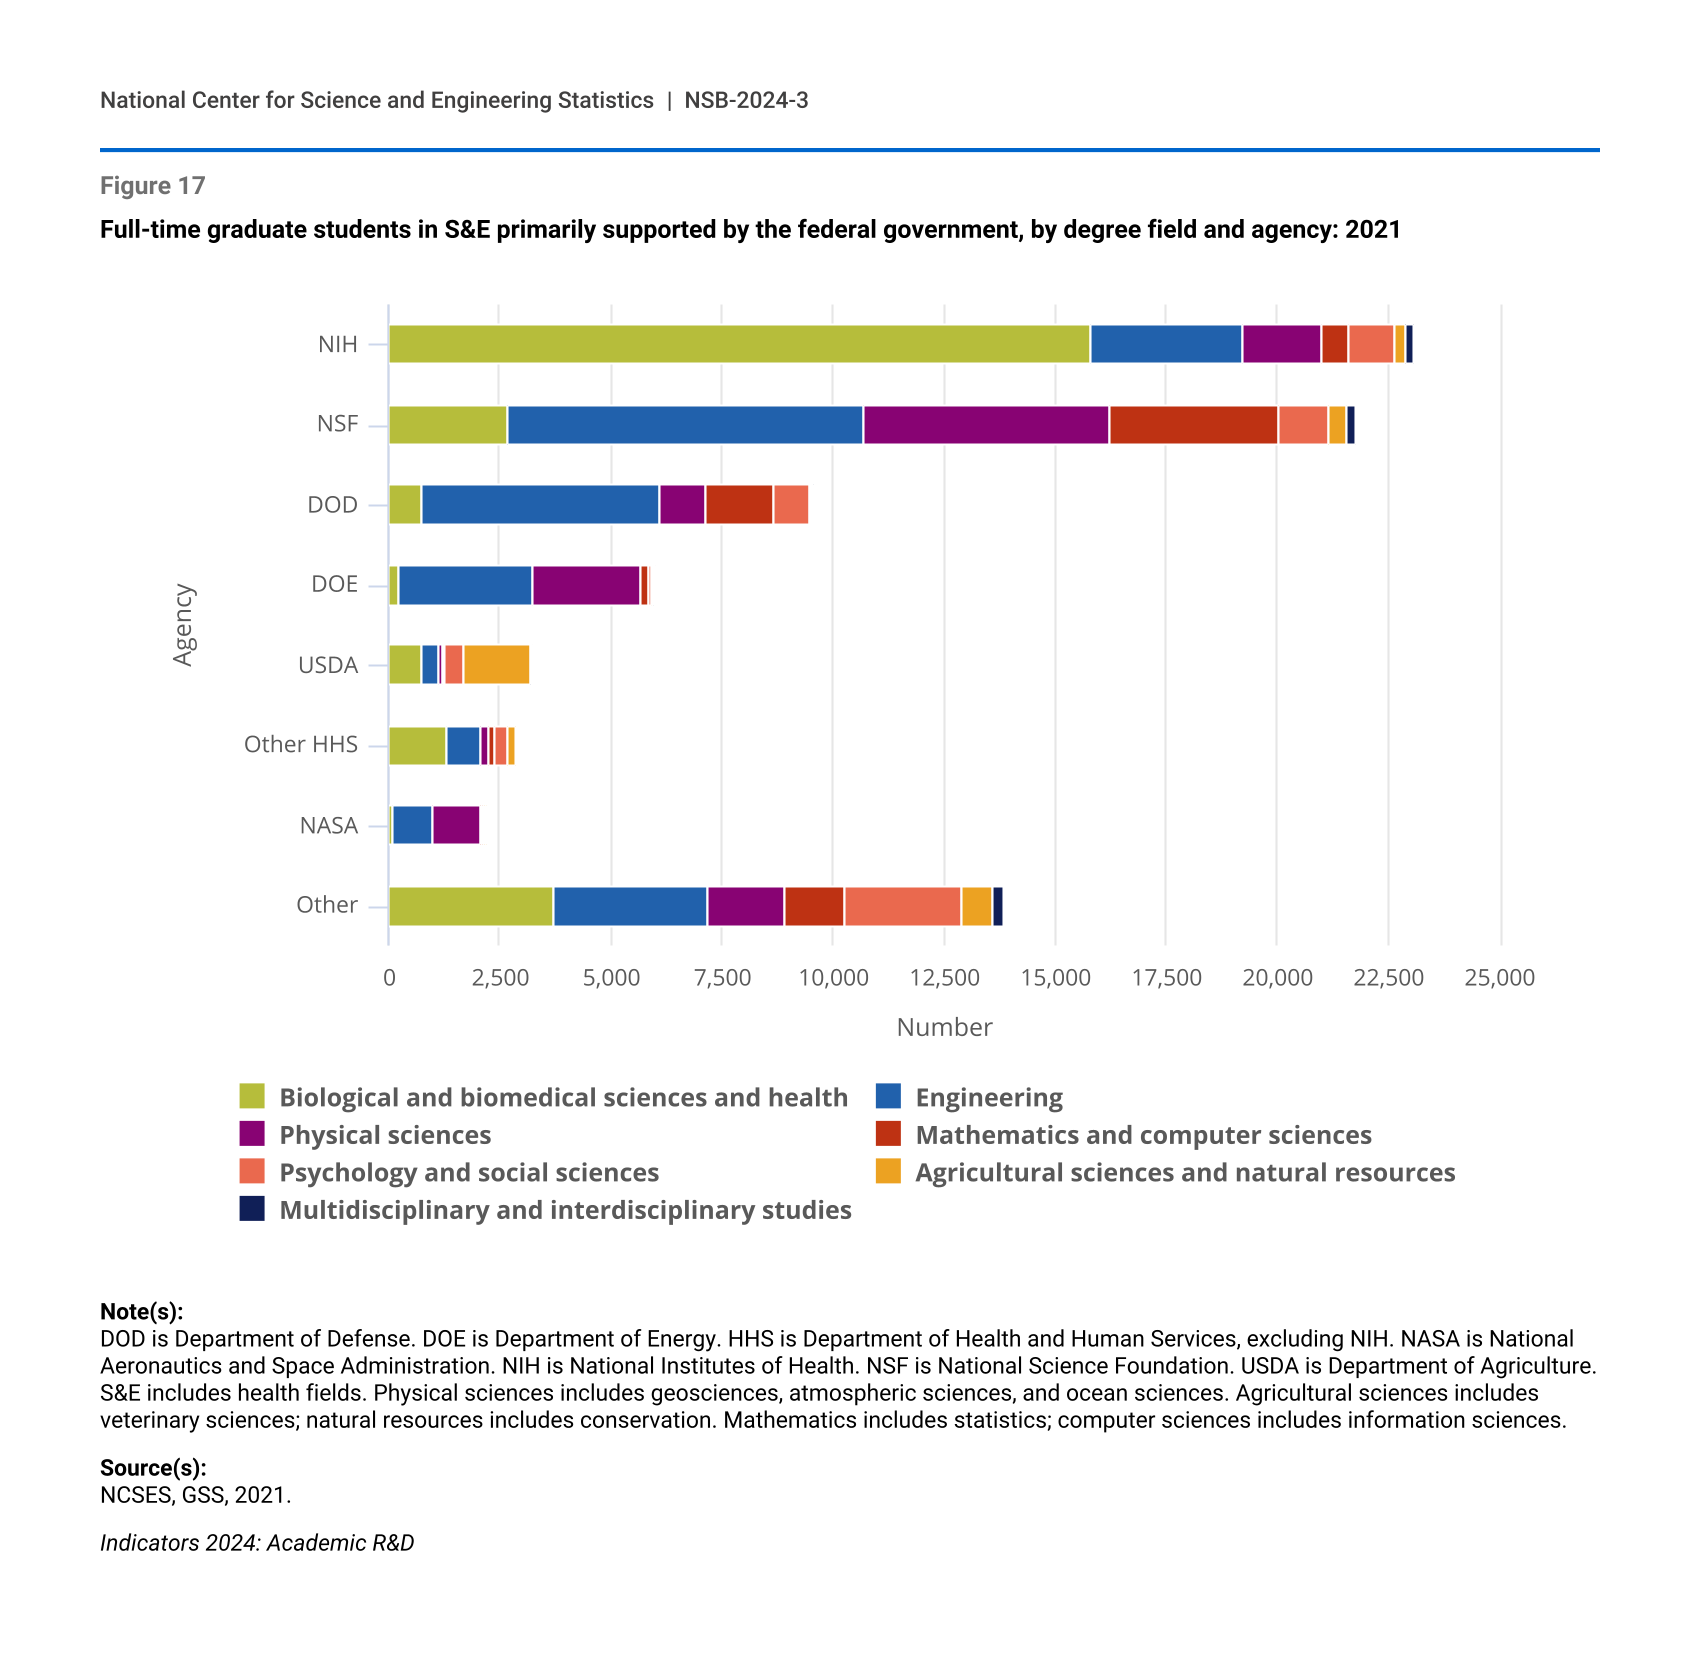
The federal government supported 15% of full-time S&E graduate students (mostly doctoral degree students) in 2021, a decline from the most recent high of 21% in 2004. The federal government supports a higher proportion of S&E doctoral degree students than S&E master’s degree students (26% versus 5%), consistent across all fields of S&E. Among federal agencies, NIH and NSF support the greatest number of S&E graduate students (Figure 17). In 2021, NIH supported about 23,000 students and NSF supported almost 22,000 students, collectively 54% of the almost 83,000 federally supported graduate students. NSF supports substantial numbers of students across a range of S&E fields, whereas other agencies are more specialized in their financial support. In 2021, 68% of full-time S&E graduate students supported by NIH were studying biological and biomedical sciences and health, 56% of those funded by DOD were in engineering, and 91% of those funded by DOE were in engineering or physical sciences.
Full-time graduate students in S&E primarily supported by the federal government, by degree field and agency: 2021
| Agency | Biological and biomedical sciences and health | Engineering | Physical sciences | Mathematics and computer sciences | Psychology and social sciences | Agricultural sciences and natural resources | Multidisciplinary and interdisciplinary studies |
|---|---|---|---|---|---|---|---|
| NIH | 15,811 | 3,416 | 1,794 | 586 | 1,051 | 233 | 197 |
| NSF | 2,671 | 8,027 | 5,528 | 3,809 | 1,112 | 440 | 156 |
| DOD | 746 | 5,358 | 1,032 | 1,538 | 778 | 69 | 54 |
| DOE | 214 | 3,017 | 2,457 | 178 | 40 | 72 | 38 |
| USDA | 763 | 384 | 54 | 87 | 382 | 1,535 | 39 |
| Other HHS | 1,329 | 714 | 212 | 154 | 245 | 196 | 16 |
| NASA | 83 | 898 | 1,060 | 69 | 43 | 49 | 9 |
| Other | 3,700 | 3,488 | 1,730 | 1,364 | 2,620 | 692 | 251 |
Note(s):
DOD is Department of Defense. DOE is Department of Energy. HHS is Department of Health and Human Services, excluding NIH. NASA is National Aeronautics and Space Administration. NIH is National Institutes of Health. NSF is National Science Foundation. USDA is Department of Agriculture. S&E includes health fields. Physical sciences includes geosciences, atmospheric sciences, and ocean sciences. Agricultural sciences includes veterinary sciences; natural resources includes conservation. Mathematics includes statistics; computer sciences includes information sciences.
Source(s):
NCSES, GSS, 2021.