|
Figure 1
|
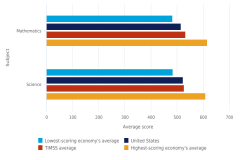
Average TIMSS mathematics and science scores of students in grade 8 among participating advanced economies: 2019 |
International Association for the Evaluation of Educational Achievement
|
Trends in International Mathematics and Science Study
|
|
Figure 2
|
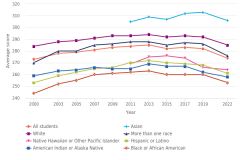
Average scores of U.S. students in grade 8 on the main NAEP mathematics assessment, by race or ethnicity: 2000–22 |
National Center for Education Statistics
|
National Assessment of Educational Progress
|
|
Figure 3
|
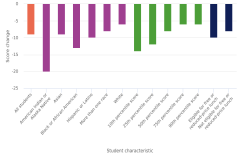
Change in average student scores for 13-year-old students on the NAEP long-term trend mathematics assessment, by student characteristic: 2020–23 |
National Center for Education Statistics
|
National Assessment of Educational Progress
|
|
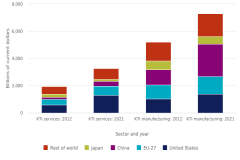
Figure 4
|
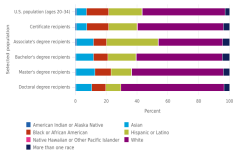
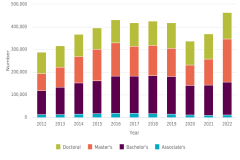
Race or ethnicity in the U.S. population and among S&E certificate and degree recipients: 2021 |
National Center for Education Statistics
|
Integrated Postsecondary Education Data System (IPEDS), Completions Survey
|
|
Figure 4
|
Race or ethnicity in the U.S. population and among S&E certificate and degree recipients: 2021
|
U.S. Census Bureau
|
Population Estimates Program
|
|
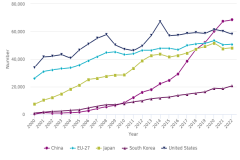
Figure 5
|
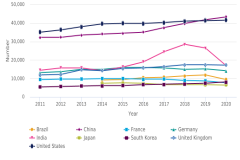
S&E doctoral degrees awarded, by selected country: 2011–20 |
Government of India, Ministry of Education, Department of Higher Education
|
All India Survey on Higher Education
|
|
Figure 5
|
S&E doctoral degrees awarded, by selected country: 2011–20
|
Ministry of Education, People's Republic of China
|
Higher Education Data
|
|
Figure 5
|
S&E doctoral degrees awarded, by selected country: 2011–20
|
National Bureau of Statistics of China
|
China Statistical Yearbook
|
|
Figure 5
|
S&E doctoral degrees awarded, by selected country: 2011–20
|
Organisation for Economic Co-operation and Development
|
Education at a Glance
|
|
Figure 6
|
International S&E students on temporary visas enrolled in U.S. higher education institutions, by level of enrollment: 2012–22 |
U.S. Department of Homeland Security, U.S. Immigration and Customs Enforcement
|
Student and Exchange Visitor Information System (SEVIS)
|
|
Figure 7
|
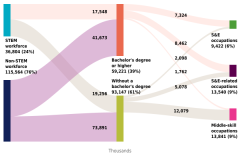
U.S. workforce, by STEM occupation group and education level: 2021 |
U.S. Census Bureau
|
American Community Survey
|
|
Figure 8
|
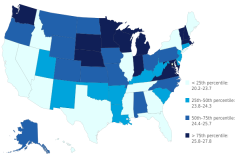
Employment in the STEM workforce, by state: 2021 |
U.S. Census Bureau
|
American Community Survey
|
|
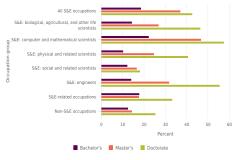
Figure 9
|
Foreign-born share of workers with a bachelor's degree or higher, by highest degree level and occupation group: 2021 |
National Center for Science and Engineering Statistics
|
National Survey of College Graduates
|
|
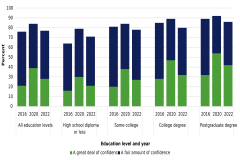
Figure 10
|
Respondents expressing confidence in scientists to act in the best interests of the public, by education level: 2016, 2020, and 2022 |
Pew Research Center
|
American Trends Panel
|
|
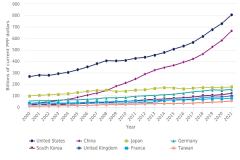
Figure 11
|
Gross domestic expenditures on R&D, by selected country or economy: 2000–21 |
Organisation for Economic Co-operation and Development
|
Main Science and Technology Indicators
|
|
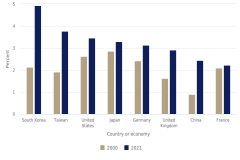
Figure 12
|
R&D intensity, by selected country or economy: 2000 and 2021 |
Organisation for Economic Co-operation and Development
|
Main Science and Technology Indicators
|
|
Figure 13
|
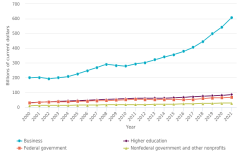
U.S. R&D expenditures, by performing sector: 2000–21 |
National Center for Science and Engineering Statistics
|
National Patterns of R&D Resources
|
|
Figure 14
|
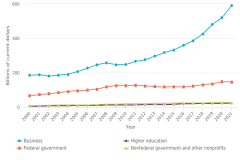
U.S. R&D expenditures, by source of funds: 2000–21 |
National Center for Science and Engineering Statistics
|
National Patterns of R&D Resources
|
|
Figure 15
|
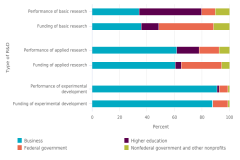
U.S. R&D performance and funding, by type of R&D and sector: 2021 |
National Center for Science and Engineering Statistics
|
National Patterns of R&D Resources
|
|
Figure 16
|
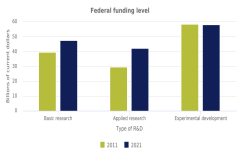
U.S. R&D performance funded by the federal government of each type of R&D: 2011 and 2021 |
National Center for Science and Engineering Statistics
|
National Patterns of R&D Resources
|
|
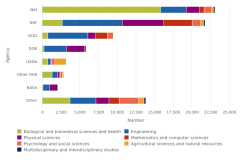
Figure 17
|
Full-time graduate students in S&E primarily supported by the federal government, by degree field and agency: 2021 |
National Center for Science and Engineering Statistics
|
Survey of Graduate Students and Postdoctorates in Science and Engineering
|
|
Figure 18
|
S&E articles, by selected region, country, or economy: 2003–22 |
Elsevier
|
Scopus
|
|
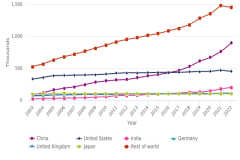
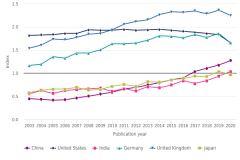
Figure 19
|
Highly cited article index, by selected country: 2003–20 |
Elsevier
|
Scopus
|
|
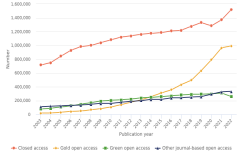
Figure 20
|
S&E articles, by publication access type: 2003–22 |
Elsevier
|
Scopus
|
|
Figure 21
|
Patent Cooperation Treaty applications, by selected region, country, or economy: 2000–22 |
European Patent Office
|
European Patent Bibliographic Data (EBD)
|
|
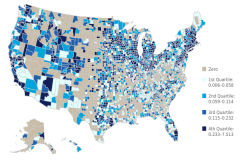
Figure 22
|
USPTO utility patents granted to inventors per 1,000 residents, by U.S. county: 2022 |
U.S. Census Bureau
|
Population Estimates Program
|
|
Figure 22
|
USPTO utility patents granted to inventors per 1,000 residents, by U.S. county: 2022
|
United States Patent and Trademark Office
|
PatentsView
|
|
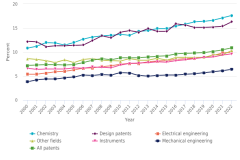
Figure 23
|
Inventors with female names on granted USPTO patents, by technology area and issue year: 2000–22 |
United States Patent and Trademark Office
|
Bulk Data Storage System
|
|
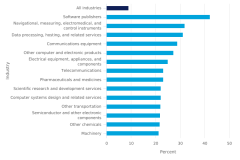
Figure 24
|
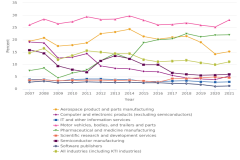
U.S. companies reporting product innovation, by selected industry: 2018–20 |
National Center for Science and Engineering Statistics
|
Annual Business Survey
|
|
Figure 25
|
Value-added output of KTI industries, by selected region, county, or economy and by sector: 2012 and 2021 |
S&P Global
|
Comparative Industry Service
|
|
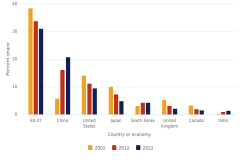
Figure 26
|
Share of global KTI manufacturing exports, by selected country or economy: 2002, 2012, and 2022 |
S&P Global
|
Comparative Industry Service
|
|
Figure 27
|
Imported content share of U.S. gross exports, by exporting industry: 2007–21 |
U.S. Bureau of Economic Analysis
|
Global Value Chains
|
|
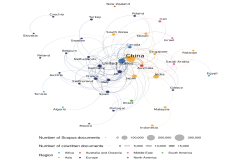
Figure A
|
AI collaboration network, by country: 2003–22 |
Elsevier
|
Scopus
|
|
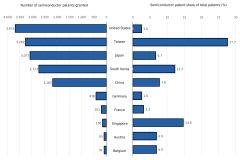
Figure B
|
USPTO utility patents granted in semiconductors, by country or economy: 2022 |
United States Patent and Trademark Office
|
PatentsView
|
|
Table 1
|
Distribution of select racial and ethnic groups in the workforce, by occupational group: 2021 |
U.S. Census Bureau
|
American Community Survey
|
 An official website of the United States government