 An official website of the United States government
 Representation of Demographic Groups in STEM
A diverse STEM workforce is vital to the country’s innovative capacity (Bell et al. 2019; Hsieh et al. 2019). Broadening the representation of different social and demographic groups in STEM occupations contributes to diversity and helps create a robust workforce that will be able to meet the demands of the future (NSB 2020). To this end, the National Science Board’s (NSB’s) Vision 2030 emphasized the future need for STEM talent as well as the need to improve diversity among the STEM workforce (NSB 2020). Many factors influence entry and persistence in the STEM workforce, such as educational history (NSF 2020; NSTC 2021), demographic representation among educators (NSF 2020; Miriti 2020), and educational and employment environments or atmospheres (Keyes 2019; NSTC 2021; Malcom 2022). This section provides analyses of the STEM workforce demographics and the demographics of workers with their highest degree in an S&E or S&E-related field who were working in non-S&E or S&E-related occupations in 2021 to provide a benchmark in measuring STEM retention among underrepresented demographic groups.
Women in STEM
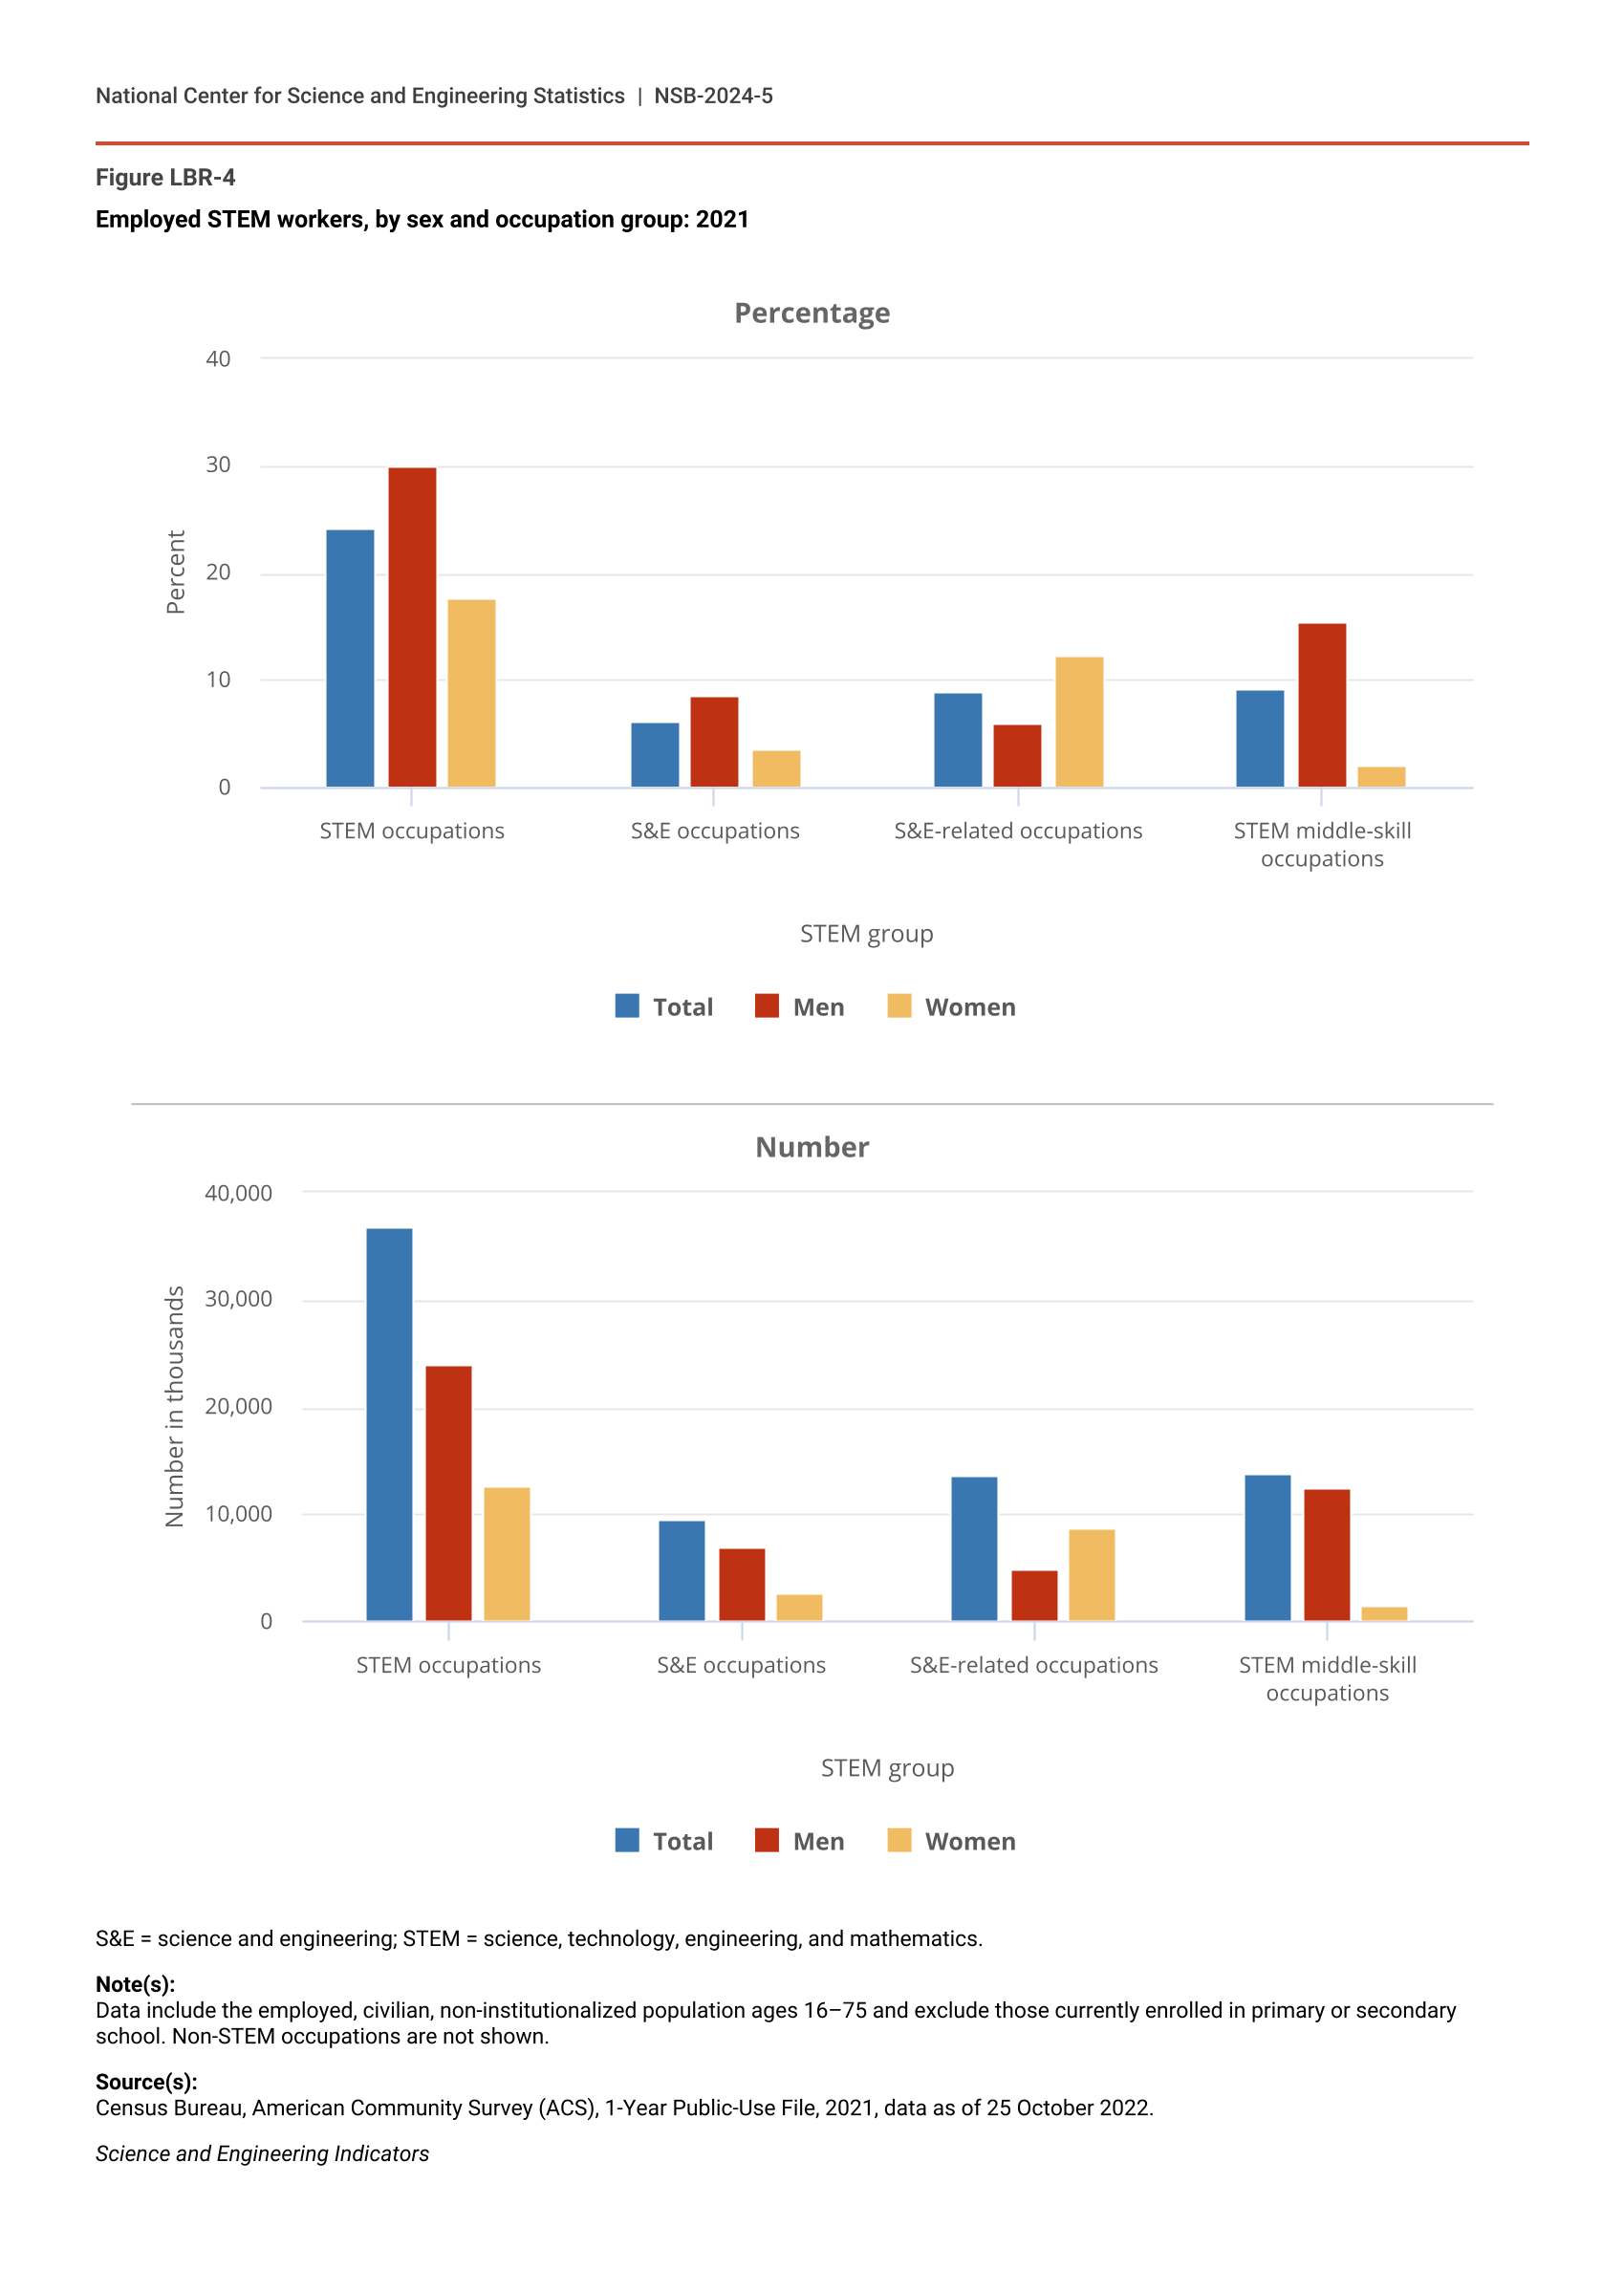
Women have long been underrepresented in STEM occupations, which is one of the driving factors for the emphasis by policy advocates and others on engaging more women in STEM occupations (NSB 2014, 2020; Joseph 2016; Achieving the Promise of a Diverse STEM Workforce 2019; Malcom 2022). In 2021, while 24% of U.S. workers held a STEM occupation, 18% of female workers held a STEM occupation—three-fifths the rate of male workers (30%) (Figure LBR-4).
Employed STEM workers, by sex and occupation group: 2021
| STEM group | Total | Men | Women |
|---|---|---|---|
| STEM occupations | 24.2 | 30.0 | 17.6 |
| S&E occupations | 6.2 | 8.6 | 3.5 |
| S&E-related occupations | 8.9 | 5.9 | 12.2 |
| STEM middle-skill occupations | 9.1 | 15.5 | 2.0 |
| STEM group | Total | Men | Women |
|---|---|---|---|
| STEM occupations | 36,804 | 24,067 | 12,736 |
| S&E occupations | 9,422 | 6,908 | 2,515 |
| S&E-related occupations | 13,540 | 4,759 | 8,781 |
| STEM middle-skill occupations | 13,841 | 12,400 | 1,441 |
S&E = science and engineering; STEM = science, technology, engineering, and mathematics.
Note(s):
Data include the employed, civilian, non-institutionalized population ages 16–75 and exclude those currently enrolled in primary or secondary school. Non-STEM occupations are not shown.
Source(s):
Census Bureau, American Community Survey (ACS), 1-Year Public-Use File, 2021, data as of 25 October 2022.
Science and Engineering Indicators
The difference in the participation of men and women in STEM occupations varies by the type of STEM occupation. In 2021, men outnumbered women approximately 2.75 to 1.00 in S&E occupations and 8.5 to 1.0 in STEM middle-skill occupations (Figure LBR-4). S&E-related occupations were the only STEM occupation group in which women outnumbered men, with about twice as many women working in S&E-related occupations than men. Among STEM workers, more men belonged to the STW than women in 2021 (59% compared with 39%). In addition, within S&E and STEM middle-skill workers, a higher percentage of men were part of the STW (23% and 89%, respectively) than their female counterparts (19% and 75%, respectively) (Table SLBR-7).
In about the last 5 years (2016 to 2021), the percentage of women working in STEM occupations increased about as much as the percentage of men working in STEM (2 percentage points) (Table SLBR-8). This equates to an additional 1,613,800 women and 2,182,100 men in STEM occupations in 2021 compared with 2016. Between 2011 and 2021, the percentage of women working in STEM increased more than men—from 15% to 18% (an increase of 3,060,200 women), compared with the increase in the percentage of men working in STEM from 28% to 30% (an increase of 4,005,200 men). Despite this gain, the proportion of men in STEM occupations remained higher than that of women in 2011, 2016, and 2021 (Table SLBR-8). Historic trends of women in S&E or S&E-related occupations with a bachelor’s degree or higher can be found in Table SLBR-9.
Race or Ethnicity in STEM
One way to analyze the racial and ethnic representation in the STEM workforce is by comparing the distributions to those in the total U.S. workforce. Using this comparison, in 2021, STEM workers were disproportionately Asian and White according to the ACS (Table LBR-1). In 2021, Black or African American workers comprised 8% of workers in STEM occupations, which was lower than their percentage of the total workforce (11%). The percentage of STEM workers that were Hispanic was 15%, compared with 18% of all workers. In contrast, Asian workers were present in STEM occupations (10%) more than they were present among all occupations (6%).
Distribution of select racial and ethnic groups in the workforce, by occupation group: 2021
S&E = science and engineering; STEM = science, technology, engineering, and mathematics.
Note(s):
Data include the employed, civilian, non-institutionalized population ages 16–75 and excludes those currently enrolled in primary or secondary school. Percentages may not add to 100% because of rounding. Hispanic may be any race. Race categories represent race alone and exclude Hispanic origin.
Source(s):
Census Bureau, American Community Survey (ACS), 1-Year Public-Use File, 2021, data as of October 2022.
Science and Engineering Indicators
Racial and ethnic representation also varied by the type of STEM occupation (Table LBR-1). Asian workers were employed in S&E occupations (18%) at almost three times their employment in the U.S. workforce (6%), while S&E-related occupations employed them slightly more than 1.5 times the rate that they were employed in the total workforce. In contrast, Hispanic workers were employed in both S&E occupations (9%) and S&E-related occupations (11%) at about half (52% and 58%, respectively) the rate of their employment in the total workforce (18%). In STEM middle-skill occupations, however, several of these comparisons were inverted. For example, Hispanics were employed in STEM middle-skill occupations (22%) at 1.2 times their employment in the total workforce.
The STW had higher concentrations of Hispanic workers (20%) and Black or African American workers (9%) than STEM workers with a bachelor’s degree or higher (9% and 7%, respectively) (Table SLBR-10). This trend was consistent across S&E and S&E-related occupations. In both occupation groups, the STW had higher percentages of Black or African American workers and Hispanic workers than the corresponding workforce with a bachelor’s degree or higher. Among STEM middle-skill occupations, the STW had a higher concentration of Hispanic workers (24%) than the corresponding workers with a bachelor’s degree or higher (13%), but there was no significant difference in the percentage of Black or African American workers between the two workforces (both at 8%). A more detailed discussion of racial and ethnic groups in STEM can be found in the Diversity and STEM: Women, Minorities, and Persons with Disabilities 2023 report.
Who Is Working Outside of Their Highest Degree Field
Researchers have been exploring if environmental or social factors potentially inhibit persons from historically underrepresented demographic groups in the STEM workforce from persisting in STEM career paths (Fry, Kennedy, and Funk 2021; NCSES 2023; Ngo 2016; Kahn and Ginther 2017; Funk and Parker 2018a, 2018b; Achieving the Promise of a Diverse STEM Workforce 2019; Keyes 2019; Agarwal 2020; Jelks and Crain 2020). This section analyzes the alignment between the field of highest degree and occupation among workers with a bachelor’s degree or higher. Employment in a non-S&E occupation among workers with an S&E or S&E-related degree measures a loss of trained workers in S&E or S&E-related occupations. Data in this section are from the National Survey of College Graduates (NSCG), which only includes respondents with at least a bachelor’s degree.
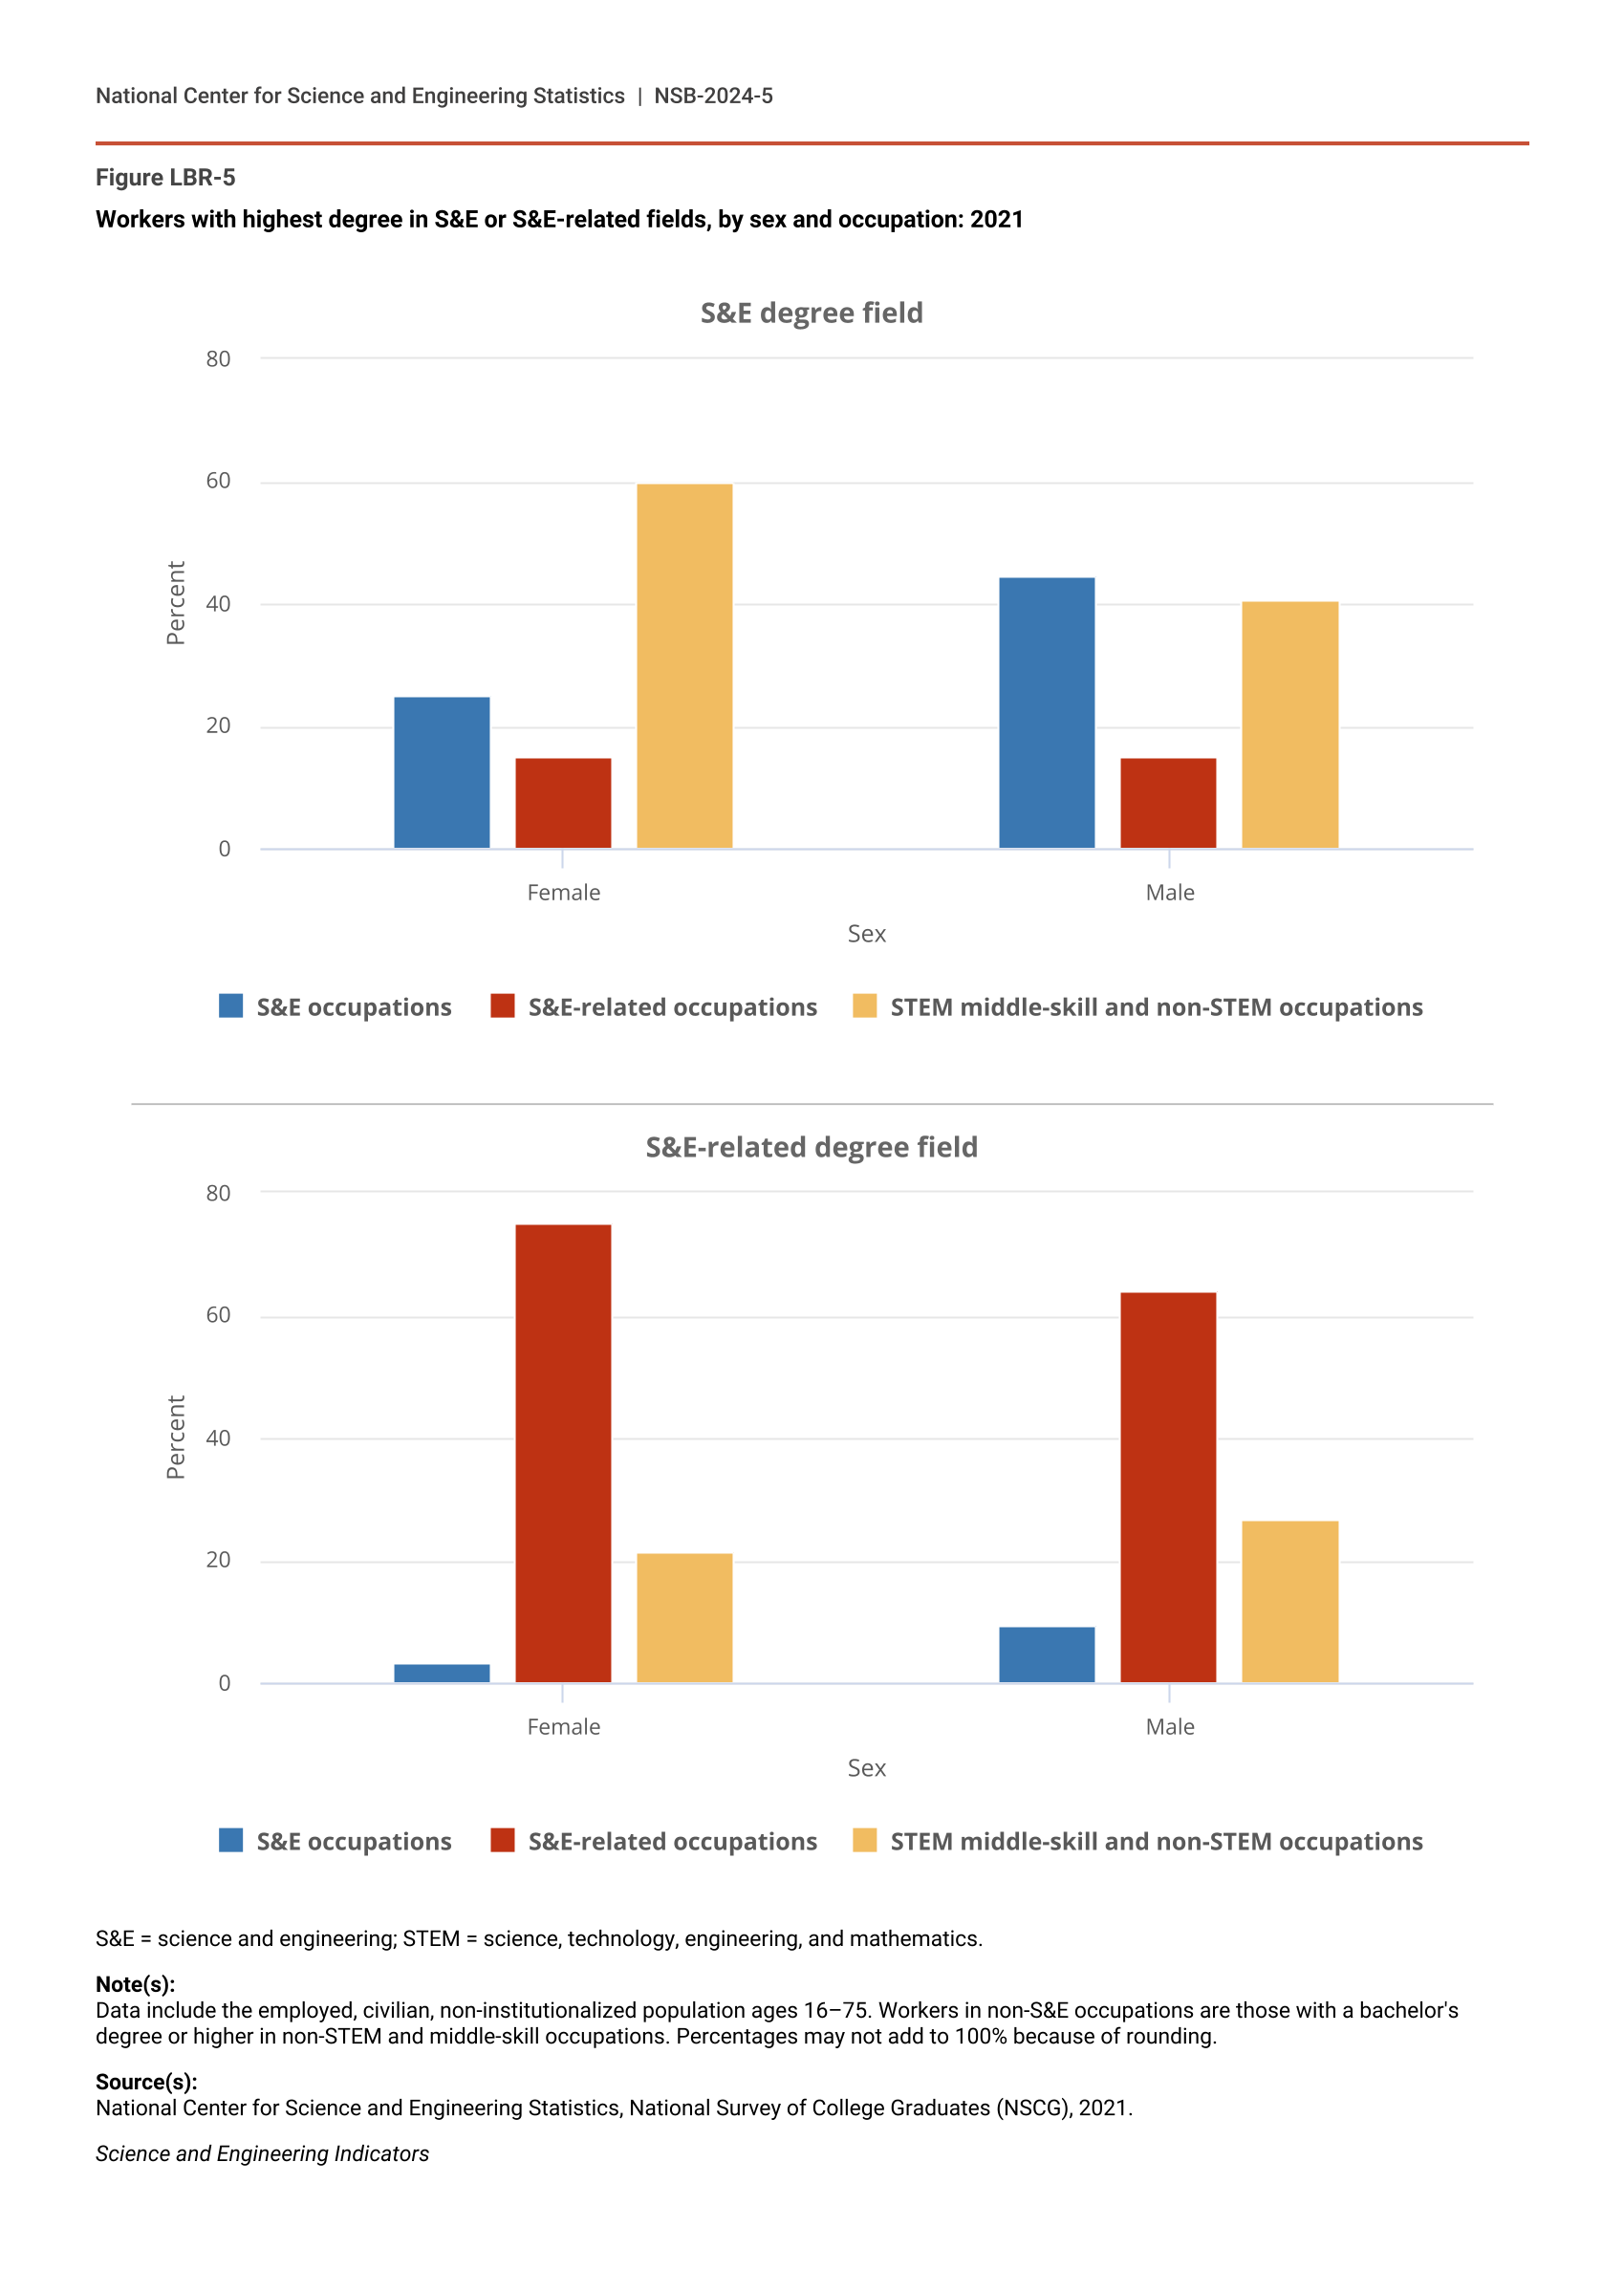
The percentage of workers in S&E and S&E-related occupations varied between sexes. In 2021, a larger share of women with their highest degree in an S&E field worked in non-S&E occupations than men (Figure LBR-5). Although about the same percentage of men and women with their highest degree in an S&E field worked in S&E-related occupations, a higher percentage of female S&E degree holders (60%) worked outside of both S&E and S&E-related occupations, indicating a lower rate of working in S&E and S&E-related occupations than male S&E degree holders (41%). Among S&E-related highest degree holders, a higher percentage of women stayed in S&E-related fields for work (75%), while a higher percentage of men went into S&E occupations (9%).
Workers with highest degree in S&E or S&E-related fields, by sex and occupation: 2021
| Sex | S&E occupations | S&E-related occupations | STEM middle-skill and non-STEM occupations |
|---|---|---|---|
| Female | 25.1 | 15.1 | 59.8 |
| Male | 44.6 | 14.8 | 40.5 |
| Sex | S&E occupations | S&E-related occupations | STEM middle-skill and non-STEM occupations |
|---|---|---|---|
| Female | 3.3 | 75.1 | 21.6 |
| Male | 9.3 | 64.2 | 26.6 |
S&E = science and engineering; STEM = science, technology, engineering, and mathematics.
Note(s):
Data include the employed, civilian, non-institutionalized population ages 16–75. Workers in non-S&E occupations are those with a bachelor's degree or higher in non-STEM and middle-skill occupations. Percentages may not add to 100% because of rounding.
Source(s):
National Center for Science and Engineering Statistics, National Survey of College Graduates (NSCG), 2021.
Science and Engineering Indicators
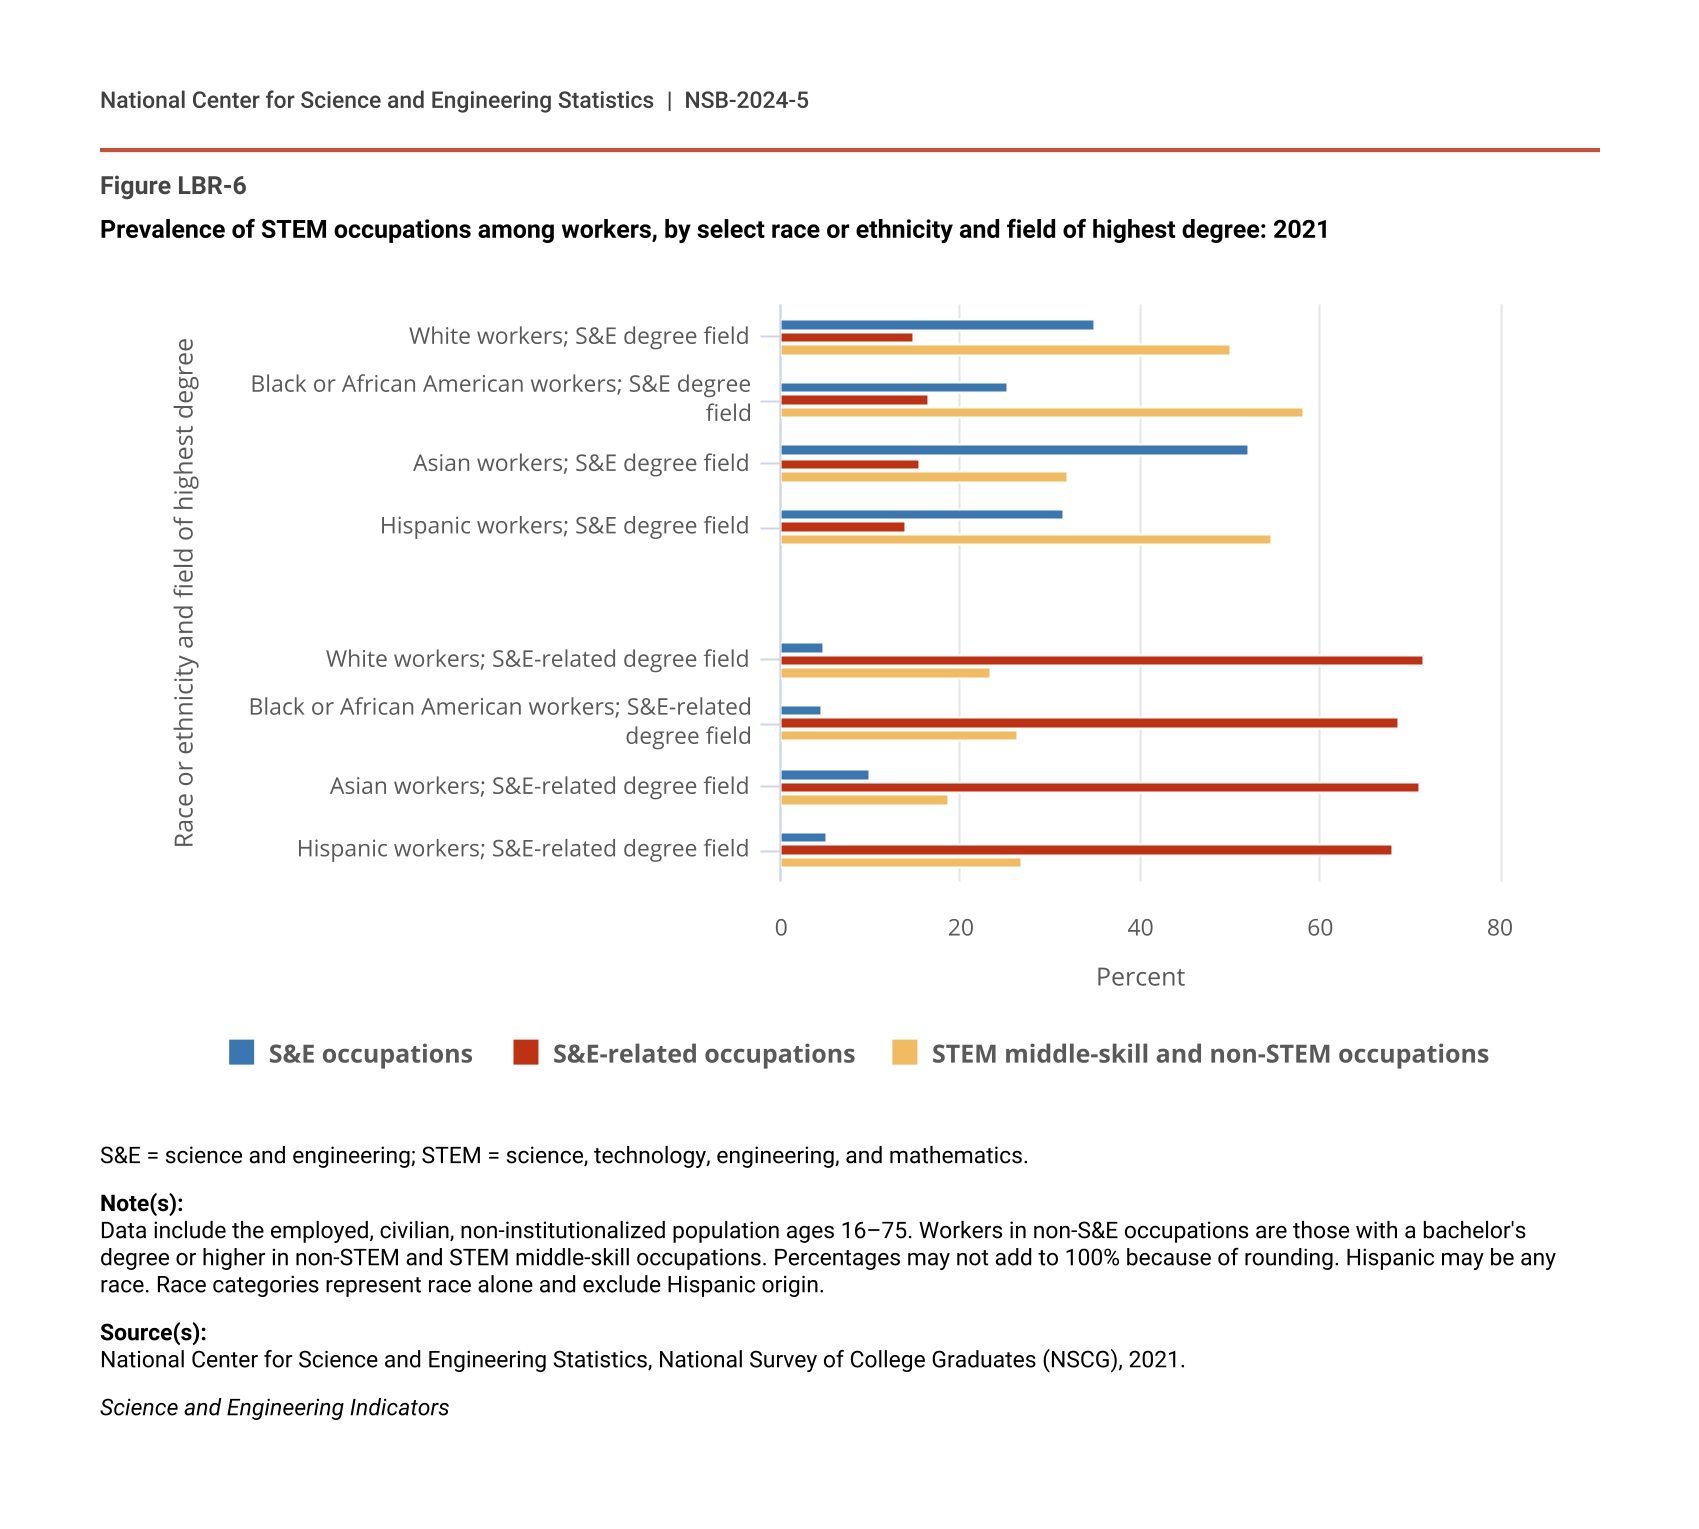
Comparisons across race reveal that 25% of Black or African American workers and 31% of Hispanic workers with their highest degree in S&E worked in S&E occupations, compared with 35% of White and 52% of Asian workers with S&E highest degrees (Figure LBR-6). About the same proportion of White, Black or African American, Hispanic, and Asian workers with an S&E degree as their highest degree went into S&E-related occupations. This indicates that Black or African American workers and Hispanic workers with an S&E highest degree work more frequently in non-S&E or S&E-related occupations.
Prevalence of STEM occupations among workers, by select race or ethnicity and field of highest degree: 2021
| Race or ethnicity and field of highest degree | S&E occupations | S&E-related occupations | STEM middle-skill and non-STEM occupations |
|---|---|---|---|
| White workers; S&E degree field | 35.1 | 14.9 | 50.0 |
| Black or African American workers; S&E degree field | 25.3 | 16.5 | 58.1 |
| Asian workers; S&E degree field | 52.2 | 15.6 | 32.1 |
| Hispanic workers; S&E degree field | 31.5 | 13.9 | 54.7 |
| White workers; S&E-related degree field | 4.9 | 71.7 | 23.5 |
| Black or African American workers; S&E-related degree field | 4.7 | 68.8 | 26.5 |
| Asian workers; S&E-related degree field | 9.9 | 71.2 | 18.8 |
| Hispanic workers; S&E-related degree field | 5.0 | 68.2 | 26.8 |
S&E = science and engineering; STEM = science, technology, engineering, and mathematics.
Note(s):
Data include the employed, civilian, non-institutionalized population ages 16–75. Workers in non-S&E occupations are those with a bachelor's degree or higher in non-STEM and STEM middle-skill occupations. Percentages may not add to 100% because of rounding. Hispanic may be any race. Race categories represent race alone and exclude Hispanic origin.
Source(s):
National Center for Science and Engineering Statistics, National Survey of College Graduates (NSCG), 2021.
Science and Engineering Indicators
Among workers with their highest degree in an S&E-related field, about the same proportion of White, Black or African American, Hispanic, and Asian workers held S&E-related occupations. However, the percentage of Black or African American workers and Hispanic workers in S&E occupations was lower than that of Asian workers, and the percentage of Black or African American workers and Hispanic workers in non-S&E or S&E-related occupations was higher than Asian workers.
These patterns suggest that, in addition to lower degree attainment in certain S&E and S&E-related fields (Fry, Kennedy, and Funk 2021; NCSES 2023), the lower presence of female, Black or African American, and Hispanic workers in S&E occupations may be related to fewer trained workers from these demographics working in their degree fields. Research into potential causes suggests that a variety of factors in work environments may contribute to members of minority groups leaving STEM occupations (Ngo 2016; Kahn and Ginther 2017; Funk and Parker 2018a, 2018b; Achieving the Promise of a Diverse STEM Workforce 2019; Keyes 2019; Agarwal 2020).