 An official website of the United States government
 U.S. STEM Workforce: Size, Growth, and Employment
Size, Growth, and Employment
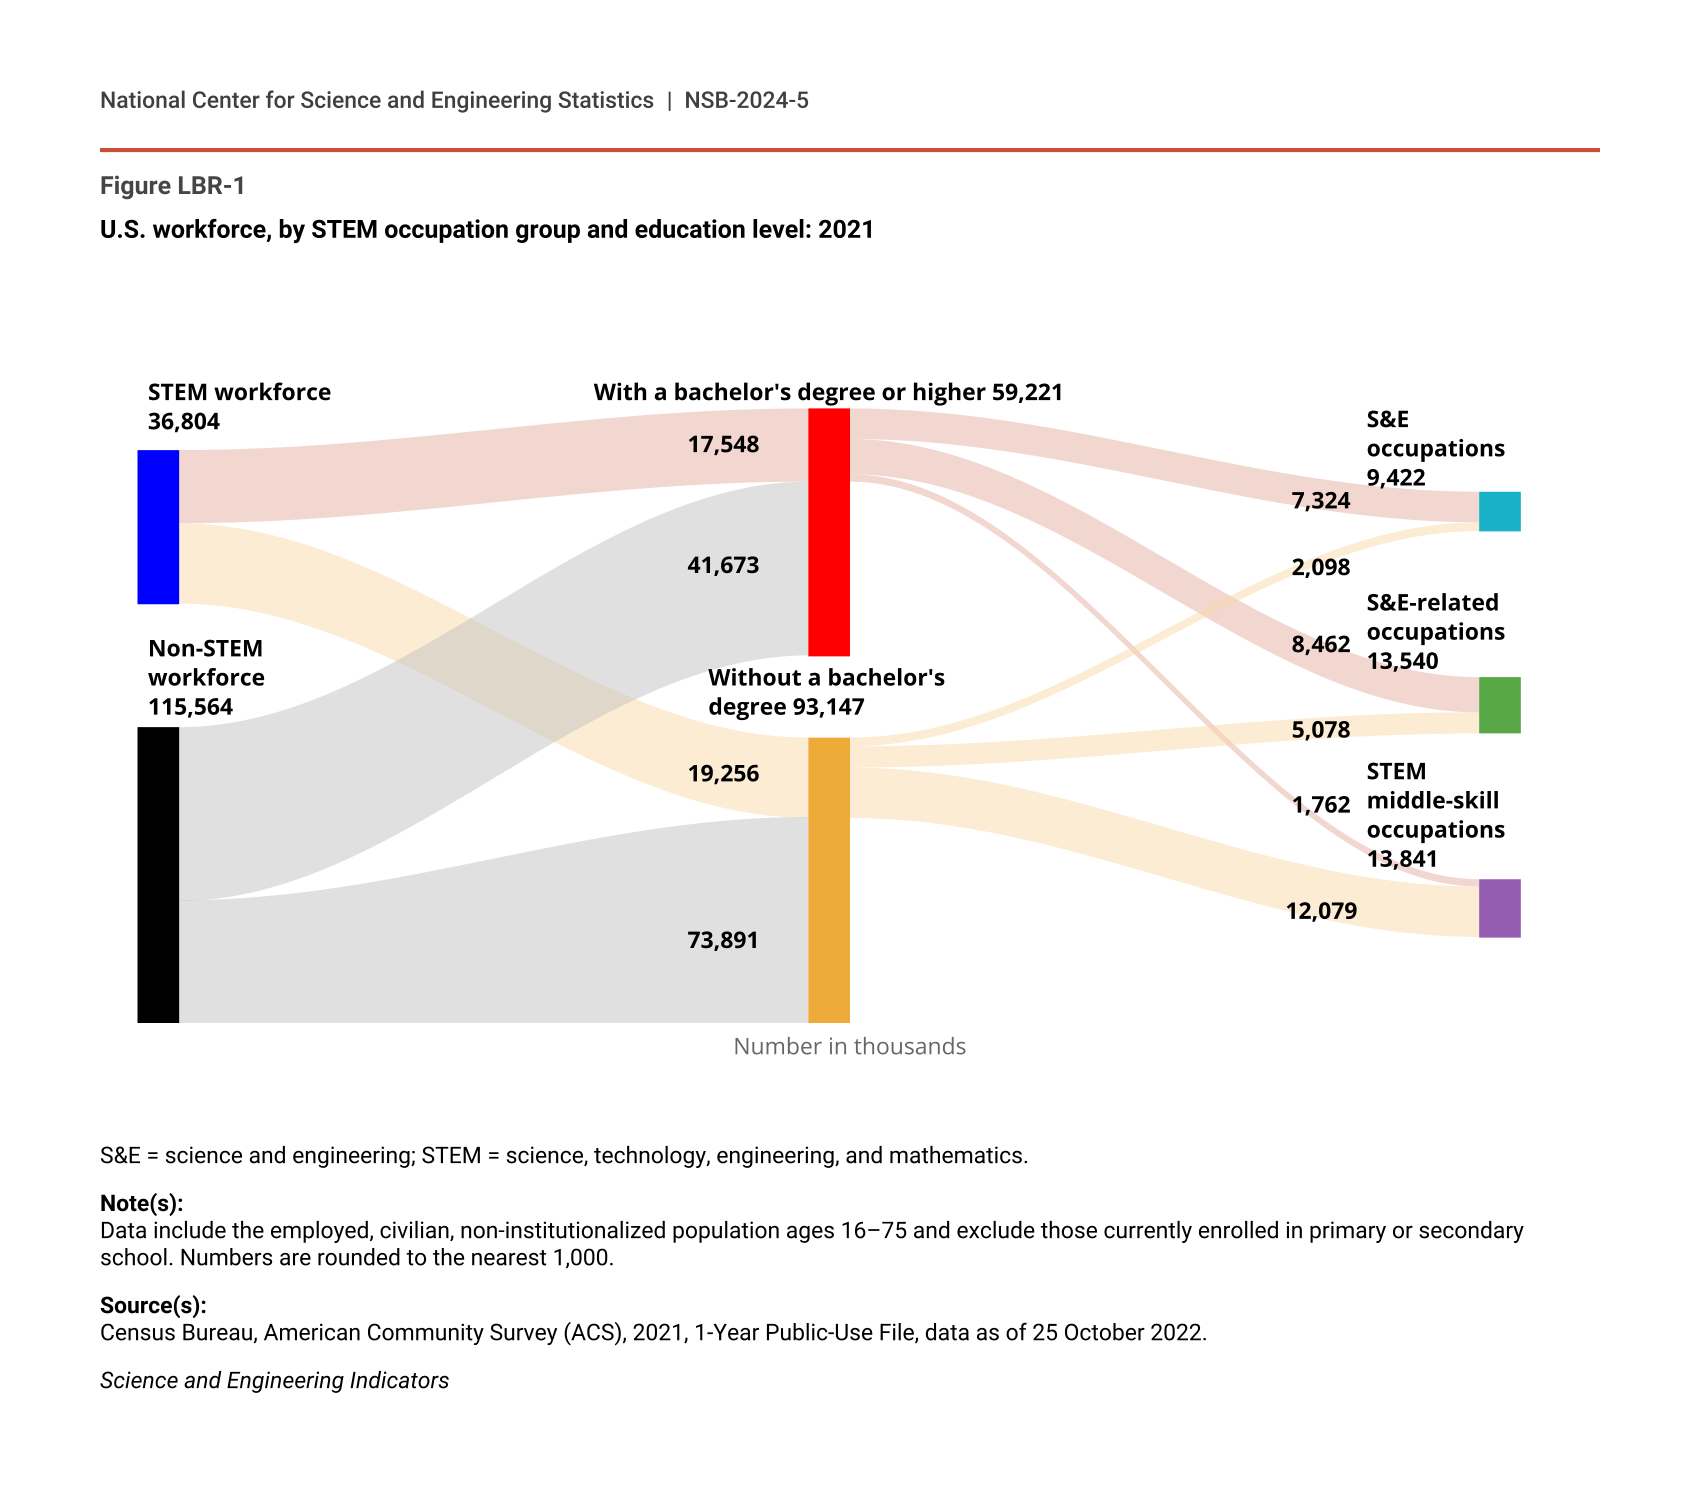
Individuals in the STEM workforce fuel the nation’s innovative capacity through their work in technologically advanced activities and make important contributions to improving the nation’s living standards, economic growth, and global competitiveness. In 2021, 24% of the U.S. workforce worked in STEM occupations (36.8 million workers), of which more than half (52%) did not have a bachelor’s degree and therefore were classified as the STW. About 63% of the STW worked in STEM middle-skill occupations, and 26% worked in S&E-related occupations. Most of the workers with a bachelor’s degree or higher (90%) worked in S&E or S&E-related occupations (Figure LBR-1).
U.S. workforce, by STEM occupation group and education level: 2021
| Education level and STEM occupational group | Total |
|---|---|
| Total | 152,368 |
| STEM workforce | 36,804 |
| STEM, with a bachelor's degree or higher |
17,548 |
| STEM, with a bachelor's degree or higher, S&E occupations | 7,324 |
| STEM, with a bachelor's degree or higher, S&E-related occupations | 8,462 |
| STEM, with a bachelor's degree or higher, middle-skill occupations | 1,762 |
| STEM, without a bachelor's degree |
19,256 |
| STEM, without a bachelor's degree, S&E occupations | 2,098 |
| STEM, without a bachelor's degree, S&E-related occupations | 5,078 |
| STEM, without a bachelor's degree, middle-skill occupations | 12,079 |
| Non-STEM workforce | 115,564 |
| Non-STEM workforce, with a bachelor's degree or above | 41,673 |
| Non-STEM workforce, without a bachelor's degree | 73,891 |
S&E = science and engineering; STEM = science, technology, engineering, and mathematics.
Note(s):
Data include the employed, civilian, non-institutionalized population ages 16–75 and exclude those currently enrolled in primary or secondary school. Numbers are rounded to the nearest 1,000.
Source(s):
Census Bureau, American Community Survey (ACS), 2021, 1-Year Public-Use File, data as of 25 October 2022.
Science and Engineering Indicators
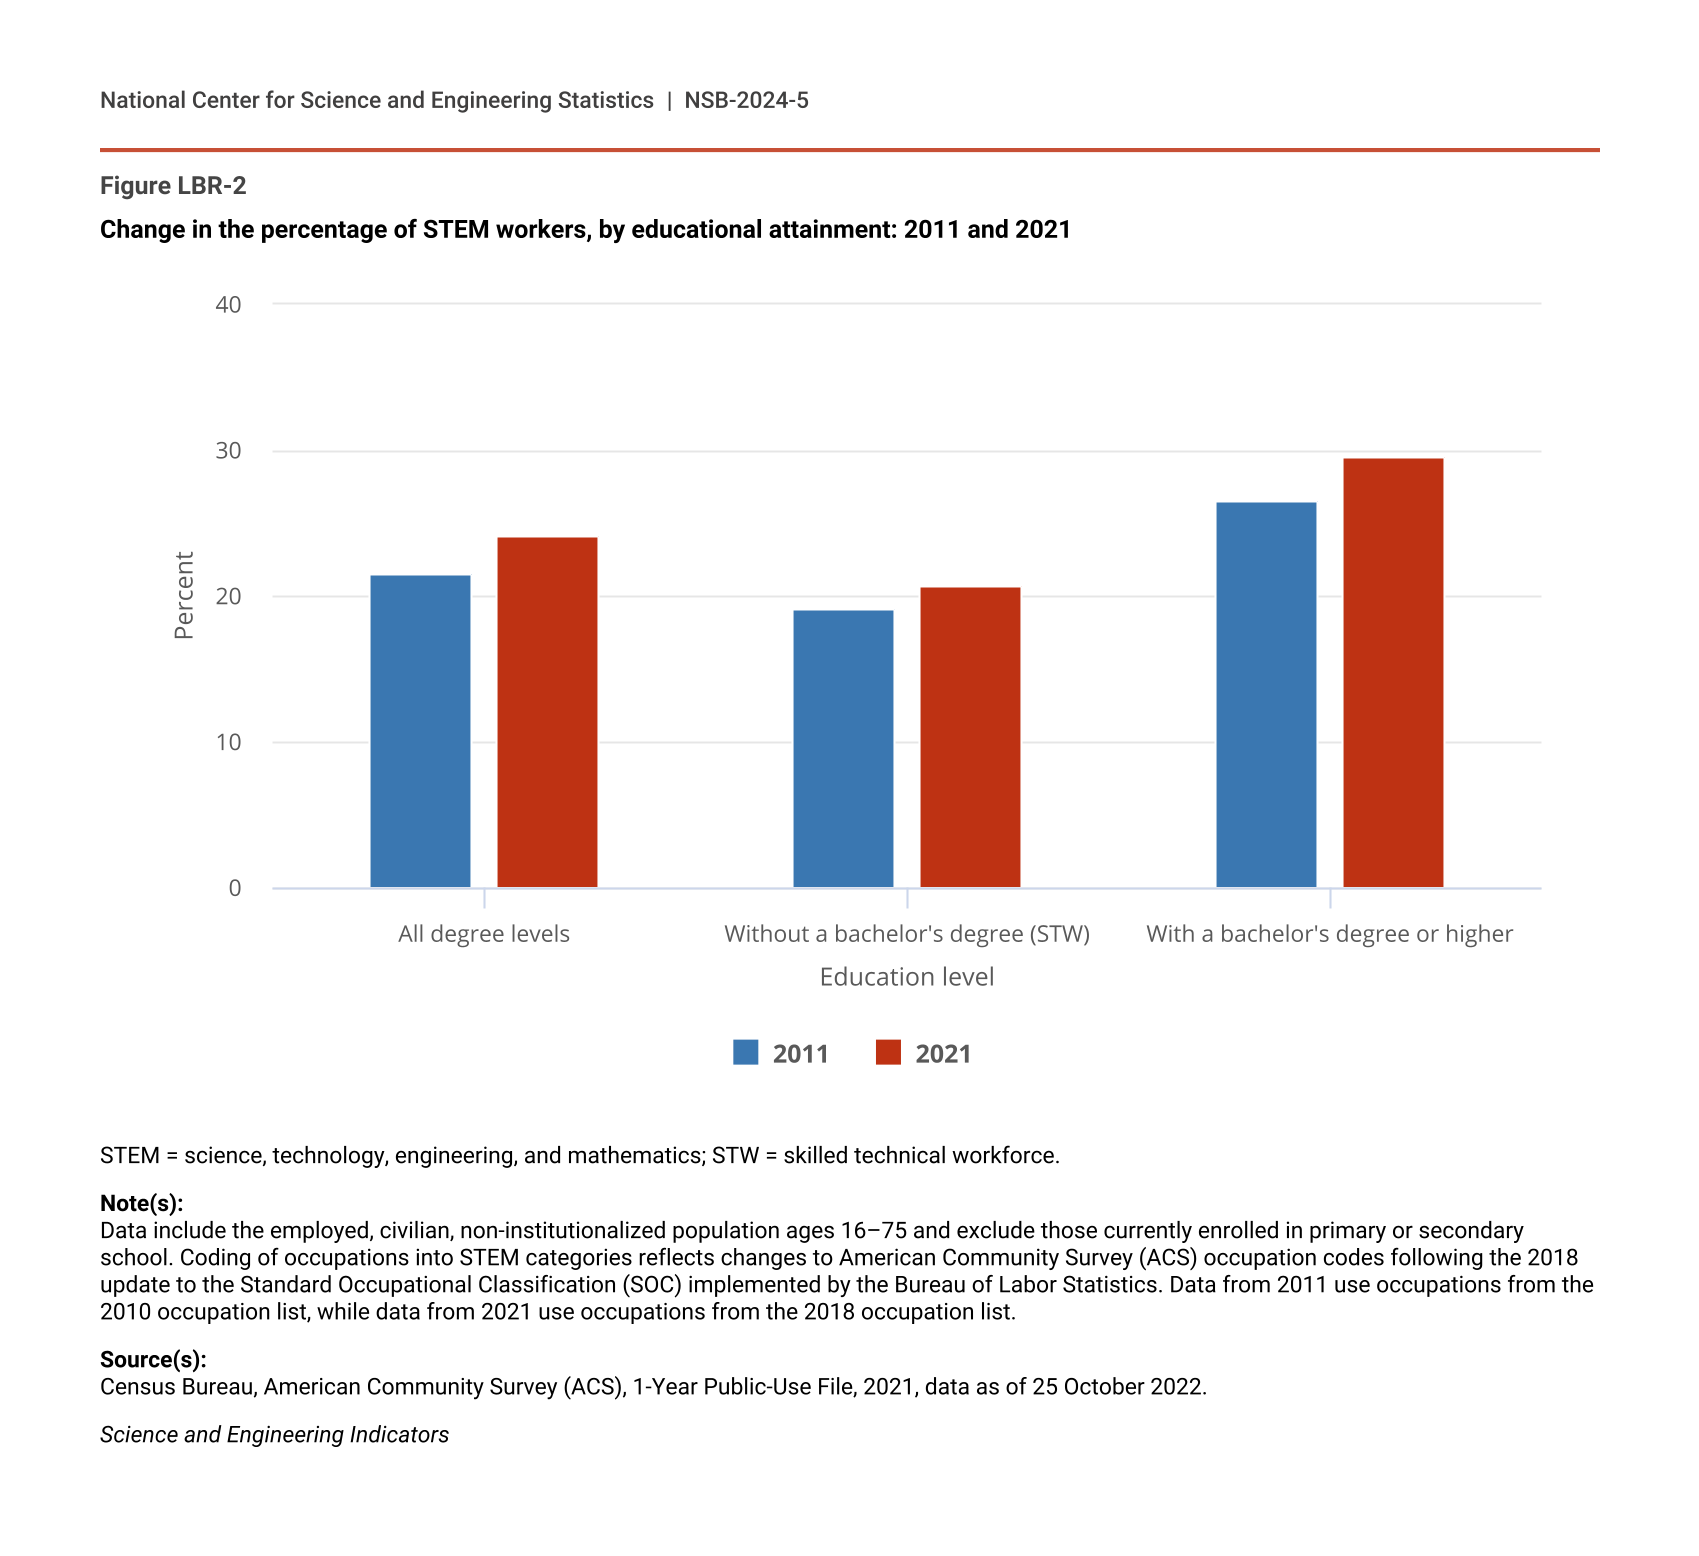
Over the last decade, workers in STEM occupations increased in both number and percentage of the total civilian workforce (Figure LBR-2; Table SLBR-2). Between 2011 and 2021, STEM workers increased from 22% to 24% (corresponding to 7.1 million workers) of the U.S. civilian workforce. By educational attainment, the STEM workforce with a bachelor’s degree or higher increased more than the STW. Among workers with a bachelor’s degree or higher, the percentage of STEM workers increased from 27% to 30%, corresponding to 5.7 million workers. The percentage of the STW (again, defined as those in STEM occupations without a bachelor’s degree) increased from 19% to 21% (corresponding to 1.4 million workers).
Change in the percentage of STEM workers, by educational attainment: 2011 and 2021
| Education level | 2011 | 2021 |
|---|---|---|
| All degree levels | 21.6 | 24.2 |
| Without a bachelor's degree (STW) | 19.2 | 20.7 |
| With a bachelor's degree or higher | 26.6 | 29.6 |
STEM = science, technology, engineering, and mathematics; STW = skilled technical workforce.
Note(s):
Data include the employed, civilian, non-institutionalized population ages 16–75 and exclude those currently enrolled in primary or secondary school. Coding of occupations into STEM categories reflects changes to American Community Survey (ACS) occupation codes following the 2018 update to the Standard Occupational Classification (SOC) implemented by the Bureau of Labor Statistics. Data from 2011 use occupations from the 2010 occupation list, while data from 2021 use occupations from the 2018 occupation list.
Source(s):
Census Bureau, American Community Survey (ACS), 1-Year Public-Use File, 2021, data as of 25 October 2022.
Science and Engineering Indicators
Increased employment in the STEM workforce was not equally distributed among the different categories of STEM occupations. The percentage of all workers in S&E occupations grew in the last decade from 4% to 6%. Among workers without a bachelor’s degree or higher, the percentage in S&E occupations increased by 44% from 1.6% in 2011 to 2.3% in 2021. The percentage of workers with a bachelor’s degree or higher in S&E occupations increased from 10% to 12%. The percentage of all workers in S&E-related occupations also increased over the last 10 years (an increase of 13% from 7.8% to 8.9%), though less than the percent increase among S&E occupations, while the percentage of all workers in STEM middle-skill decreased slightly between 2011 and 2021.
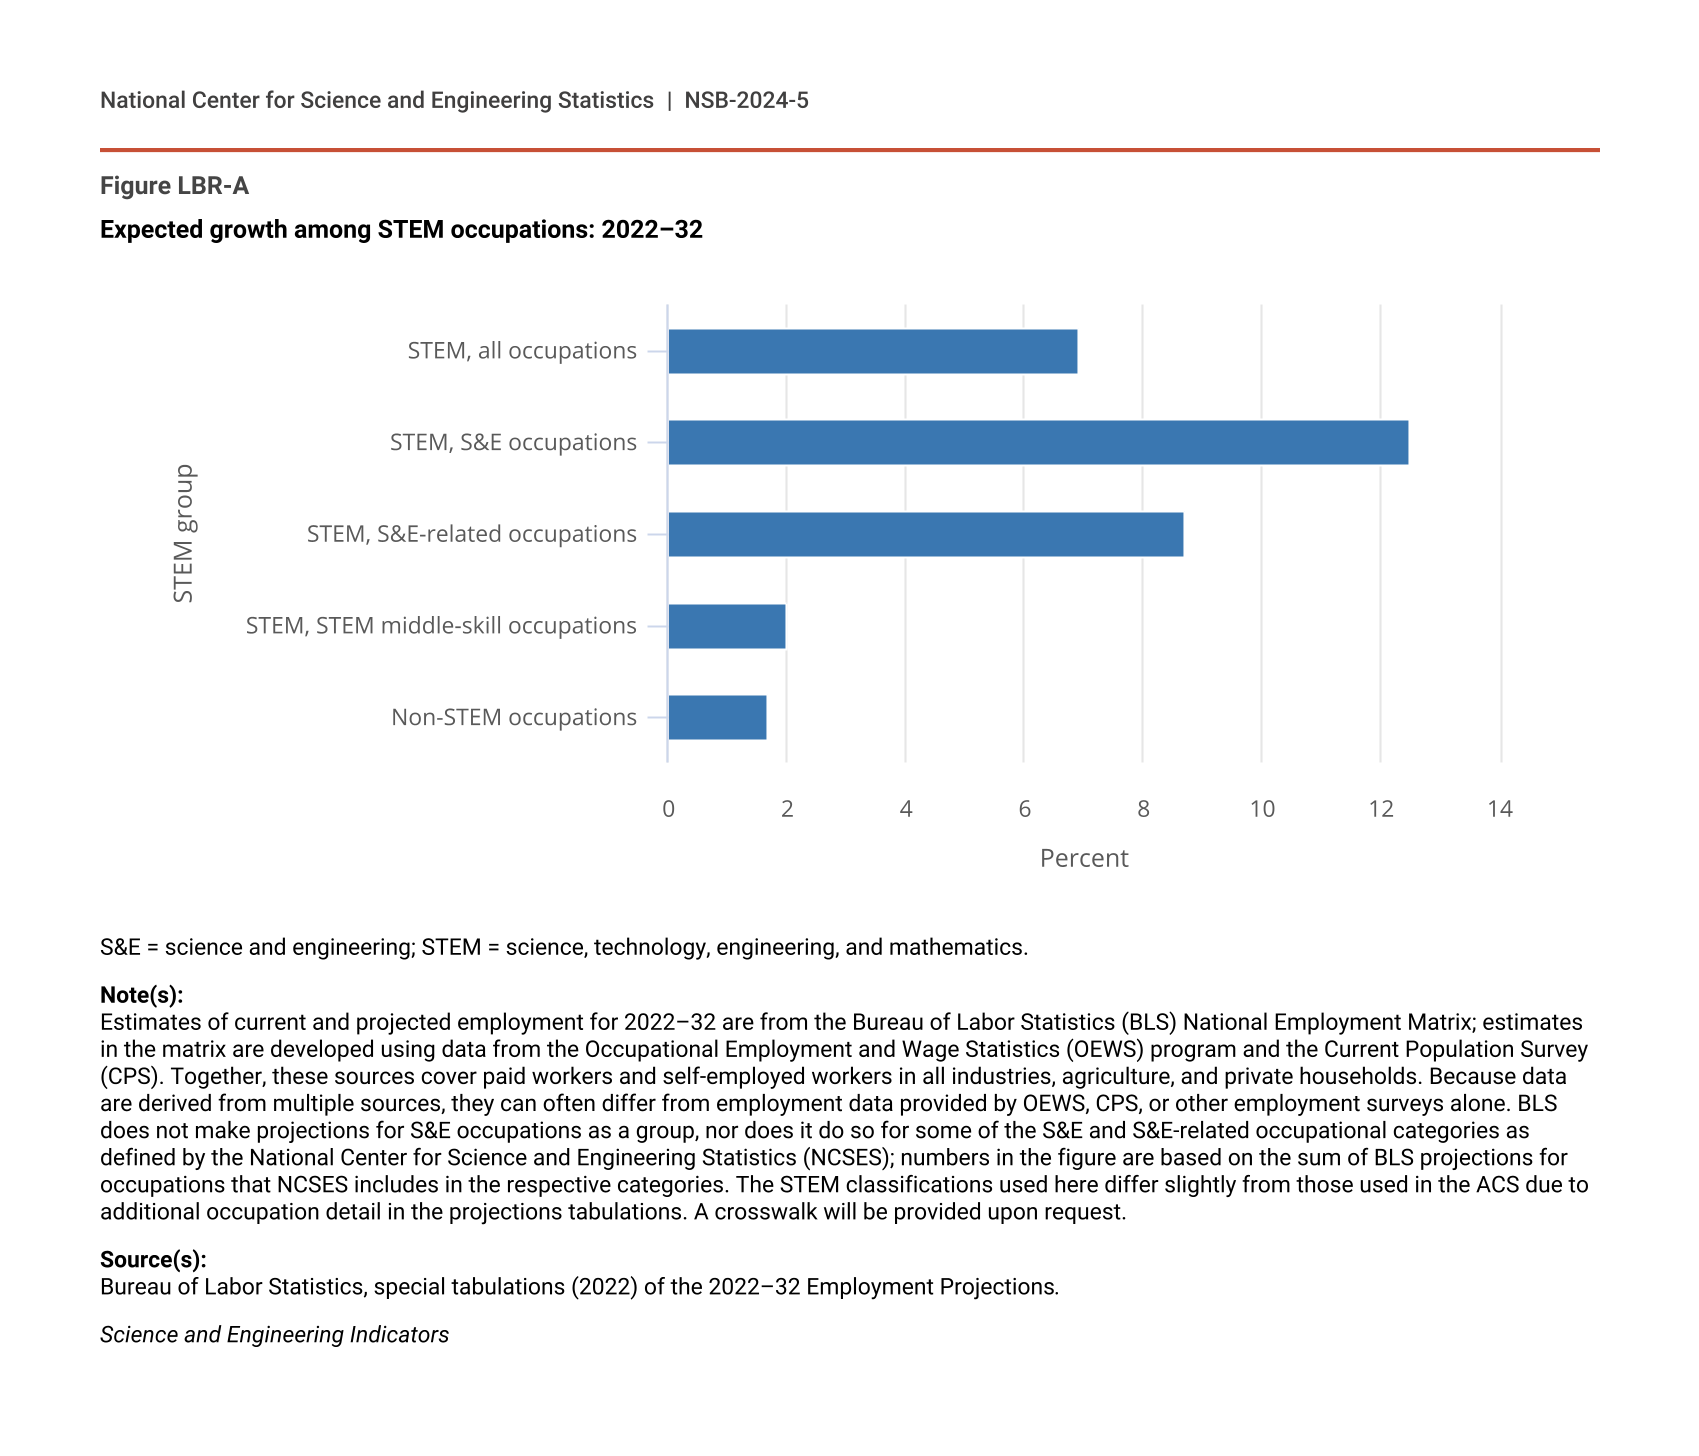
While this report presents data on the STEM workforce from previous years, the sidebar Projected Growth of Employment in STEM Occupations provides an overview of forecasted growth in STEM occupations over the next 10 years using data released by the Bureau of Labor Statistics (BLS).
Employment Rate and Labor Force Participation of STEM versus Non-STEM
Labor force statistics for people associated with occupations can provide insights into a group’s compared experiences with the labor market. The employment rate of an occupation or a group of occupations is the measure of employed adults among all adults associated with an occupation—including both those who are not currently working (but have occupation information for their last held job) and those who have a job. The category of “those not currently working” is comprised of two groups: individuals who do not have a job and are looking for work (the unemployed), as well as those who are not looking for work (those not in the labor force). The unemployment rate is the percentage of people who are unemployed among only those who are in the labor force (the employed and unemployed). Unemployment rate tables can be found in Table SLBR-3 and Table SLBR-4.
In 2021, people associated with a STEM occupation had a higher employment rate (86%) than those associated with non-STEM occupations (79%) (Table SLBR-5). These rates have been relatively stable over the last 5 years, despite overall employment declines during the 2020 recession. Between 2019 and 2021, people associated with non-STEM occupations experienced a larger decrease in their employment rates (from 83% to 79%) than those associated with STEM occupations (from 88% to 86%). This was primarily due to larger proportions of people associated with non-STEM occupations either leaving the labor force or being unable to find work in 2021. Among the types of STEM occupations, people associated with S&E occupations had the highest employment rate (89%) in 2021, followed by people associated with S&E-related occupations (87%).
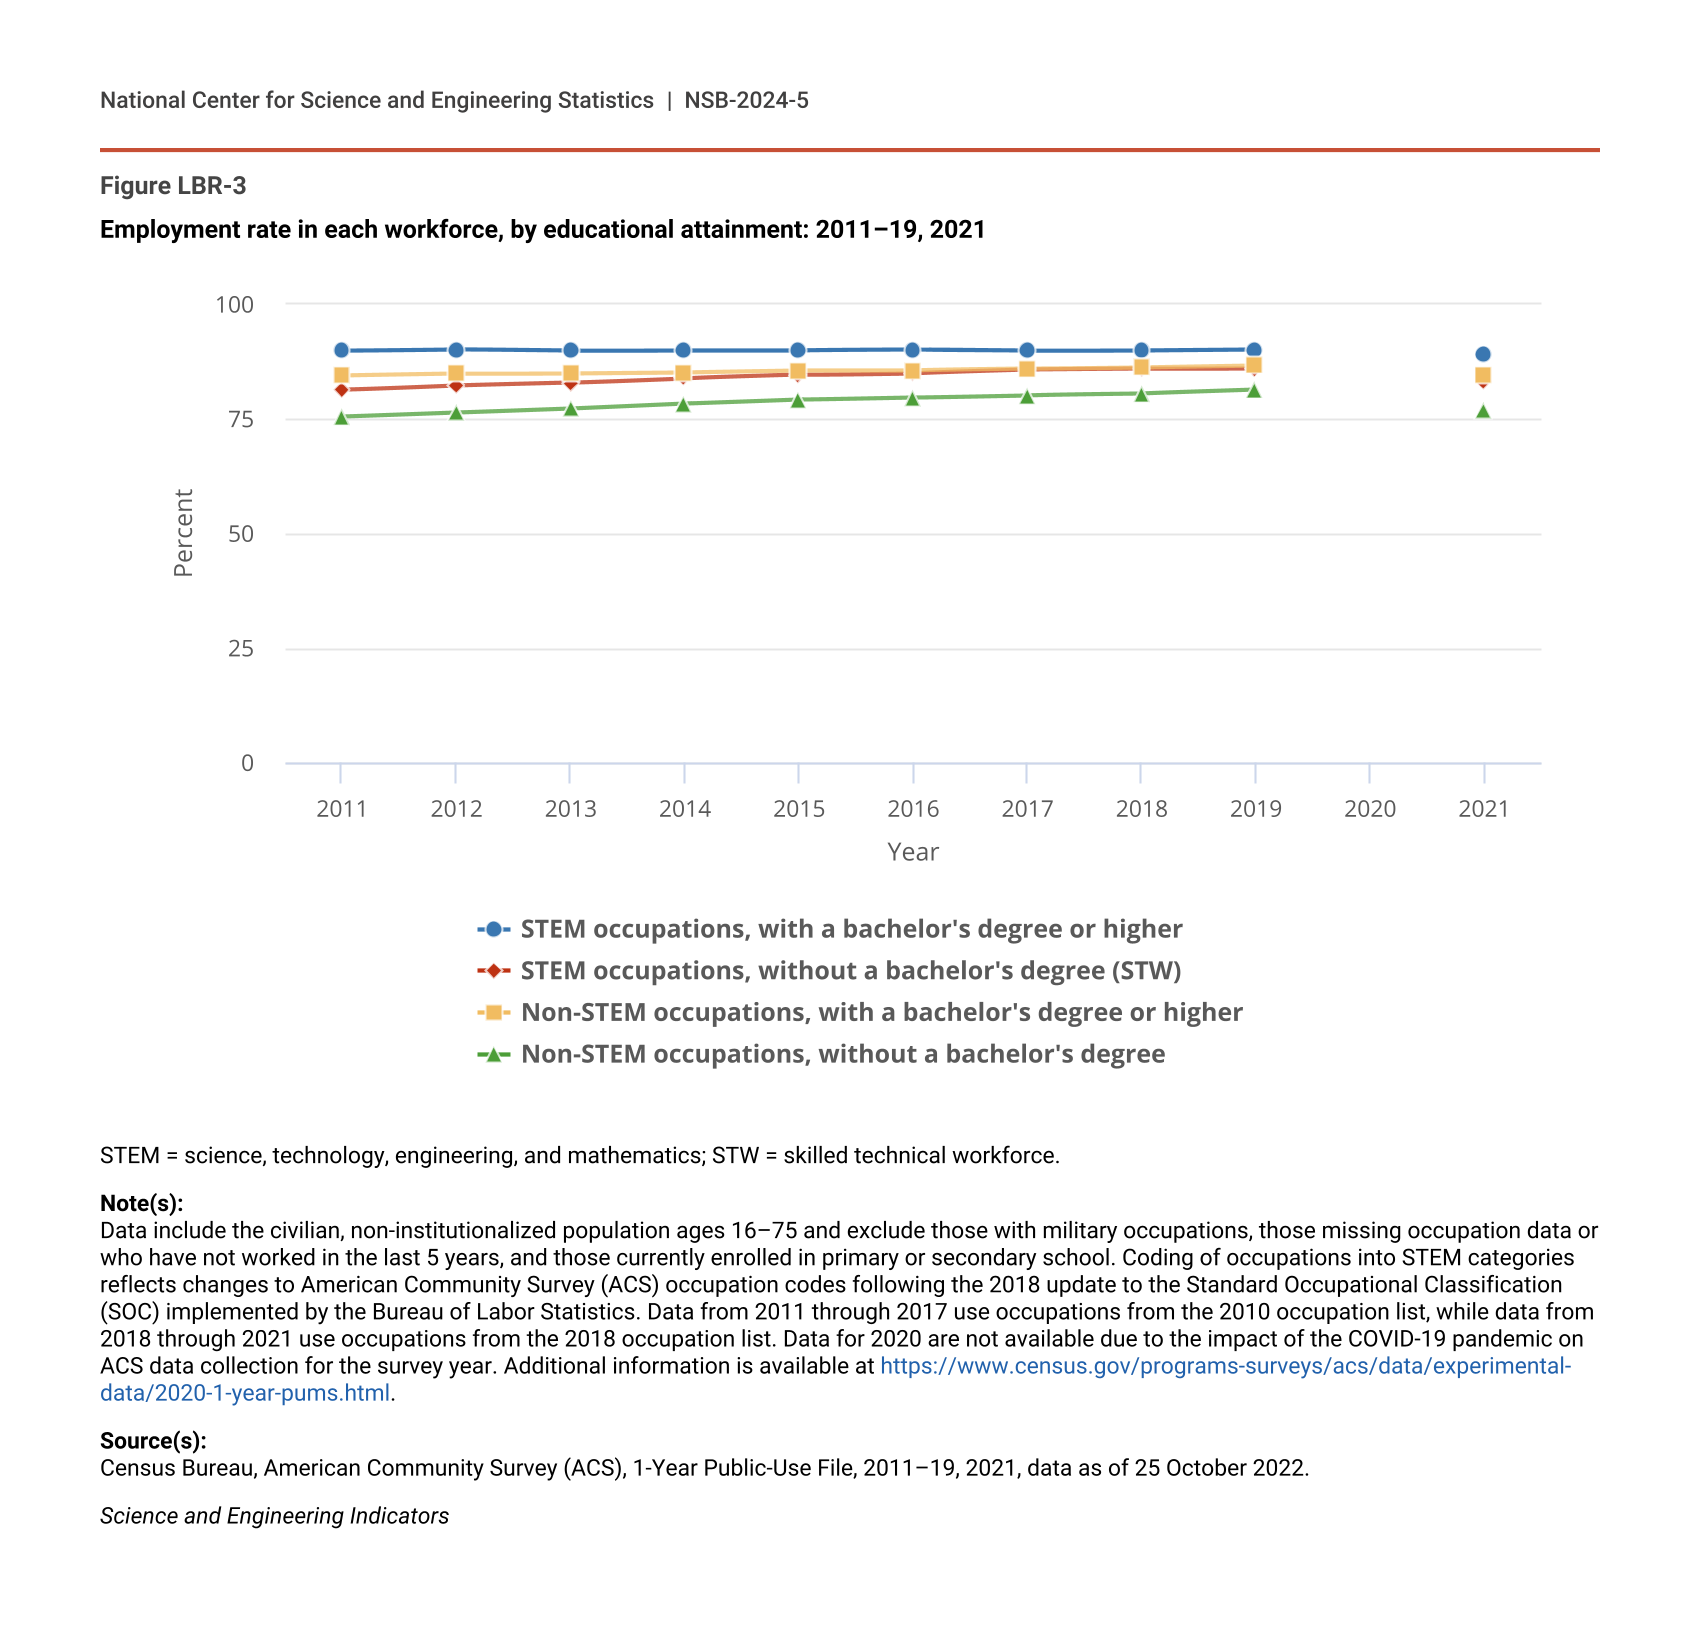
While overall employment rates for people associated with STEM occupations had relatively low changes between 2016 and 2021, there was variation by different types of STEM occupations (Table SLBR-6). People associated with all three STEM groups had consistently higher employment rates than those associated with non-STEM occupations during this period. People associated with S&E occupations had the highest employment rates, followed by those associated with S&E-related occupations. By educational attainment, people associated with S&E and S&E-related occupations with a bachelor’s degree or higher had the highest employment rates over the period (Figure LBR-3; Table SLBR-6). In addition, people associated with S&E and S&E-related occupations in the STW, as well as all people associated with STEM middle-skill occupations, had about the same employment rates as people associated with non-STEM occupations with a bachelor’s degree or higher. This suggests that STW occupations provide greater employment opportunities for people without a bachelor’s degree than non-STEM occupations.
Employment rate in each workforce, by educational attainment: 2011–19, 2021
| Year | STEM occupations, with a bachelor's degree or higher | STEM occupations, without a bachelor's degree (STW) | Non-STEM occupations, with a bachelor's degree or higher | Non-STEM occupations, without a bachelor's degree |
|---|---|---|---|---|
| 2011 | 89.9 | 81.3 | 84.5 | 75.4 |
| 2012 | 90.2 | 82.3 | 84.9 | 76.3 |
| 2013 | 89.9 | 82.9 | 85.0 | 77.2 |
| 2014 | 90.0 | 83.9 | 85.2 | 78.3 |
| 2015 | 90.0 | 84.6 | 85.6 | 79.2 |
| 2016 | 90.1 | 85.0 | 85.6 | 79.7 |
| 2017 | 89.9 | 85.7 | 85.9 | 80.2 |
| 2018 | 90.0 | 85.9 | 86.2 | 80.5 |
| 2019 | 90.2 | 86.0 | 86.6 | 81.3 |
| 2020 | NA | NA | NA | NA |
| 2021 | 89.3 | 83.1 | 84.4 | 76.8 |
STEM = science, technology, engineering, and mathematics; STW = skilled technical workforce.
Note(s):
Data include the civilian, non-institutionalized population ages 16–75 and exclude those with military occupations, those missing occupation data or who have not worked in the last 5 years, and those currently enrolled in primary or secondary school. Coding of occupations into STEM categories reflects changes to American Community Survey (ACS) occupation codes following the 2018 update to the Standard Occupational Classification (SOC) implemented by the Bureau of Labor Statistics. Data from 2011 through 2017 use occupations from the 2010 occupation list, while data from 2018 through 2021 use occupations from the 2018 occupation list. Data for 2020 are not available due to the impact of the COVID-19 pandemic on ACS data collection for the survey year. Additional information is available at https://www.census.gov/programs-surveys/acs/data/experimental-data/2020-1-year-pums.html.
Source(s):
Census Bureau, American Community Survey (ACS), 1-Year Public-Use File, 2011–19, 2021, data as of 25 October 2022.
Science and Engineering Indicators
Analyzing data between 2019 and 2021 (the most recent year available) can suggest how people associated with STEM occupations were affected by the COVID-19 pandemic. During this period, people associated with S&E occupations experienced the smallest decline in employment rate (0.4 percentage points, from 90% to 89%), primarily due to increases in the percentage unemployed over the same period. People associated with S&E-related occupations had a moderate drop in employment rates (1.4 percentage points), decreasing to 87%. Among people associated with S&E-related occupations, those in the STW had the largest drop in employment (2.0 percentage points, from 86% to 84%), which declined about as much as people associated with non-STEM occupations with a bachelor’s degree or higher (2.2 percentage points, from 87% to 84%). People associated with STEM middle-skill occupations had the greatest employment decrease among the STEM occupation groups (3.5 percentage points, from 86% to 83%) due to relatively equal portions of people leaving the labor force and being unable to find work. There was no significant difference between the employment declines of having a bachelor’s degree or higher or not (Table SLBR-6).