 An official website of the United States government
 STEM Labor Market Characteristics: Earnings, Occupations, and Industries
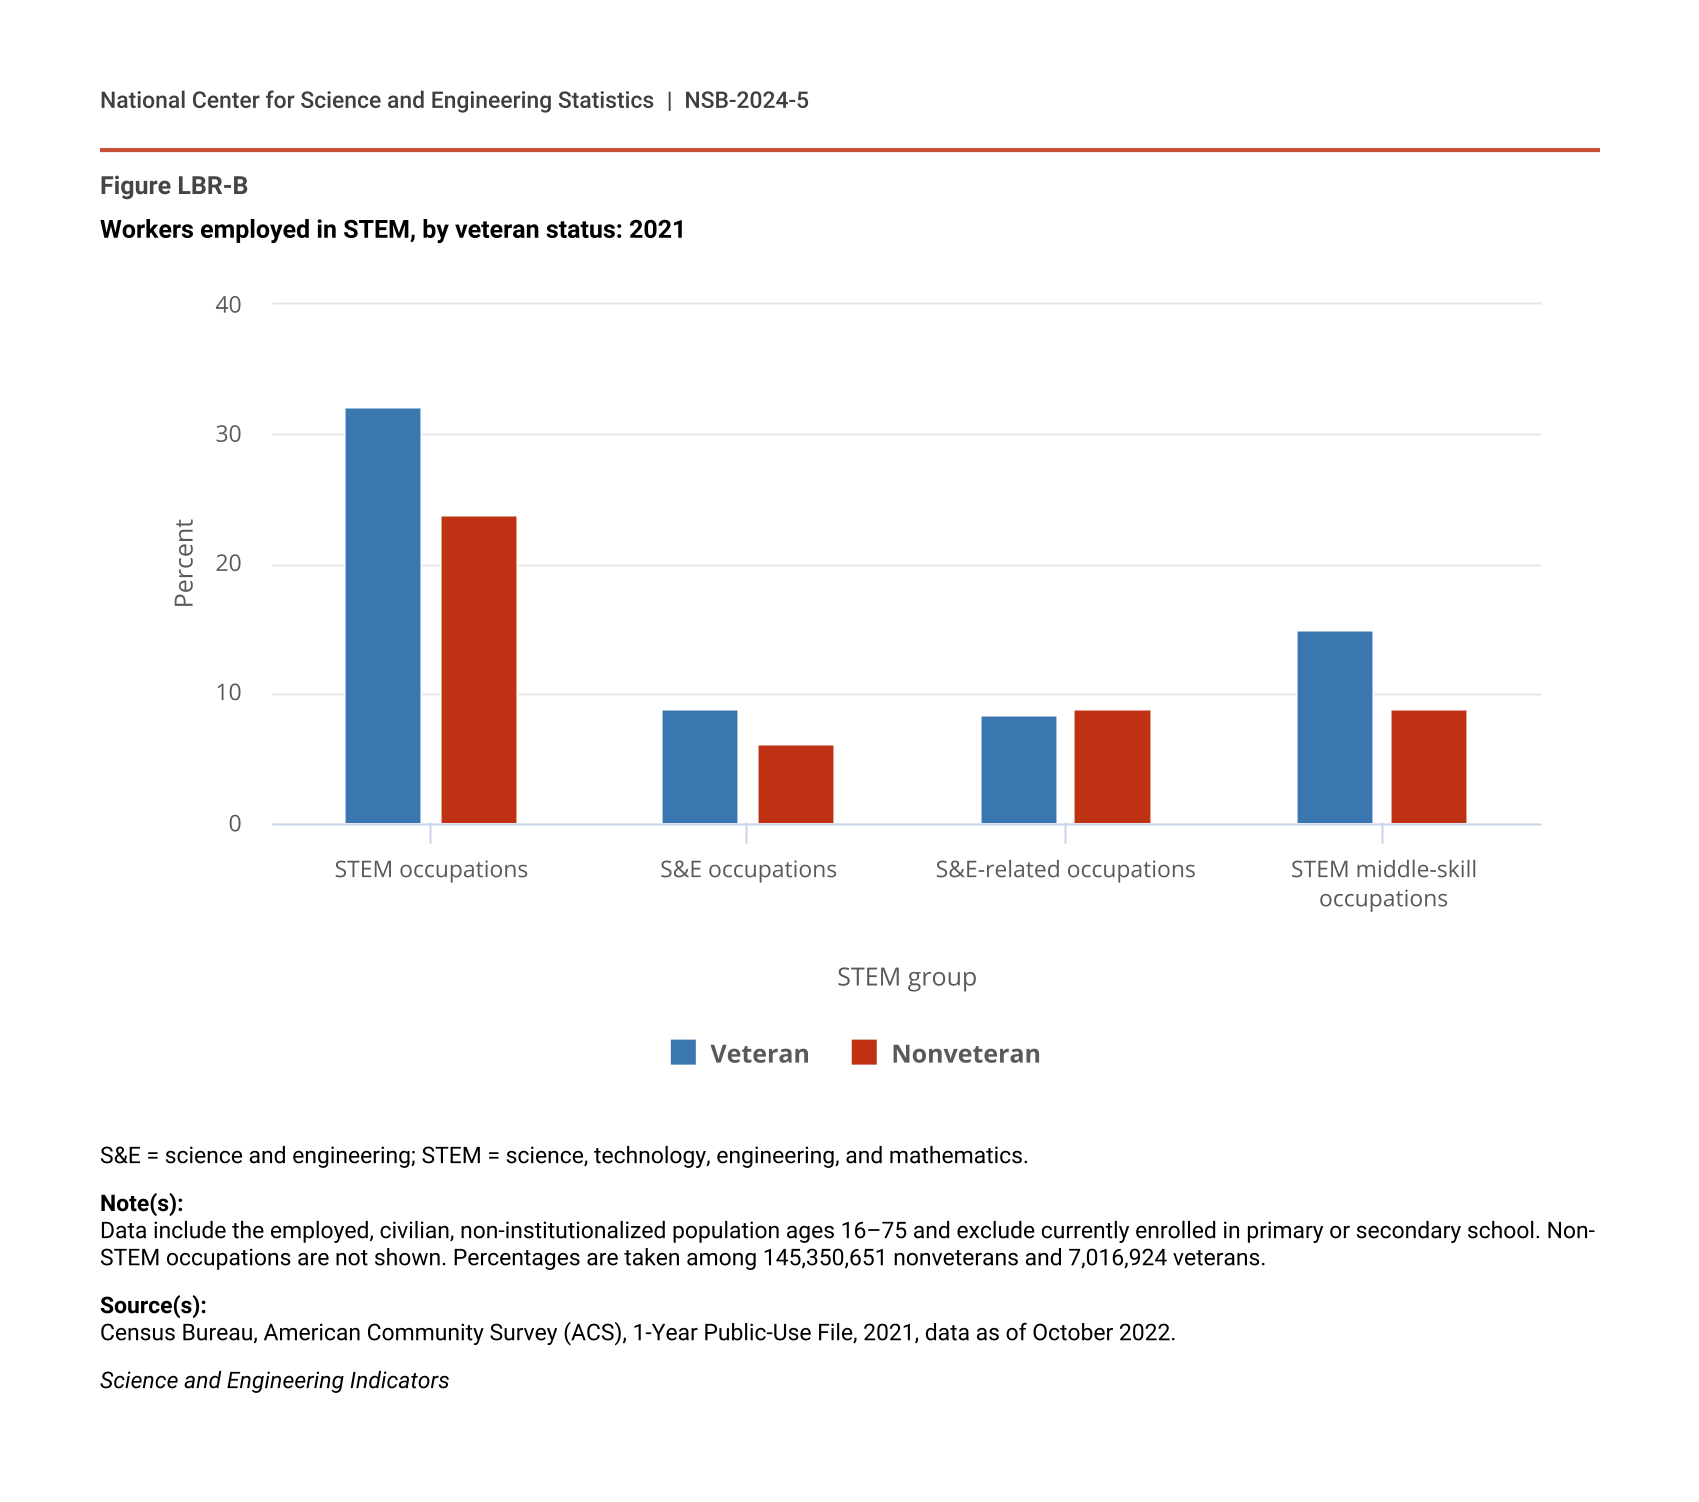
Indicators of labor market conditions, such as salaries, provide information on economic rewards and the overall attractiveness of STEM careers. In addition, details on where STEM jobs are located and what jobs are identified as STEM provide information on the breadth of STEM skills across the economy and what areas utilize STEM talent the most. The sidebar Veterans in STEM highlights the presence of veterans in STEM occupations.
Earnings of STEM Workers
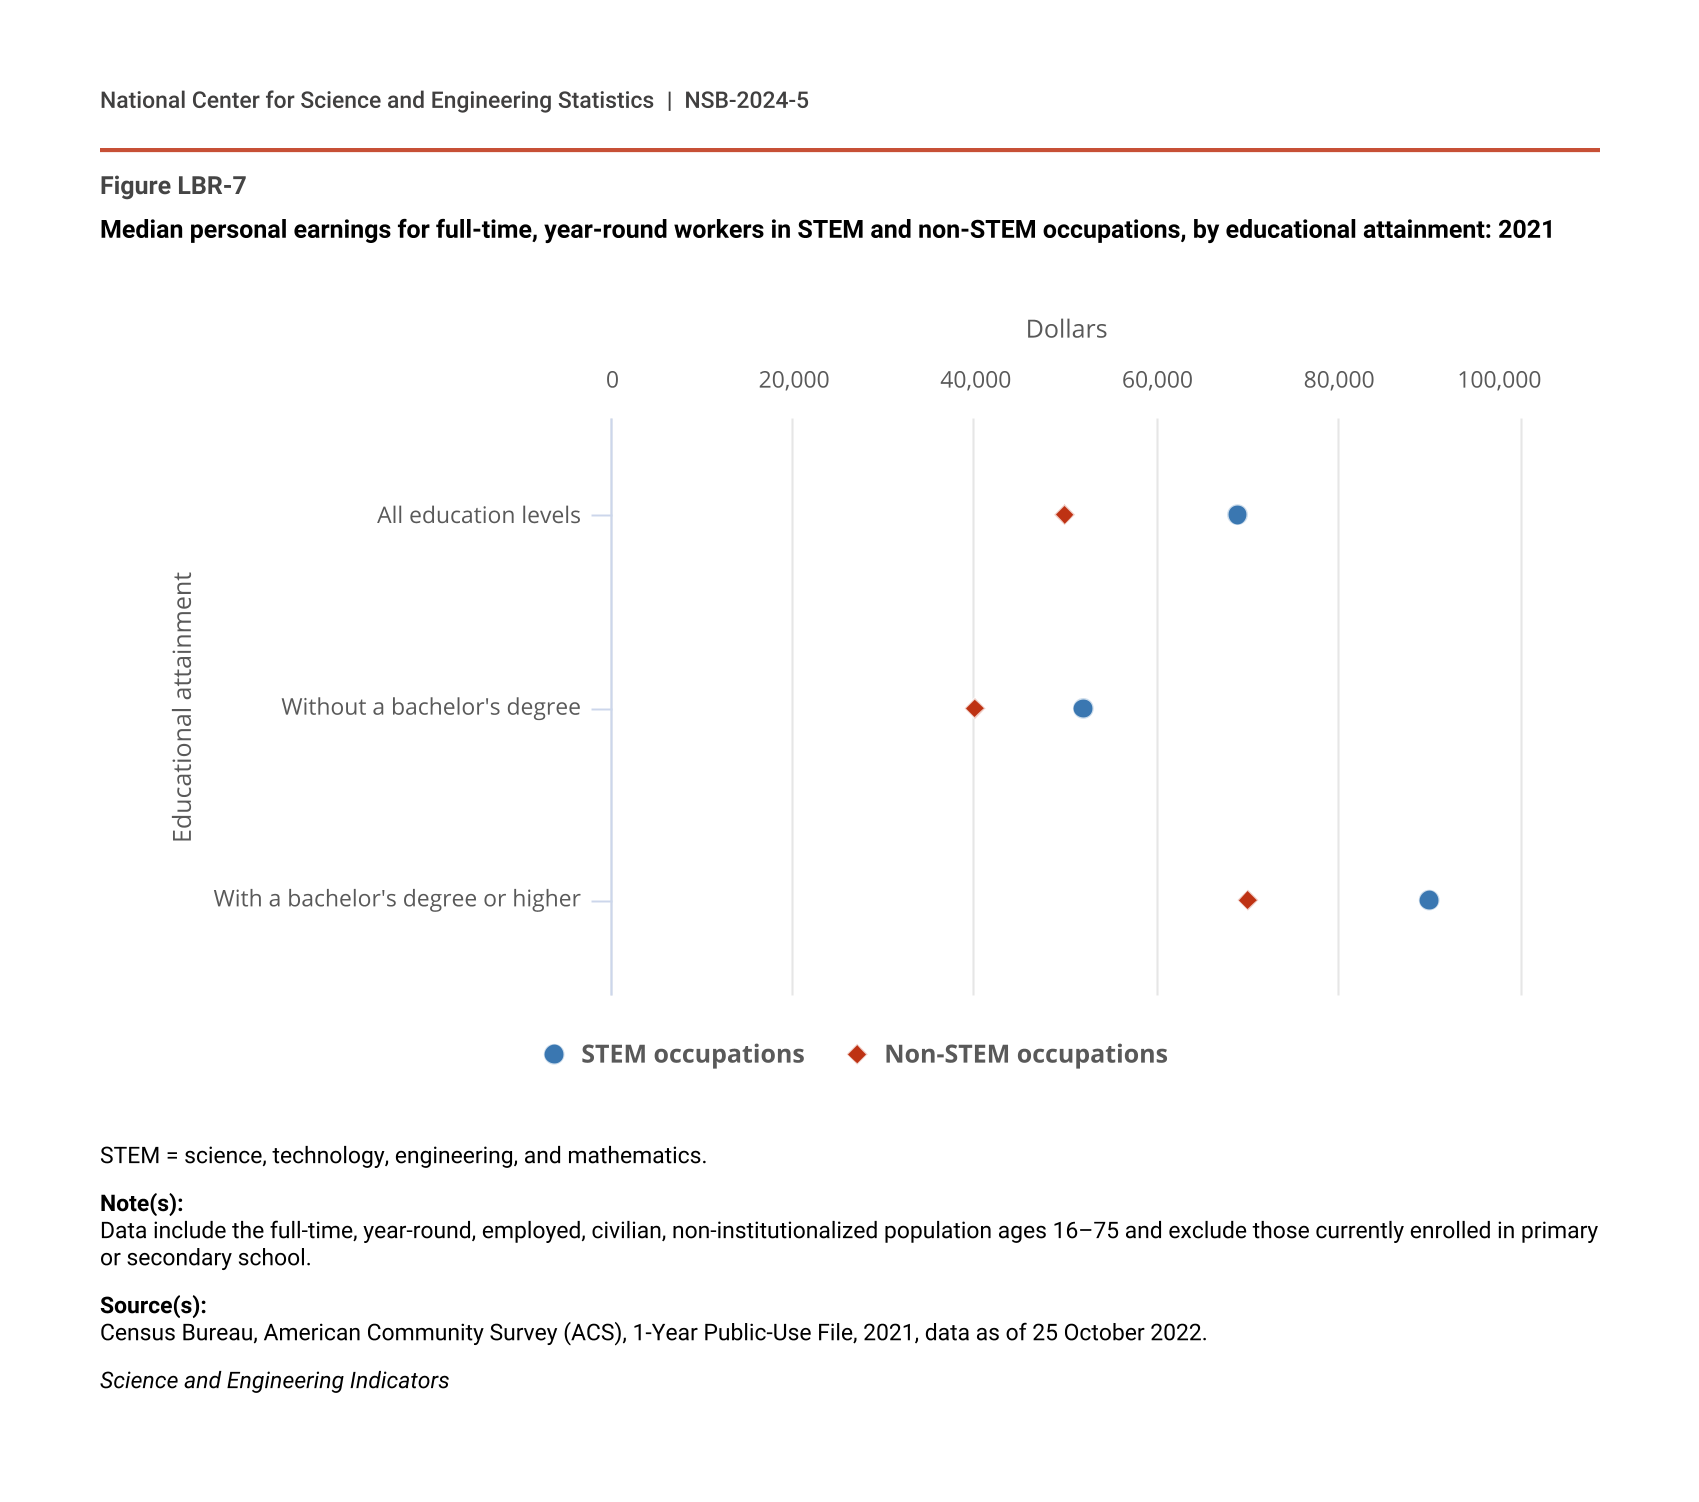
Employment in a STEM occupation provides workers, on average, a wage premium. In 2021, median earnings for full-time, year-round STEM workers ($69,000) were $19,100 more than for non-STEM workers ($49,900) (Figure LBR-7). Full-time, year-round workers in both S&E and S&E-related occupations also earned significantly more than workers in non-STEM occupations. The greatest difference in median earnings ($40,700) was between S&E workers and non-STEM workers; median earnings among S&E-related workers was $23,000 more than non-STEM workers (Table SLBR-11).
Median personal earnings for full-time, year-round workers in STEM and non-STEM occupations, by educational attainment: 2021
| Educational attainment | STEM occupations | Non-STEM occupations |
|---|---|---|
| All education levels | 68,976 | 49,903 |
| Without a bachelor's degree | 51,925 | 39,957 |
| With a bachelor's degree or higher | 89,931 | 69,968 |
STEM = science, technology, engineering, and mathematics.
Note(s):
Data include the full-time, year-round, employed, civilian, non-institutionalized population ages 16–75 and exclude those currently enrolled in primary or secondary school.
Source(s):
Census Bureau, American Community Survey (ACS), 1-Year Public-Use File, 2021, data as of 25 October 2022.
Science and Engineering Indicators
A similar median wage premium holds true for comparisons of full-time, year-round workers within each component of the STEM workforce. S&E and S&E-related workers in the STW ($71,800 and $54,500, respectively) had higher median earnings than non-STEM workers without a bachelor’s degree ($40,000). The median earnings among STEM middle-skill workers in the STW ($50,000) were about $10,000 more than non-STEM workers without a bachelor’s degree. However, STEM middle-skill workers with a bachelor’s degree or higher ($64,900) had lower median earnings than non-STEM workers with a bachelor’s degree or higher ($70,000).
While full-time, year-round workers in STEM occupations had higher median earnings than those in non-STEM occupations, certain STEM occupations provided higher median earnings than others. Occupations that rank among the top 10 and bottom 10 in median earnings for full-time, year-round workers highlight the most and least financially beneficial occupations within each occupation group (Table SLBR-12, Table SLBR-13). The range of median earnings for full-time, year-round workers varied greatly, with S&E-related occupations having the greatest span in median earnings, ranging from $452,300 (surgeons) to $30,000 (dietetic technicians and ophthalmic medical technicians). Although many S&E-related occupations belong to the health care fields, 3 of the top 10 paid occupations were outside of health care: architectural and engineering managers ($147,400), actuaries ($126,300), and computer and information systems managers ($119,600). Notably, 5 of the highest paid S&E-related occupations had higher median earnings than all of the highest paying S&E occupations.
STEM middle-skill occupations had the narrowest range in median earnings for full-time, year-round workers, from $84,400 (industrial production managers) to $35,800 (butchers and other meat, poultry, and fish processing workers). Two of the lowest paid S&E-related occupations (veterinary technologists and technicians and dietetic technicians and ophthalmic medical technicians) made less than the lowest paid STEM middle-skill occupations. Overall, the lowest paying S&E occupations had higher median earnings than the lowest paying S&E-related and STEM middle-skill occupations.
Earnings Differences, by Select Demographics
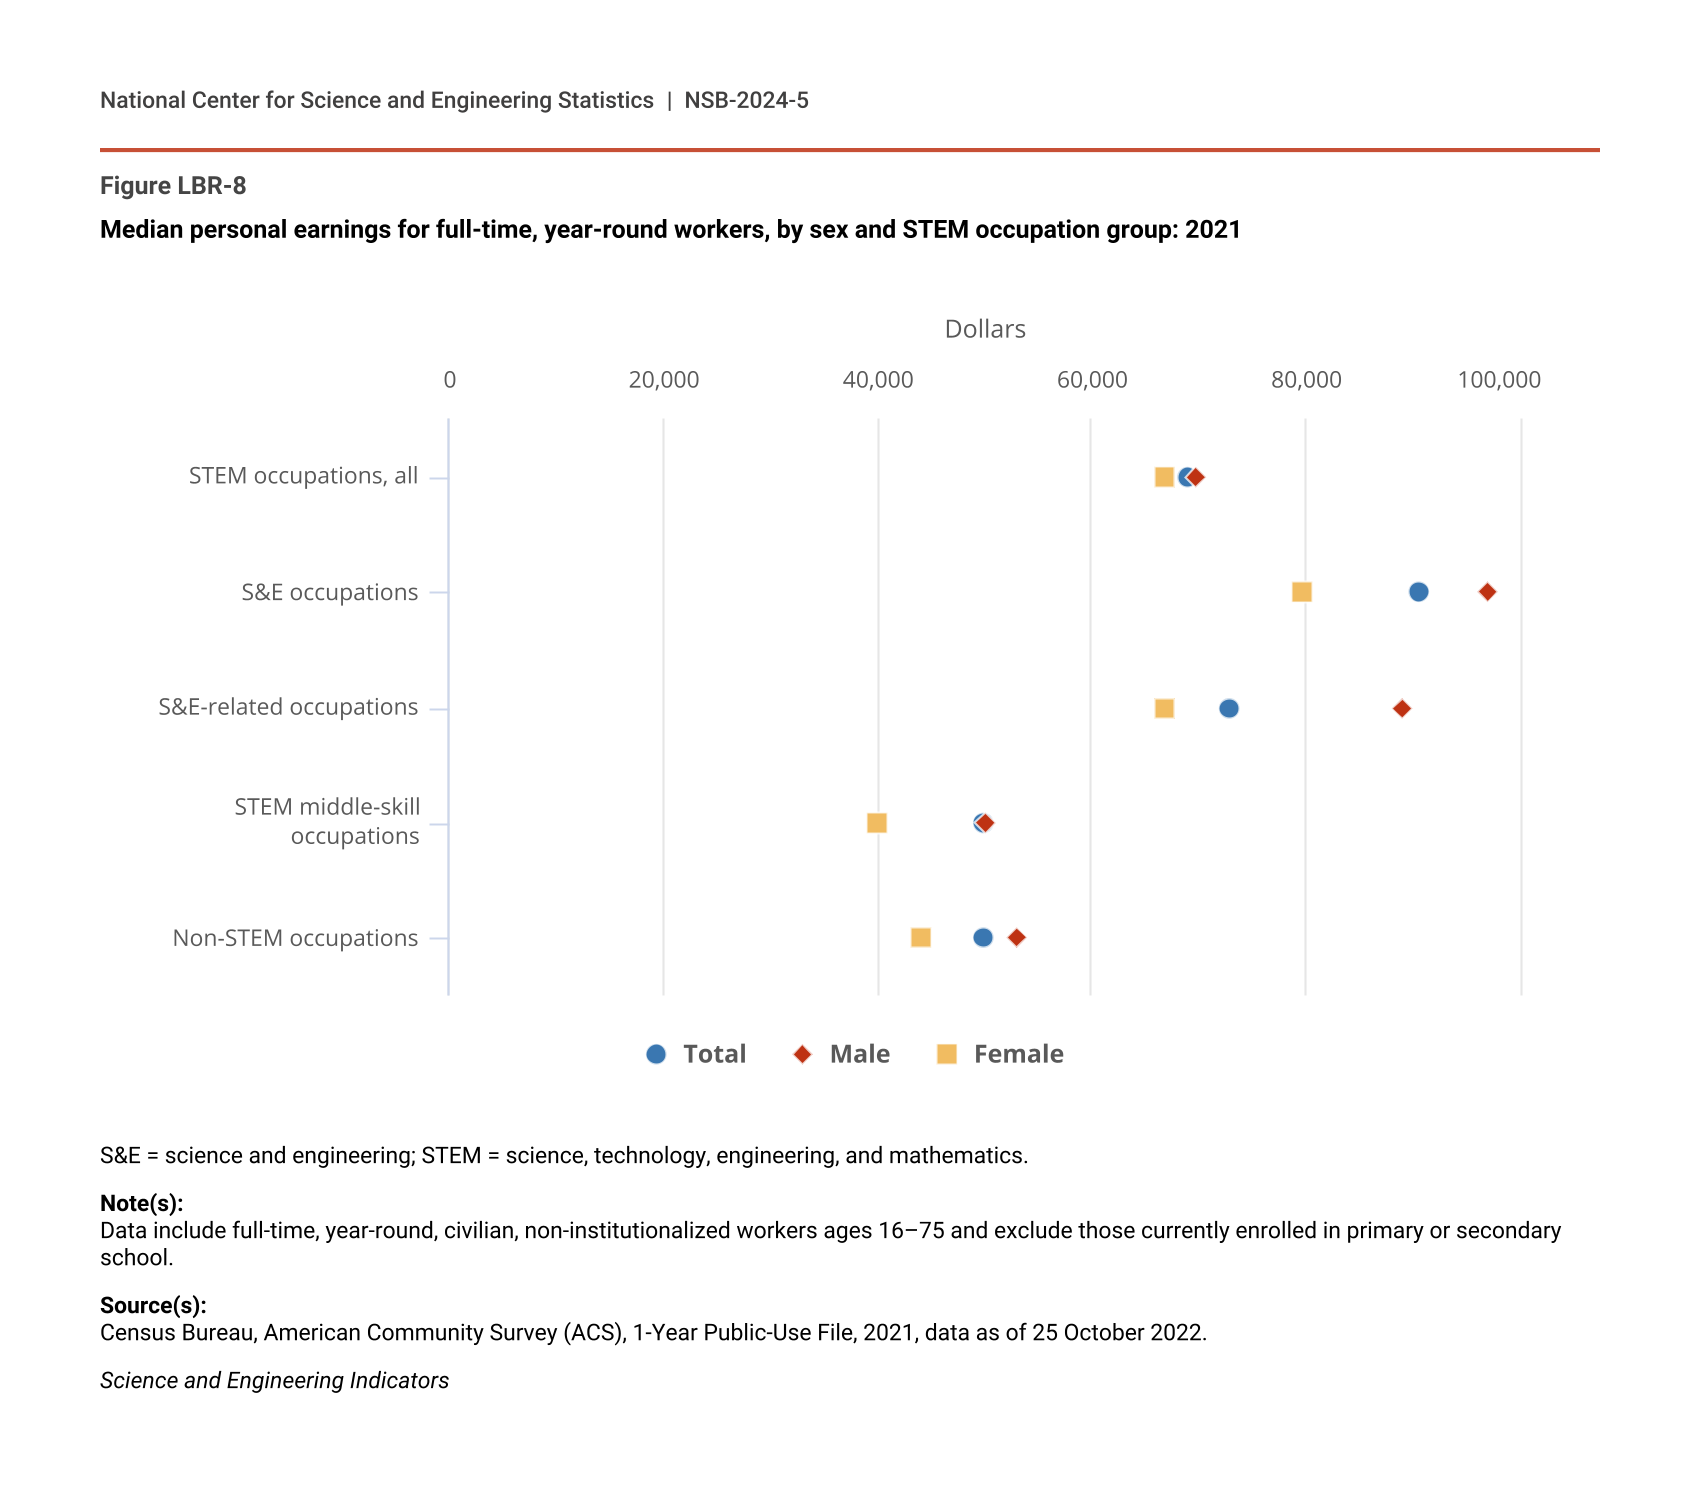
In 2021, men’s median earnings ($69,800) were more than women’s ($66,800) among full-time year-round workers in STEM occupations. The disparity was lower in STEM occupations than it was in non-STEM occupations, where men’s median earnings were about $9,000 more than women’s annually among full-time, year-round workers (Figure LBR-8).
Median personal earnings for full-time, year-round workers, by sex and STEM occupation group: 2021
| STEM group | Total | Male | Female |
|---|---|---|---|
| STEM occupations, all | 68,976 | 69,841 | 66,813 |
| S&E occupations | 90,635 | 96,941 | 79,696 |
| S&E-related occupations | 72,949 | 88,970 | 66,848 |
| STEM middle-skill occupations | 49,999 | 50,000 | 39,933 |
| Non-STEM occupations | 49,903 | 52,995 | 43,971 |
S&E = science and engineering; STEM = science, technology, engineering, and mathematics.
Note(s):
Data include full-time, year-round, civilian, non-institutionalized workers ages 16–75 and exclude those currently enrolled in primary or secondary school.
Source(s):
Census Bureau, American Community Survey (ACS), 1-Year Public-Use File, 2021, data as of 25 October 2022.
Science and Engineering Indicators
Earnings differences of full-time, year-round workers between men and women occurred within occupations as well. The largest percentage of STEM workers (9%) were registered nurses, in which men’s median earnings were $7,100 higher than women’s (Table SLBR-1, Table SLBR-14). Other STEM occupations with large pay disparities between the median earnings of men and women included computer and information systems managers ($17,200 higher among men), medical and health services managers ($15,400 higher among men), general maintenance and repair workers ($14,100 higher among men), and software developers ($13,800 higher among men).
Men earned more than women in four of the top-paying S&E occupations. Economists were among the S&E occupations with the highest median earnings for full-time, year-round workers ($131,800), with median earnings of male economists about $38,300 more per year (about 35% more) than female economists (Table SLBR-12). About six of the selected S&E-related and five of the selected STEM middle-skill occupations also had earnings disparities by sex among the top-paying occupations, though not among those with the highest median earnings in each group.
Regardless of race or ethnicity, full-time, year-round workers in STEM occupations had higher median earnings than those in non-STEM occupations. However, earnings disparities existed among full-time, year-round STEM workers between the race and ethnicity groups. Asian STEM workers had the highest median earnings ($98,600) of all the racial and ethnic groups (Table SLBR-15). Hispanic and American Indian or Alaska Native STEM workers had the lowest median earnings among the racial and ethnic groups ($50,000 and $51,600, respectively). Full-time, year-round workers in S&E and S&E-related occupations had higher median earnings than those in non-STEM occupations across race and ethnicity groups. Asian workers had the highest median earnings in both S&E ($107,900) and S&E-related ($95,700) occupations. American Indian or Alaska Native workers had the lowest median earnings in S&E occupations ($67,500), and American Indian or Alaska Native ($58,800), Black or African American ($59,800), and Hispanic workers ($62,500) had the lowest median earnings in S&E-related occupations.
Among the five occupations that employ the most STEM workers (Table SLBR-1, Table SLBR-16), Black and Hispanic registered nurses ($69,400 and $69,500, respectively) had comparable median earnings to their White counterparts ($69,900) among full-time, year-round workers, while Asian registered nurses had the highest median earnings ($85,900) among the race groups, and American Indian or Alaska Native registered nurses had the lowest median earnings ($59,200). In contrast, among software developers, Black and Hispanic full-time, year-round workers ($99,100 and $99,600, respectively) had lower median earnings than their White and Asian counterparts ($114,900 and $125,000, respectively).
While comparisons of median earnings did not take into account all the factors that could impact earnings differences in the above analyses, the data can inform additional research. Additional analyses of earnings by sex, race, or ethnicity can be found in the Diversity and STEM: Women, Minorities, and Persons with Disabilities 2023 report, which utilized the Current Population Survey for its analyses.
STEM Occupations
In 2021, the most common STEM occupation by employees was registered nurses, representing 9% of the total STEM workforce, followed by software developers (5%) and miscellaneous production workers (4%) (Table SLBR-1). Each of these occupations was also the most common among their respective STEM occupation group. Registered nurses were 25% of all S&E-related occupations, software developers were 20% of all S&E occupations, and miscellaneous production workers were 9% of all STEM middle-skill occupations.
Industries That Utilize STEM Workers
While STEM workers were distributed across multiple industries in the United States, some industries had higher concentrations of STEM workers than others. STEM industries can be loosely categorized as industries in which the proportion of STEM workers is at least 2.5 times the national rate. Based on this definition and on categorizing STEM occupations individually, 75 industries were identified as a STEM industry; together, they accounted for 68% of all STEM workers in the United States in 2021. Across STEM occupation groups, 21 industries had a high concentration of S&E workers, 11 had a high concentration of S&E-related workers, and 43 had a high concentration of STEM middle-skill workers (Table SLBR-20).
In 2021, the industries with the highest concentration of STEM workers were electronic and precision equipment repair and maintenance, with 75% of its workforce in STEM occupations, and offices of other health practitioners, with 72% of its workforce classified as STEM (Table SLBR-20). Computer systems design and related services had the highest percentage of workers in S&E occupations (51%), general medical and surgical hospitals had 61% of workers in S&E-related occupations, and electronic and precision equipment repair and maintenance had 61% of workers in STEM middle-skill occupations.