 An official website of the United States government
 STEM Pathways: Degree Attainment and Training of Workers in STEM
For over a decade, there has been an effort to expand both the size and diversity of the STEM workforce (NASEM 2017; NSTC 2018, 2021; NSB 2019). Given that many STEM occupations require specialized training and or education, one aspect of this effort to grow the STEM workforce has been a focus on the education of future STEM workers (NSB 2020; NSF 2020; NSTC 2021). Although educational interests and graduation rates among S&E and S&E-related degree fields are important discussions, this thematic report focuses on the educational attainment of workers in STEM occupations. For a detailed discussion of educational pathways, see the Indicators 2024 report “Higher Education in Science and Engineering” and the Indicators 2024 report “Elementary and Secondary STEM Education.”
Educational Attainment of STEM Workers
Workers in STEM occupations have diverse educational backgrounds. In 2021, the largest proportion of STEM workers had not earned a bachelor’s degree. Specifically, 24% of STEM workers had not attended any college, 17% had attended some college but not earned a degree, 12% held an associate’s degree, 28% a bachelor’s degree, and 20% an advanced degree (master’s or higher degree) (Table SLBR-23).
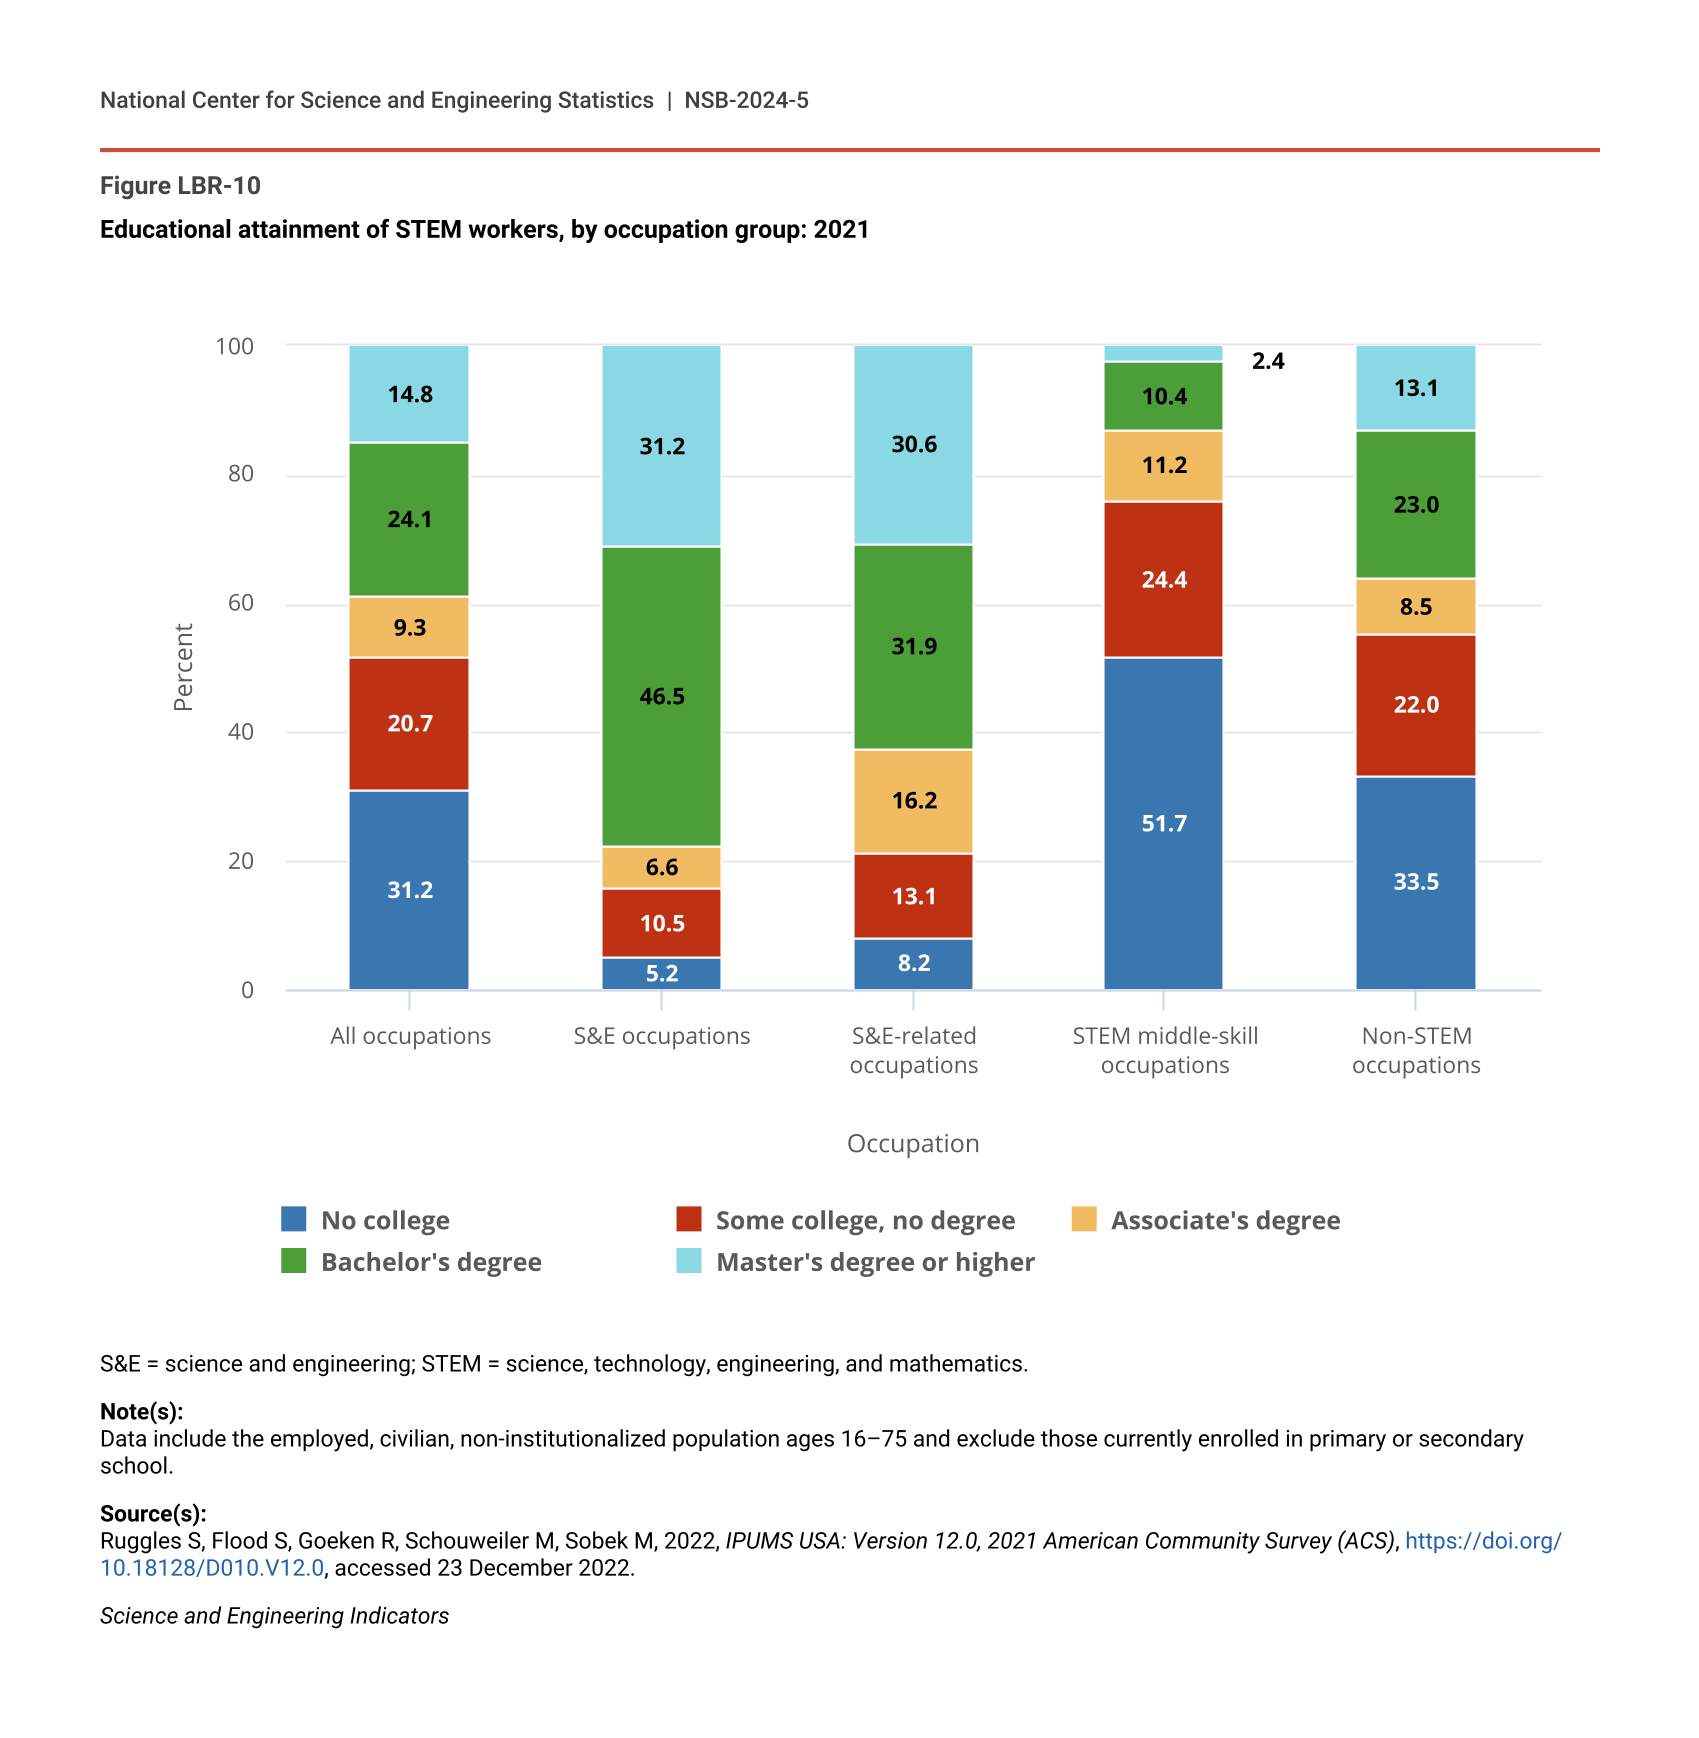
Across the different STEM occupation groups, the level of educational attainment varies greatly. Larger proportions of workers in S&E occupations had a bachelor’s degree (47%) than in S&E-related occupations (32%) (Figure LBR-10). Among workers in STEM middle-skill occupations, the majority of workers had not attended college (52%). In addition, among STEM middle-skill workers, a larger proportion had some college and no degree (24%) than held an associate’s degree (11%). This diversity in education within and across the STEM occupation categories highlights the multiple pathways for workers to find jobs that fit their skills and interests—many workers may not need a college degree or an advanced degree to work in STEM.
Educational attainment of STEM workers, by occupation group: 2021
| Occupation | No college | Some college, no degree | Associate's degree | Bachelor's degree | Master's degree or higher |
|---|---|---|---|---|---|
| All occupations | 31.2 | 20.7 | 9.3 | 24.1 | 14.8 |
| S&E occupations | 5.2 | 10.5 | 6.6 | 46.5 | 31.2 |
| S&E-related occupations | 8.2 | 13.1 | 16.2 | 31.9 | 30.6 |
| STEM middle-skill occupations | 51.7 | 24.4 | 11.2 | 10.4 | 2.4 |
| Non-STEM occupations | 33.5 | 22.0 | 8.5 | 23.0 | 13.1 |
S&E = science and engineering; STEM = science, technology, engineering, and mathematics.
Note(s):
Data include the employed, civilian, non-institutionalized population ages 16–75 and exclude those currently enrolled in primary or secondary school.
Source(s):
Ruggles S, Flood S, Goeken R, Schouweiler M, Sobek M, 2022, IPUMS USA: Version 12.0, 2021 American Community Survey (ACS), https://doi.org/10.18128/D010.V12.0, accessed 23 December 2022.
Science and Engineering Indicators
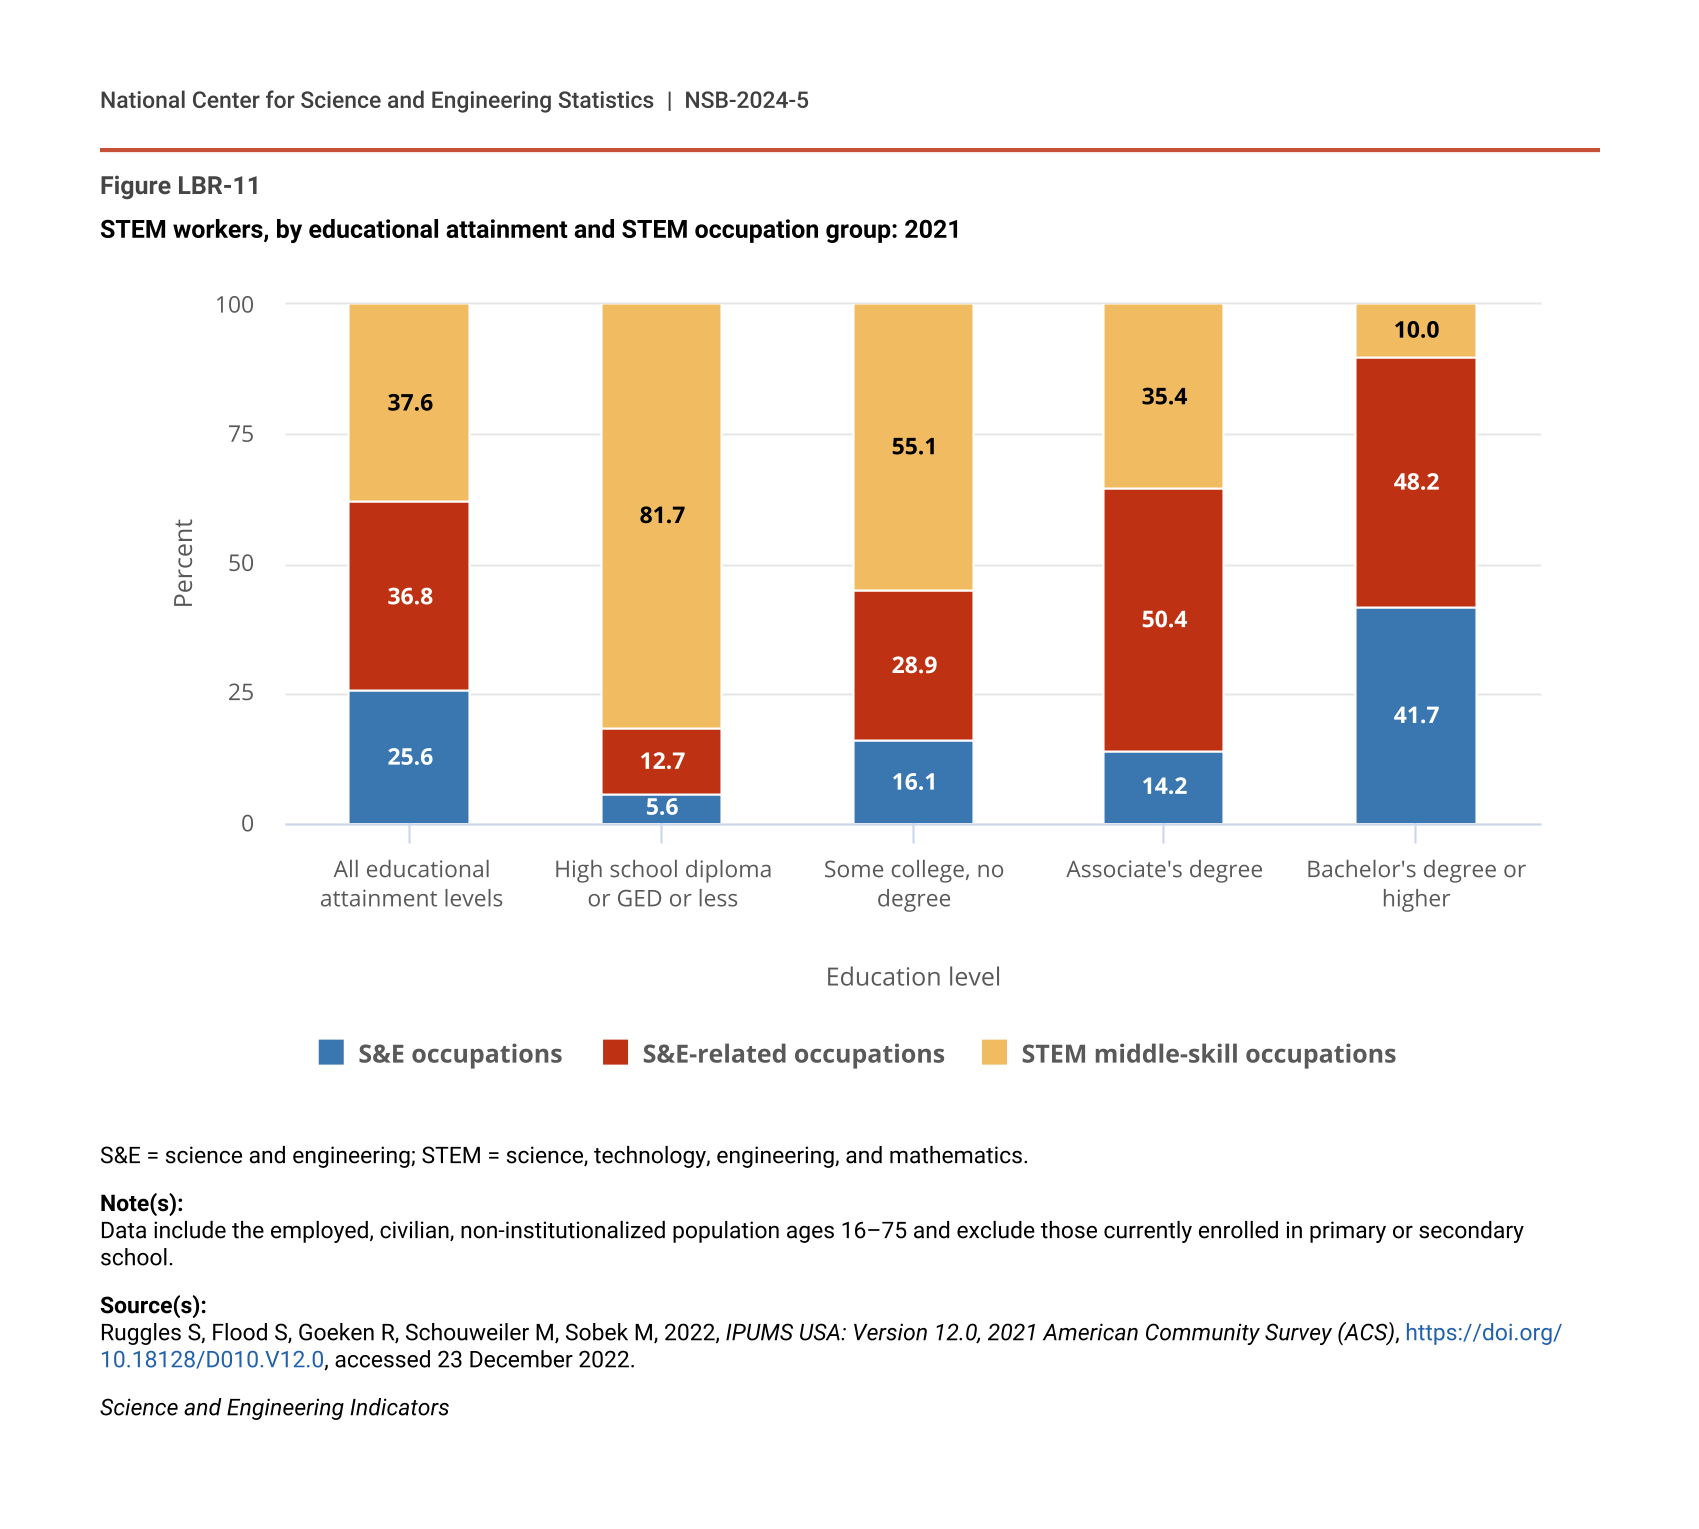
The distribution of STEM workers across the types of STEM occupations varies by the level of educational attainment of the STEM workers. Overall, 26% of STEM workers were in S&E occupations, 37% were in S&E-related occupations, and 38% were in STEM middle-skill occupations (Figure LBR-11). Looking at this by educational attainment, among STEM workers with a high school diploma or less, 82% were employed in STEM middle-skill occupations, which was a larger proportion than those who attended college but did not earn a degree (55%) or who held an associate’s degree (35%) (Figure LBR-11; Table SLBR-23). Half of associate’s degree holders and 48% of those with a bachelor’s degree or higher worked in S&E-related occupations. In contrast, 29% of those with some college and 13% of those with a high school diploma or less worked in S&E-related occupations.
STEM workers, by educational attainment and STEM occupation group: 2021
| Education level | S&E occupations | S&E-related occupations | STEM middle-skill occupations |
|---|---|---|---|
| All educational attainment levels | 25.6 | 36.8 | 37.6 |
| High school diploma or GED or less | 5.6 | 12.7 | 81.7 |
| Some college, no degree | 16.1 | 28.9 | 55.1 |
| Associate's degree | 14.2 | 50.4 | 35.4 |
| Bachelor's degree or higher | 41.7 | 48.2 | 10.0 |
S&E = science and engineering; STEM = science, technology, engineering, and mathematics.
Note(s):
Data include the employed, civilian, non-institutionalized population ages 16–75 and exclude those currently enrolled in primary or secondary school.
Source(s):
Ruggles S, Flood S, Goeken R, Schouweiler M, Sobek M, 2022, IPUMS USA: Version 12.0, 2021 American Community Survey (ACS), https://doi.org/10.18128/D010.V12.0, accessed 23 December 2022.
Science and Engineering Indicators
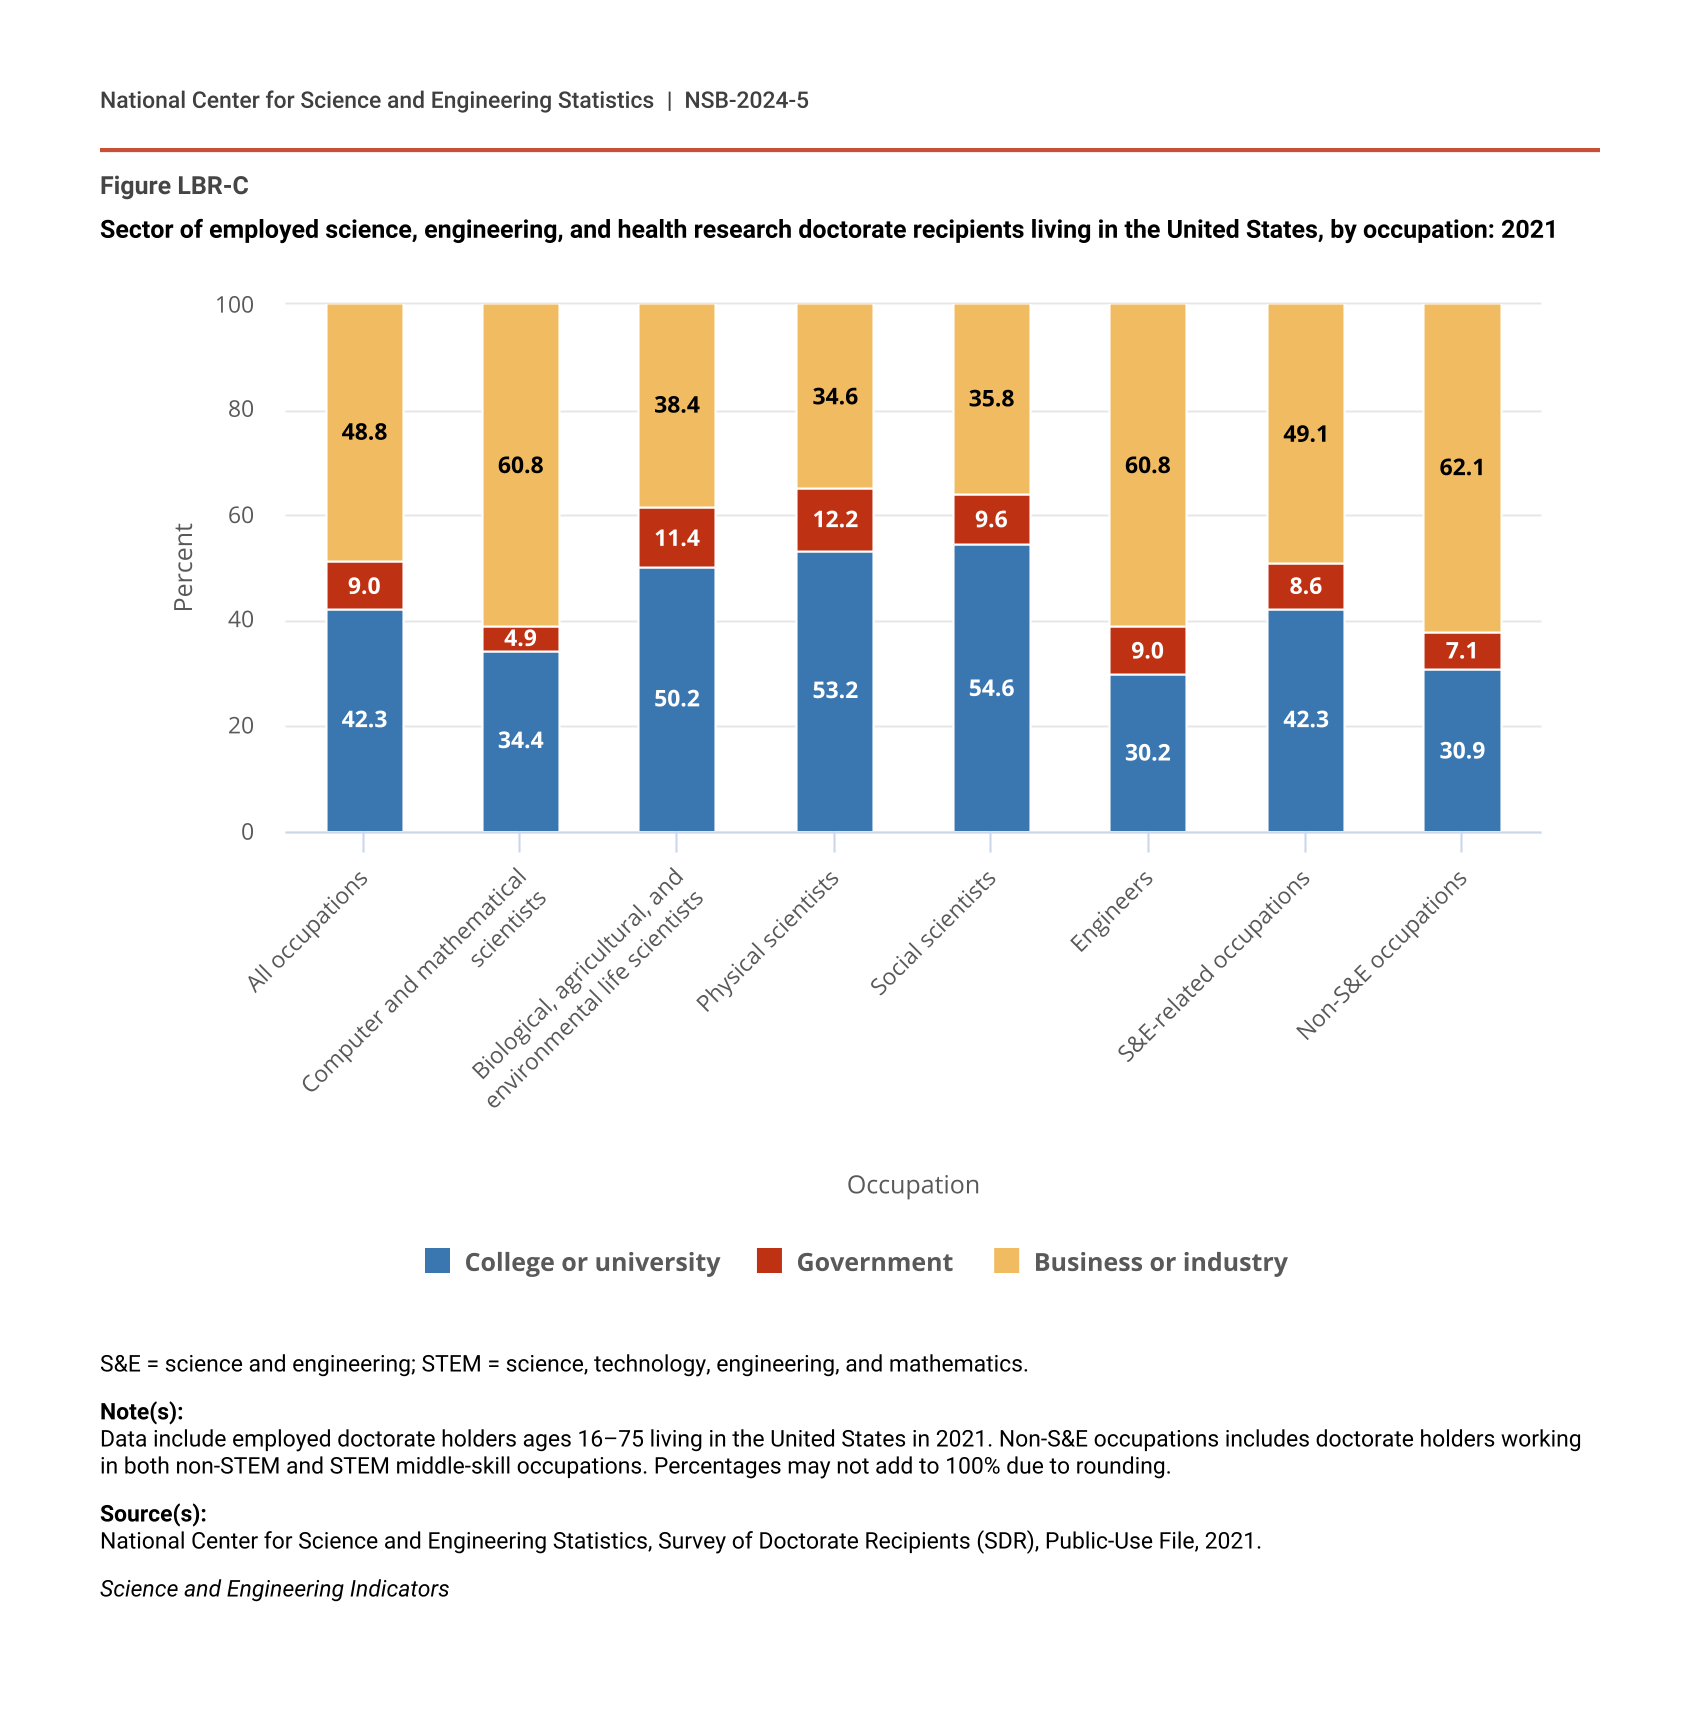
Among those with a bachelor’s degree or higher, a majority of workers in S&E occupations had their highest degree in an S&E field, while a majority of workers in S&E-related occupations had their highest degree in an S&E-related field, according to the NSCG (Table LBR-2). Over 75% of S&E workers with a bachelor’s degree or higher earned their highest degree in an S&E field, and an additional 5% earned their highest degree in an S&E-related field. Of workers in S&E occupations, 5% held an S&E or S&E-related degree that was not their highest degree, with only 13% of workers in S&E occupations without any degree in an S&E or S&E-related field. Across S&E occupations, the percentage of workers with their highest degree in an S&E field varied from 92% of workers (physical science occupations) to about 70% (computer science and social science occupations). The sidebar Science, Engineering, and Health Doctorate Holders in STEM Occupations provides information specifically about doctorate holders in STEM. For more information on college graduates in the S&E or S&E-related labor force, see NCSES (2022a).
Educational background of employed adults with a bachelor's degree or higher, by major occupation: 2021
S&E = science and engineering; STEM = science, technology, engineering, and mathematics.
Note(s):
Data include the employed, civilian, non-institutionalized population ages 16–75. Workers in non-S&E occupations include those with a bachelor's degree or higher employed non-STEM and STEM middle-skill occupations. Numbers are rounded to the nearest 100. Numbers may not sum due to rounding. Percentages may not sum to 100% because of rounding.
Source(s):
National Center for Science and Engineering Statistics, National Survey of College Graduates (NSCG), Public-Use File, 2021.
Science and Engineering Indicators
Certifications and Licenses
One pathway into STEM occupations is by obtaining educational or professional certificates or by obtaining certifications or licenses to perform certain occupations. These work credentials can signal proficiency in occupation fields and serve as a demonstration of the skills needed to perform a certain job (BLS 2019). Holding work credentials is also associated with higher earnings in the labor market, especially among workers without a bachelor’s degree or higher (Kominski and Ewert 2014).
There are three main types of work credentials: educational certificates, professional certifications, and licenses. Educational certificates are typically awarded by an educational institution, such as a community college, and indicate the completion of a program of study. Professional certifications indicate that the worker possesses certain skills, abilities, or specializations and are awarded by independent organizations that are often associated with a particular industry or profession (Finamore and Foley 2017; Kominski and Ewert 2014; BLS n.d.). Licenses are issued by a government agency and convey a legal authority to perform an occupation (BLS 2019). Workers with and without a bachelor’s degree can have work credentials, and some occupations require at least a bachelor’s degree in addition to a credential in order to qualify for the work (BLS n.d.). For example, in 2022, 98% of nurse practitioners require at least a master’s degree and 93% require a license (BLS Occupational Requirements Survey 2022).
Data from the 2021 Survey of Income and Program Participation (SIPP) was used to analyze the distribution of credentials among STEM workers. The 2021 SIPP allows analysis of all three types of credentials available to workers in STEM occupations—licenses, educational certificates, and professional certifications. The SIPP is a retrospective survey, and the 2021 data use 2020 as the reference year for monthly data collection. Estimates below are presented from month 12 of the reference year among respondents ages 16–75 years that had at least a high school diploma or GED.
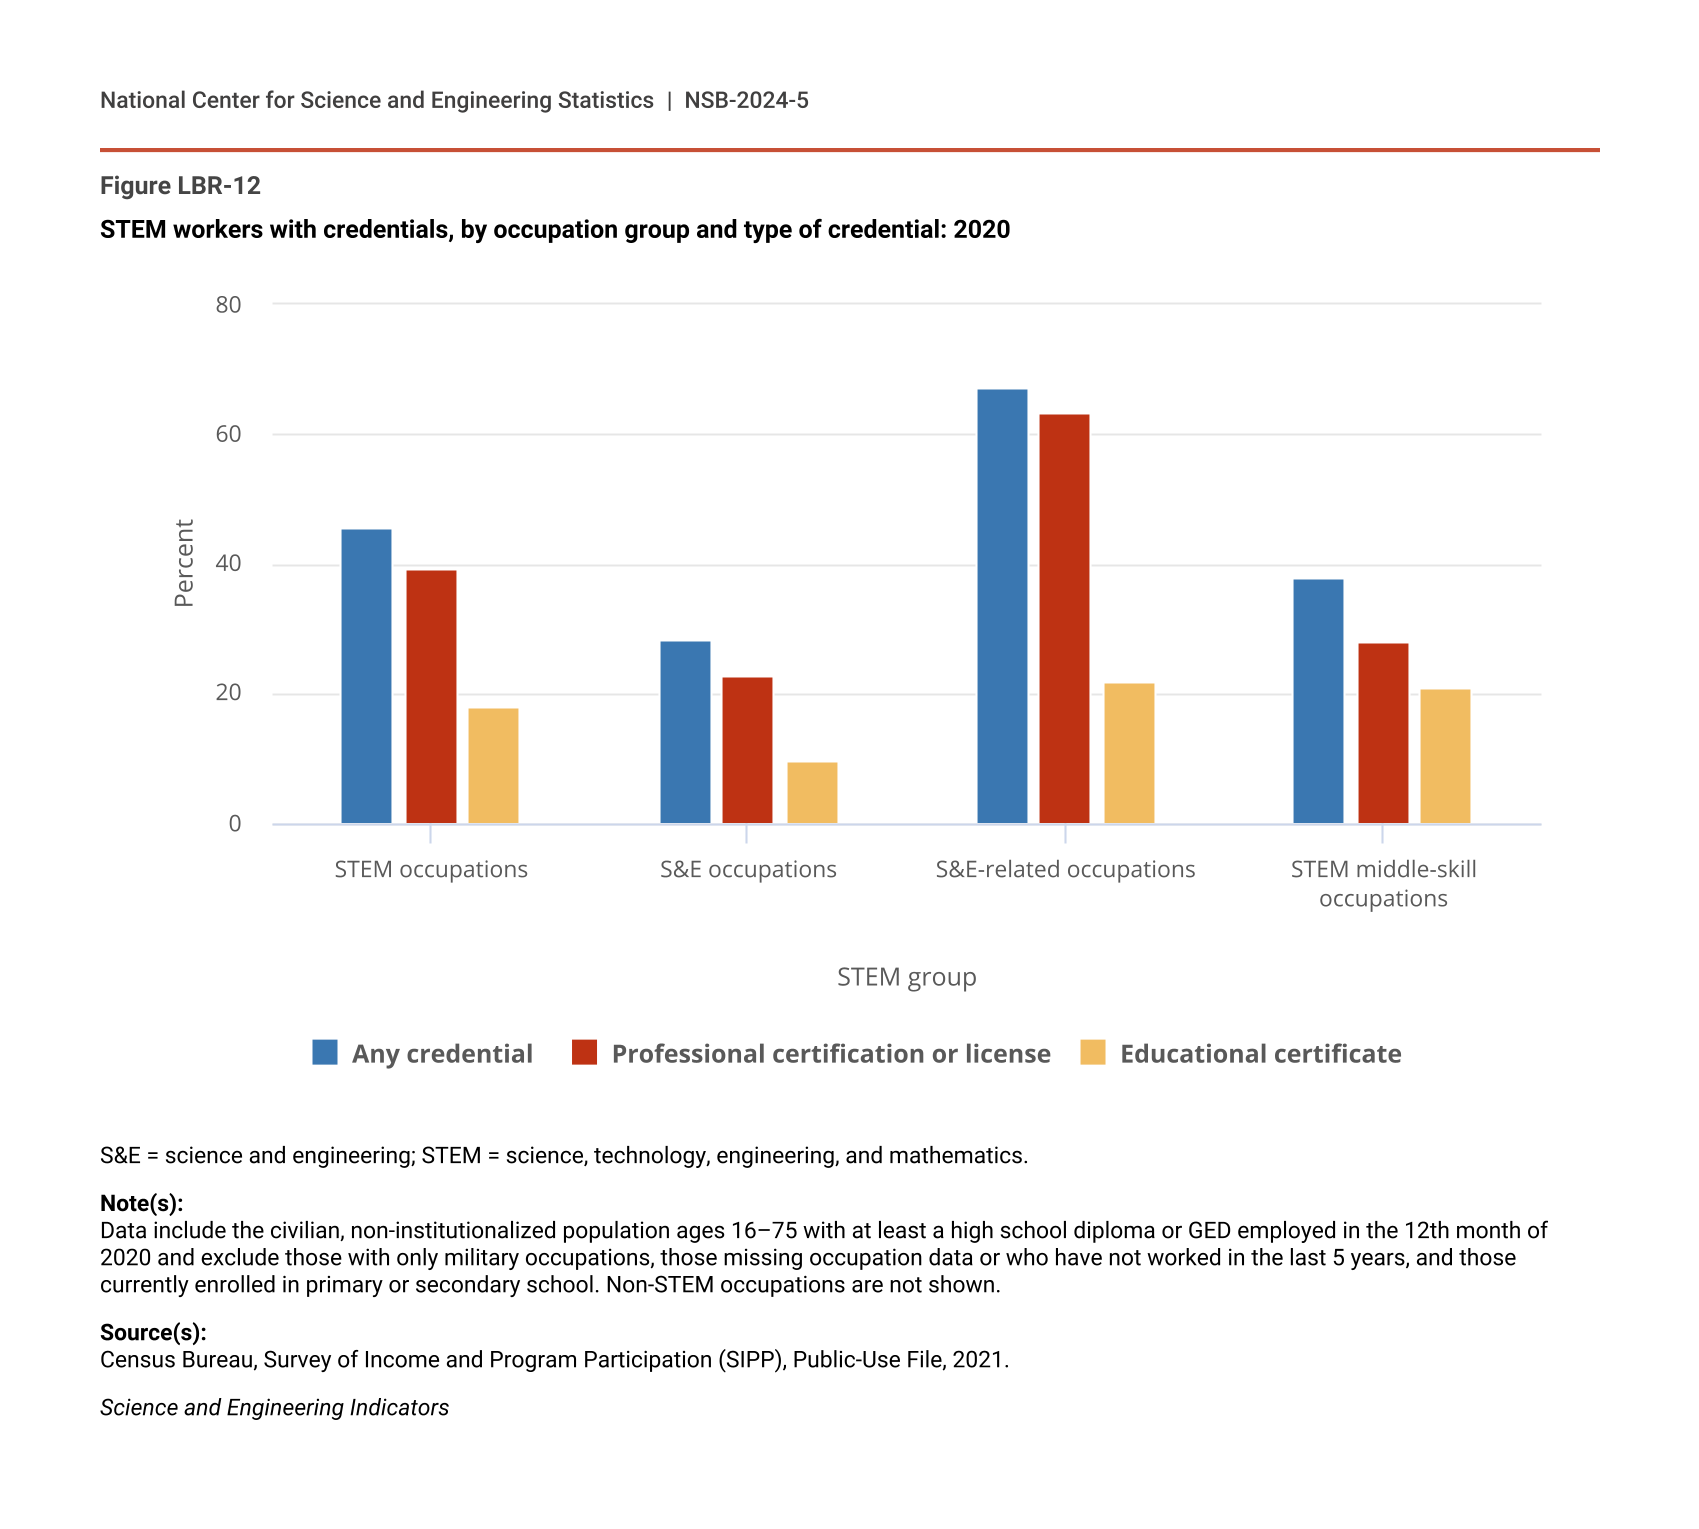
In 2020, about 46% of all STEM workers held a professional certification, license, or educational certificate (Figure LBR-12; Table SLBR-24). The proportion with work credentials varied by type of STEM worker, ranging from 67% among S&E-related workers to 28% among S&E workers. Work credentials were most common among S&E workers (43%) and STEM middle-skill workers (52%) with an associate’s degree, whereas a high prevalence of credentials was present among S&E-related workers with both an associate’s degree (81%) and an advanced degree (79%).
STEM workers with credentials, by occupation group and type of credential: 2020
| STEM group | Any credential | Professional certification or license | Educational certificate |
|---|---|---|---|
| STEM occupations | 45.6 | 39.2 | 17.9 |
| S&E occupations | 28.4 | 22.9 | 9.6 |
| S&E-related occupations | 67.1 | 63.3 | 22.0 |
| STEM middle-skill occupations | 37.8 | 27.8 | 20.9 |
S&E = science and engineering; STEM = science, technology, engineering, and mathematics.
Note(s):
Data include the civilian, non-institutionalized population ages 16–75 with at least a high school diploma or GED employed in the 12th month of 2020 and exclude those with only military occupations, those missing occupation data or who have not worked in the last 5 years, and those currently enrolled in primary or secondary school. Non-STEM occupations are not shown.
Source(s):
Census Bureau, Survey of Income and Program Participation (SIPP), Public-Use File, 2021.
Science and Engineering Indicators
In S&E occupations, workers with professional credentials outnumbered those with educational certificates. Similarly, workers in S&E-related occupations had a higher prevalence of professional credentials compared with educational certificates overall and at all levels of educational attainment. In both S&E and STEM middle-skill occupations, educational certificates were most prevalent among workers with an associate’s degree, while the same was true among S&E-related workers with some college or an associate’s degree. Professional credentials were most common among S&E-related workers with an associate’s degree (74%) or an advanced degree (78%). Neither S&E nor STEM middle-skill occupations had a high prevalence of professional credentials across the different levels of educational attainment.
Employment Outcomes for Recent Graduates
Key participants of the STEM workforce pathway are individuals entering the workforce with S&E and S&E-related postsecondary degrees, particularly those with bachelor’s degrees and higher. According to NSCG data, there were about 7,474,000 individuals who earned their highest degree in an S&E or S&E-related field between January 2015 and February 2021 (Table LBR-3). The data on these recent graduates provide insights on recent S&E and S&E-related graduates in the labor market.
Labor market indicators for S&E and S&E-related degree recipients earning their highest degree between 2015 and 2021, by level and field of highest degree: 2021
na = not applicable; s = suppressed for reasons of confidentiality and/or reliability.
S&E = science and engineering.
Note(s):
Data include the civilian, non-institutionalized population ages 16–75. Data include highest degrees earned between January 2015 and February 2021. The out-of-field rate and involuntarily out-of-field rate are for employed individuals only. The involuntarily out-of-field rate is the proportion of all employed individuals who report that their job is not related to their field of highest degree because a job in their highest degree field was not available. Median annual earnings are rounded to the nearest $1,000. Numbers and percentages may not sum due to rounding.
Source(s):
National Center for Science and Engineering Statistics, National Survey of College Graduates (NSCG), Public-Use File, 2021.
Science and Engineering Indicators
In February 2021, 87% of recent S&E or S&E-related degree recipients were employed with employment rates increasing as educational attainment increased. About 85% of recent S&E or S&E-related bachelor’s degree recipients were employed, compared to 94% of recent doctorate recipients. Recent bachelor’s degree recipients in engineering fields were the only group with an employment rate (92%) higher than the combined employment rate of recent bachelor’s degree recipients across all S&E and S&E-related fields combined. Meanwhile, recent bachelor’s degree recipients in biological, agricultural, and environmental life sciences fields had the lowest employment rate (75%) of recent S&E bachelor’s degree recipients, although employment rates may be depressed by enrollment in graduate education (Henderson et al. 2022; BLS 2023).
When researchers discuss the STEM pipeline, attrition from STEM is one aspect, which includes the individuals who work out of their field of degree (Speer 2023). Based on self-reported data on the relationship between a respondent’s job and their highest degree, 24% of recent S&E bachelor’s degree recipients worked out of field. Larger percentages of recent bachelor’s degree graduates with majors in social sciences (37%), biological, agricultural, and environmental life sciences (32%), and physical sciences majors (22%) worked out of field than those who majored in computer and mathematical sciences (7%), S&E-related fields (9%) and engineering fields (11%) in 2021. Graduates with S&E-related degrees had lower rates of working out of field than S&E fields for all fields and degree levels combined.
Across all S&E and S&E-related degree fields combined, those who recently earned master’s and doctoral degrees in STEM fields worked involuntarily out of field at lower rates than bachelor’s degree holders. Over 12% of workers with bachelor’s degrees in biological, agricultural, and environmental life sciences and in social sciences were involuntarily working out of field.