 An official website of the United States government
 Foreign-Born STEM Workers
S&E fields and the general U.S. economy have long included and benefited from the contributions of foreign-born workers (Abramitzky and Boustan 2017; Kerr and Kerr 2017; Khanna and Lee 2020; Rovito, Kaushik, and Aggarwal 2021). Additionally, NSB’s Vision 2030 report recognizes the importance of the U.S. international STEM talent in maintaining its lead in research and bolstering the workforce of the future (NSB 2020). This section provides an analysis of foreign-born STEM workers, including their demographic composition. It examines the proportion of foreign-born workers in STEM occupations (by degree level) and estimates rates of intentions to stay as well as actual stay rates among U.S.-trained doctoral recipients.
Foreign-born STEM workers are defined as those STEM workers born outside of the United States who were not citizens by birth. In 2021, 17% of all civilian workers (26,546,400 people) and 19% of STEM workers were foreign born (7,023,900 people), according to the ACS (Table SLBR-25). Over a quarter (26%) of foreign-born workers employed in the United States worked in STEM occupations. There are three subsets for the foreign-born population: noncitizens who live in the United States on visas (temporary visa holders), those with permanent resident status (or Green Cards), and foreign-born workers who have become U.S. citizens (naturalized citizens).
Occupations and Geographic Characteristics of Foreign-Born STEM Workers
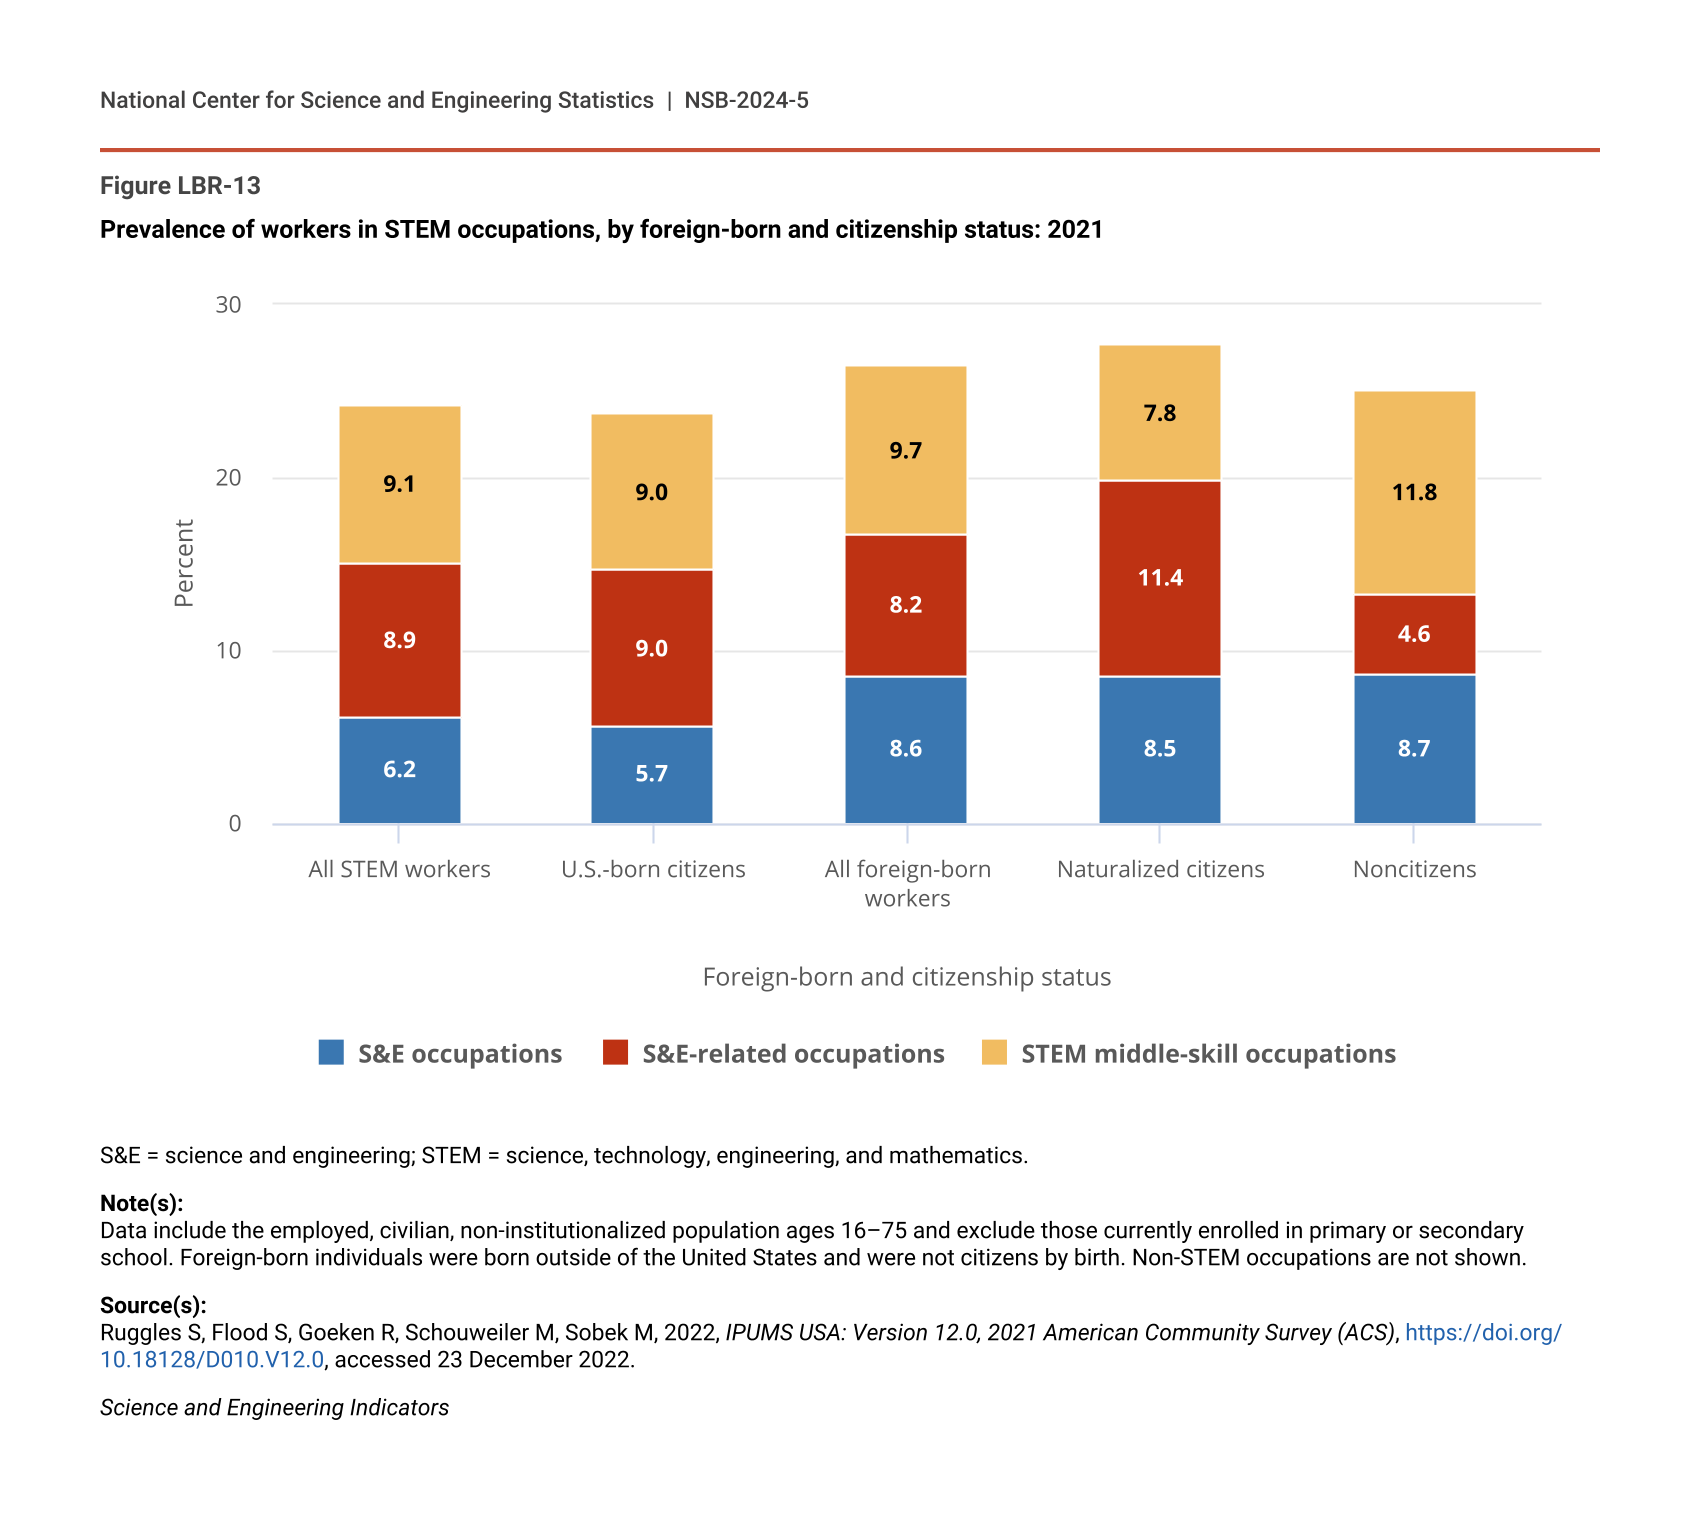
Foreign-born STEM workers’ occupational characteristics vary by citizenship status and are distinct from U.S.-born STEM workers. Of foreign-born workers, a larger percentage were employed in STEM occupations (26%) than the percentage of U.S.-born workers (24%) (Table SLBR-25). Similarly, both naturalized and noncitizen foreign-born workers worked in STEM occupations at slightly higher rates (28% and 25%, respectively) than U.S.-born workers (24%) did. Proportionally, more naturalized citizen workers (11%) worked in S&E-related occupations than noncitizen workers (5%) or U.S.-born citizen workers (9%). Additionally, larger proportions of noncitizens worked in STEM middle-skill occupations (12%) than naturalized citizens (8%) or U.S.-born workers (9%) (Figure LBR-13).
Prevalence of workers in STEM occupations, by foreign-born and citizenship status: 2021
| Foreign-born and citizenship status | S&E occupations | S&E-related occupations | STEM middle-skill occupations |
|---|---|---|---|
| All STEM workers | 6.2 | 8.9 | 9.1 |
| U.S.-born citizens | 5.7 | 9.0 | 9.0 |
| All foreign-born workers | 8.6 | 8.2 | 9.7 |
| Naturalized citizens | 8.5 | 11.4 | 7.8 |
| Noncitizens | 8.7 | 4.6 | 11.8 |
S&E = science and engineering; STEM = science, technology, engineering, and mathematics.
Note(s):
Data include the employed, civilian, non-institutionalized population ages 16–75 and exclude those currently enrolled in primary or secondary school. Foreign-born individuals were born outside of the United States and were not citizens by birth. Non-STEM occupations are not shown.
Source(s):
Ruggles S, Flood S, Goeken R, Schouweiler M, Sobek M, 2022, IPUMS USA: Version 12.0, 2021 American Community Survey (ACS), https://doi.org/10.18128/D010.V12.0, accessed 23 December 2022.
Science and Engineering Indicators
There are 24 countries or economies of origin that each contributed 1% or more of the foreign-born STEM workforce (Table SLBR-26). Together, these 24 countries or economies accounted for about 75% of all foreign-born STEM workers. Of all foreign-born STEM workers, 18% were born in Mexico, followed by 14% born in India, 7% in China, and 6% in the Philippines. Within the different portions of the STEM occupations, country or economy of origin varies for foreign-born workers. For example, the largest proportion of foreign-born STEM middle-skill workers were born in Mexico (40%). Of foreign-born S&E workers, 29% were born in India, and 13% were born in China. Among S&E-related foreign-born workers, 13% were born in the Philippines, and another 12% were born in India.
Foreign-Born STEM Workers with Bachelor’s Degrees or Higher
The proportion of foreign-born STEM workers overall and with a bachelor’s degree or higher was similar in 2021 and 2019 (NSB Indicators 2022: Figure LBR-31; Table SLBR-25). In 2021, there were over 7 million (7,023,900) foreign-born STEM workers (or 19% of all STEM workers); almost 4 million (3,931,400) held a bachelor’s degree, of whom 3,621,200 worked in S&E or S&E-related occupations according to the ACS (Table SLBR-25). The NSCG, which applies a survey coverage and occupation classification that are different from the ACS, estimates that there are about 3,937,700 foreign-born S&E or S&E-related workers with a bachelor’s degree or higher, or 23% of STEM workers (Table SLBR-27). The rest of this section is based on the NSCG estimates.
Overall, about 60% of foreign-born S&E or S&E-related workers are U.S. citizens (Table SLBR-27). Of the other 40%, some 22% were temporary visa holders, and 18% were permanent residents. Overall, for S&E and S&E-related occupation fields, more workers were foreign-born citizens than temporary visa holders, although there is variation in proportions of foreign-born workers’ citizenship status across S&E fields. For example, computer and mathematical scientists was the largest S&E or S&E-related occupation field for temporary visa holders, employing 32% of workers with temporary visas. Among permanent residents, 20% worked in S&E-related occupations, although 3% of workers in S&E-related occupations were permanent residents.
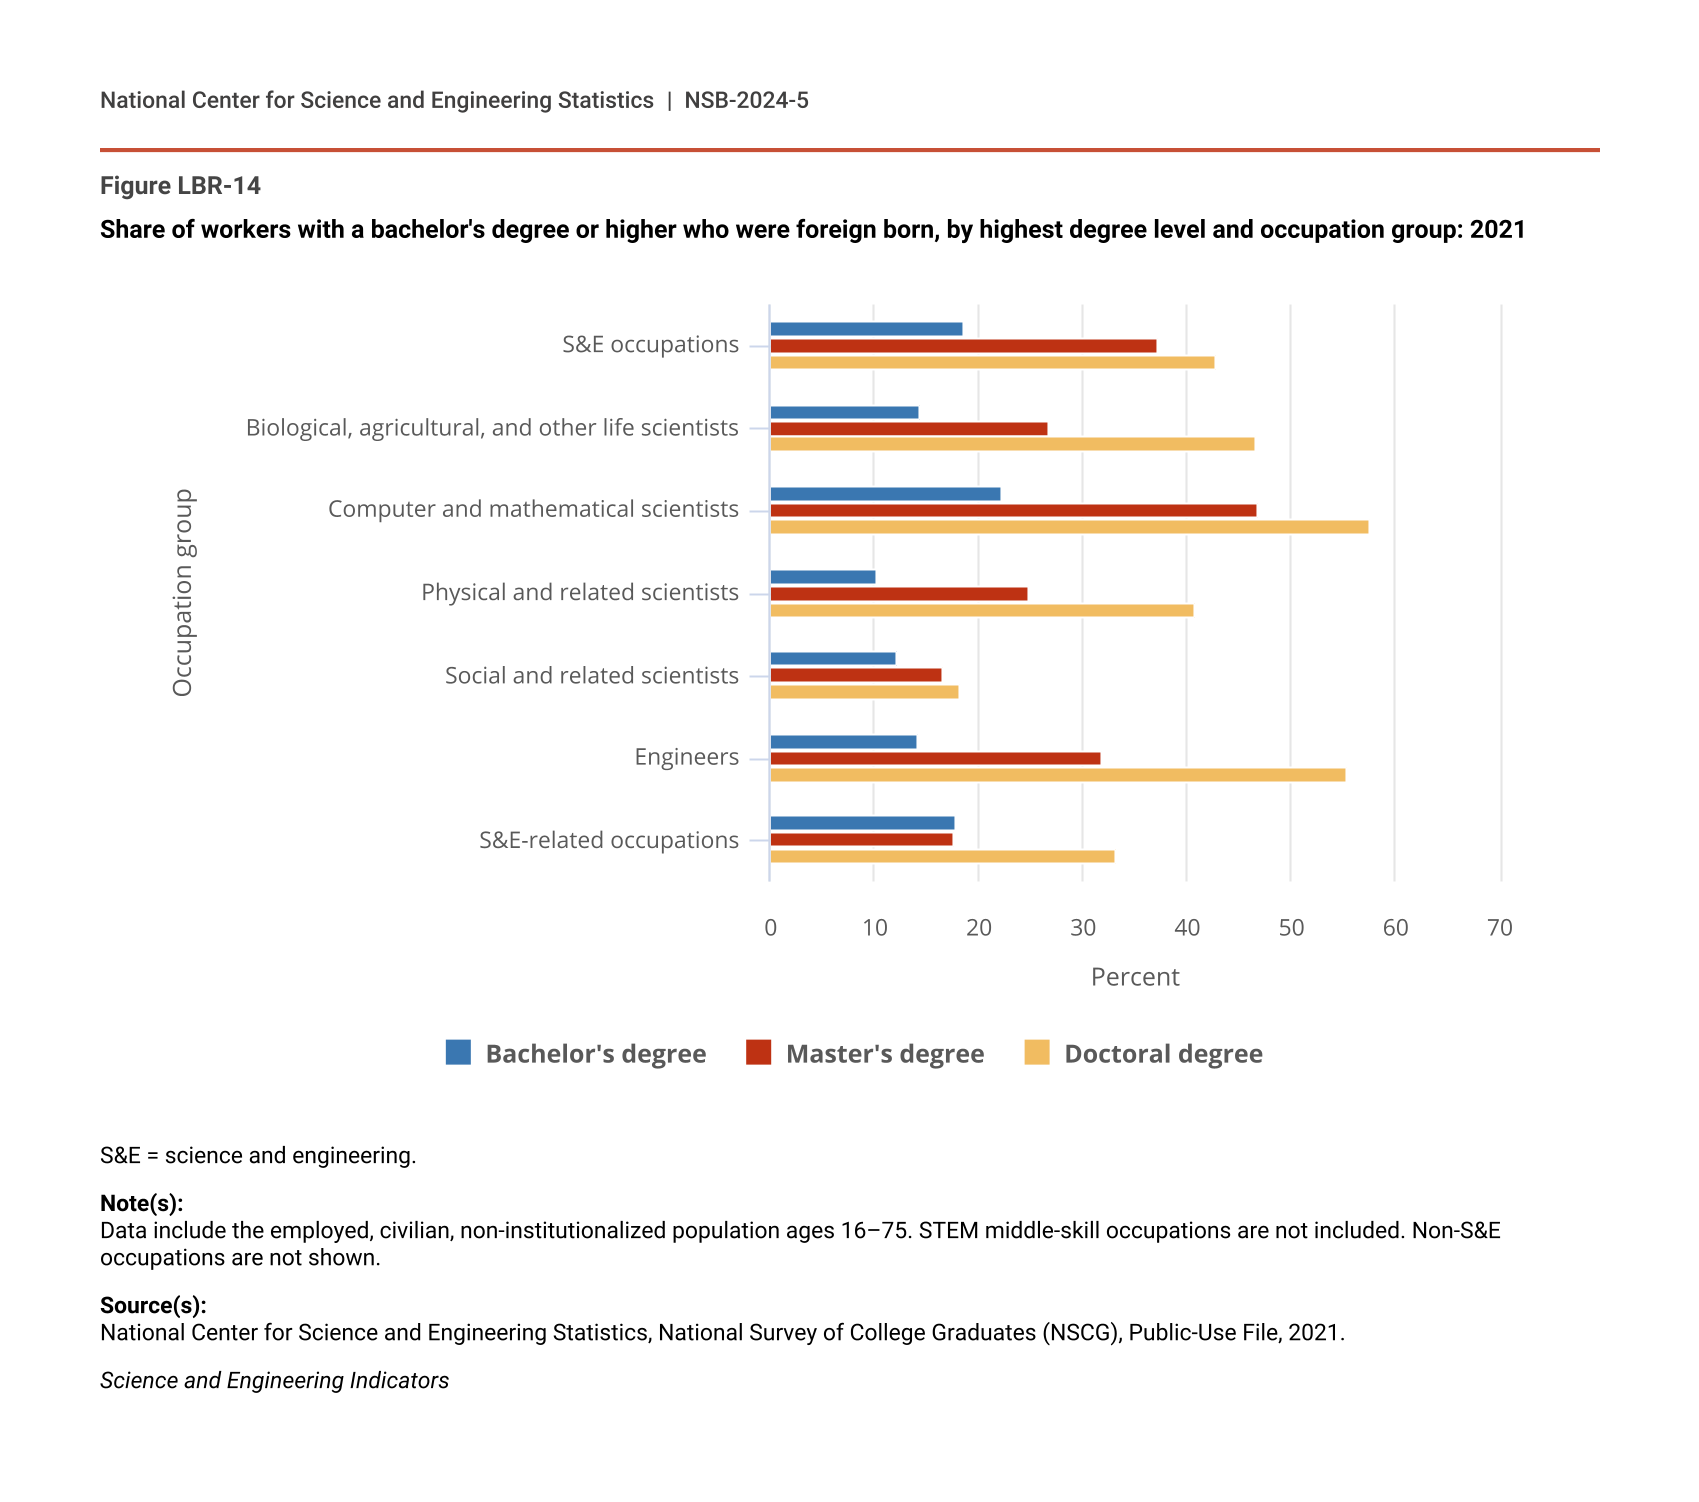
The prevalence of foreign-born individuals also varied by degree level. Larger proportions of doctoral degree holders in S&E occupations were foreign born (43%) than either master’s degree holders (37%) or bachelor’s degree holders (19%) (Figure LBR-14). This was also true for all S&E occupation groups. Further, among S&E occupation groups, more than 50% of doctorate holders that worked as computer and mathematical scientists (58%) and engineers (56%) were foreign born.
Share of workers with a bachelor's degree or higher who were foreign born, by highest degree level and occupation group: 2021
| Occupation group | Bachelor's degree | Master's degree | Doctoral degree |
|---|---|---|---|
| S&E occupations | 18.7 | 37.2 | 42.8 |
| Biological, agricultural, and other life scientists | 14.4 | 26.9 | 46.6 |
| Computer and mathematical scientists | 22.3 | 46.8 | 57.6 |
| Physical and related scientists | 10.3 | 24.9 | 40.8 |
| Social and related scientists | 12.3 | 16.7 | 18.2 |
| Engineers | 14.2 | 31.9 | 55.5 |
| S&E-related occupations | 17.9 | 17.7 | 33.3 |
S&E = science and engineering.
Note(s):
Data include the employed, civilian, non-institutionalized population ages 16–75. STEM middle-skill occupations are not included. Non-S&E occupations are not shown.
Source(s):
National Center for Science and Engineering Statistics, National Survey of College Graduates (NSCG), Public-Use File, 2021.
Science and Engineering Indicators
Stay Rates of U.S.-Trained Scientists and Engineers
Stay rates of U.S.-trained scientists and engineers provide insights into whether foreign-born individuals remain in the United States after earning their degrees. NSB’s Vision 2030 report suggests that attracting and retaining global talent are necessary for the United States to remain competitive in S&E fields and that stay rates are critical indicators for understanding how well the United States is retaining global talent (NSB 2020). Stay rates help policymakers understand the degree to which U.S.-trained S&E doctorates contribute to the U.S. economy. Countries such as the United Kingdom, China, and Canada have implemented programs to attract international STEM talent, which could impact stay rates in the United States (Rovito, Kaushik, and Aggarwal 2021). For the remainder of this section, the focus is on individuals on temporary visas at the time they earned their research doctorates in science, engineering, and health (SEH) fields.
The intent-to-stay rate among research doctorate recipients remained relatively stable over the last decade, although the number of research doctorate recipients intending to stay increased due to an increase in temporary visa-holding new doctorates (Table SLBR-28; NCSES SED 2021: Table 1-6, Table 1-7, Table 1-8). Thus, the number of new SEH doctorates planning to stay in the United States was about 9,900 higher in the 4-year period of 2018–21 compared with 2010–13 due to the overall increase of about 12,200 temporary visa-holding doctorate recipients in SEH fields (Table SLBR-28; NCSES SED 2021: Table 1-8, Table 1-9). At the same time, the proportion of temporary visa-holding SEH research doctorate recipients with definite commitments to stay increased between the 2010–13 period (47%) and the 2018–21 period (53%).
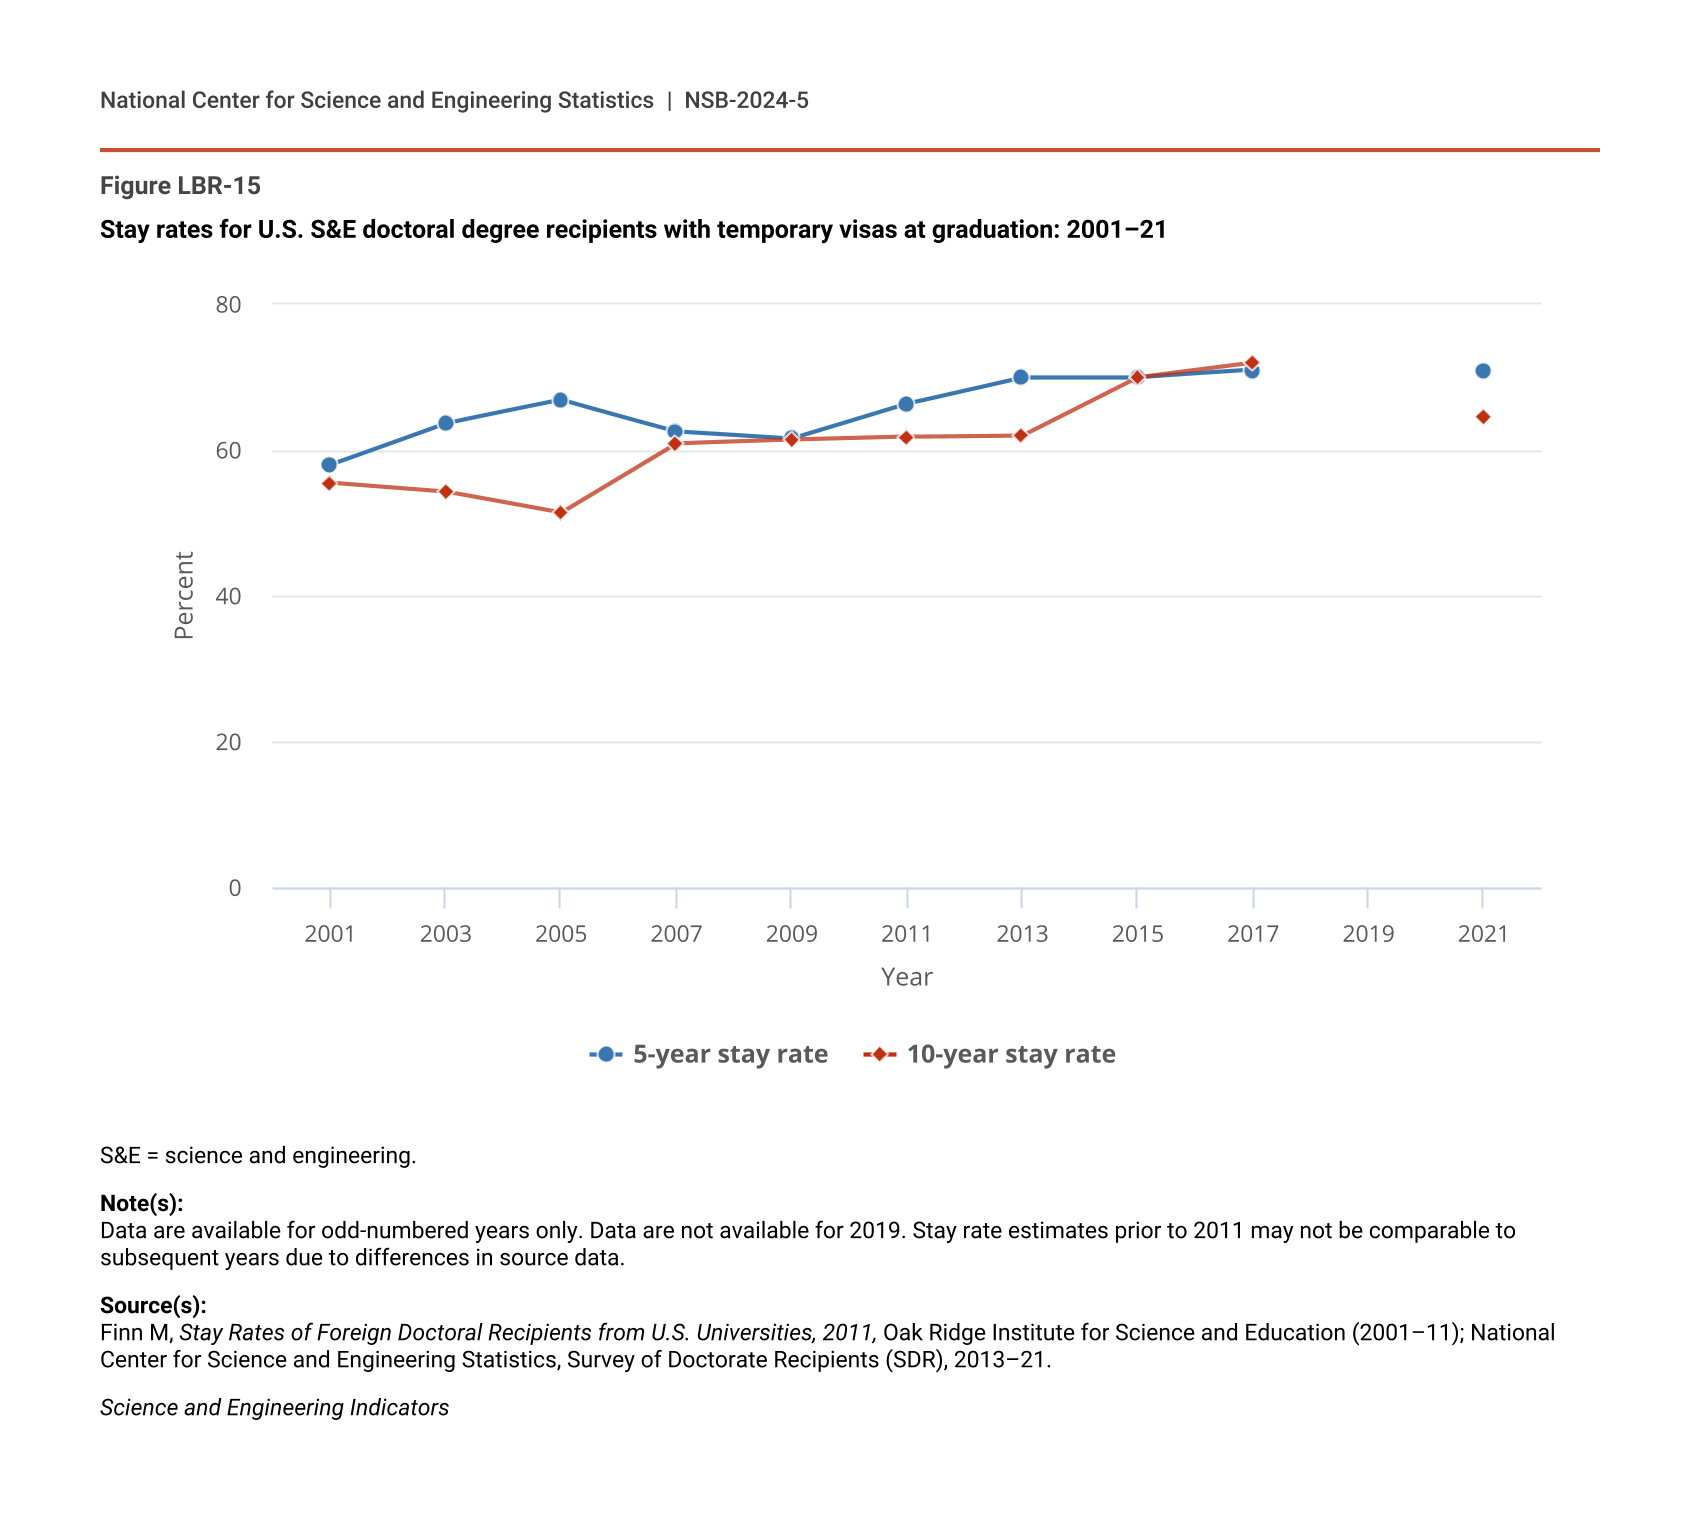
While intentions to stay provide insight at the time of degree completion, the 5- and 10-year stay rates for SEH research doctorate recipients from earlier graduation cohorts show the longer-term retention of doctorate-holding scientists and engineers. Across all countries of citizenship and SEH degree fields, the 5-year stay rate was 71% in 2021, and the 10-year stay rate was 65% (Figure LBR-15). While the 5-year stay rate in 2021 was similar to that of 2017 (the last time stay rates could be calculated from the SDR), the 10-year stay rate declined from 72% in 2017 to 65% in 2021.
Stay rates for U.S. S&E doctoral degree recipients with temporary visas at graduation: 2001–21
| Year | 5-year stay rate | 10-year stay rate |
|---|---|---|
| 2001 | 58.0 | 55.5 |
| 2003 | 63.7 | 54.3 |
| 2005 | 66.9 | 51.4 |
| 2007 | 62.6 | 60.9 |
| 2009 | 61.6 | 61.4 |
| 2011 | 66.4 | 61.8 |
| 2013 | 70.0 | 62.0 |
| 2015 | 70.0 | 70.0 |
| 2017 | 71.0 | 72.0 |
| 2019 | NA | NA |
| 2021 | 70.8 | 64.7 |
S&E = science and engineering.
Note(s):
Data are available for odd-numbered years only. Data are not available for 2019. Stay rate estimates prior to 2011 may not be comparable to subsequent years due to differences in source data.
Source(s):
Finn M, Stay Rates of Foreign Doctoral Recipients from U.S. Universities, 2011, Oak Ridge Institute for Science and Education (2001–11); National Center for Science and Engineering Statistics, Survey of Doctorate Recipients (SDR), 2013–21.
Science and Engineering Indicators
Stay rates varied by both field of doctoral degree and country, economy, or region of citizenship (Table LBR-4). The 5- and 10-year stay rates of doctorate recipients with temporary visas were similar (just over 70%) in both the biological, agricultural, health, and environmental life sciences and in engineering. Yet for doctorates in computer and mathematical sciences, the 5- and 10-year stay rates were quite different—the 5-year stay rate was 79%, whereas the 10-year stay rate was 63%.
Temporary visa holders receiving S&E doctorates in 2015–17 and 2010–12 who were in the United States in 2021, by S&E degree field and by region, country, or economy of citizenship at time of degree
S&E = science and engineering.
Note(s):
Weighted frequencies are rounded to the nearest 50. Stay rates are rounded to the nearest integer. Due to changes in the National Center for Science and Engineering Statistics Taxonomy of Disciplines, field of degree numbers and proportions may not be comparable to prior years.
Source(s):
National Center for Science and Engineering Statistics, Survey of Doctorate Recipients (SDR), 2021.
Science and Engineering Indicators
While there were fewer temporary visa holders who received doctorates in the social sciences, these doctorate holders had the lowest 5-year (53%) and 10-year stay rates (41%), with under 50% remaining in the United States 10 years after earning a doctorate. Turning to the country, economy, or region of citizenship of doctorate recipients, those with Chinese citizenship had higher 5- and 10-year stay rates (88% and 81%, respectively) than the overall population of temporary visa-holding doctorate recipients, as did those with Indian citizenship (79% and 77%, respectively).