 An official website of the United States government
 Production Patterns of Knowledge- and Technology-Intensive Industries
U.S. Industries
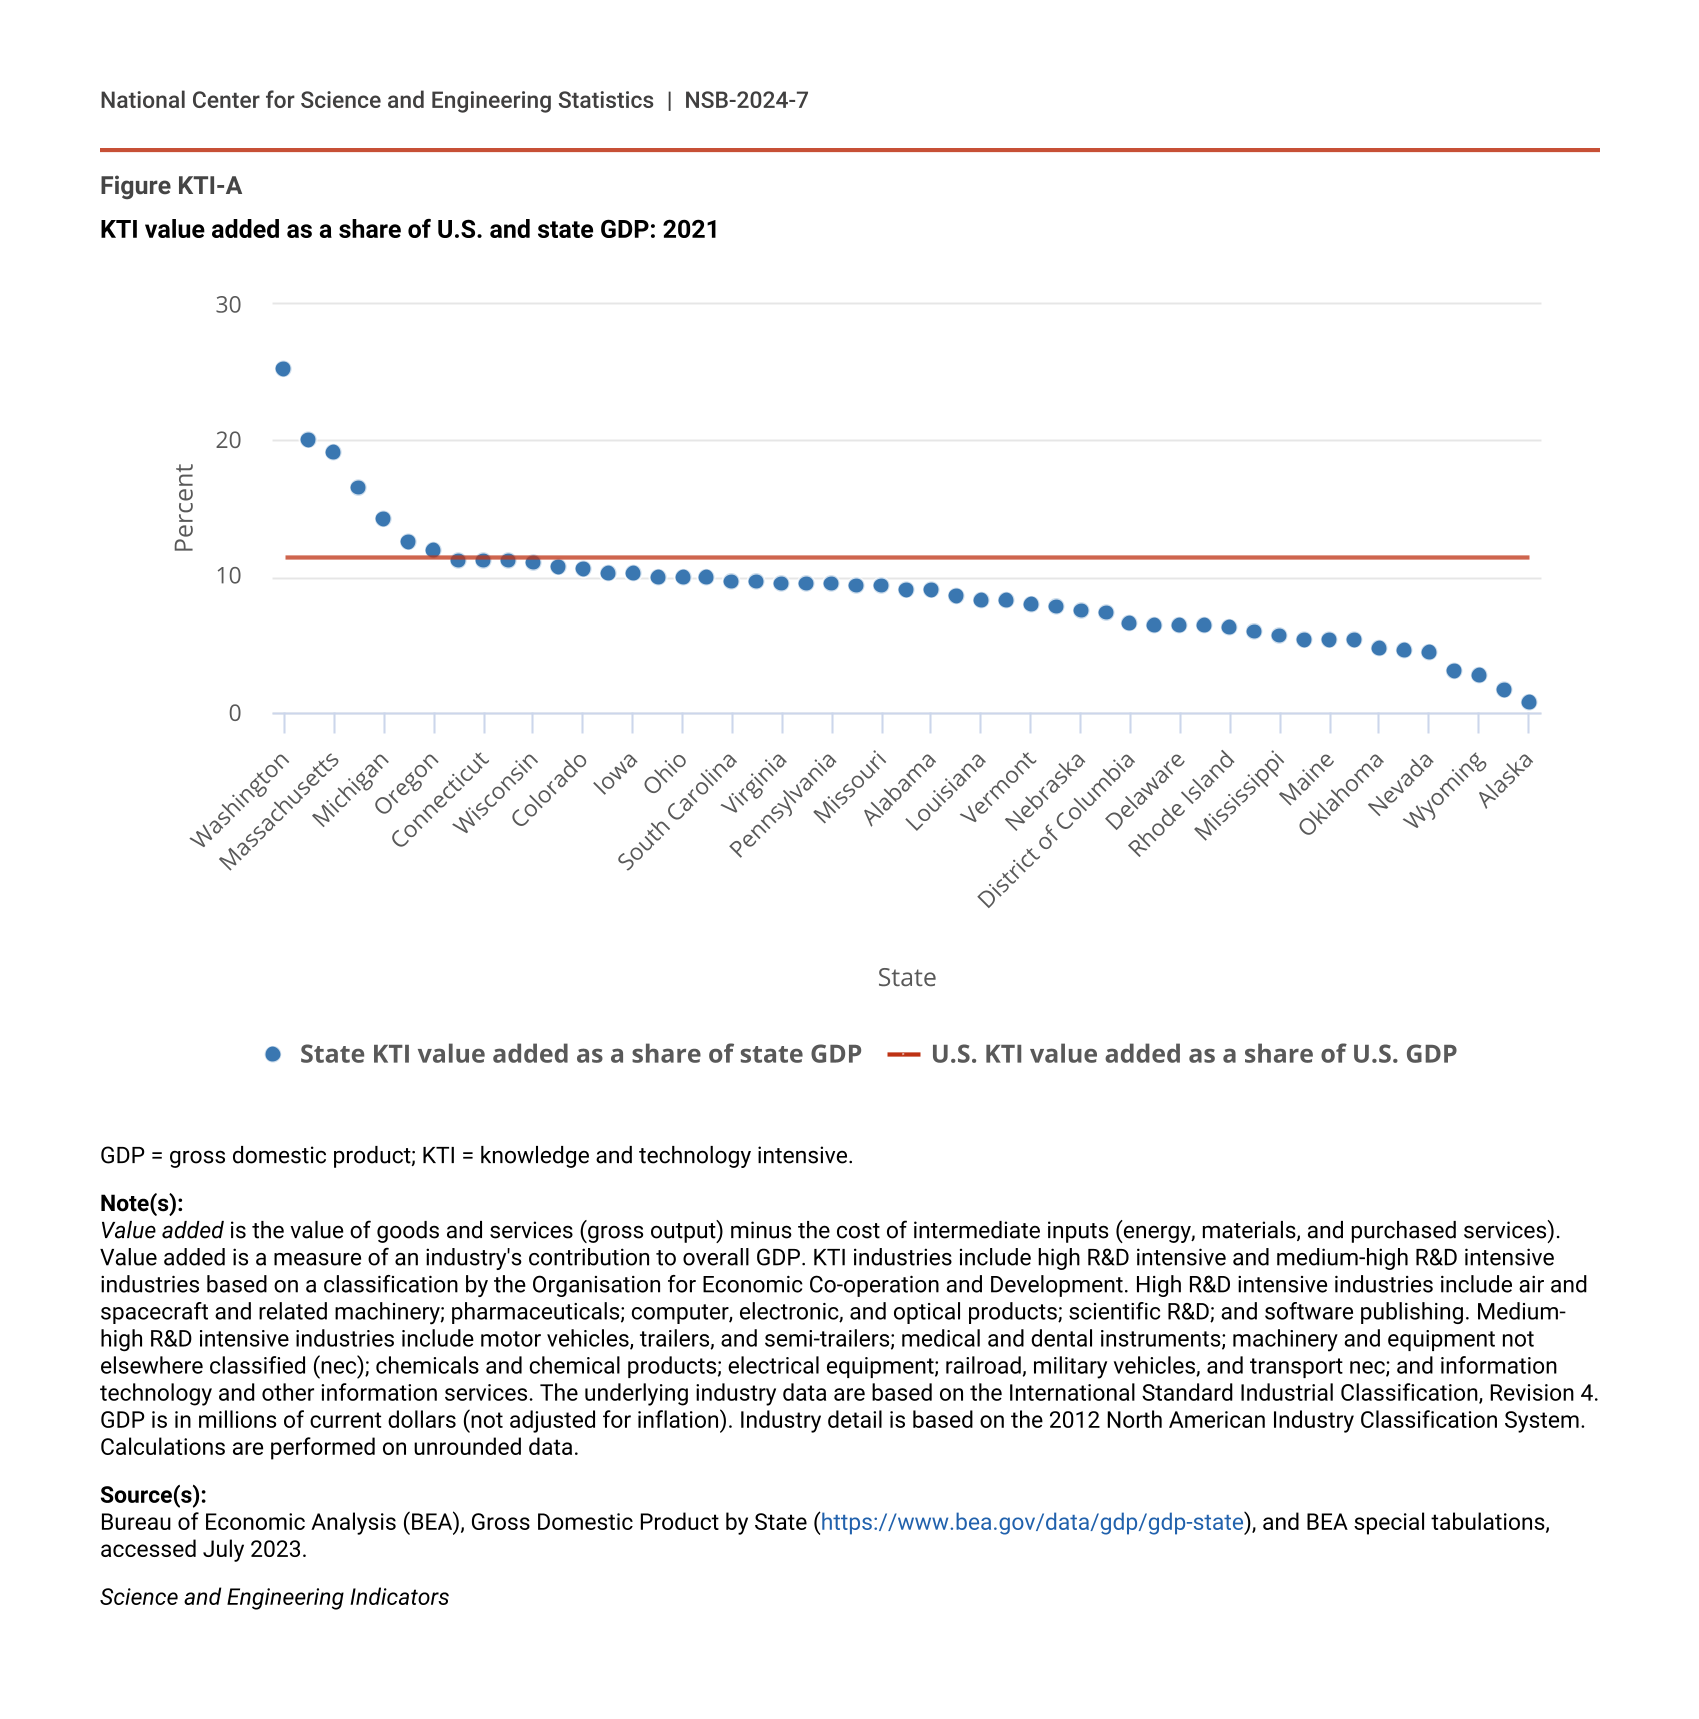
KTI industries have accounted for about a 10th of U.S. gross domestic product (GDP) since 2002 (11% in 2022, or $2.9 trillion of $25.7 trillion in current U.S. dollars, based on S&P Global detailed value-added industry data and BEA GDP statistics) (BEA 2023c; Table KTI-1; Table SKTI-1; Table SAKTI-2). This relatively modest share reflects that the U.S. economy is relatively less manufacturing intensive and that most KTI industries are in the manufacturing sector given its higher R&D intensity (Wolfe 2022). Indeed, in 2022, manufacturing industries overall accounted for 11.2% of U.S. GDP, compared with 55.6% for total private services.
U.S. KTI industries, by value added and share of GDP: 2018–22
GDP = gross domestic product; ISIC, Rev.4 = International Standard Industrial Classification, Revision 4; IT = information technology; KTI = knowledge and technology intensive; nec = not elsewhere classified.
Note(s):
Value added is the value of goods and services (gross output) minus the cost of intermediate inputs (energy, materials, and purchased services). Value added is a measure of an industry's contribution to overall GDP. KTI industries include high R&D intensive and medium-high R&D intensive industries based on a classification by the Organisation for Economic Co-operation and Development. The data have been crosswalked to the ISIC, Rev.4, classification. See the Technical Appendix for the crosswalking and Table SAKTI-1. Total private services corresponds to main services in ISIC, Rev.4.
Source(s):
GDP data are from the Bureau of Economic Analysis, Industry Economic Accounts, accessed November 2023 (available at https://www.bea.gov/itable/national-gdp-and-personal-income); value-added data are from S&P Global IHS Markit, Comparative Industry Service special tabulations, October 2023.
Science and Engineering Indicators
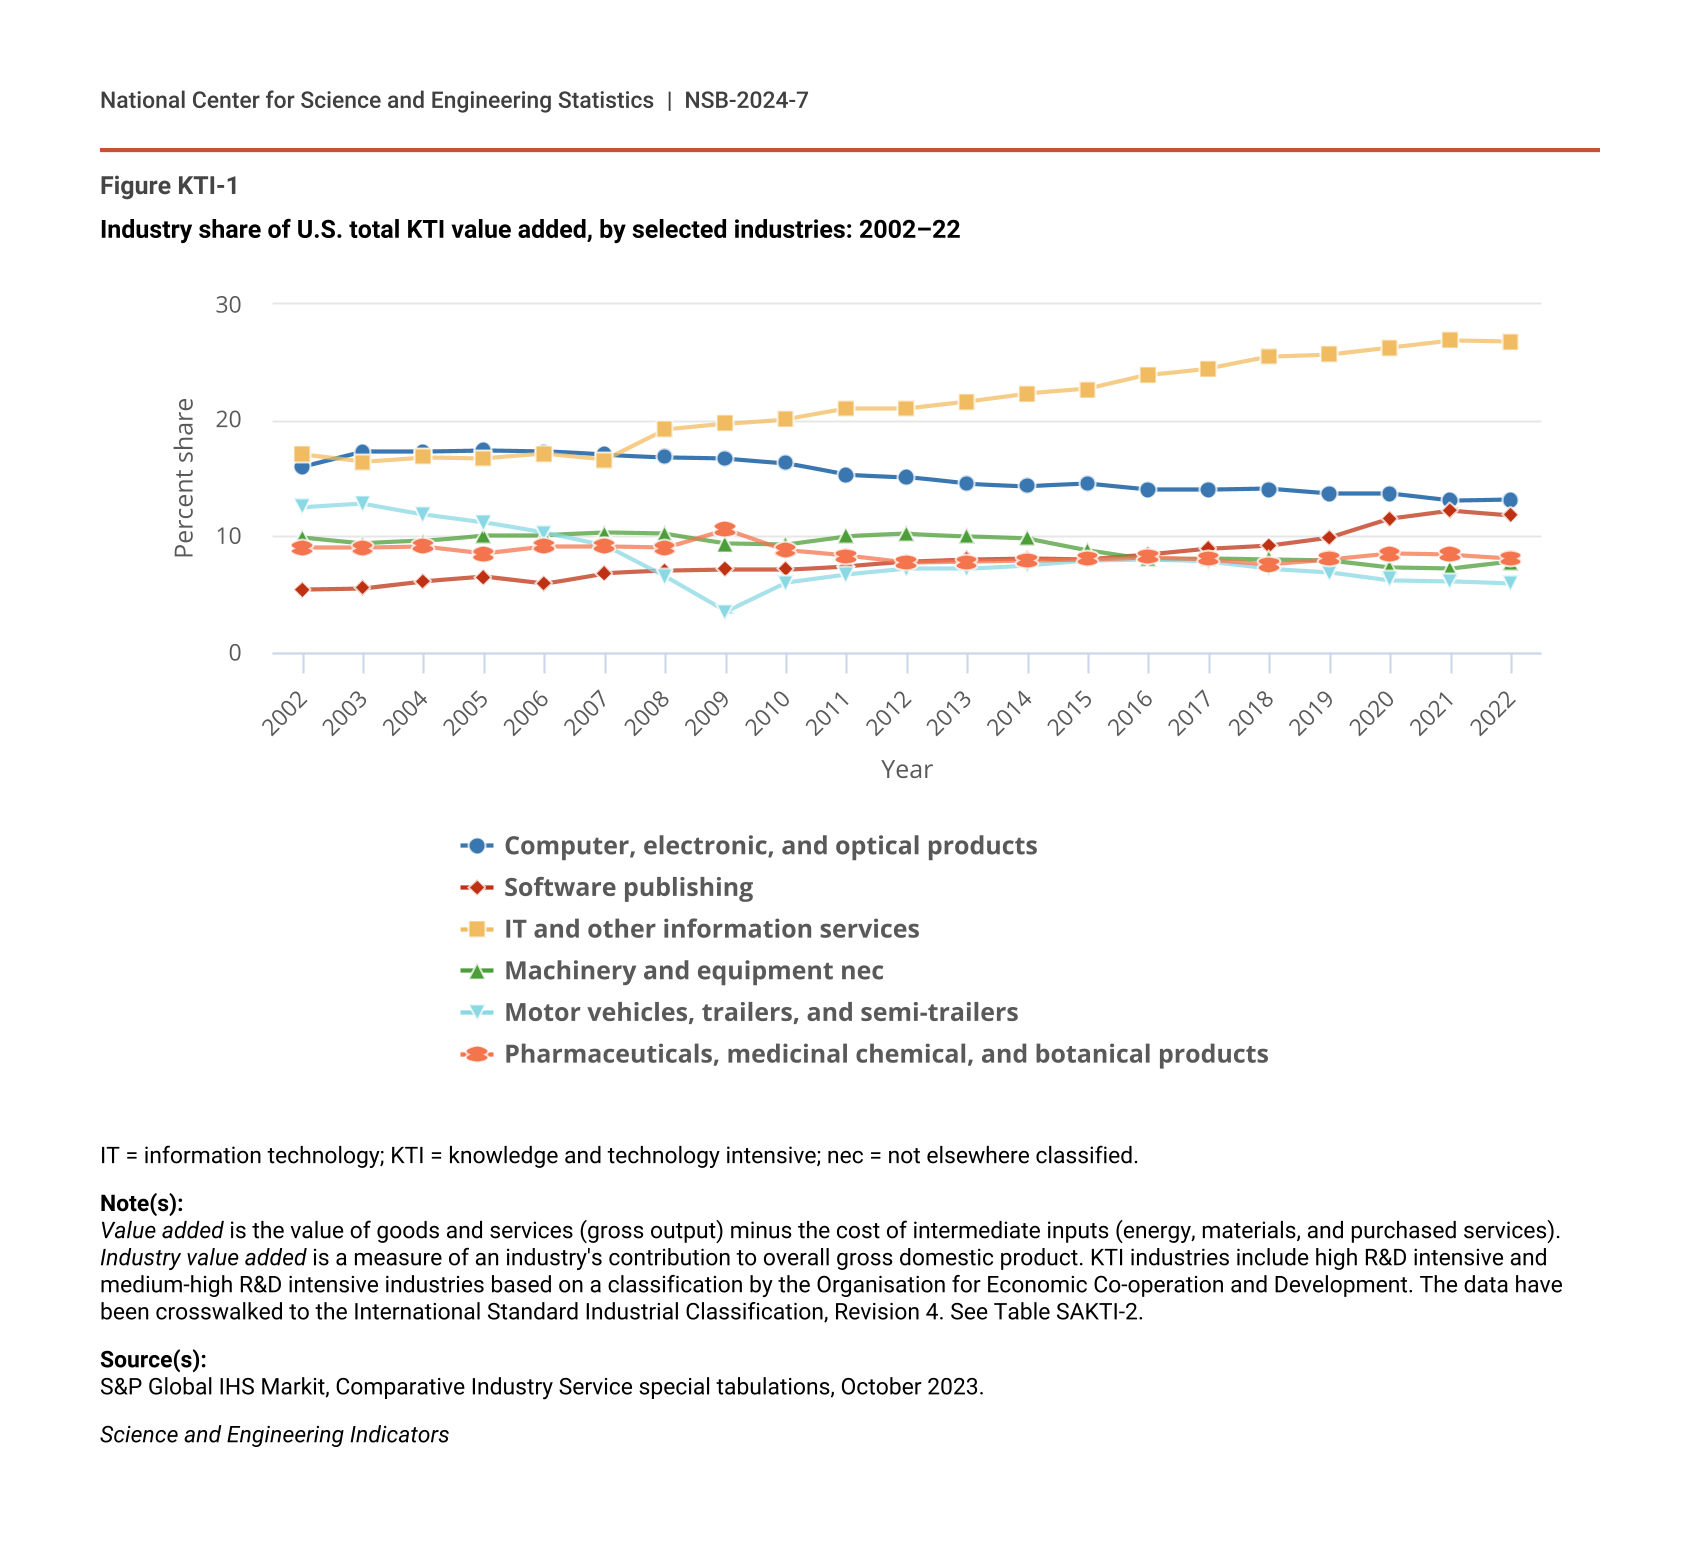
For most of the data since 2002, KTI manufacturing accounted for a larger share of U.S. GDP (6%–7%), compared with KTI services (3%–5%). Despite these relatively constant shares relative to GDP, two changes are notable for value added within U.S. KTI industries. KTI services industries’ share in total U.S. KTI value added increased from about a third to 45% from 2002 to 2022, with the KTI manufacturing share declining from over two-thirds in 2002 to 55% in 2022 (Table SKTI-1). In particular, IT and other information services has been the largest U.S. KTI industry by nominal value added since 2008 (Figure KTI-1). Because of small but steady increases (with a declining share through 2021 and flat in 2022), the share of software publishing now almost matches the computer, electronic, and optical products manufacturing share of KTI value added. The output trend in these three IT-related industries is consistent with increased U.S. private fixed investment in physical IT (computers, peripheral, and communication equipment) and in intangibles or intellectual property products (IPPs), such as software, since the early 2000s.
Industry share of U.S. total KTI value added, by selected industries: 2002–22
| Year | Computer, electronic, and optical products | Software publishing | IT and other information services | Machinery and equipment nec | Motor vehicles, trailers, and semi-trailers | Pharmaceuticals, medicinal chemical, and botanical products |
|---|---|---|---|---|---|---|
| 2002 | 16.0 | 5.4 | 17.0 | 9.9 | 12.5 | 9.0 |
| 2003 | 17.3 | 5.5 | 16.4 | 9.4 | 12.8 | 9.0 |
| 2004 | 17.3 | 6.1 | 16.8 | 9.6 | 11.9 | 9.1 |
| 2005 | 17.4 | 6.5 | 16.7 | 10.1 | 11.2 | 8.5 |
| 2006 | 17.3 | 5.9 | 17.1 | 10.1 | 10.3 | 9.1 |
| 2007 | 17.0 | 6.8 | 16.6 | 10.3 | 9.2 | 9.1 |
| 2008 | 16.8 | 7.0 | 19.2 | 10.2 | 6.5 | 9.0 |
| 2009 | 16.7 | 7.1 | 19.7 | 9.4 | 3.5 | 10.6 |
| 2010 | 16.3 | 7.1 | 20.1 | 9.3 | 6.0 | 8.8 |
| 2011 | 15.3 | 7.4 | 21.0 | 10.0 | 6.7 | 8.3 |
| 2012 | 15.1 | 7.8 | 21.0 | 10.2 | 7.2 | 7.7 |
| 2013 | 14.5 | 8.0 | 21.6 | 10.0 | 7.2 | 7.8 |
| 2014 | 14.3 | 8.1 | 22.3 | 9.8 | 7.5 | 7.9 |
| 2015 | 14.5 | 8.0 | 22.7 | 8.8 | 7.9 | 8.0 |
| 2016 | 14.0 | 8.4 | 23.9 | 8.0 | 8.0 | 8.2 |
| 2017 | 14.0 | 8.9 | 24.5 | 8.1 | 7.8 | 8.0 |
| 2018 | 14.1 | 9.2 | 25.5 | 8.0 | 7.2 | 7.6 |
| 2019 | 13.7 | 9.9 | 25.7 | 7.9 | 6.9 | 8.0 |
| 2020 | 13.7 | 11.5 | 26.3 | 7.3 | 6.2 | 8.5 |
| 2021 | 13.1 | 12.2 | 26.9 | 7.2 | 6.1 | 8.4 |
| 2022 | 13.2 | 11.8 | 26.8 | 7.8 | 5.9 | 8.1 |
IT = information technology; KTI = knowledge and technology intensive; nec = not elsewhere classified.
Note(s):
Value added is the value of goods and services (gross output) minus the cost of intermediate inputs (energy, materials, and purchased services). Industry value added is a measure of an industry's contribution to overall gross domestic product. KTI industries include high R&D intensive and medium-high R&D intensive industries based on a classification by the Organisation for Economic Co-operation and Development. The data have been crosswalked to the International Standard Industrial Classification, Revision 4. See Table SAKTI-2.
Source(s):
S&P Global IHS Markit, Comparative Industry Service special tabulations, October 2023.
Science and Engineering Indicators
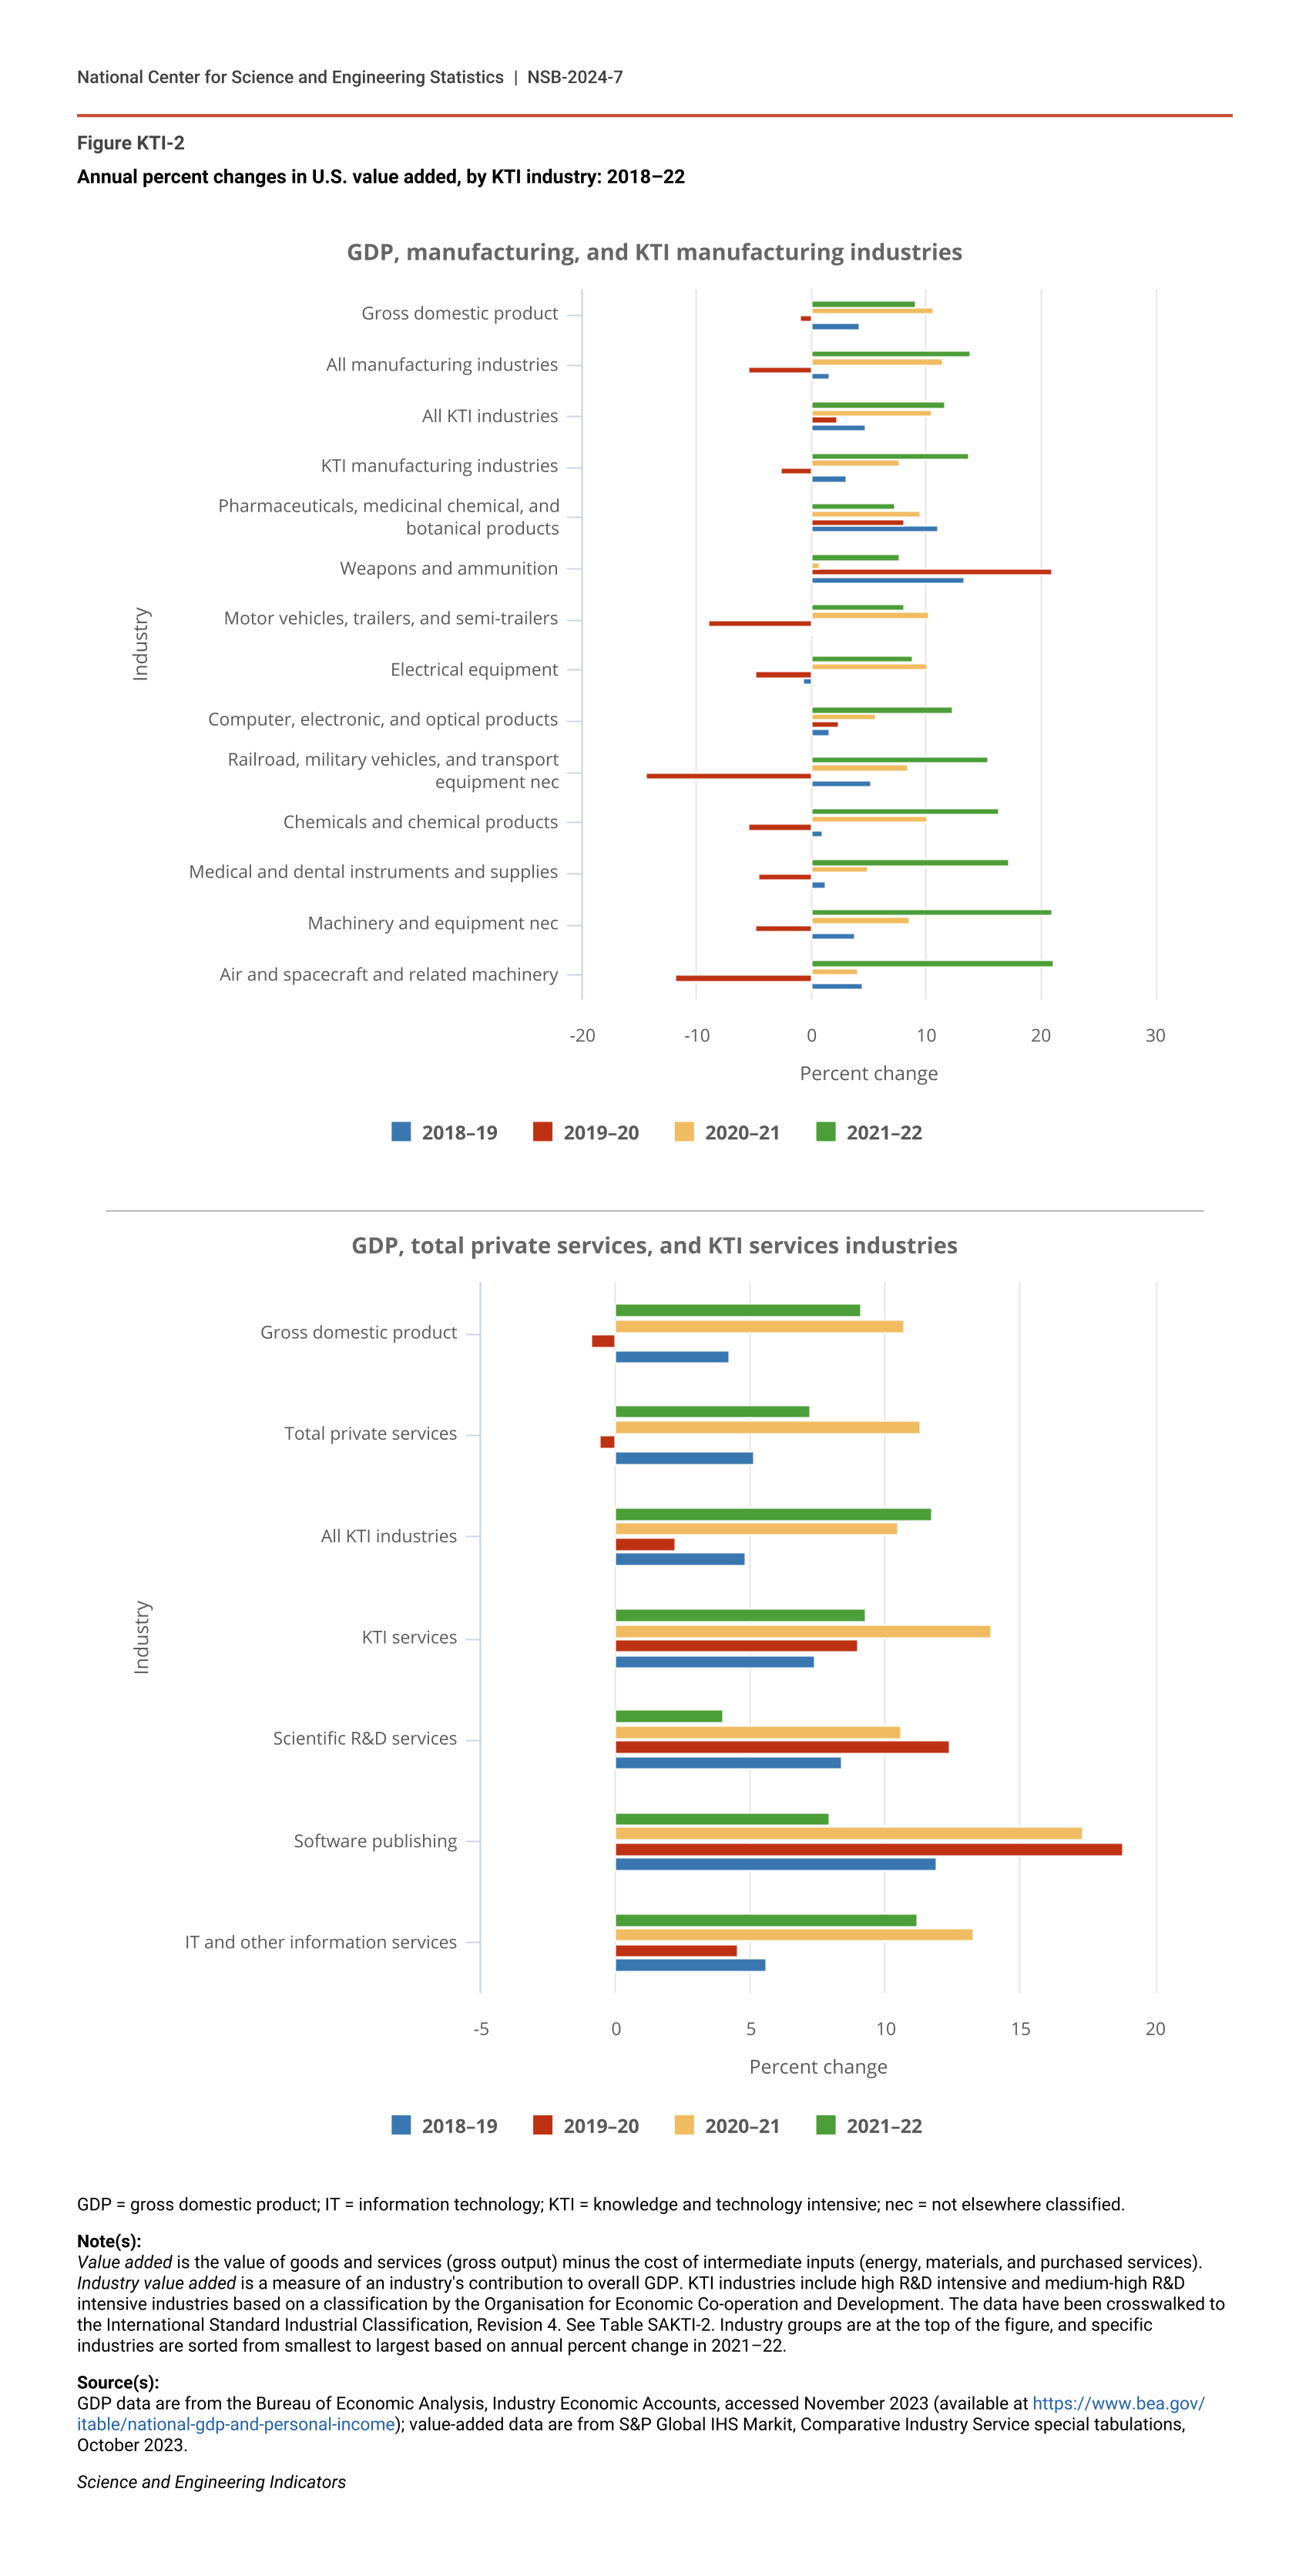
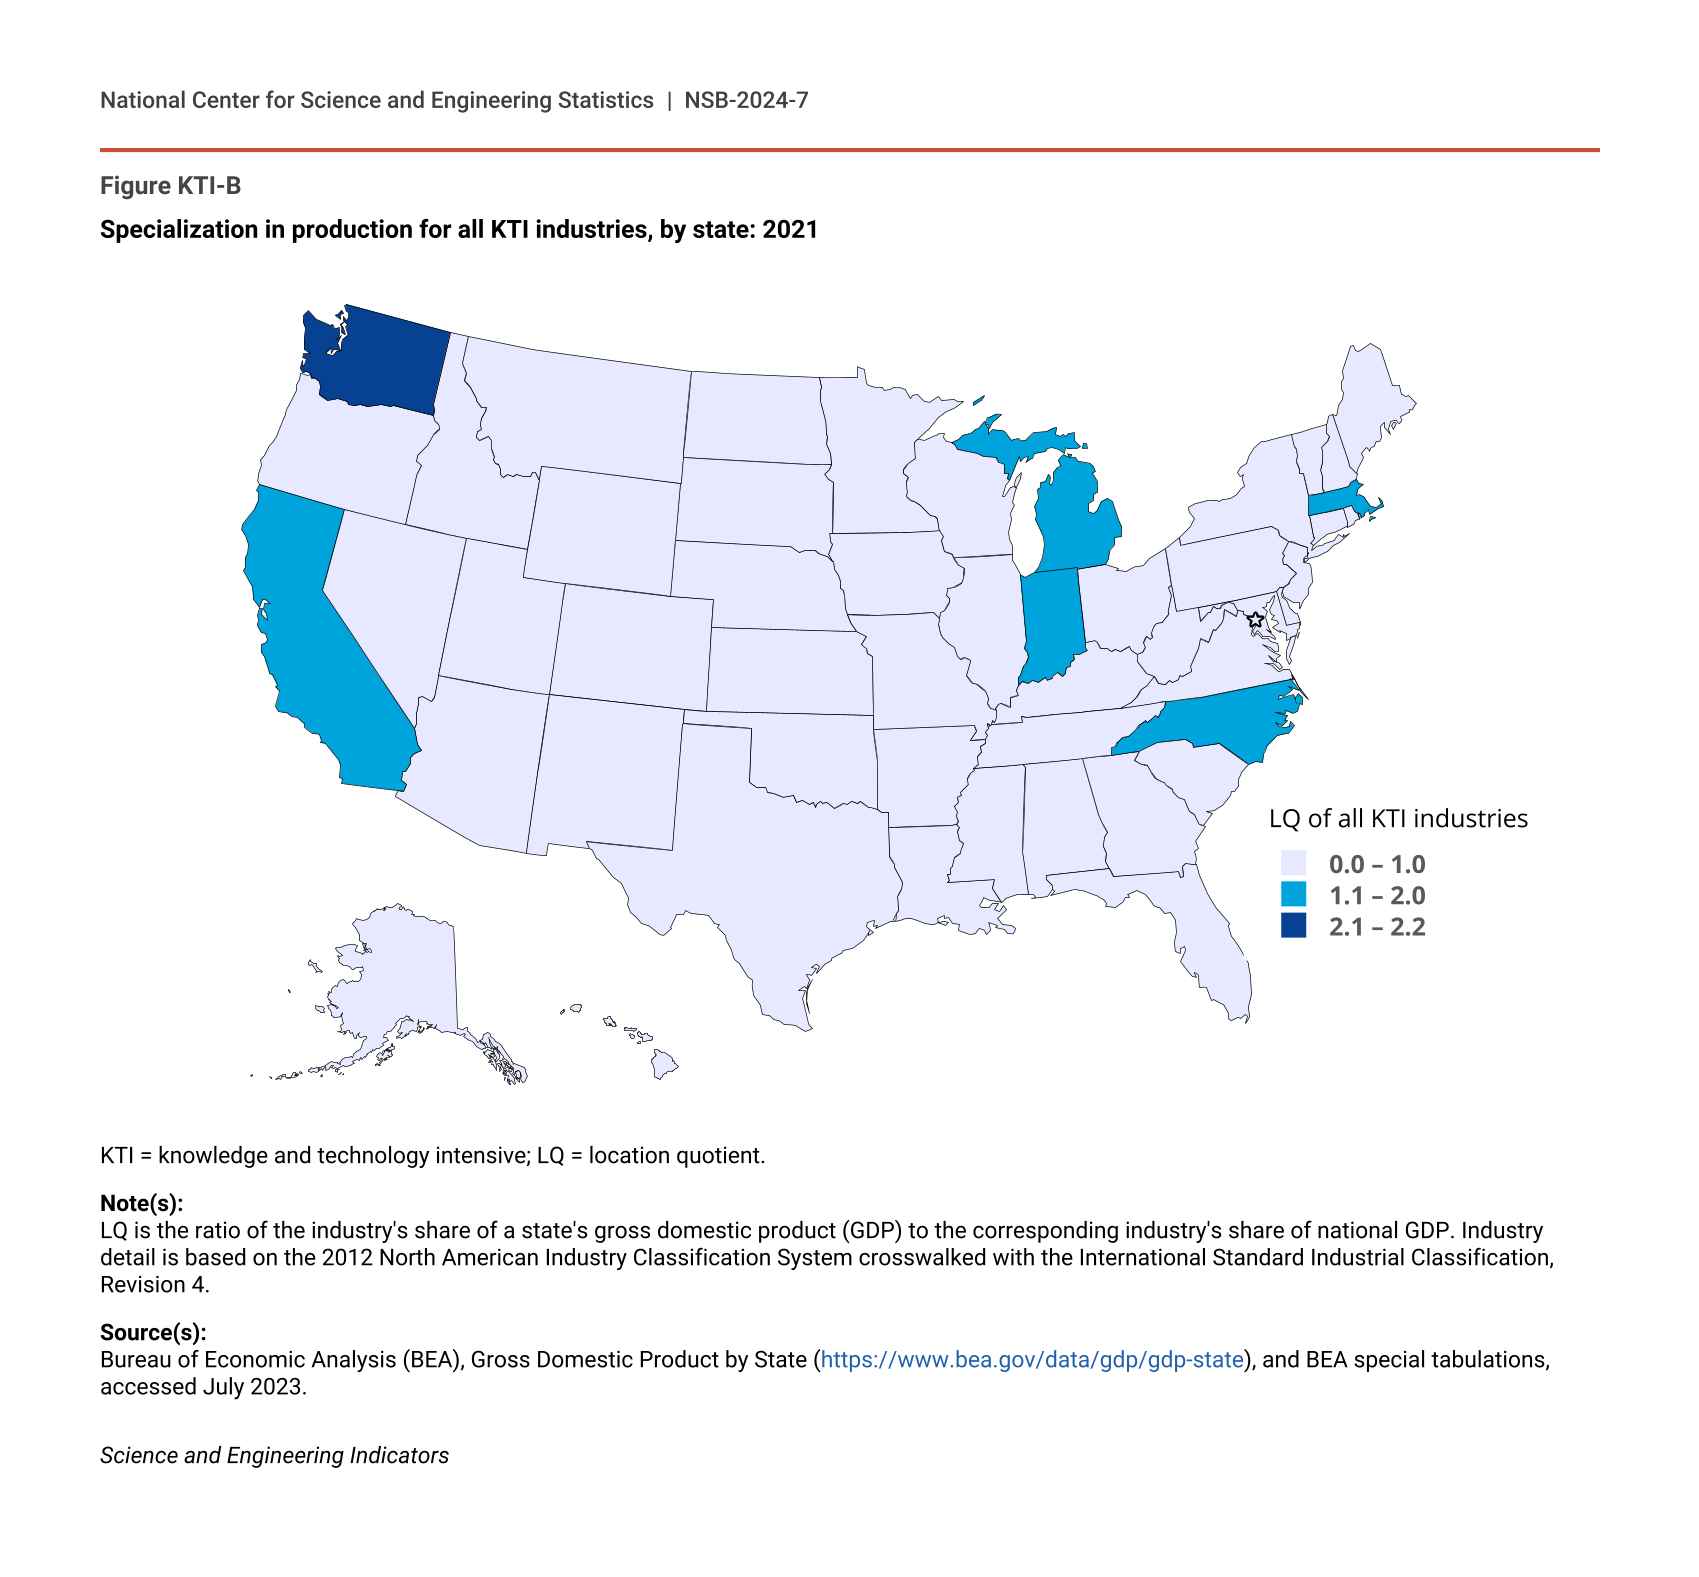
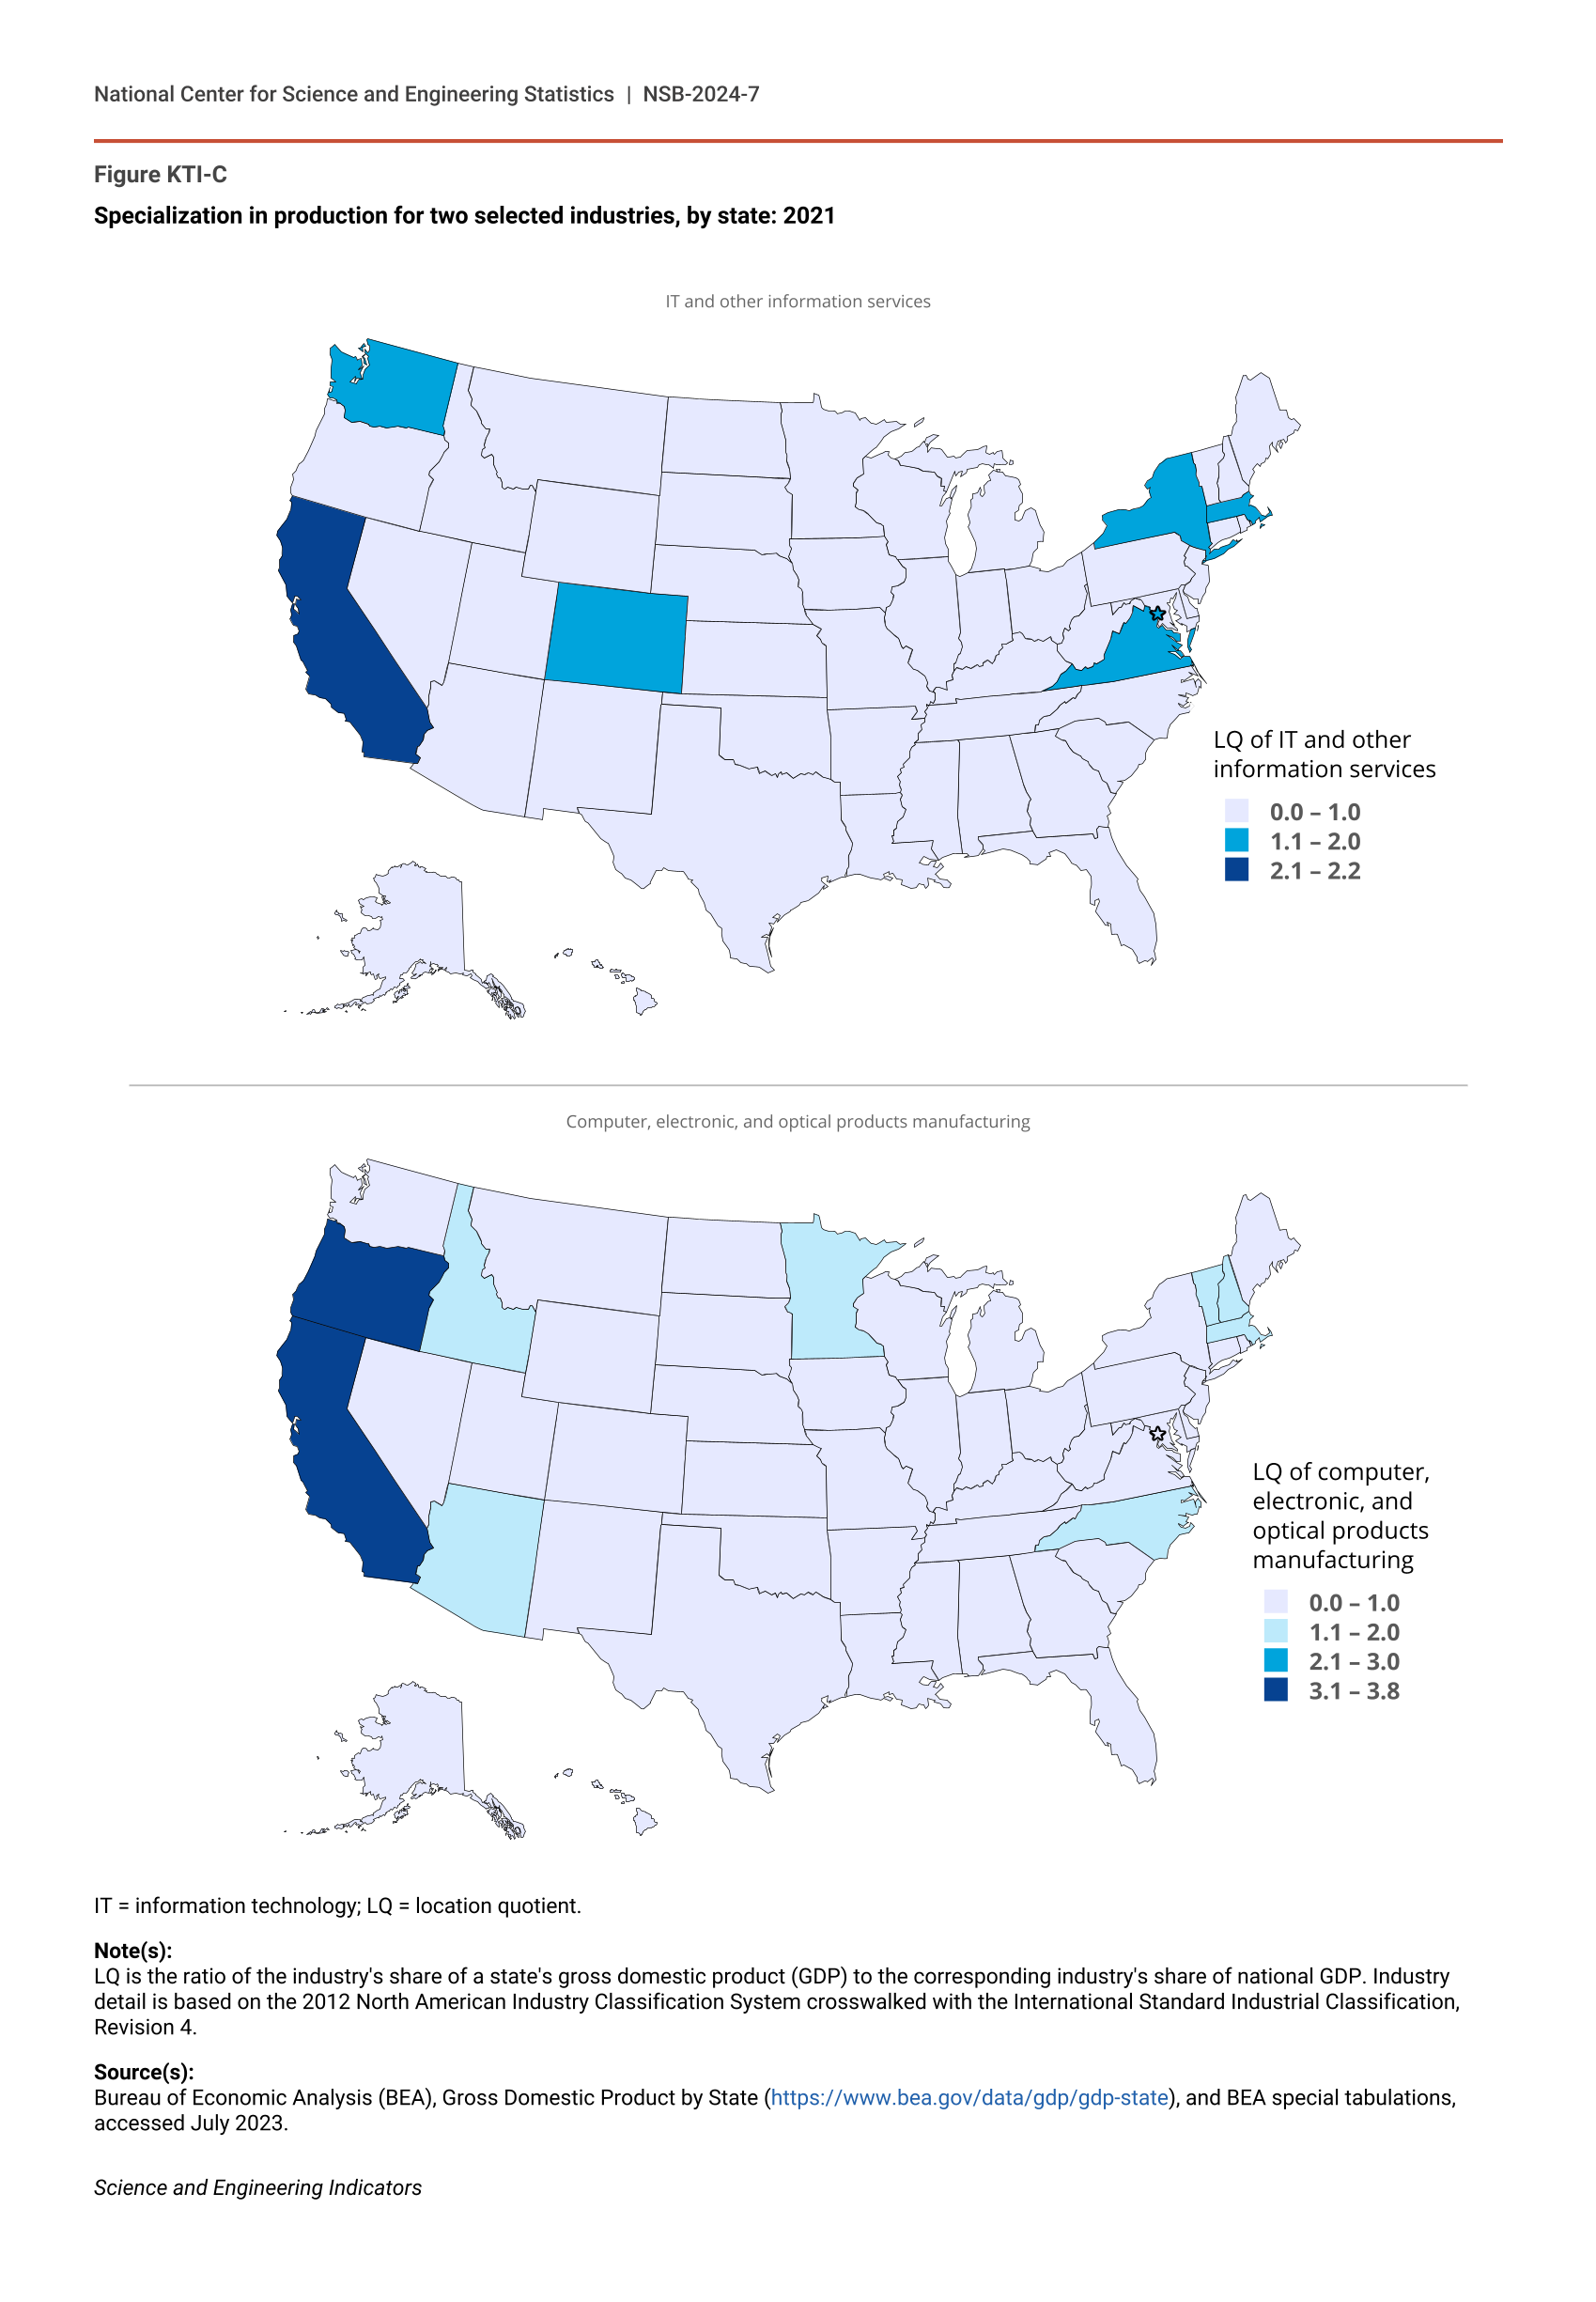
More recently, KTI services production was impacted differently from KTI manufacturing in the last economic downturn, likely reflecting the level and timing of the effects of the pandemic on goods versus services in the overall U.S. economy (Chetty, Friedman, and Stepner 2023). Figure KTI-2 shows annual percentage changes since 2018 in separate panels for KTI manufacturing and KTI services. Except for weapons and ammunition; pharmaceuticals; and computer, electronic, and optical products—each of which had an annual increase in 2020—value added by U.S. KTI manufacturing industries declined by larger percentages compared with the overall percentage decline in GDP in the 2020 recession. These industries rebounded in 2021, with further increases in 2022. In contrast, all three KTI services industries—software publishing, IT and other information services, and scientific R&D services—posted annual increases since 2018 in current U.S. dollars. Within U.S. KTI manufacturing, value added of air and spacecraft manufacturing and of machinery and equipment manufacturing had annual increases in 2022 over 20% in current U.S. dollars, followed by medical and dental instruments and supplies; chemicals and chemical products (excluding pharmaceuticals); and railroad, military vehicles, and transport equipment nec, each with increases over 15%. U.S. KTI industries are highly geographically concentrated. (See the sidebar Geography of Domestic KTI Production.)
Annual percent changes in U.S. value added, by KTI industry: 2018–22
| Industry | 2018–19 | 2019–20 | 2020–21 | 2021–22 |
|---|---|---|---|---|
| Air and spacecraft and related machinery | 4.5 | -11.9 | 4.1 | 21.2 |
| Machinery and equipment nec | 3.8 | -4.9 | 8.6 | 21.1 |
| Medical and dental instruments and supplies | 1.3 | -4.6 | 5.0 | 17.3 |
| Chemicals and chemical products | 1.0 | -5.4 | 10.1 | 16.4 |
| Railroad, military vehicles, and transport equipment nec | 5.2 | -14.4 | 8.4 | 15.4 |
| Computer, electronic, and optical products | 1.5 | 2.4 | 5.6 | 12.4 |
| Electrical equipment | -0.7 | -4.9 | 10.1 | 8.8 |
| Motor vehicles, trailers, and semi-trailers | 0.2 | -9.0 | 10.3 | 8.1 |
| Weapons and ammunition | 13.4 | 21.0 | 0.7 | 7.8 |
| Pharmaceuticals, medicinal chemical, and botanical products | 11.1 | 8.1 | 9.5 | 7.3 |
| KTI manufacturing industries | 3.1 | -2.6 | 7.8 | 13.8 |
| All KTI industries | 4.8 | 2.2 | 10.5 | 11.7 |
| All manufacturing industries | 1.5 | -5.4 | 11.5 | 13.9 |
| Gross domestic product | 4.2 | -0.9 | 10.7 | 9.1 |
| Industry | 2018–19 | 2019–20 | 2020–21 | 2021–22 |
|---|---|---|---|---|
| IT and other information services | 5.6 | 4.5 | 13.3 | 11.2 |
| Software publishing | 11.9 | 18.8 | 17.3 | 7.9 |
| Scientific R&D services | 8.4 | 12.4 | 10.6 | 4.0 |
| KTI services | 7.4 | 9.0 | 13.9 | 9.3 |
| All KTI industries | 4.8 | 2.2 | 10.5 | 11.7 |
| Total private services | 5.1 | -0.6 | 11.3 | 7.2 |
| Gross domestic product | 4.2 | -0.9 | 10.7 | 9.1 |
GDP = gross domestic product; IT = information technology; KTI = knowledge and technology intensive; nec = not elsewhere classified.
Note(s):
Value added is the value of goods and services (gross output) minus the cost of intermediate inputs (energy, materials, and purchased services). Industry value added is a measure of an industry's contribution to overall GDP. KTI industries include high R&D intensive and medium-high R&D intensive industries based on a classification by the Organisation for Economic Co-operation and Development. The data have been crosswalked to the International Standard Industrial Classification, Revision 4. See Table SAKTI-2. Industry groups are at the top of the figure, and specific industries are sorted from smallest to largest based on annual percent change in 2021–22.
Source(s):
GDP data are from the Bureau of Economic Analysis, Industry Economic Accounts, accessed November 2023 (available at https://www.bea.gov/itable/national-gdp-and-personal-income); value-added data are from S&P Global IHS Markit, Comparative Industry Service special tabulations, October 2023.
Science and Engineering Indicators
Industries in the Global Economy
This section examines global statistics on KTI industries, starting with value added. Subsequent sections explore the participation of these industries in goods and services trade.
KTI industries produced $11.1 trillion globally in value added in 2022, a 5.6% increase in current U.S. dollars compared with a 15.8% post-pandemic rebound in 2021 following little change in 2019 and 2020, based on current U.S. dollar S&P Global data (Table SKTI-2). By comparison, global GDP increased 3.8% in 2022 following a pandemic-related drop in 2020 and a 13.5% increase in 2021 in current U.S. dollars based on International Monetary Fund statistics (IMF 2023b). Since 2018, KTI value added accounted for between 10% and 11% of global GDP, with 3% from KTI services industries and between 7% and 8% from KTI manufacturing industries (Table KTI-2). Overall, services represent a larger share of global GDP compared with manufacturing; within KTI industries globally, however, services value added has a smaller share compared with manufacturing.
Global KTI industries, by value added and share of global GDP: 2018–22
* = amount < 0.05.
GDP = gross domestic product; ISIC, Rev.4 = International Standard Industrial Classification, Revision 4; IT = information technology; KTI = knowledge and technology intensive; nec = not elsewhere classified.
Note(s):
Value added is the value of goods and services (gross output) minus the cost of intermediate inputs (energy, materials, and purchased services). KTI industries include high R&D intensive and medium-high R&D intensive industries based on a classification by the Organisation for Economic Co-operation and Development. Total private services corresponds to main services in ISIC, Rev.4.
Source(s):
Value added data are from S&P Global IHS Markit, Comparative Industry Service special tabulations, October 2023; GDP data are from International Monetary Fund World Economic Outlook, accessed November 2023 (available at https://www.imf.org/en/Publications/WEO/weo-database/2023/October), and Bureau of Economic Analysis, Industry Economic Accounts, accessed November 2023 (available at https://www.bea.gov/itable/national-gdp-and-personal-income).
Science and Engineering Indicators
The United States, China, the European Union (EU-27), Japan, and South Korea accounted for about 80% of global KTI value added in 2022 based on S&P Global data in current U.S. dollars (Table SKTI-2). In that year, China and the United States were the top two producers of KTI output ($3.0 trillion and $2.9 trillion, respectively), each representing over a quarter of global KTI value added, followed by the EU-27, with a 17.0% share ($1.9 trillion). (The EU-27 share includes Germany, with 5.2%, or 31% of the EU-27 share.) Another 9% of KTI value added originated from Japan (5.4%) and South Korea (3.6%).
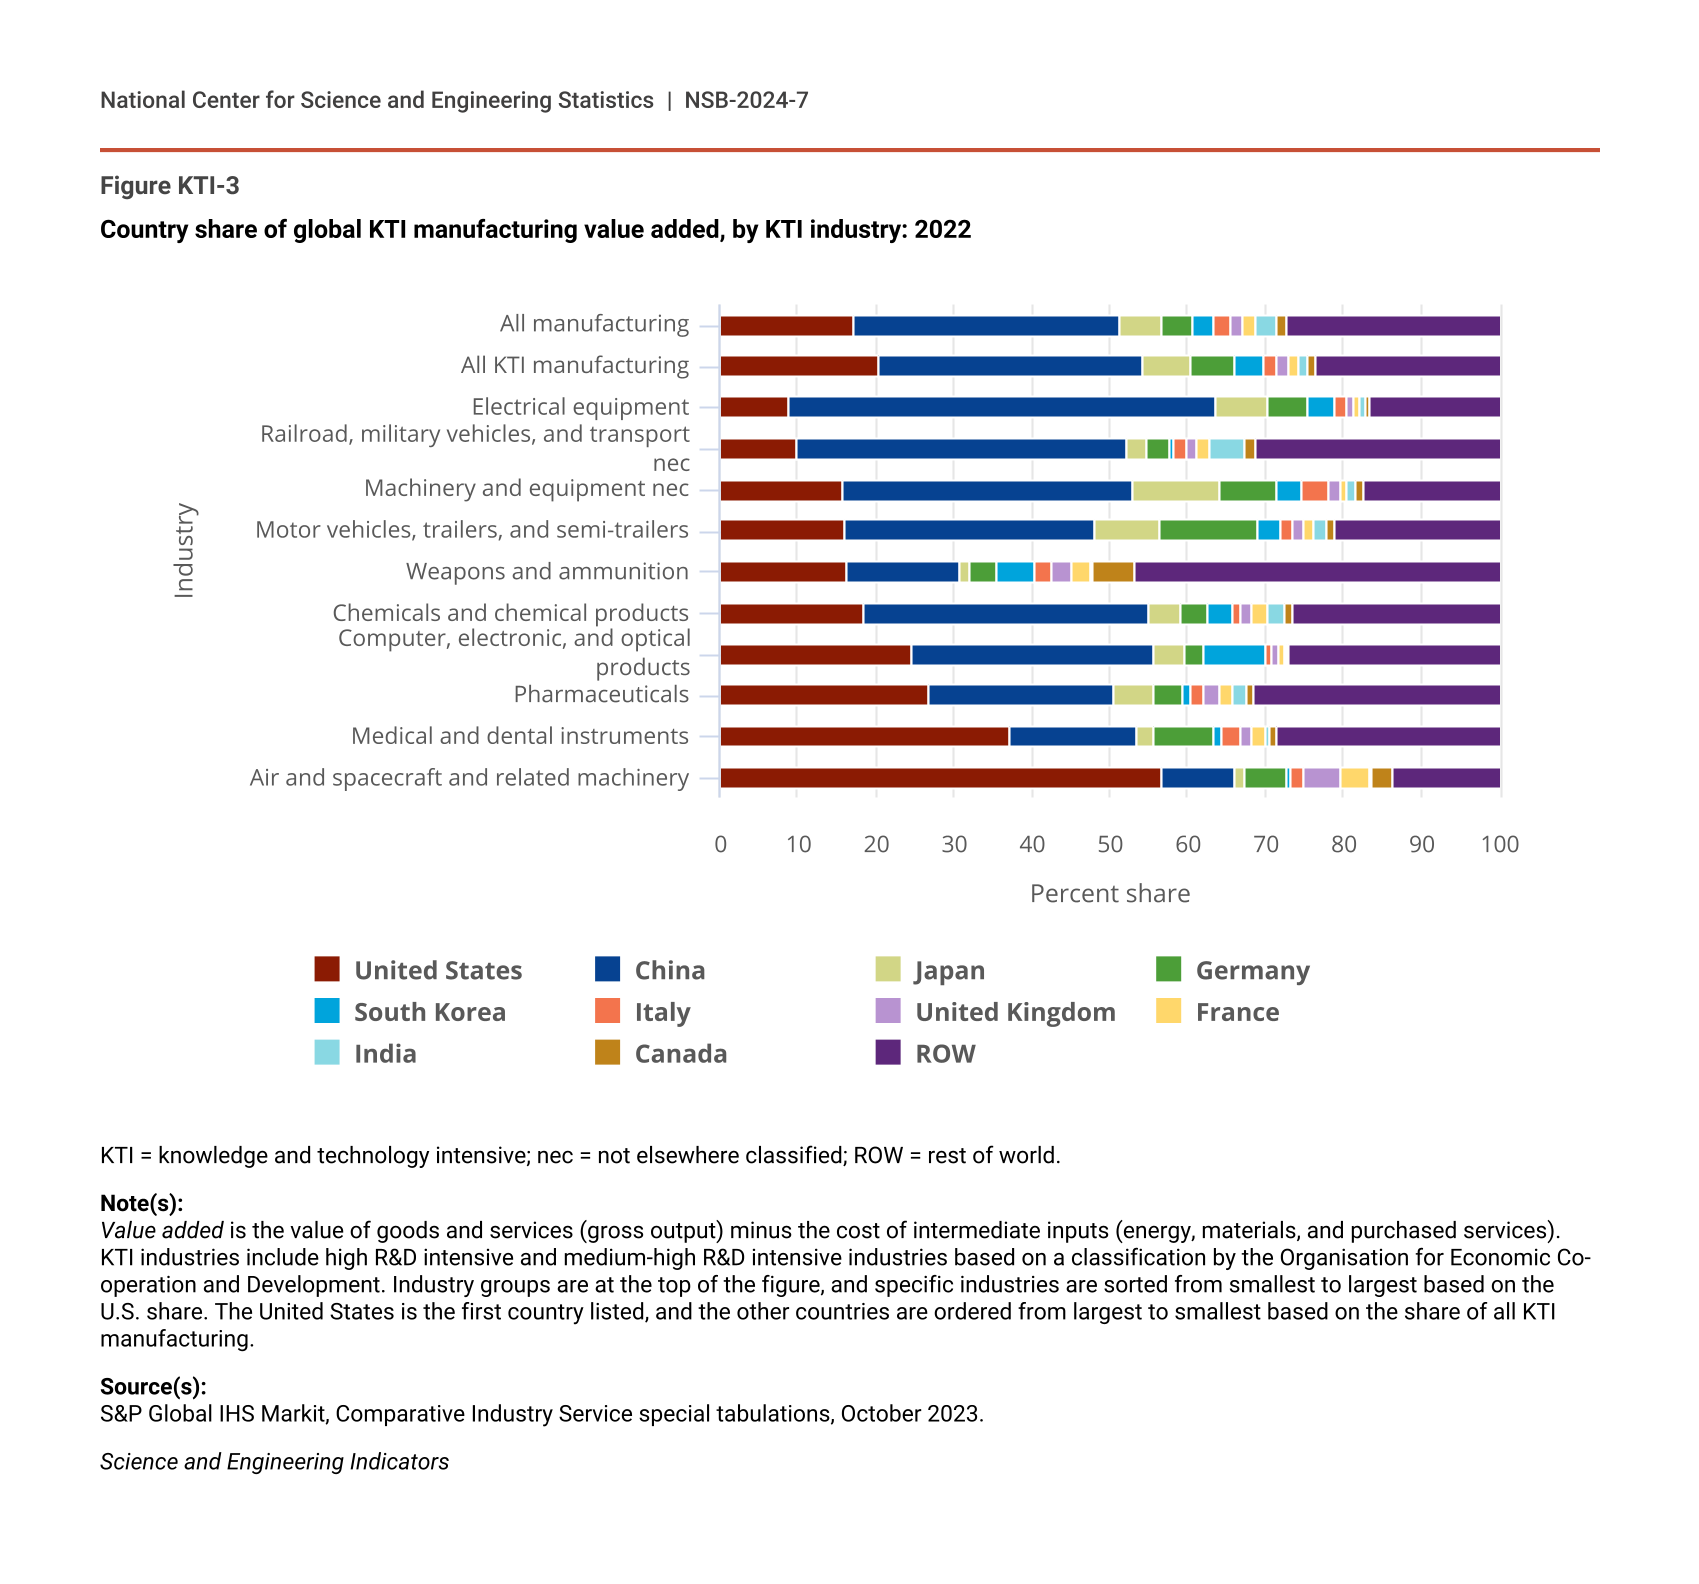
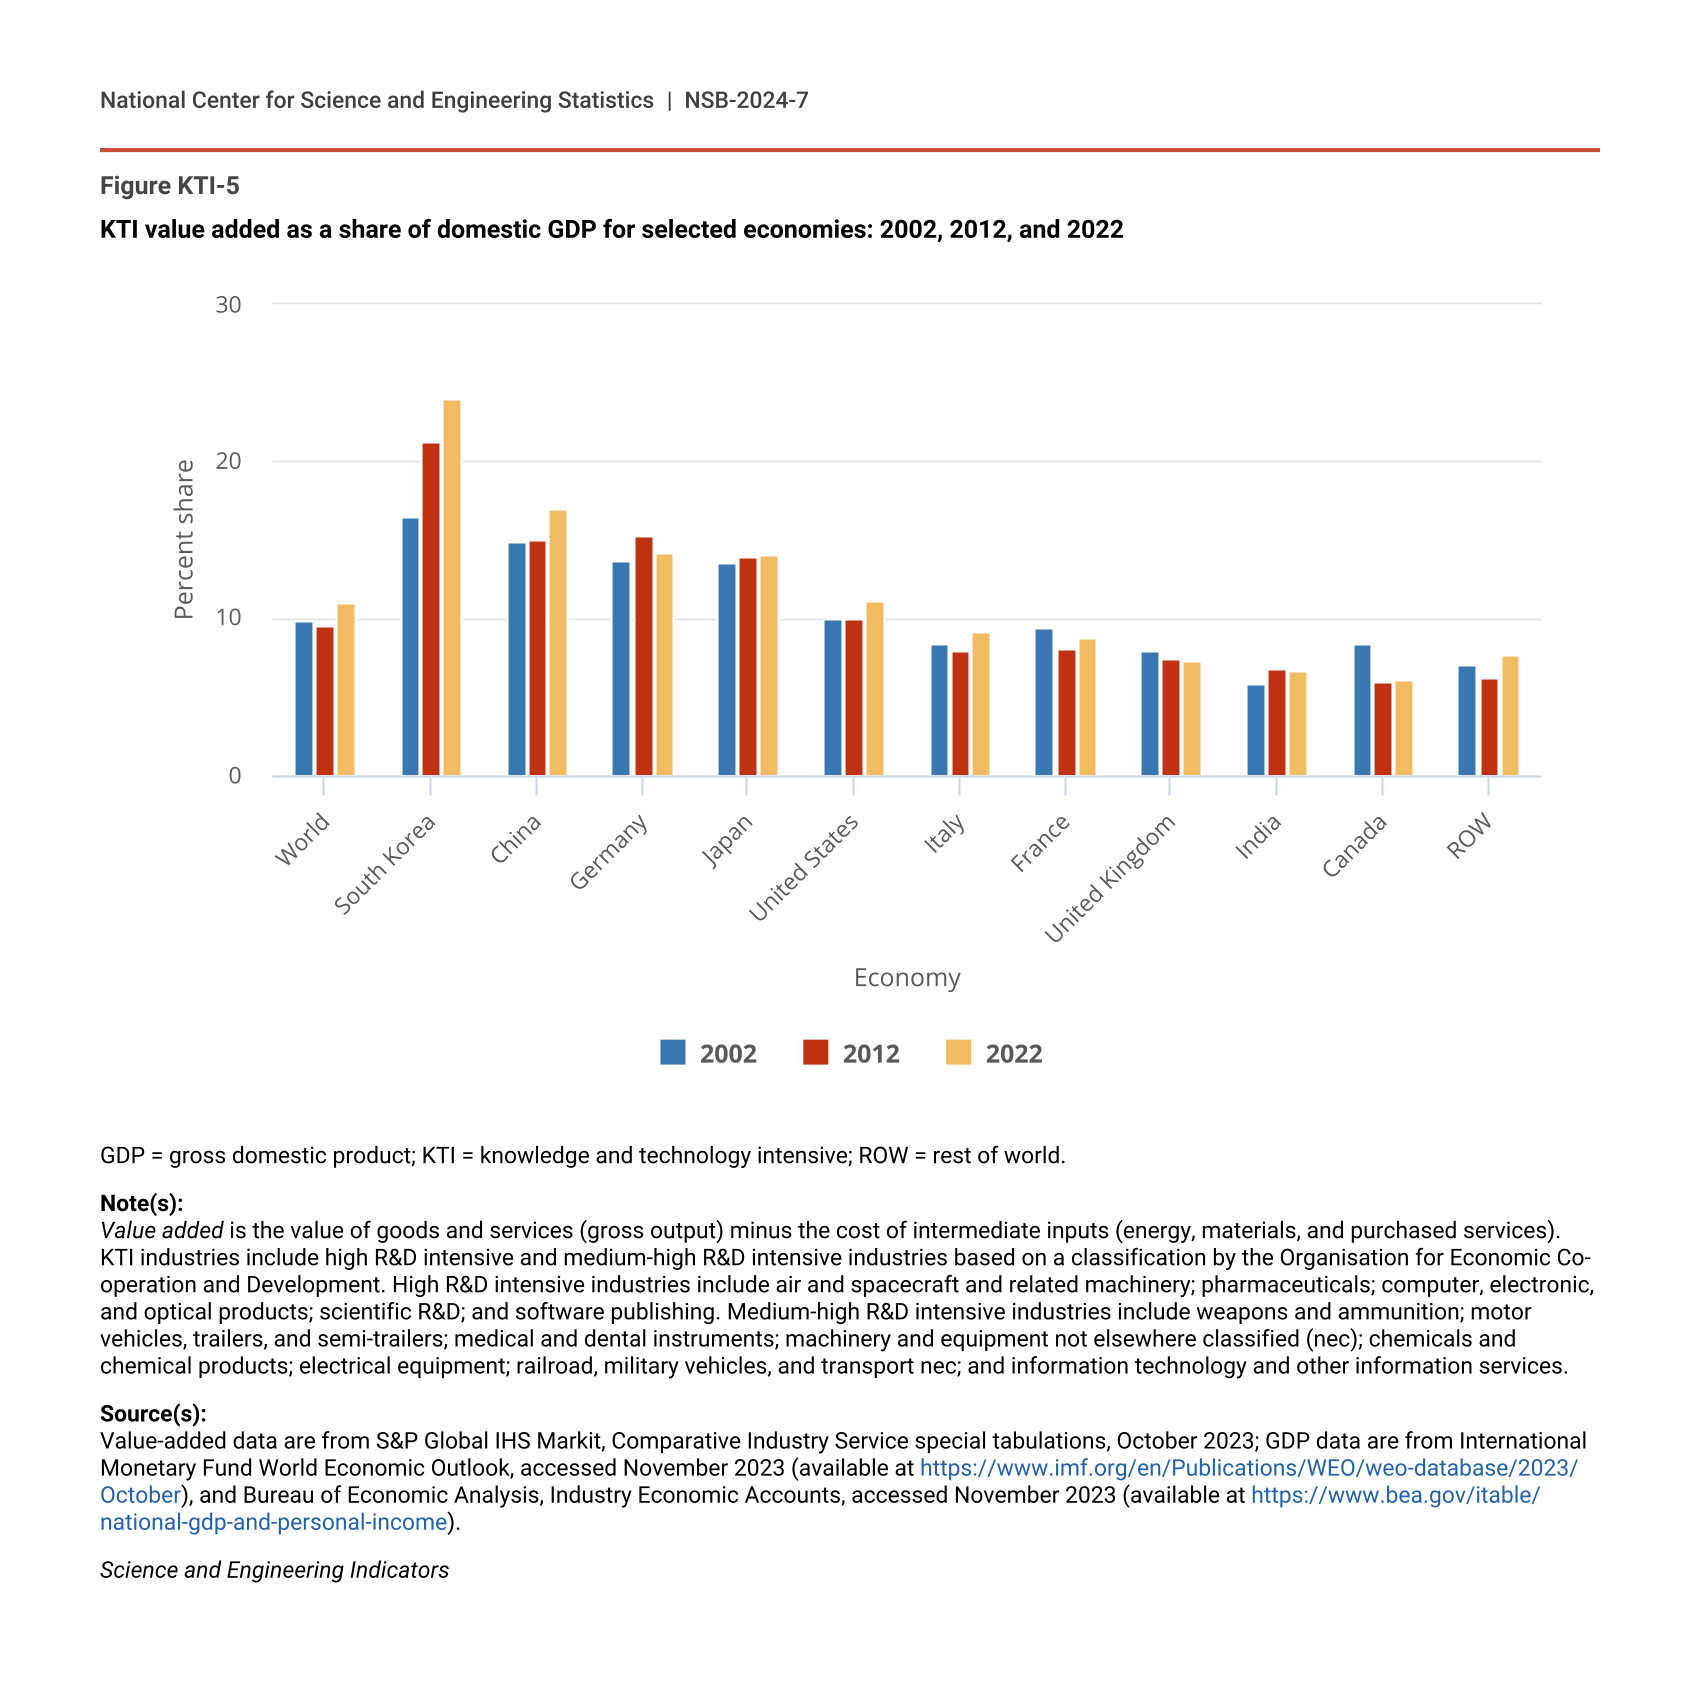
The aforementioned global shares vary across broad KTI sectors (Figure KTI-3 and Figure KTI-4). For manufacturing KTI output, China and the United States accounted for 34% and 20% of the global total, respectively. For services KTI output, these nations’ respective shares were almost reversed (12% for China and 40% for the United States), which is consistent with the larger share of total manufacturing in China’s GDP and of services in U.S. GDP. Another illustrative measure is KTI value-added intensity, which is the ratio of KTI value added relative to GDP. South Korea had the highest KTI value-added intensity since 2002 (Figure KTI-5). In 2022, this ratio was 24% for South Korea, followed by 17% for China. The U.S. KTI value-added intensity has been between 10% and 11% since 2002, similar to the range of global KTI value-added intensity—both at 11% in 2022. The intensity levels for Japan and Germany have been in the middle teens since 2002 (Figure KTI-5).
Country share of global KTI manufacturing value added, by KTI industry: 2022
| Industry | United States | China | Japan | Germany | South Korea | Italy | United Kingdom | France | India | Canada | ROW |
|---|---|---|---|---|---|---|---|---|---|---|---|
| Air and spacecraft and related machinery | 56.6 | 9.3 | 1.5 | 5.2 | 0.6 | 1.5 | 4.9 | 3.8 | 0.2 | 2.7 | 13.6 |
| Medical and dental instruments | 37.0 | 16.5 | 2.1 | 7.7 | 1.1 | 2.3 | 1.4 | 1.8 | 0.6 | 0.8 | 28.6 |
| Pharmaceuticals | 26.7 | 23.7 | 5.2 | 3.7 | 1.2 | 1.4 | 2.3 | 1.4 | 2.0 | 0.7 | 31.6 |
| Computer, electronic, and optical products | 24.7 | 30.9 | 4.0 | 2.6 | 8.0 | 0.6 | 0.9 | 0.8 | 0.3 | 0.4 | 26.9 |
| Chemicals and chemical products | 18.4 | 36.8 | 4.0 | 3.3 | 3.2 | 1.1 | 1.3 | 2.2 | 2.1 | 1.0 | 26.6 |
| Weapons and ammunition | 16.4 | 14.3 | 1.5 | 3.4 | 4.7 | 2.3 | 2.7 | 2.4 | 0.1 | 5.4 | 46.9 |
| Motor vehicles, trailers, and semi-trailers | 16.0 | 32.2 | 8.1 | 12.6 | 3.1 | 1.5 | 1.5 | 1.2 | 1.5 | 1.3 | 21.0 |
| Machinery and equipment nec | 15.8 | 37.0 | 11.2 | 7.3 | 3.3 | 3.5 | 1.6 | 0.8 | 0.9 | 1.2 | 17.3 |
| Railroad, military vehicles, and transport nec | 9.8 | 42.3 | 2.9 | 2.7 | 0.6 | 1.7 | 1.3 | 1.5 | 4.6 | 1.4 | 31.3 |
| Electrical equipment | 8.8 | 54.9 | 6.5 | 5.2 | 3.5 | 1.6 | 0.8 | 0.8 | 0.8 | 0.4 | 16.7 |
| All KTI manufacturing | 20.4 | 34.0 | 6.1 | 5.6 | 3.8 | 1.6 | 1.5 | 1.3 | 1.2 | 1.0 | 23.5 |
| All manufacturing | 17.0 | 34.3 | 5.4 | 4.0 | 2.8 | 1.9 | 1.6 | 1.6 | 2.7 | 1.3 | 27.4 |
KTI = knowledge and technology intensive; nec = not elsewhere classified; ROW = rest of world.
Note(s):
Value added is the value of goods and services (gross output) minus the cost of intermediate inputs (energy, materials, and purchased services). KTI industries include high R&D intensive and medium-high R&D intensive industries based on a classification by the Organisation for Economic Co-operation and Development. Industry groups are at the top of the figure, and specific industries are sorted from smallest to largest based on the U.S. share. The United States is the first country listed, and the other countries are ordered from largest to smallest based on the share of all KTI manufacturing.
Source(s):
S&P Global IHS Markit, Comparative Industry Service special tabulations, October 2023.
Science and Engineering Indicators
Country share of global KTI services value added for selected economies: 2002–22
| Year | Canada | China | France | Germany | India | Italy | Japan | South Korea | United Kingdom | United States |
|---|---|---|---|---|---|---|---|---|---|---|
| 2002 | 1.6 | 2.1 | 6.8 | 5.7 | 1.3 | 3.8 | 14.4 | 3.2 | 5.9 | 38.1 |
| 2003 | 1.7 | 1.9 | 7.4 | 6.1 | 1.4 | 4.2 | 14.1 | 3.2 | 6.6 | 34.8 |
| 2004 | 1.8 | 2.0 | 7.5 | 6.3 | 1.6 | 4.2 | 13.3 | 3.3 | 6.9 | 33.4 |
| 2005 | 1.9 | 2.4 | 7.1 | 6.1 | 1.8 | 4.0 | 12.3 | 3.8 | 7.0 | 32.7 |
| 2006 | 2.0 | 2.9 | 7.1 | 6.0 | 1.9 | 3.9 | 11.1 | 4.3 | 6.8 | 32.0 |
| 2007 | 2.0 | 3.5 | 7.2 | 6.5 | 2.2 | 4.0 | 9.9 | 4.3 | 7.3 | 29.4 |
| 2008 | 1.8 | 4.0 | 7.1 | 6.1 | 2.2 | 3.8 | 12.1 | 3.4 | 6.0 | 29.2 |
| 2009 | 1.8 | 5.0 | 6.7 | 5.8 | 2.4 | 3.7 | 13.2 | 3.2 | 5.0 | 29.6 |
| 2010 | 1.9 | 5.4 | 6.1 | 5.2 | 2.8 | 3.3 | 12.6 | 3.4 | 4.9 | 29.9 |
| 2011 | 1.9 | 6.2 | 5.9 | 5.6 | 2.9 | 3.1 | 11.9 | 3.5 | 4.7 | 29.1 |
| 2012 | 1.9 | 7.5 | 5.5 | 5.3 | 2.9 | 2.8 | 11.8 | 3.5 | 4.5 | 29.3 |
| 2013 | 1.9 | 8.3 | 5.5 | 5.8 | 3.1 | 2.8 | 9.5 | 3.6 | 4.1 | 29.9 |
| 2014 | 1.8 | 9.2 | 5.4 | 5.7 | 3.4 | 2.6 | 8.7 | 4.1 | 4.4 | 30.1 |
| 2015 | 1.7 | 9.9 | 4.8 | 5.1 | 3.8 | 2.4 | 7.9 | 3.6 | 4.4 | 33.3 |
| 2016 | 1.7 | 9.6 | 4.8 | 5.1 | 4.0 | 2.3 | 8.5 | 3.6 | 3.9 | 34.0 |
| 2017 | 1.7 | 10.0 | 4.8 | 5.0 | 4.3 | 2.3 | 7.7 | 3.6 | 3.6 | 33.7 |
| 2018 | 1.7 | 10.7 | 4.8 | 5.2 | 4.0 | 2.3 | 7.1 | 3.7 | 3.7 | 34.2 |
| 2019 | 1.7 | 10.7 | 4.5 | 5.1 | 4.1 | 2.1 | 7.1 | 3.5 | 3.6 | 35.2 |
| 2020 | 1.5 | 10.7 | 4.7 | 5.2 | 3.6 | 2.0 | 5.2 | 3.6 | 3.5 | 37.8 |
| 2021 | 1.6 | 12.3 | 4.5 | 5.0 | 3.7 | 1.9 | 4.5 | 3.5 | 3.5 | 37.6 |
| 2022 | 1.7 | 11.9 | 4.3 | 4.4 | 4.1 | 1.7 | 3.7 | 3.3 | 3.3 | 39.7 |
KTI = knowledge and technology intensive.
Note(s):
Value added is the value of goods and services (gross output) minus the cost of intermediate inputs (energy, materials, and purchased services). KTI industries include high R&D intensive and medium-high R&D intensive industries based on a classification by the Organisation for Economic Co-operation and Development. KTI services industries include information technology and other information services, software publishing, and scientific R&D.
Source(s):
S&P Global IHS Markit, Comparative Industry Service special tabulations, October 2023.
Science and Engineering Indicators
KTI value added as a share of domestic GDP for selected economies: 2002, 2012, and 2022
| Economy | 2002 | 2012 | 2022 |
|---|---|---|---|
| World | 9.8 | 9.5 | 11.0 |
| South Korea | 16.5 | 21.3 | 24.0 |
| China | 14.9 | 15.0 | 17.0 |
| Germany | 13.7 | 15.3 | 14.2 |
| Japan | 13.6 | 14.0 | 14.1 |
| United States | 9.9 | 9.9 | 11.2 |
| Italy | 8.3 | 7.9 | 9.2 |
| France | 9.4 | 8.1 | 8.7 |
| United Kingdom | 7.9 | 7.4 | 7.3 |
| India | 5.9 | 6.8 | 6.7 |
| Canada | 8.3 | 6.0 | 6.1 |
| ROW | 7.0 | 6.2 | 7.7 |
GDP = gross domestic product; KTI = knowledge and technology intensive; ROW = rest of world.
Note(s):
Value added is the value of goods and services (gross output) minus the cost of intermediate inputs (energy, materials, and purchased services). KTI industries include high R&D intensive and medium-high R&D intensive industries based on a classification by the Organisation for Economic Co-operation and Development. High R&D intensive industries include air and spacecraft and related machinery; pharmaceuticals; computer, electronic, and optical products; scientific R&D; and software publishing. Medium-high R&D intensive industries include weapons and ammunition; motor vehicles, trailers, and semi-trailers; medical and dental instruments; machinery and equipment not elsewhere classified (nec); chemicals and chemical products; electrical equipment; railroad, military vehicles, and transport nec; and information technology and other information services.
Source(s):
Value-added data are from S&P Global IHS Markit, Comparative Industry Service special tabulations, October 2023; GDP data are from International Monetary Fund World Economic Outlook, accessed November 2023 (available at https://www.imf.org/en/Publications/WEO/weo-database/2023/October), and Bureau of Economic Analysis, Industry Economic Accounts, accessed November 2023 (available at https://www.bea.gov/itable/national-gdp-and-personal-income).
Science and Engineering Indicators
Sectoral and Industry Distributions
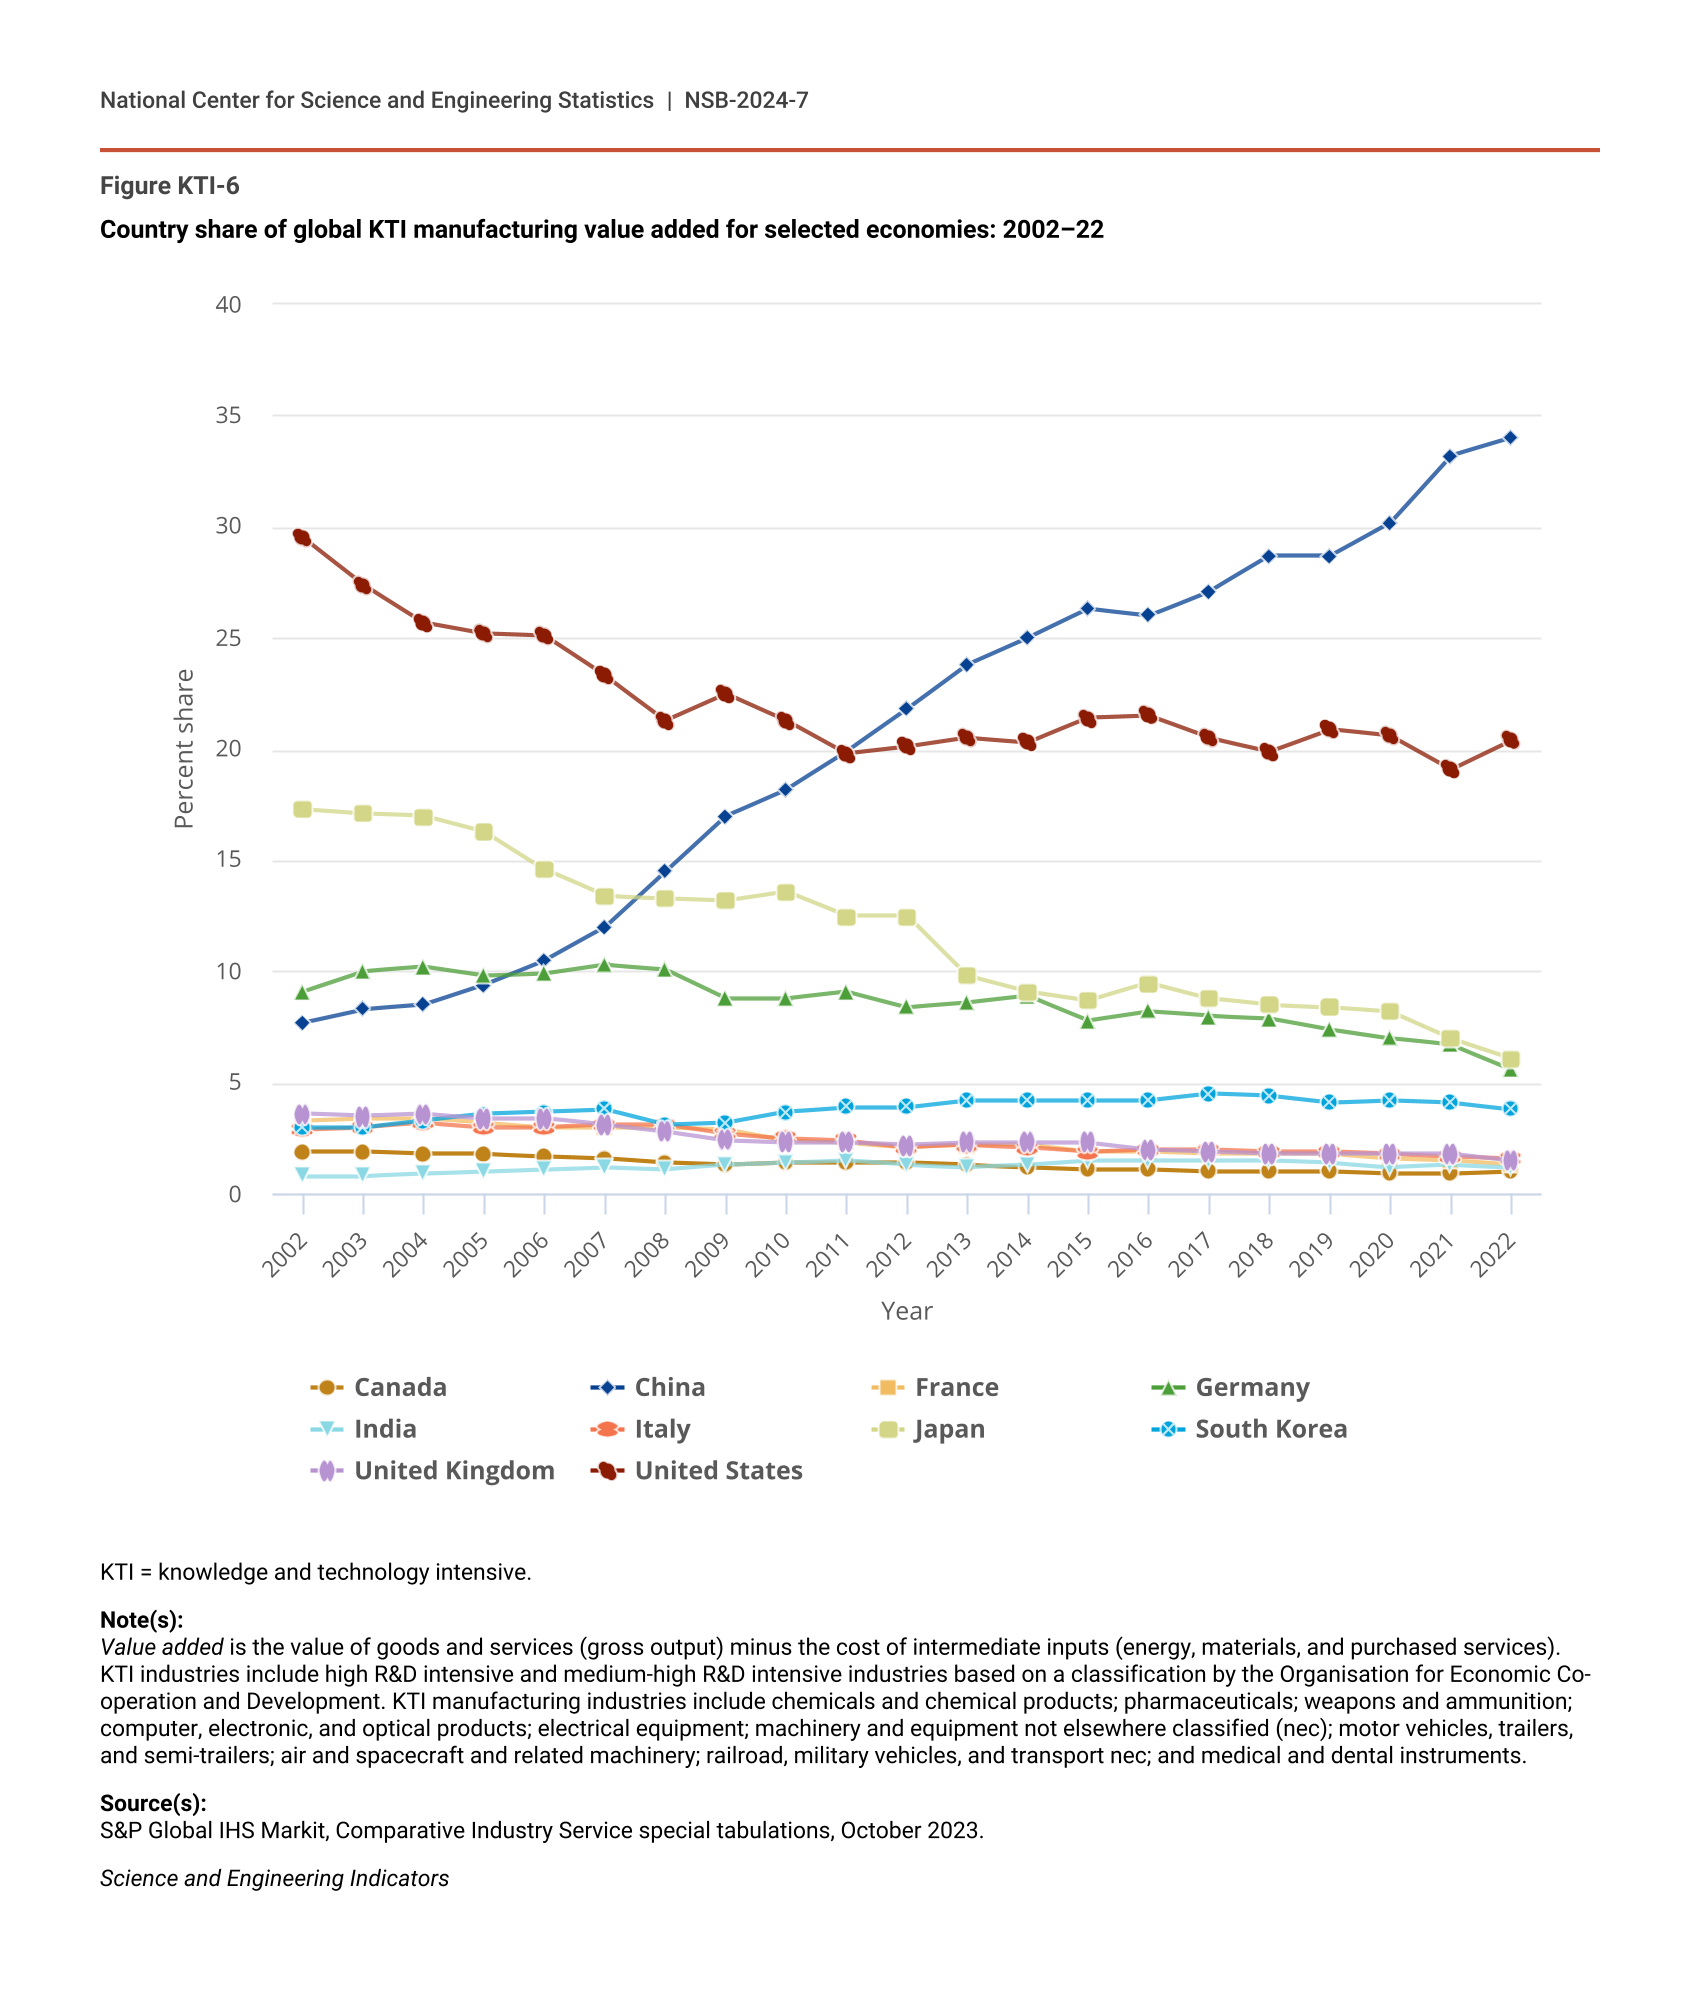
KTI manufacturing accounted for 71% of global KTI value added in 2022 compared with the 17% share of overall manufacturing in value added across all industries, given the higher R&D intensity of manufacturing (see the forthcoming Indicators 2024 report “Research and Development: U.S. Trends and International Comparisons”). Figure KTI-6 shows trends in global KTI manufacturing value added of the largest producers. Beginning in 2012 and continuing through 2022, China has maintained its stature as the world’s largest KTI manufacturer despite the recent geopolitical and pandemic-related disruptions. The long-term increase in China’s KTI manufacturing share was accompanied by the decline in the KTI manufacturing shares of the United States, Japan, and Germany, which mimics trends in total manufacturing. China’s manufacturing KTI value added accounted for about a third of global manufacturing KTI value added in 2022, compared with 22% in 2012 and 8% in 2002 (Figure KTI-6). In contrast, the United States accounted for around 20% of global manufacturing KTI value added since 2011, down from 25% in 2006 and from about 30% in 2002. The shares for Japan and Germany also declined over this period.
Country share of global KTI manufacturing value added for selected economies: 2002–22
| Year | Canada | China | France | Germany | India | Italy | Japan | South Korea | United Kingdom | United States |
|---|---|---|---|---|---|---|---|---|---|---|
| 2002 | 1.9 | 7.7 | 3.3 | 9.1 | 0.8 | 2.9 | 17.3 | 3.0 | 3.6 | 29.5 |
| 2003 | 1.9 | 8.3 | 3.4 | 10.0 | 0.8 | 3.0 | 17.1 | 3.0 | 3.5 | 27.4 |
| 2004 | 1.8 | 8.5 | 3.4 | 10.2 | 0.9 | 3.2 | 17.0 | 3.3 | 3.6 | 25.7 |
| 2005 | 1.8 | 9.4 | 3.2 | 9.8 | 1.0 | 3.0 | 16.3 | 3.6 | 3.4 | 25.2 |
| 2006 | 1.7 | 10.5 | 3.0 | 9.9 | 1.1 | 3.0 | 14.6 | 3.7 | 3.4 | 25.1 |
| 2007 | 1.6 | 12.0 | 3.0 | 10.3 | 1.2 | 3.1 | 13.4 | 3.8 | 3.1 | 23.3 |
| 2008 | 1.4 | 14.5 | 3.0 | 10.1 | 1.1 | 3.1 | 13.3 | 3.1 | 2.8 | 21.3 |
| 2009 | 1.3 | 17.0 | 2.9 | 8.8 | 1.3 | 2.7 | 13.2 | 3.2 | 2.4 | 22.5 |
| 2010 | 1.4 | 18.2 | 2.4 | 8.8 | 1.4 | 2.5 | 13.6 | 3.7 | 2.3 | 21.3 |
| 2011 | 1.4 | 19.9 | 2.3 | 9.1 | 1.5 | 2.4 | 12.5 | 3.9 | 2.3 | 19.8 |
| 2012 | 1.4 | 21.8 | 2.1 | 8.4 | 1.3 | 2.1 | 12.5 | 3.9 | 2.2 | 20.1 |
| 2013 | 1.3 | 23.8 | 2.2 | 8.6 | 1.2 | 2.2 | 9.8 | 4.2 | 2.3 | 20.5 |
| 2014 | 1.2 | 25.0 | 2.2 | 8.9 | 1.3 | 2.1 | 9.1 | 4.2 | 2.3 | 20.3 |
| 2015 | 1.1 | 26.3 | 1.9 | 7.8 | 1.5 | 1.9 | 8.7 | 4.2 | 2.3 | 21.4 |
| 2016 | 1.1 | 26.0 | 1.9 | 8.2 | 1.5 | 2.0 | 9.5 | 4.2 | 2.0 | 21.5 |
| 2017 | 1.0 | 27.1 | 1.8 | 8.0 | 1.5 | 2.0 | 8.8 | 4.5 | 1.9 | 20.5 |
| 2018 | 1.0 | 28.7 | 1.8 | 7.9 | 1.5 | 1.9 | 8.5 | 4.4 | 1.8 | 19.9 |
| 2019 | 1.0 | 28.7 | 1.8 | 7.4 | 1.4 | 1.9 | 8.4 | 4.1 | 1.8 | 20.9 |
| 2020 | 0.9 | 30.2 | 1.6 | 7.0 | 1.2 | 1.8 | 8.2 | 4.2 | 1.8 | 20.6 |
| 2021 | 0.9 | 33.2 | 1.5 | 6.7 | 1.3 | 1.7 | 7.0 | 4.1 | 1.8 | 19.1 |
| 2022 | 1.0 | 34.0 | 1.3 | 5.6 | 1.2 | 1.6 | 6.1 | 3.8 | 1.5 | 20.4 |
KTI = knowledge and technology intensive.
Note(s):
Value added is the value of goods and services (gross output) minus the cost of intermediate inputs (energy, materials, and purchased services). KTI industries include high R&D intensive and medium-high R&D intensive industries based on a classification by the Organisation for Economic Co-operation and Development. KTI manufacturing industries include chemicals and chemical products; pharmaceuticals; weapons and ammunition; computer, electronic, and optical products; electrical equipment; machinery and equipment not elsewhere classified (nec); motor vehicles, trailers, and semi-trailers; air and spacecraft and related machinery; railroad, military vehicles, and transport nec; and medical and dental instruments.
Source(s):
S&P Global IHS Markit, Comparative Industry Service special tabulations, October 2023.
Science and Engineering Indicators
In terms of specific industries, the United States had the largest 2022 global shares of value added in two KTI manufacturing industries—air and spacecraft (57%) and medical and dental instruments (37%)—and was on par with China in pharmaceuticals and in weapons and ammunition manufacturing (Figure KTI-3). China had the largest shares in the other six KTI manufacturing industries: electrical equipment (55%); railroad, military vehicles, and other transport equipment nec (42%); machinery and equipment nec (37%); motor vehicles, trailers, and semi-trailers (32%); chemicals and chemical products (excluding pharmaceuticals) (37%); and computer, electronic, and optical products (including semiconductors) (31%). The only other countries with double-digit global shares in individual KTI manufacturing industries in 2022 were Germany, which accounted for 13% of global value added in motor vehicles, trailers, and semi-trailers, and Japan, which had an 11% share in machinery and equipment.
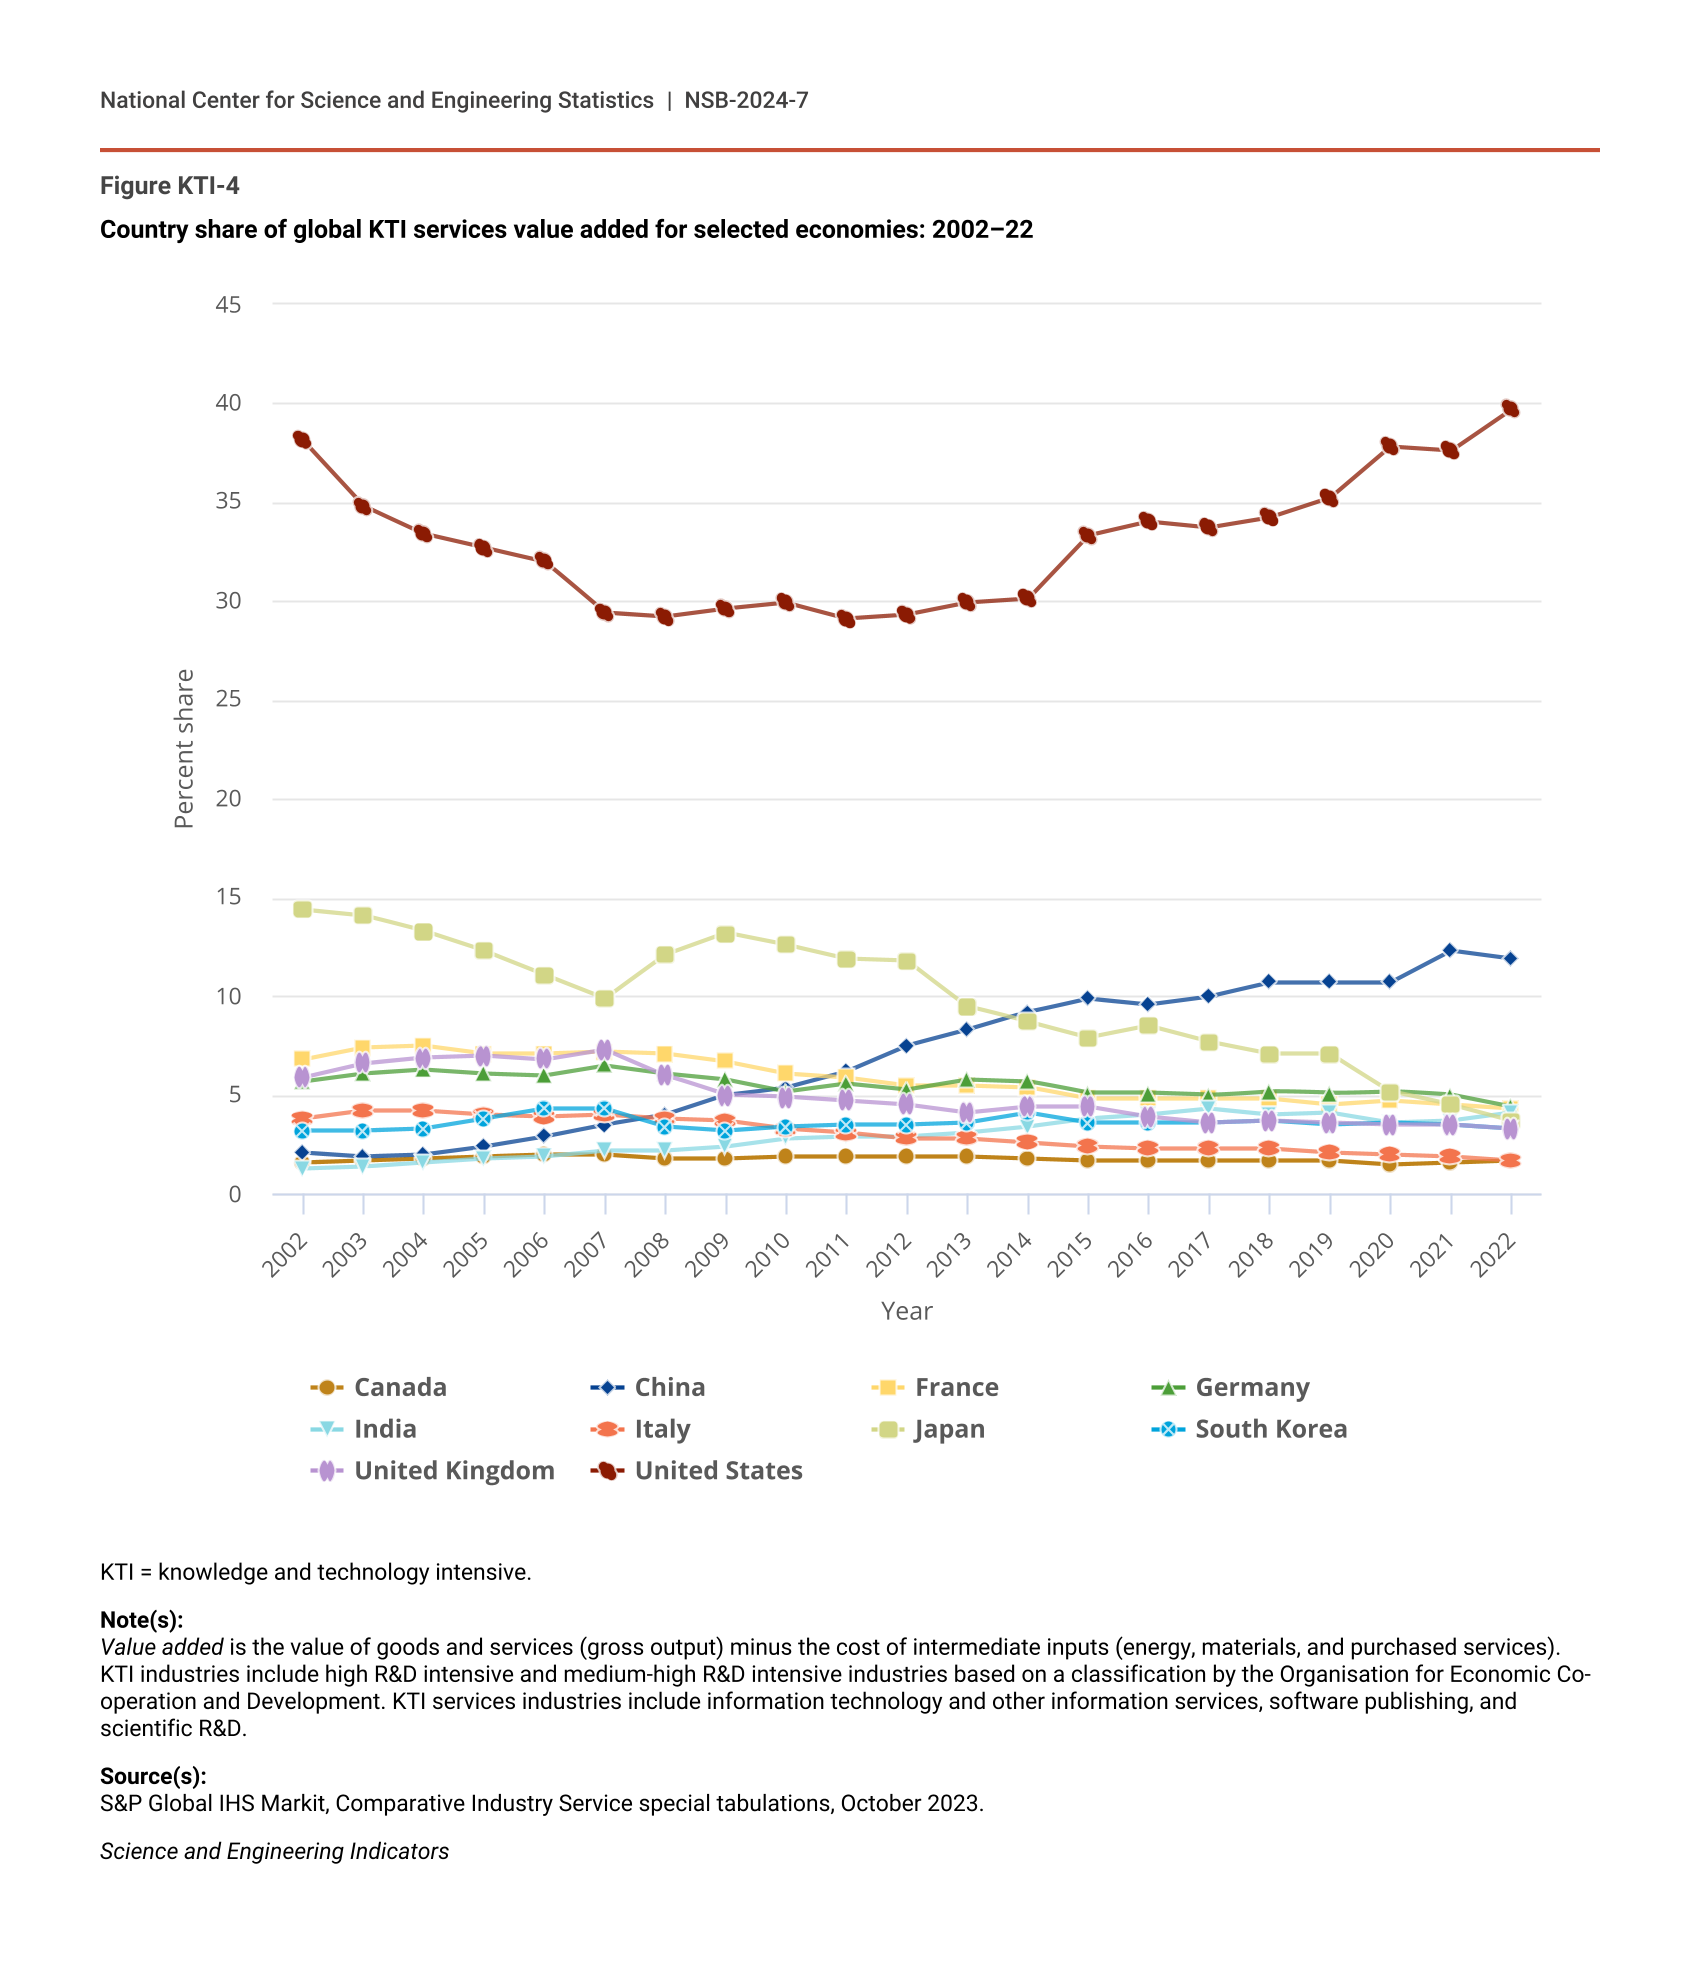
The United States continues to lead global value added by KTI services industries, reaching a peak of 40% in 2022 (Figure KTI-4). That year, China had the second-largest global share in KTI services value added (12%), which had increased gradually from the low single digits in the early 2000s to 9% or more since 2014. On the other hand, Japan’s share of global KTI services value added declined from 14% in 2002 to below 5% since 2020. Over this period, the shares of Germany and France in global KTI services value added declined from the high single digits to the low single digits, whereas India’s shares increased, though from a smaller base and gradually, to 4% in 2022.
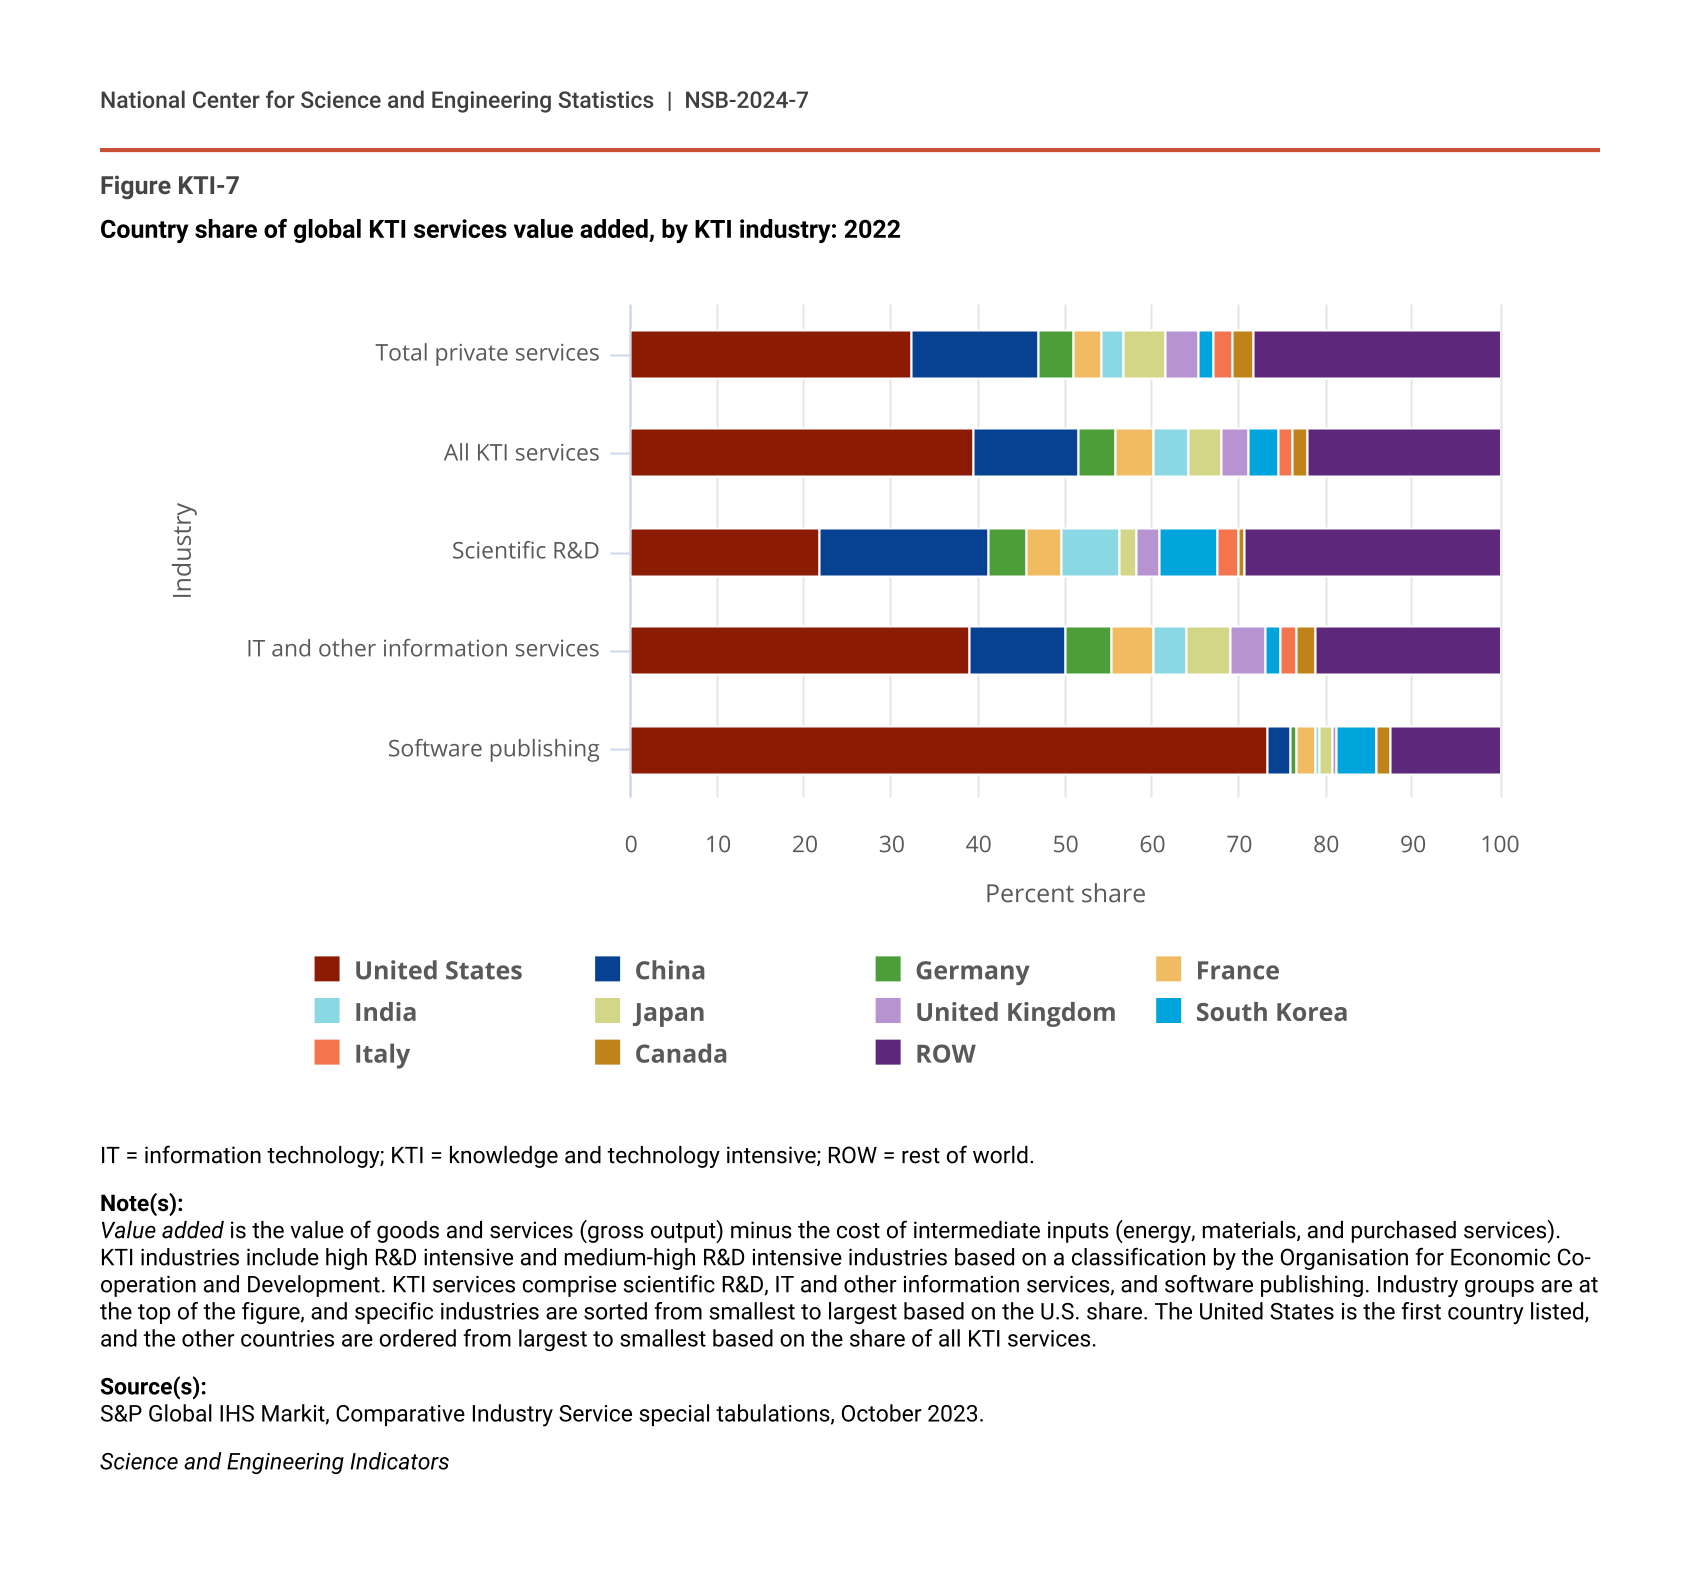
In terms of individual industries, the United States produced about three-fourths of global value added from the software publishing industry in 2022, followed by South Korea (4%) and France (2%) (Figure KTI-7). For IT and other information services, the share was 39% for the United States, followed by China (11%) and Germany, Japan, and France (each with about a 5% share). Last, the United States and China had similar shares in global scientific R&D services value added, 22% and 19% respectively, followed by India and South Korea, each with about a 7% share.
Country share of global KTI services value added, by KTI industry: 2022
| Industry | United States | China | Germany | France | India | Japan | United Kingdom | South Korea | Italy | Canada | ROW |
|---|---|---|---|---|---|---|---|---|---|---|---|
| Software publishing | 73.3 | 2.8 | 0.7 | 2.1 | 0.4 | 1.6 | 0.5 | 4.5 | 0.0 | 1.6 | 12.5 |
| IT and other information services | 39.2 | 10.9 | 5.4 | 4.8 | 3.8 | 5.0 | 4.1 | 1.6 | 1.9 | 2.1 | 21.2 |
| Scientific R&D | 21.8 | 19.4 | 4.2 | 4.3 | 6.7 | 1.8 | 2.7 | 6.6 | 2.4 | 0.8 | 29.2 |
| All KTI services | 39.7 | 11.9 | 4.4 | 4.3 | 4.1 | 3.7 | 3.3 | 3.3 | 1.7 | 1.7 | 22.0 |
| Total private services | 32.3 | 14.8 | 4.0 | 3.0 | 2.7 | 4.9 | 3.7 | 1.7 | 2.3 | 2.3 | 28.3 |
IT = information technology; KTI = knowledge and technology intensive; ROW = rest of world.
Note(s):
Value added is the value of goods and services (gross output) minus the cost of intermediate inputs (energy, materials, and purchased services). KTI industries include high R&D intensive and medium-high R&D intensive industries based on a classification by the Organisation for Economic Co-operation and Development. KTI services comprise scientific R&D, IT and other information services, and software publishing. Industry groups are at the top of the figure, and specific industries are sorted from smallest to largest based on the U.S. share. The United States is the first country listed, and the other countries are ordered from largest to smallest based on the share of all KTI services.
Source(s):
S&P Global IHS Markit, Comparative Industry Service special tabulations, October 2023.
Science and Engineering Indicators
Global Semiconductor Production
Semiconductors (also called microchips or computer chips) are key components of critical and emerging technologies and products such as artificial intelligence, quantum computing, autonomous or electric vehicles (EVs), and 5G communications (CRS 2020, 2023b), underpinning economic and national security (CRS 2023c; DOD/DSB 2022; EU 2023; NSTC 2022; VerWey 2019). The 2021 Creating Helpful Incentives to Produce Semiconductors (CHIPS) for America program (Title XCIX of Public Law 116-283, Fiscal Year 2021 National Defense Authorization Act) and the subsequent CHIPS and Science Act of 2022 (Public Law 117-167) aim to increase domestic semiconductor manufacturing capacity. The CHIPS and Science Act appropriated $52.7 billion to revitalize the U.S. semiconductor industry through support of U.S. semiconductor fabrication and technology development along the supply chain, including initiatives supporting R&D, workforce development, and national defense across several agencies and international partners (CRS 2023c; Zimmermann 2022).
Semiconductor production occurs along global value chains (GVCs) comprising R&D, engineering, and design; fabrication; and assembly, testing, and packing (ATP) stages (CRS 2023b). Modular production and cost advantages in Asia facilitated the separation of design and production starting in the late 1970s and early 1980s, with the emergence of chips foundries in Taiwan and other Southeast Asian locations performing contract manufacturing for design-only or fabless companies (Kuan and West 2023). This dynamic was accompanied by foreign direct investment in the region by semiconductor integrated device manufacturers and other firms in the semiconductor supply chain (CRS 2020; Yoffie 1993). Thus, although the United States has led semiconductor R&D and innovation (see the forthcoming Indicators 2024 report “Research and Development: U.S. Trends and International Comparisons” and the Indicators 2024 report “Invention, Knowledge Transfer, and Innovation”), semiconductor fabrication and ATP manufacturing services have been highly concentrated in Asia for decades, impacting trade and investment patterns in IT. In particular, China, Taiwan, and South Korea have substantially increased their global shares in production and trade of semiconductors and related electronic products over the last 20 years (Branstetter and Li 2023; CRS 2020; Torsekar and VerWey 2019).
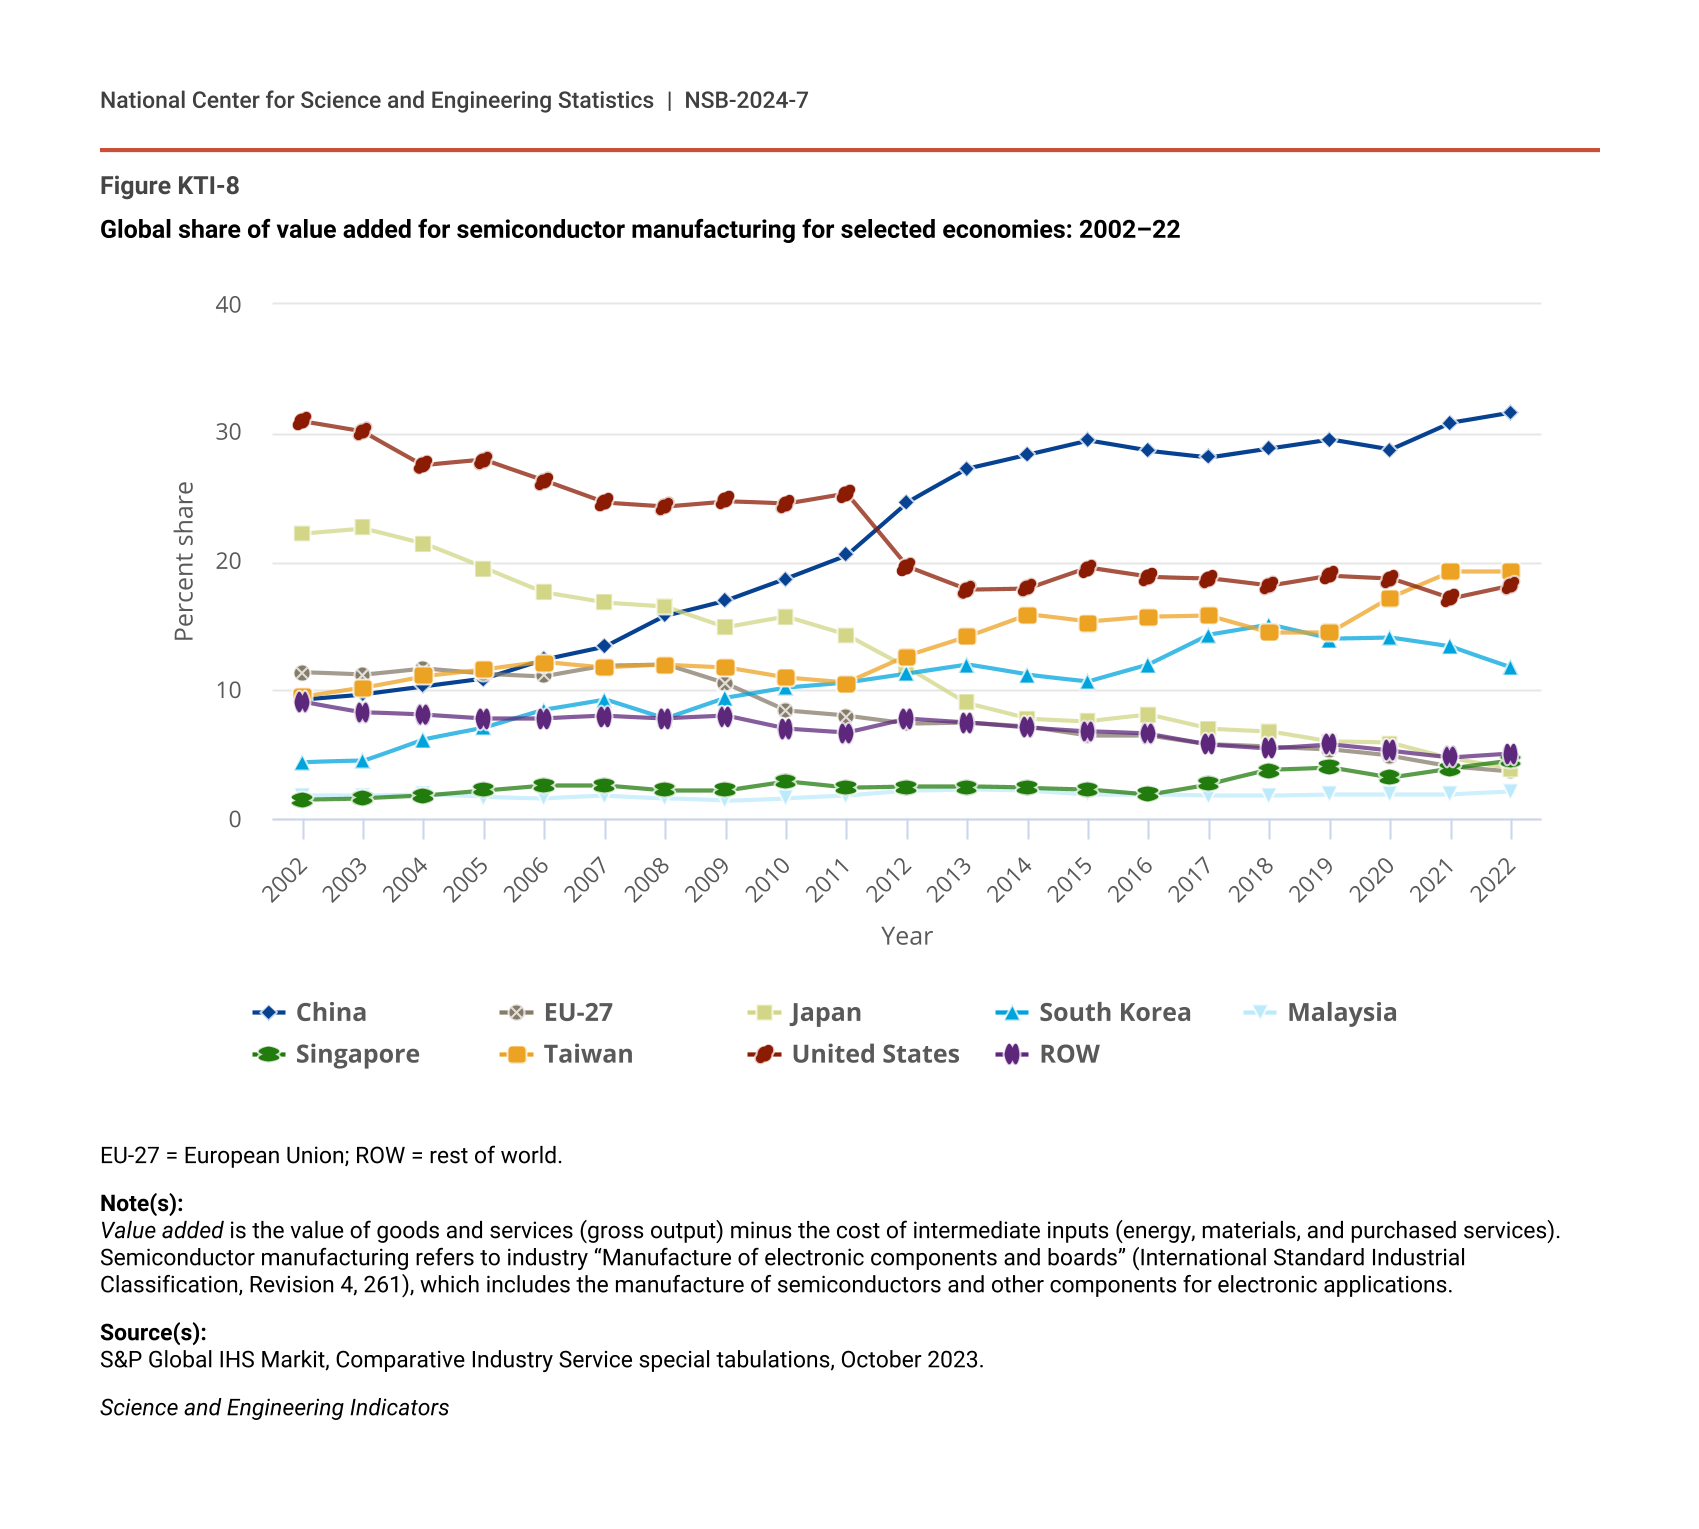
Semiconductor production is highly concentrated, with the top four producing locations accounting for 81% and the top eight for 95% of global semiconductor value added in 2022. Further, six of the top eight were in East Asia. China alone accounted for almost a third (32%), followed by Taiwan (19%), the United States (18%), South Korea (12%), Singapore (4%), and Japan (4%) (Figure KTI-8). The EU-27 and Malaysia were next, with global shares between 2% and 4%.
Global share of value added for semiconductor manufacturing for selected economies: 2002–22
| Year | China | EU-27 | Japan | South Korea | Malaysia | Singapore | Taiwan | United States | ROW |
|---|---|---|---|---|---|---|---|---|---|
| 2002 | 9.3 | 11.4 | 22.2 | 4.4 | 1.8 | 1.5 | 9.5 | 30.9 | 9.1 |
| 2003 | 9.7 | 11.2 | 22.6 | 4.5 | 1.8 | 1.6 | 10.2 | 30.1 | 8.3 |
| 2004 | 10.3 | 11.7 | 21.4 | 6.2 | 1.9 | 1.8 | 11.1 | 27.5 | 8.1 |
| 2005 | 10.9 | 11.3 | 19.5 | 7.1 | 1.7 | 2.2 | 11.6 | 27.9 | 7.8 |
| 2006 | 12.4 | 11.1 | 17.6 | 8.5 | 1.6 | 2.6 | 12.2 | 26.3 | 7.8 |
| 2007 | 13.4 | 11.9 | 16.8 | 9.3 | 1.8 | 2.6 | 11.8 | 24.6 | 8.0 |
| 2008 | 15.8 | 12.0 | 16.5 | 7.8 | 1.6 | 2.2 | 12.0 | 24.3 | 7.8 |
| 2009 | 17.0 | 10.5 | 14.9 | 9.4 | 1.4 | 2.2 | 11.8 | 24.7 | 8.0 |
| 2010 | 18.7 | 8.4 | 15.7 | 10.2 | 1.6 | 2.9 | 11.0 | 24.5 | 7.0 |
| 2011 | 20.5 | 8.0 | 14.3 | 10.6 | 1.8 | 2.4 | 10.6 | 25.3 | 6.7 |
| 2012 | 24.6 | 7.4 | 11.8 | 11.3 | 2.2 | 2.5 | 12.7 | 19.6 | 7.8 |
| 2013 | 27.2 | 7.5 | 9.0 | 12.0 | 2.3 | 2.5 | 14.2 | 17.8 | 7.5 |
| 2014 | 28.3 | 7.2 | 7.8 | 11.2 | 2.2 | 2.4 | 15.9 | 17.9 | 7.1 |
| 2015 | 29.4 | 6.5 | 7.6 | 10.7 | 1.9 | 2.3 | 15.3 | 19.5 | 6.8 |
| 2016 | 28.6 | 6.5 | 8.1 | 12.0 | 1.9 | 1.9 | 15.7 | 18.8 | 6.6 |
| 2017 | 28.1 | 5.8 | 7.0 | 14.3 | 1.8 | 2.7 | 15.8 | 18.7 | 5.8 |
| 2018 | 28.8 | 5.6 | 6.8 | 15.1 | 1.8 | 3.8 | 14.5 | 18.1 | 5.5 |
| 2019 | 29.5 | 5.4 | 6.0 | 14.0 | 1.9 | 4.0 | 14.5 | 18.9 | 5.8 |
| 2020 | 28.7 | 4.9 | 5.9 | 14.1 | 1.9 | 3.2 | 17.2 | 18.7 | 5.3 |
| 2021 | 30.8 | 4.1 | 4.7 | 13.4 | 1.9 | 3.9 | 19.2 | 17.1 | 4.8 |
| 2022 | 31.6 | 3.7 | 3.9 | 11.8 | 2.1 | 4.5 | 19.2 | 18.1 | 5.1 |
EU-27 = European Union; ROW = rest of world.
Note(s):
Value added is the value of goods and services (gross output) minus the cost of intermediate inputs (energy, materials, and purchased services). Semiconductor manufacturing refers to industry “Manufacture of electronic components and boards” (International Standard Industrial Classification, Revision 4, 261), which includes the manufacture of semiconductors and other components for electronic applications.
Source(s):
S&P Global IHS Markit, Comparative Industry Service special tabulations, October 2023.
Science and Engineering Indicators