 An official website of the United States government
 Data
Tables
Select "VIEW" to see the table. PDF and Excel are available for download.
Figures
Data Sources
DOWNLOAD DATA SOURCES| Item | Title | Provider | Product |
|---|---|---|---|
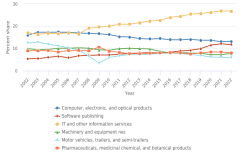
| Figure KTI-1 | Industry share of U.S. total KTI value added, by selected industries: 2002–22 | IHS Markit | Comparative Industry Service |
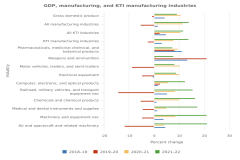
| Figure KTI-2 | Annual percent changes in U.S. value added, by KTI industry: 2018–22 | IHS Markit | Comparative Industry Service |
| Figure KTI-2 | Annual percent changes in U.S. value added, by KTI industry: 2018–22 | U.S. Bureau of Economic Analysis | GDP by Industry |
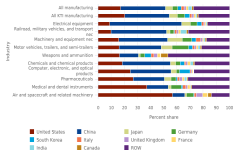
| Figure KTI-3 | Country share of global KTI manufacturing value added, by KTI industry: 2022 | IHS Markit | Comparative Industry Service |
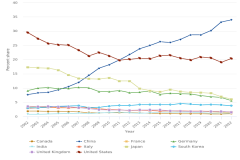
| Figure KTI-4 | Country share of global KTI services value added for selected economies: 2002–22 | IHS Markit | Comparative Industry Service |
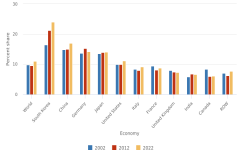
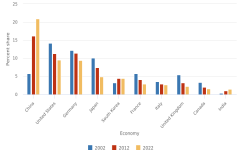
| Figure KTI-5 | KTI value added as a share of domestic GDP for selected economies: 2002, 2012, and 2022 | IHS Markit | Comparative Industry Service |
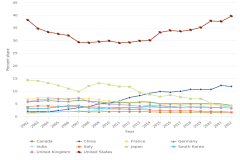
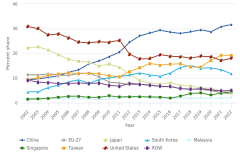
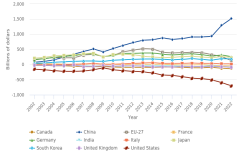
| Figure KTI-6 | Country share of global KTI manufacturing value added for selected economies: 2002–22 | IHS Markit | Comparative Industry Service |
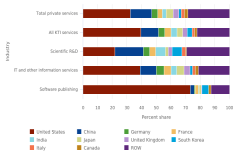
| Figure KTI-7 | Country share of global KTI services value added, by KTI industry: 2022 | IHS Markit | Comparative Industry Service |
| Figure KTI-8 | Global share of value added for semiconductor manufacturing for selected economies: 2002–22 | IHS Markit | Comparative Industry Service |
| Figure KTI-9 | Country share of global KTI manufacturing exports for selected economies: 2002, 2012, and 2022 | IHS Markit | Comparative Industry Service |
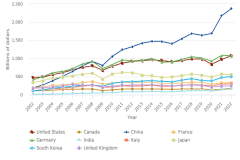
| Figure KTI-10 | Gross exports of KTI manufacturing industries for selected economies: 2002–22 | IHS Markit | Comparative Industry Service |
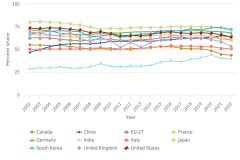
| Figure KTI-11 | KTI manufacturing exports as a share of all manufacturing exports for selected economies: 2002–22 | IHS Markit | Comparative Industry Service |
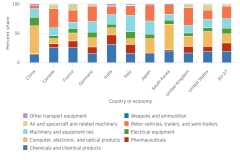
| Figure KTI-12 | Industry composition of country KTI manufacturing exports for selected economies: 2022 | IHS Markit | Comparative Industry Service |
| Figure KTI-13 | KTI manufacturing trade balance for selected economies: 2002–22 | IHS Markit | Comparative Industry Service |
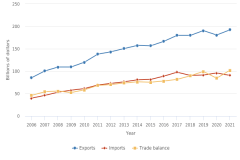
| Figure KTI-14 | Exports, imports, and trade balance of KTI services for the United States: 2006–21 | U.S. Bureau of Economic Analysis | Global Value Chains |
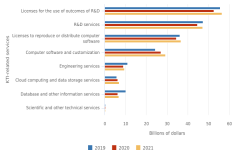
| Figure KTI-15 | Exports of KTI-related services for the United States, by type of service: 2019–21 | U.S. Bureau of Economic Analysis | Global Value Chains |
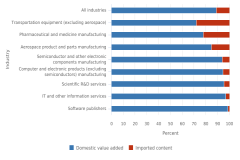
| Figure KTI-16 | Domestic value added and imported content of U.S. gross exports: 2021 | U.S. Bureau of Economic Analysis | Value Added by Industry |
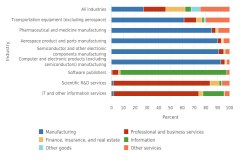
| Figure KTI-17 | Domestic value-added content of gross exports, by exporting industry and source sector: 2021 | U.S. Bureau of Economic Analysis | Value Added by Industry |
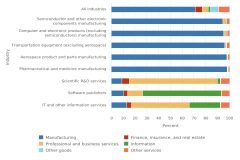
| Figure KTI-18 | Imported content in U.S. gross exports, by exporting industry and source sector: 2021 | U.S. Bureau of Economic Analysis | Value Added by Industry |
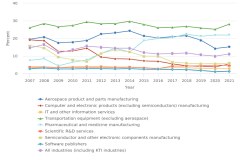
| Figure KTI-19 | Imported content share in U.S. gross exports, by exporting industry: 2007–21 | U.S. Bureau of Economic Analysis | Value Added by Industry |
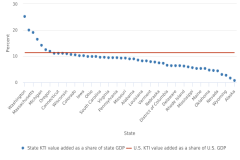
| Figure KTI-A | KTI value added as a share of U.S. and state GDP: 2021 | U.S. Bureau of Economic Analysis | GDP by State |
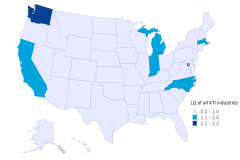
| Figure KTI-B | Specialization in production for all KTI industries, by state: 2021 | U.S. Bureau of Economic Analysis | GDP by State |
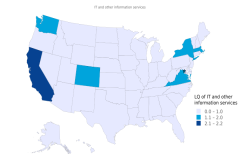
| Figure KTI-C | Specialization in production for two selected industries, by state: 2021 | U.S. Bureau of Economic Analysis | GDP by State |
| Table KTI-1 | U.S. KTI industries, by value added and share of GDP: 2018–22 | U.S. Bureau of Economic Analysis | Value Added by Industry |
| Table KTI-2 | Global KTI industries, by value added and share of global GDP: 2018–22 | IHS Markit | Comparative Industry Service |
| Table KTI-A | GDP, by state share and value-added output of KTI industries: 2021 | U.S. Bureau of Economic Analysis | GDP by State |
| Table SAKTI-1 | OECD classification of industries, by R&D intensity category | Organisation for Economic Co-operation and Development | OECD Taxonomy of Economic Activities Based on R&D Intensity |
| Table SAKTI-2 | Concordance of NAICS 2012 industries to ISIC, Rev.4, industries, by R&D intensity category | U.S. Census Bureau | North American Industry Classification System Concordances |
| Table SKTI-1 | U.S. KTI industry value added: 2002–22 | IHS Markit | Comparative Industry Service |
| Table SKTI-2 | Value added, by industry, for the world and for selected economies: 2002–22 | IHS Markit | Comparative Industry Service |
| Table SKTI-3 | Gross exports of goods trade, for the world and for selected economies: 2002–22 | IHS Markit | Comparative Industry Service |
| Table SKTI-4 | Domestic and imported value-added content of gross exports and U.S. gross exports, by exporting industry: 2007–21 | U.S. Bureau of Economic Analysis | Global Value Chains |