 An official website of the United States government
 Global Trade in Knowledge- and Technology-Intensive Output
International trade has long been recognized as a key channel of knowledge and technology spillovers (Coe and Helpman 1995; Criscuolo, Haskel, and Slaughter 2010) as well as a factor in a country’s competitiveness and productivity growth (Aghion and Howitt 2009; Baily, Bosworth, and Doshi 2020). Further, the trade patterns in KTI industries examined next reflect some of the output patterns examined in the previous section. Together, KTI output and trade patterns reflect and impact innovation activities in the business sector (Ambos et al. 2021; Autor et al. 2020; Ito et al. 2023; Jaax and Miroudot 2021).
Gross Flows of Trade in KTI Goods Output
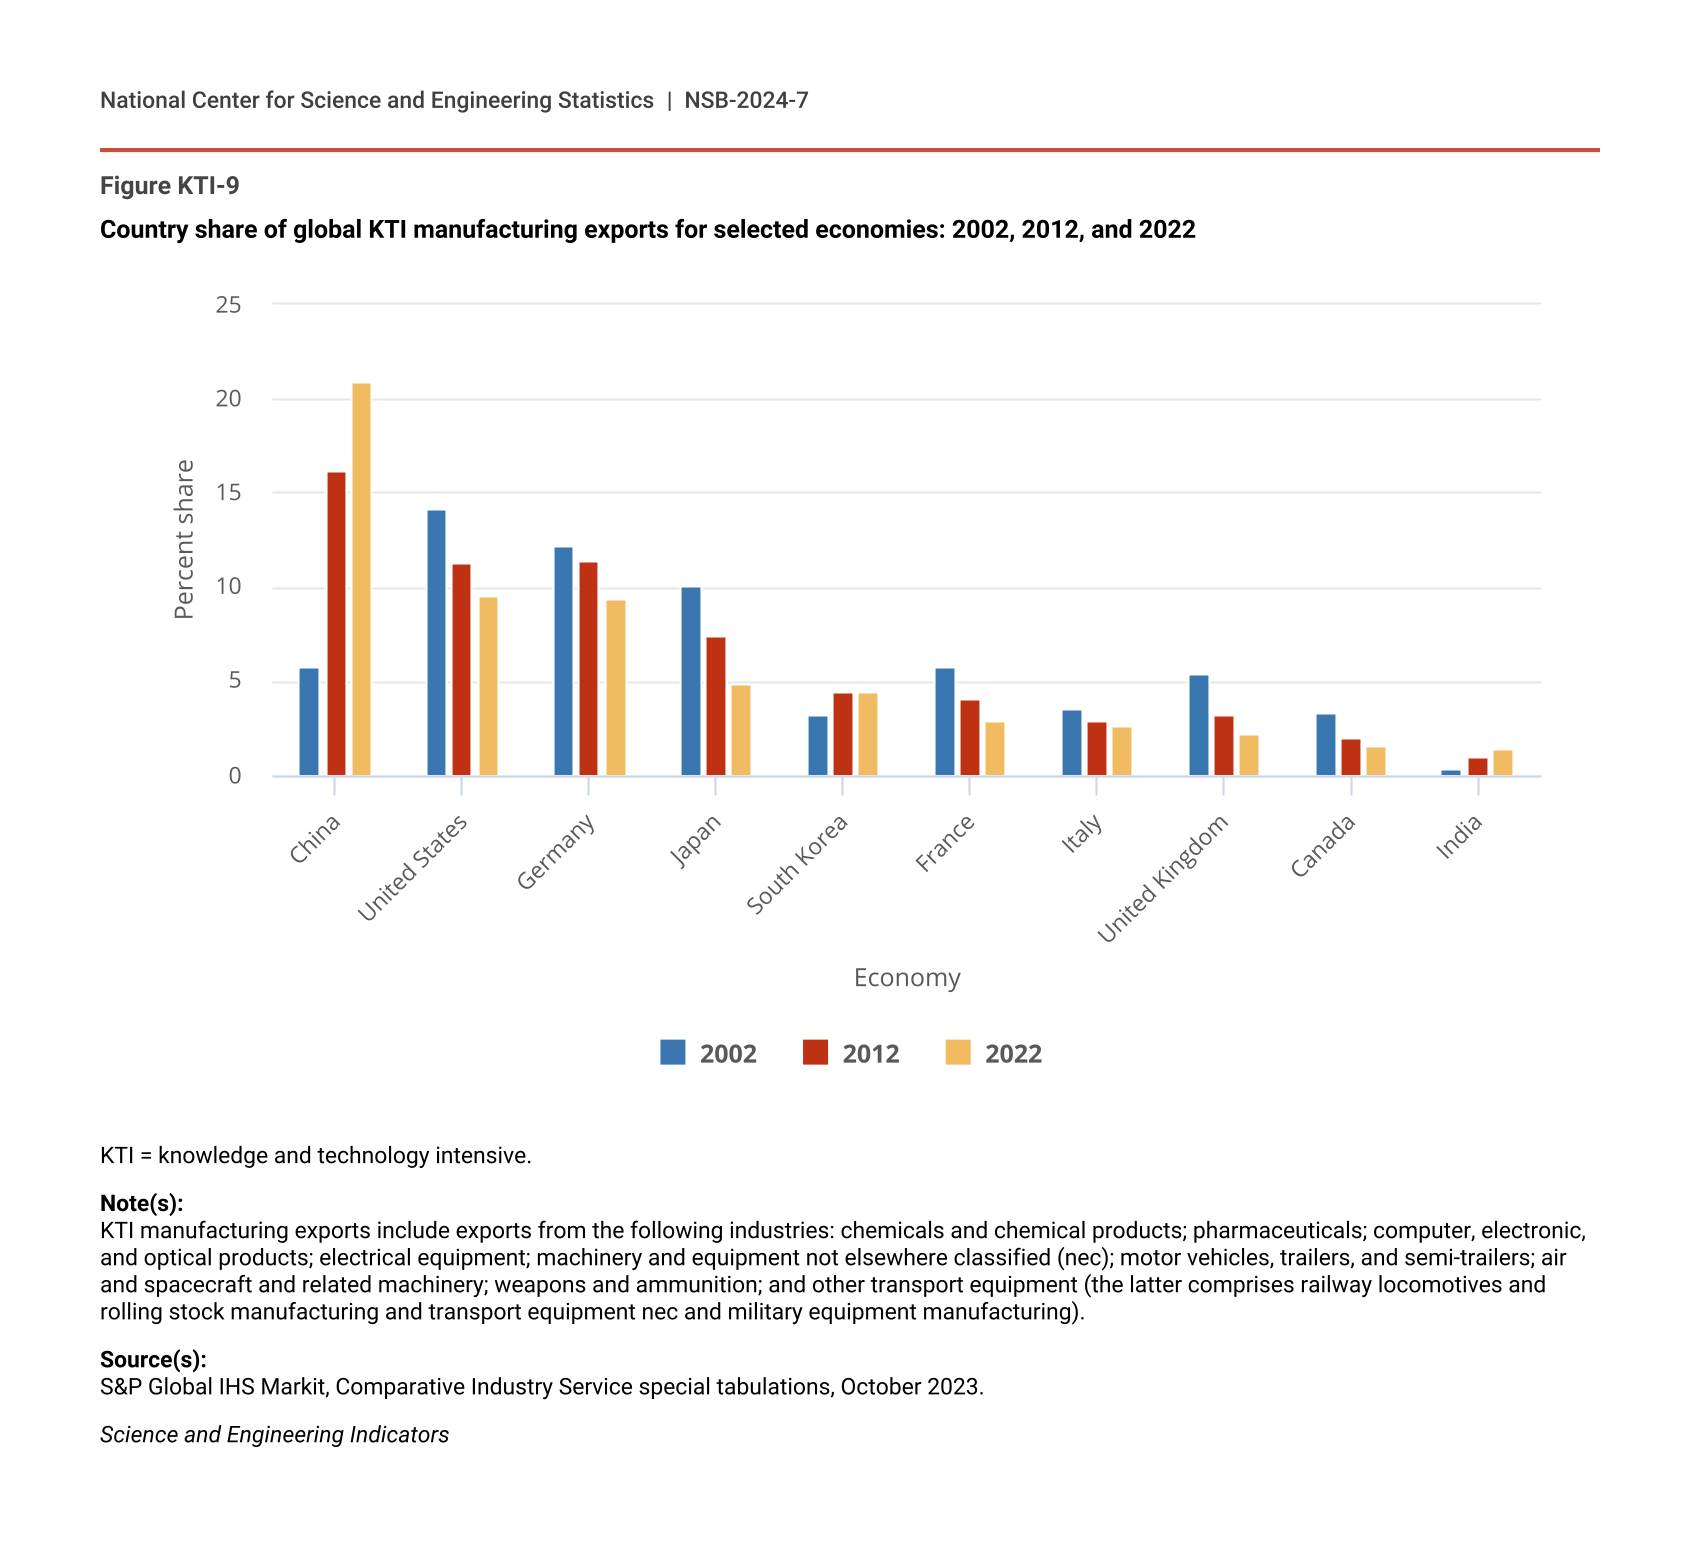
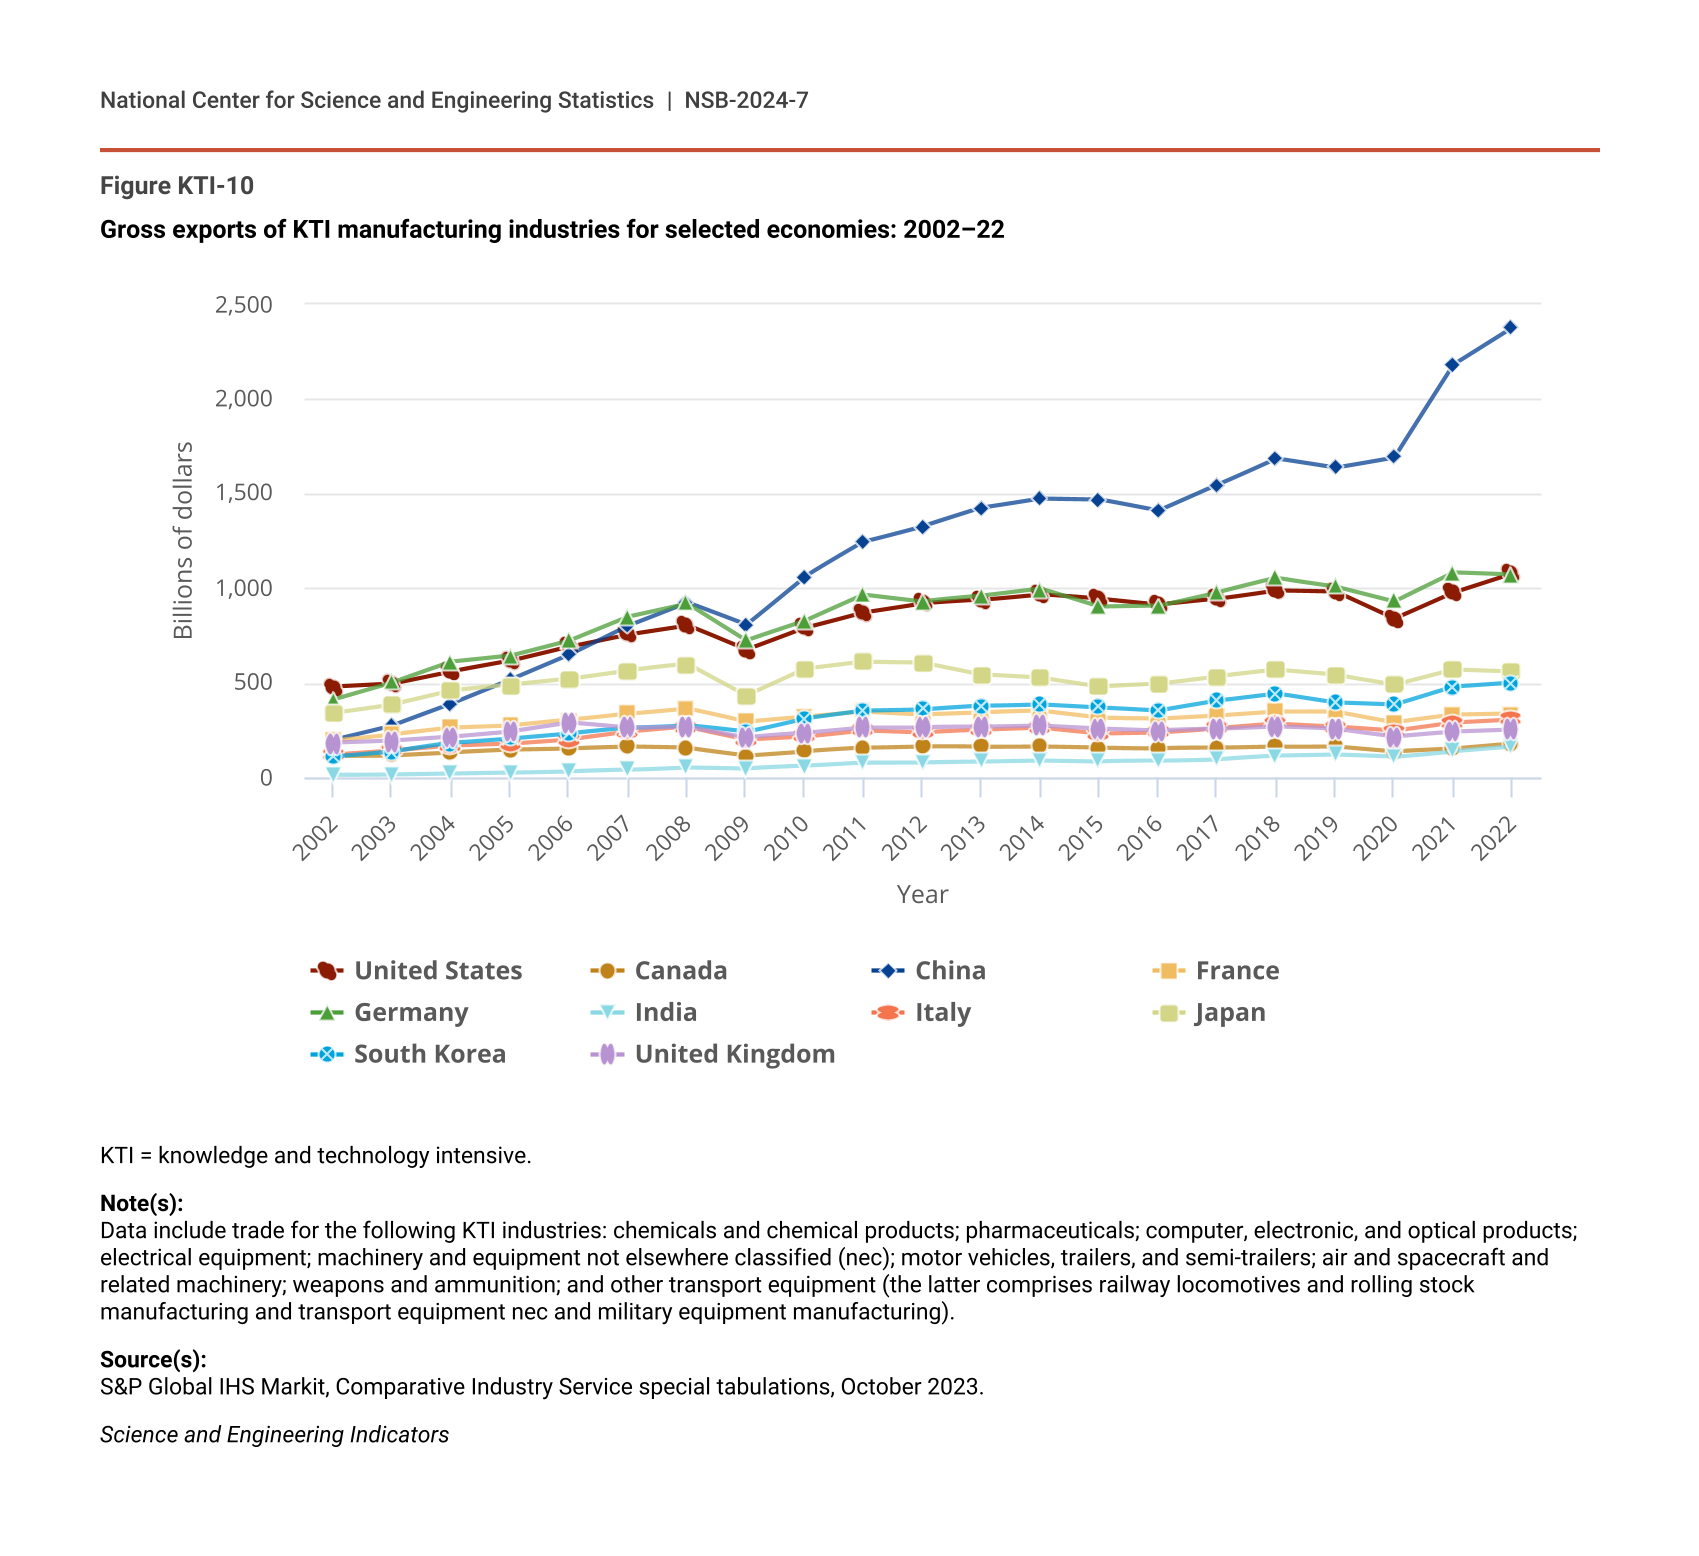
Globally, KTI manufacturing industries exported $11.4 trillion in 2022 in current U.S. dollars, up 6.5% from 2021, following a decline of 5.1% in 2020 and a post-pandemic increase of 20.3% in 2021, according to S&P Global data (Table SKTI-3). China has been the leading KTI manufacturing exporter country since 2008 based on current U.S. dollars, with a share of 20.9% in 2022 (Figure KTI-9). In 2022, China’s KTI manufacturing goods exports reached $2.4 trillion in current U.S. dollars, followed by those of the United States and Germany (both with $1.1 trillion) (Figure KTI-10). KTI goods exports from the United States and China grew by 10% and 9%, respectively, in 2022, furthering post-pandemic increases of 16% and 29%, respectively, in 2021 (Table SKTI-3). China was the only country among the top five KTI goods exporters that posted increases in KTI goods exports (3%) and overall manufacturing exports (1%) in 2020 (Table SKTI-3).
Country share of global KTI manufacturing exports for selected economies: 2002, 2012, and 2022
| Economy | 2002 | 2012 | 2022 |
|---|---|---|---|
| China | 5.8 | 16.2 | 20.9 |
| United States | 14.2 | 11.3 | 9.5 |
| Germany | 12.2 | 11.4 | 9.4 |
| Japan | 10.1 | 7.4 | 4.9 |
| South Korea | 3.2 | 4.4 | 4.4 |
| France | 5.7 | 4.1 | 2.9 |
| Italy | 3.5 | 2.9 | 2.7 |
| United Kingdom | 5.4 | 3.2 | 2.2 |
| Canada | 3.3 | 2.0 | 1.6 |
| India | 0.3 | 1.0 | 1.4 |
KTI = knowledge and technology intensive.
Note(s):
KTI manufacturing exports include exports from the following industries: chemicals and chemical products; pharmaceuticals; computer, electronic, and optical products; electrical equipment; machinery and equipment not elsewhere classified (nec); motor vehicles, trailers, and semi-trailers; air and spacecraft and related machinery; weapons and ammunition; and other transport equipment (the latter comprises railway locomotives and rolling stock manufacturing and transport equipment nec and military equipment manufacturing).
Source(s):
S&P Global IHS Markit, Comparative Industry Service special tabulations, October 2023.
Science and Engineering Indicators
Gross exports of KTI manufacturing industries for selected economies: 2002–22
| Year | United States | Canada | China | France | Germany | India | Italy | Japan | South Korea | United Kingdom |
|---|---|---|---|---|---|---|---|---|---|---|
| 2002 | 478.7 | 113.0 | 196.9 | 193.7 | 412.8 | 11.7 | 118.8 | 340.2 | 109.5 | 181.2 |
| 2003 | 495.1 | 116.5 | 273.7 | 226.5 | 501.8 | 14.7 | 140.1 | 386.5 | 136.2 | 192.5 |
| 2004 | 559.7 | 131.6 | 388.3 | 260.7 | 610.7 | 19.5 | 165.9 | 459.3 | 181.2 | 214.2 |
| 2005 | 615.4 | 145.0 | 515.6 | 271.6 | 642.9 | 25.1 | 176.9 | 488.7 | 205.8 | 242.5 |
| 2006 | 691.3 | 151.2 | 647.1 | 302.5 | 723.5 | 31.6 | 199.7 | 520.4 | 232.5 | 288.8 |
| 2007 | 756.7 | 160.2 | 801.3 | 336.4 | 850.2 | 39.4 | 240.2 | 565.2 | 261.6 | 260.7 |
| 2008 | 803.6 | 154.5 | 923.9 | 365.4 | 919.7 | 53.0 | 265.5 | 598.6 | 275.3 | 268.9 |
| 2009 | 672.2 | 115.3 | 805.7 | 293.9 | 725.0 | 47.3 | 200.3 | 432.1 | 239.1 | 211.7 |
| 2010 | 789.6 | 138.0 | 1,061.9 | 320.8 | 827.6 | 60.4 | 215.4 | 573.5 | 312.1 | 234.6 |
| 2011 | 872.5 | 154.7 | 1,243.1 | 348.3 | 966.1 | 78.3 | 249.0 | 611.3 | 352.8 | 263.8 |
| 2012 | 920.4 | 162.4 | 1,326.2 | 333.7 | 929.9 | 79.7 | 237.5 | 607.8 | 359.1 | 264.7 |
| 2013 | 936.9 | 160.1 | 1,423.5 | 342.7 | 957.7 | 83.8 | 250.4 | 544.7 | 378.6 | 266.0 |
| 2014 | 967.1 | 162.8 | 1,473.3 | 350.0 | 995.9 | 89.8 | 262.5 | 527.2 | 386.6 | 273.2 |
| 2015 | 942.2 | 157.3 | 1,468.6 | 313.4 | 900.0 | 84.8 | 231.4 | 480.3 | 369.6 | 257.2 |
| 2016 | 912.6 | 154.0 | 1,407.8 | 310.0 | 905.5 | 86.3 | 236.9 | 495.2 | 352.5 | 247.3 |
| 2017 | 943.4 | 155.0 | 1,545.6 | 326.9 | 977.2 | 94.4 | 259.0 | 534.1 | 404.8 | 255.0 |
| 2018 | 989.5 | 162.0 | 1,686.5 | 348.2 | 1,053.7 | 112.0 | 281.9 | 567.5 | 443.0 | 267.5 |
| 2019 | 983.0 | 164.3 | 1,637.5 | 348.5 | 1,010.1 | 118.4 | 268.4 | 541.6 | 394.2 | 255.4 |
| 2020 | 839.3 | 137.0 | 1,692.1 | 290.3 | 930.8 | 107.3 | 246.8 | 491.4 | 382.4 | 214.7 |
| 2021 | 977.6 | 150.8 | 2,179.5 | 329.7 | 1,082.5 | 138.0 | 290.7 | 571.6 | 478.5 | 240.4 |
| 2022 | 1,078.3 | 177.4 | 2,374.9 | 335.3 | 1,070.0 | 161.0 | 307.1 | 560.5 | 500.7 | 251.2 |
KTI = knowledge and technology intensive.
Note(s):
Data include trade for the following KTI industries: chemicals and chemical products; pharmaceuticals; computer, electronic, and optical products; electrical equipment; machinery and equipment not elsewhere classified (nec); motor vehicles, trailers, and semi-trailers; air and spacecraft and related machinery; weapons and ammunition; and other transport equipment (the latter comprises railway locomotives and rolling stock manufacturing and transport equipment nec and military equipment manufacturing).
Source(s):
S&P Global IHS Markit, Comparative Industry Service special tabulations, October 2023.
Science and Engineering Indicators
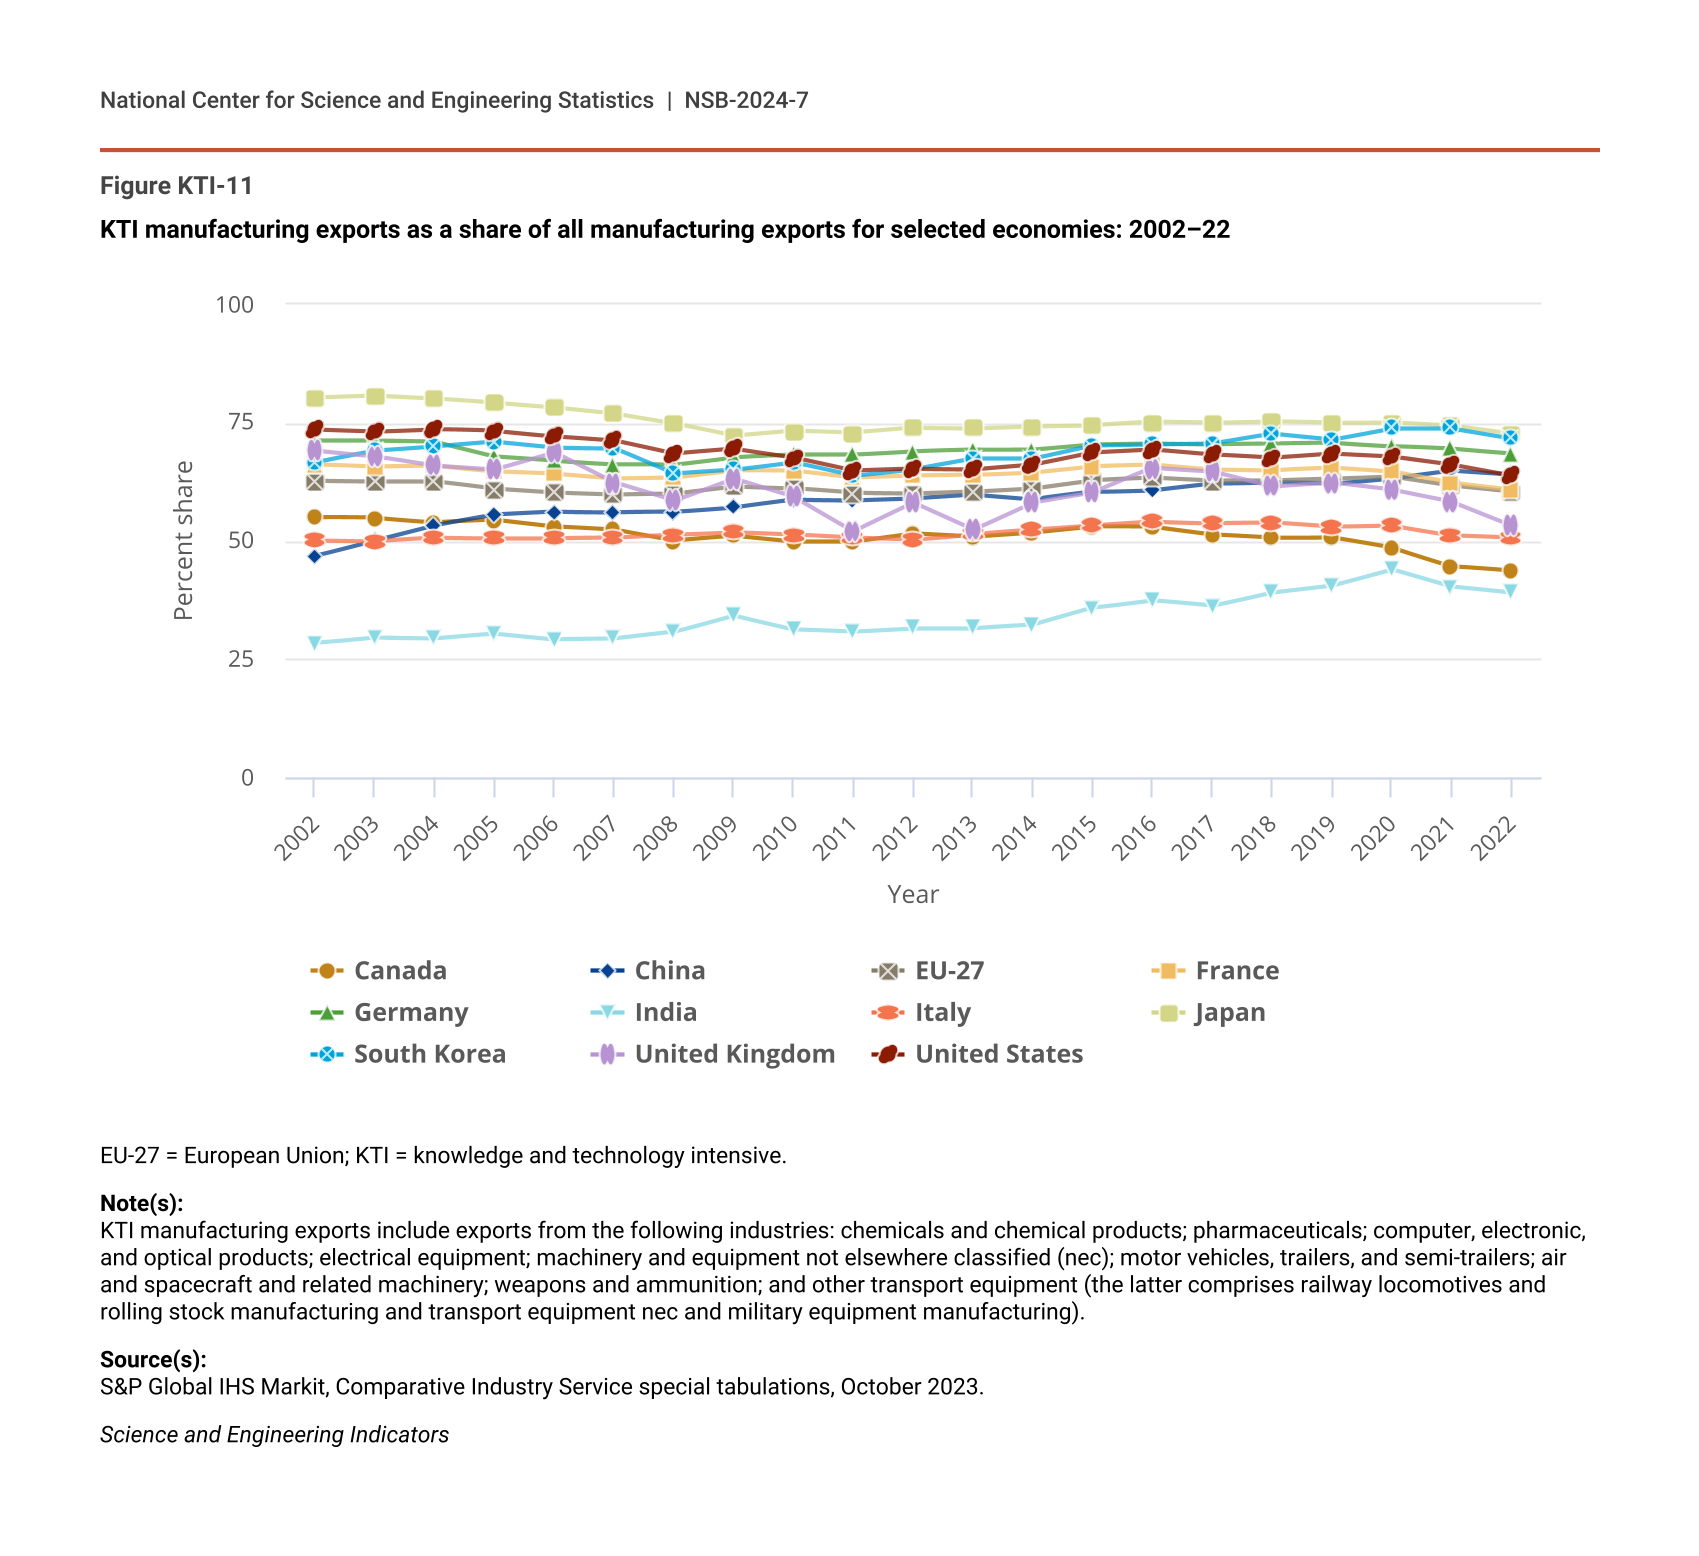
As a share of global manufacturing exports, global KTI manufacturing exports have fluctuated narrowly around 60% since 2002 (Table SKTI-3). At the country level, China’s share of KTI goods exports to total manufacturing exports increased notably (from 47% to 64%) from 2002 to 2022, with smaller gradual increases for India (from 28% to 39%) and South Korea (from 67% to 72%) over the same period. The share for most other major countries declined, including for the United States (from 74% to 64%), Japan (from 80% to 73%), and Germany (from 71% to 68%) (Figure KTI-11).
KTI manufacturing exports as a share of all manufacturing exports for selected economies: 2002–22
| Year | Canada | China | EU-27 | France | Germany | India | Italy | Japan | South Korea | United Kingdom | United States |
|---|---|---|---|---|---|---|---|---|---|---|---|
| 2002 | 55.0 | 46.8 | 62.7 | 66.2 | 71.1 | 28.4 | 50.1 | 80.3 | 66.6 | 69.1 | 73.5 |
| 2003 | 54.8 | 50.1 | 62.6 | 65.7 | 71.1 | 29.6 | 49.9 | 80.7 | 69.0 | 67.9 | 73.1 |
| 2004 | 53.9 | 53.3 | 62.6 | 65.9 | 70.9 | 29.4 | 50.6 | 80.1 | 69.9 | 65.9 | 73.6 |
| 2005 | 54.4 | 55.5 | 61.0 | 64.7 | 67.8 | 30.4 | 50.5 | 79.2 | 70.9 | 65.1 | 73.2 |
| 2006 | 53.0 | 56.1 | 60.2 | 64.2 | 66.9 | 29.2 | 50.5 | 78.2 | 69.7 | 68.7 | 72.1 |
| 2007 | 52.3 | 56.0 | 59.8 | 63.2 | 66.2 | 29.3 | 50.6 | 76.9 | 69.6 | 62.3 | 71.2 |
| 2008 | 50.0 | 56.1 | 60.0 | 63.4 | 66.1 | 30.7 | 51.3 | 74.8 | 64.2 | 58.4 | 68.4 |
| 2009 | 51.0 | 57.1 | 61.5 | 64.9 | 67.7 | 34.2 | 51.8 | 72.2 | 65.0 | 63.1 | 69.4 |
| 2010 | 49.8 | 58.7 | 61.1 | 64.8 | 68.2 | 31.3 | 51.3 | 73.3 | 66.6 | 59.3 | 67.6 |
| 2011 | 49.8 | 58.6 | 60.1 | 63.3 | 68.2 | 30.8 | 50.6 | 72.9 | 63.7 | 52.0 | 64.8 |
| 2012 | 51.5 | 59.0 | 60.0 | 63.7 | 68.9 | 31.5 | 50.2 | 73.9 | 65.1 | 58.0 | 65.2 |
| 2013 | 50.8 | 59.8 | 60.4 | 63.9 | 69.2 | 31.5 | 51.4 | 73.8 | 67.3 | 52.3 | 65.1 |
| 2014 | 51.7 | 58.8 | 61.1 | 64.5 | 69.3 | 32.2 | 52.3 | 74.2 | 67.3 | 58.1 | 66.1 |
| 2015 | 53.0 | 60.3 | 62.8 | 65.8 | 70.4 | 35.8 | 53.2 | 74.4 | 70.1 | 60.2 | 68.7 |
| 2016 | 52.9 | 60.7 | 63.3 | 66.1 | 70.6 | 37.4 | 54.0 | 75.1 | 70.3 | 65.4 | 69.3 |
| 2017 | 51.3 | 62.1 | 62.7 | 65.1 | 70.4 | 36.2 | 53.7 | 74.9 | 70.5 | 64.7 | 68.2 |
| 2018 | 50.6 | 62.4 | 62.7 | 64.9 | 70.5 | 39.1 | 53.8 | 75.2 | 72.6 | 61.5 | 67.5 |
| 2019 | 50.7 | 62.0 | 63.1 | 65.4 | 70.7 | 40.6 | 52.9 | 74.9 | 71.4 | 62.3 | 68.4 |
| 2020 | 48.5 | 63.2 | 63.6 | 64.6 | 70.0 | 44.0 | 53.2 | 75.0 | 73.8 | 60.8 | 67.8 |
| 2021 | 44.6 | 64.9 | 61.7 | 62.2 | 69.4 | 40.3 | 51.2 | 74.3 | 73.8 | 58.3 | 66.1 |
| 2022 | 43.6 | 64.1 | 60.4 | 60.8 | 68.4 | 39.0 | 50.7 | 72.6 | 71.7 | 53.3 | 63.8 |
EU-27 = European Union; KTI = knowledge and technology intensive.
Note(s):
KTI manufacturing exports include exports from the following industries: chemicals and chemical products; pharmaceuticals; computer, electronic, and optical products; electrical equipment; machinery and equipment not elsewhere classified (nec); motor vehicles, trailers, and semi-trailers; air and spacecraft and related machinery; weapons and ammunition; and other transport equipment (the latter comprises railway locomotives and rolling stock manufacturing and transport equipment nec and military equipment manufacturing).
Source(s):
S&P Global IHS Markit, Comparative Industry Service special tabulations, October 2023.
Science and Engineering Indicators
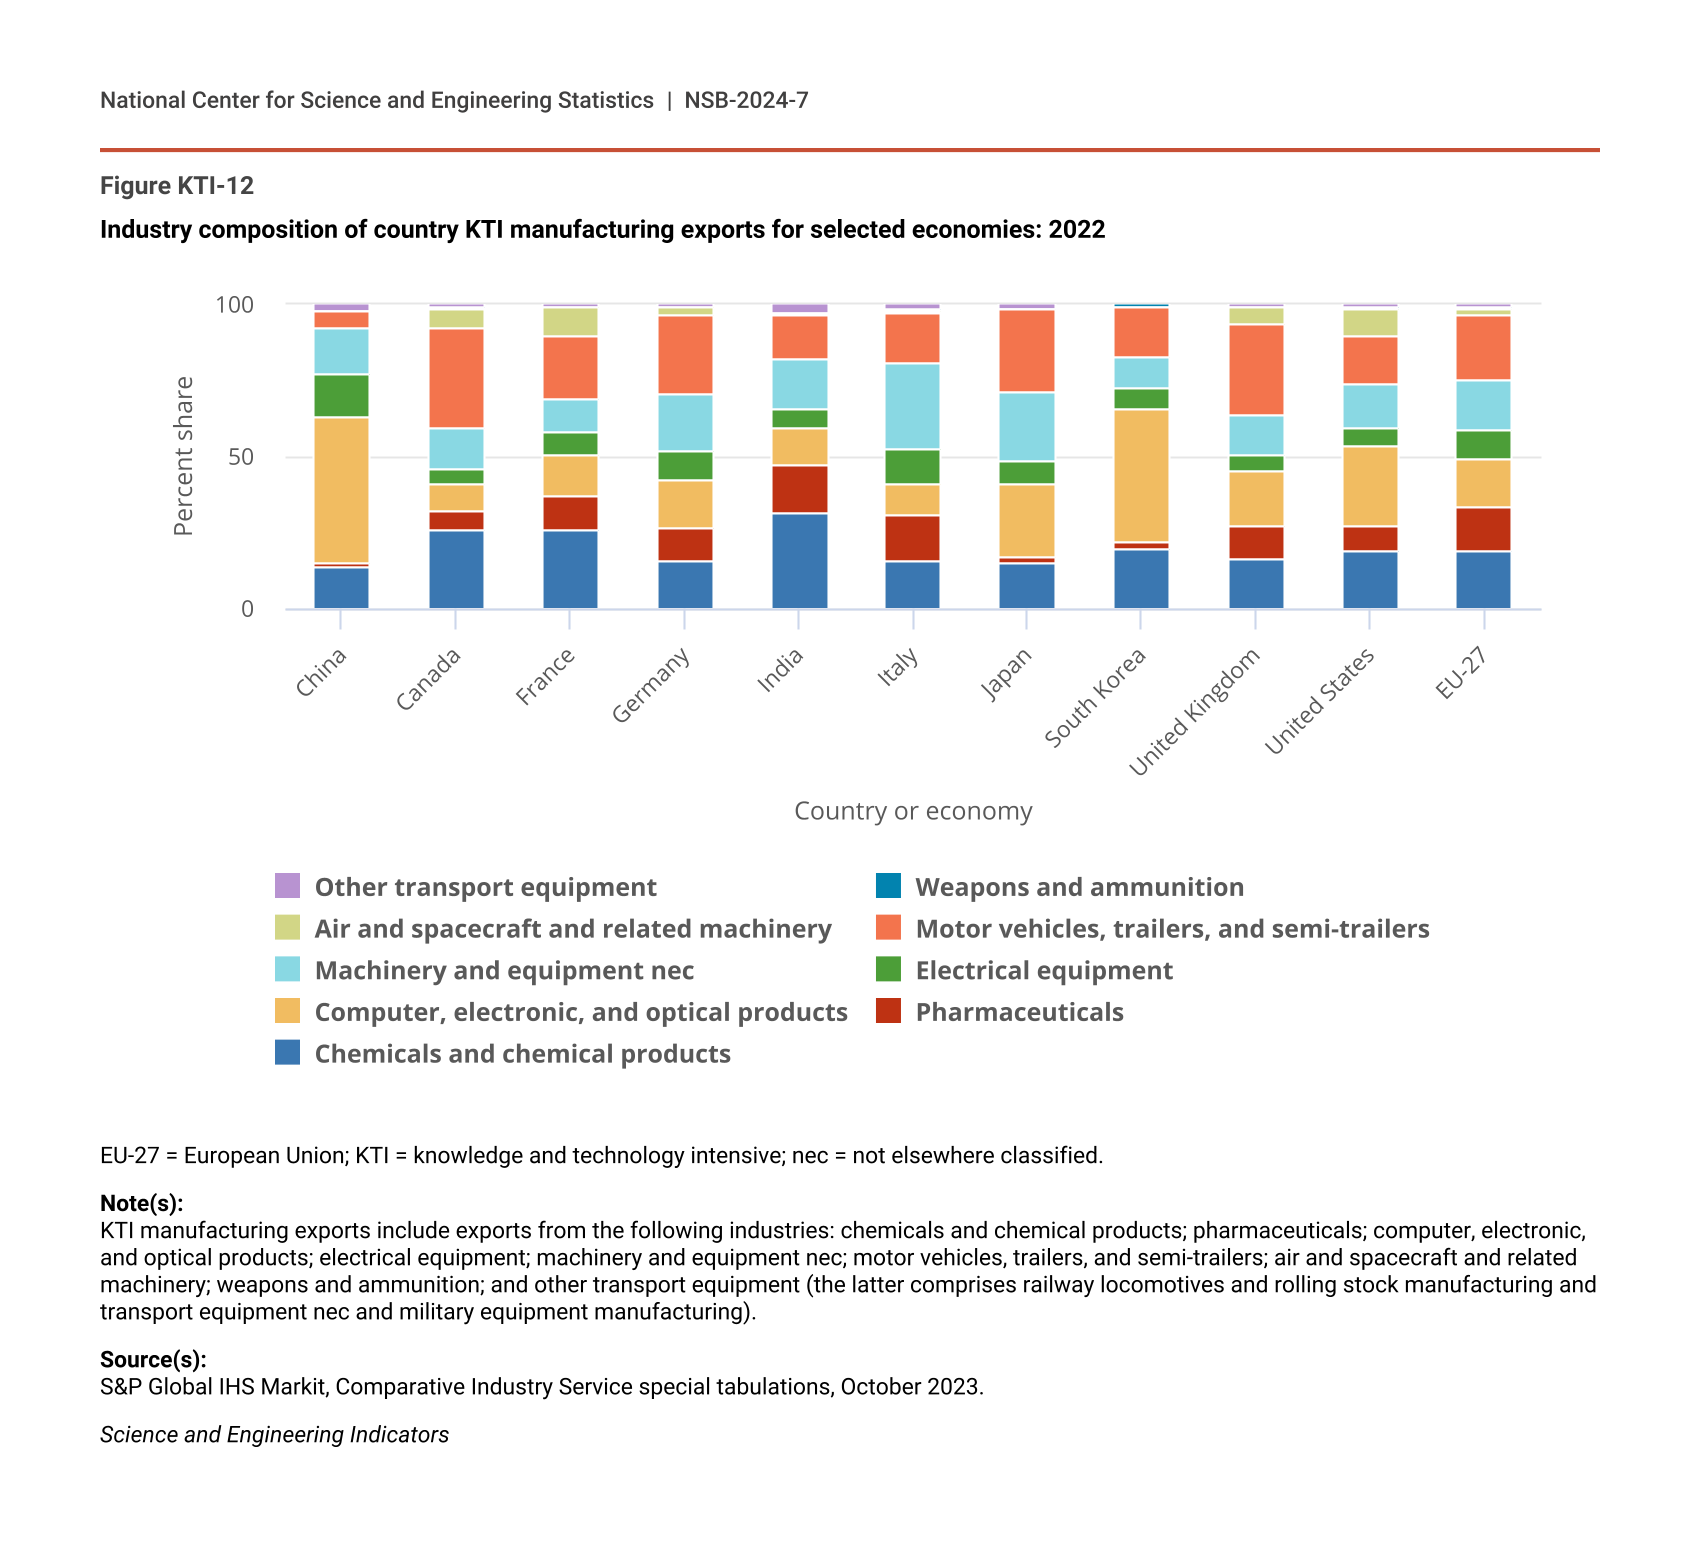
The distribution of exports by type of goods or industry has long been an indicator of specialization of national economies (WTO 2013). Computer, electronic, and optical products industry exports (which include semiconductors) accounted for 49% of China’s KTI goods exports and for 44% of South Korea’s in 2022, based on current U.S. dollar data (Figure KTI-12). This was followed by the United States, with a share of 26%, and Japan, with 24%. The largest shares of KTI goods exports by the motor vehicles, trailers, and semi-trailers manufacturing industry were for Canada (33%), the United Kingdom (30%), Japan (27%), Germany (26%), South Korea (16%), and the United States (15%). Export data for motor vehicles, trailers, and semi-trailers manufacturing include but do not separate out EVs.
Industry composition of country KTI manufacturing exports for selected economies: 2022
| Country or economy | Chemicals and chemical products | Pharmaceuticals | Computer, electronic, and optical products | Electrical equipment | Machinery and equipment nec | Motor vehicles, trailers, and semi-trailers | Air and spacecraft and related machinery | Weapons and ammunition | Other transport equipment |
|---|---|---|---|---|---|---|---|---|---|
| China | 13.7 | 1.2 | 48.5 | 14.3 | 14.7 | 5.7 | 0.2 | 0.0 | 1.8 |
| Canada | 25.8 | 6.5 | 9.0 | 4.4 | 13.6 | 33.0 | 6.6 | 0.1 | 1.0 |
| France | 25.8 | 11.1 | 13.5 | 7.5 | 11.6 | 20.3 | 9.6 | 0.0 | 0.6 |
| Germany | 15.5 | 11.0 | 15.8 | 9.6 | 18.6 | 26.0 | 2.7 | 0.1 | 0.8 |
| India | 31.4 | 15.8 | 12.4 | 6.0 | 16.4 | 14.8 | 0.5 | 0.1 | 2.7 |
| Italy | 15.4 | 15.2 | 10.6 | 11.2 | 28.2 | 16.9 | 0.5 | 0.3 | 1.6 |
| Japan | 14.9 | 2.5 | 23.9 | 7.6 | 22.4 | 27.2 | 0.3 | 0.0 | 1.1 |
| South Korea | 20.1 | 2.1 | 43.6 | 6.7 | 10.5 | 16.2 | 0.2 | 0.2 | 0.3 |
| United Kingdom | 16.4 | 11.2 | 17.8 | 5.2 | 13.5 | 29.8 | 5.2 | 0.5 | 0.5 |
| United States | 19.5 | 7.8 | 26.1 | 6.4 | 14.3 | 15.4 | 9.5 | 0.5 | 0.6 |
| EU-27 | 19.4 | 14.2 | 15.9 | 9.3 | 16.4 | 21.4 | 2.1 | 0.2 | 1.0 |
EU-27 = European Union; KTI = knowledge and technology intensive; nec = not elsewhere classified.
Note(s):
KTI manufacturing exports include exports from the following industries: chemicals and chemical products; pharmaceuticals; computer, electronic, and optical products; electrical equipment; machinery and equipment nec; motor vehicles, trailers, and semi-trailers; air and spacecraft and related machinery; weapons and ammunition; and other transport equipment (the latter comprises railway locomotives and rolling stock manufacturing and transport equipment nec and military equipment manufacturing).
Source(s):
S&P Global IHS Markit, Comparative Industry Service special tabulations, October 2023.
Science and Engineering Indicators
Among the countries included in Figure KTI-12, exports by the pharmaceutical manufacturing industry accounted for the largest shares of KTI goods exports in India (16%); Italy (15%); and the United Kingdom, France, and Germany (each with 11%). In addition, chemicals and chemical products manufacturing (excluding pharmaceuticals) accounted for the largest KTI export shares in India (31%), Canada (26%), France (26%), South Korea (20%), and the United States (20%). Exports by the air and spacecraft manufacturing industry had the largest shares in the United States and France (both with 10%).
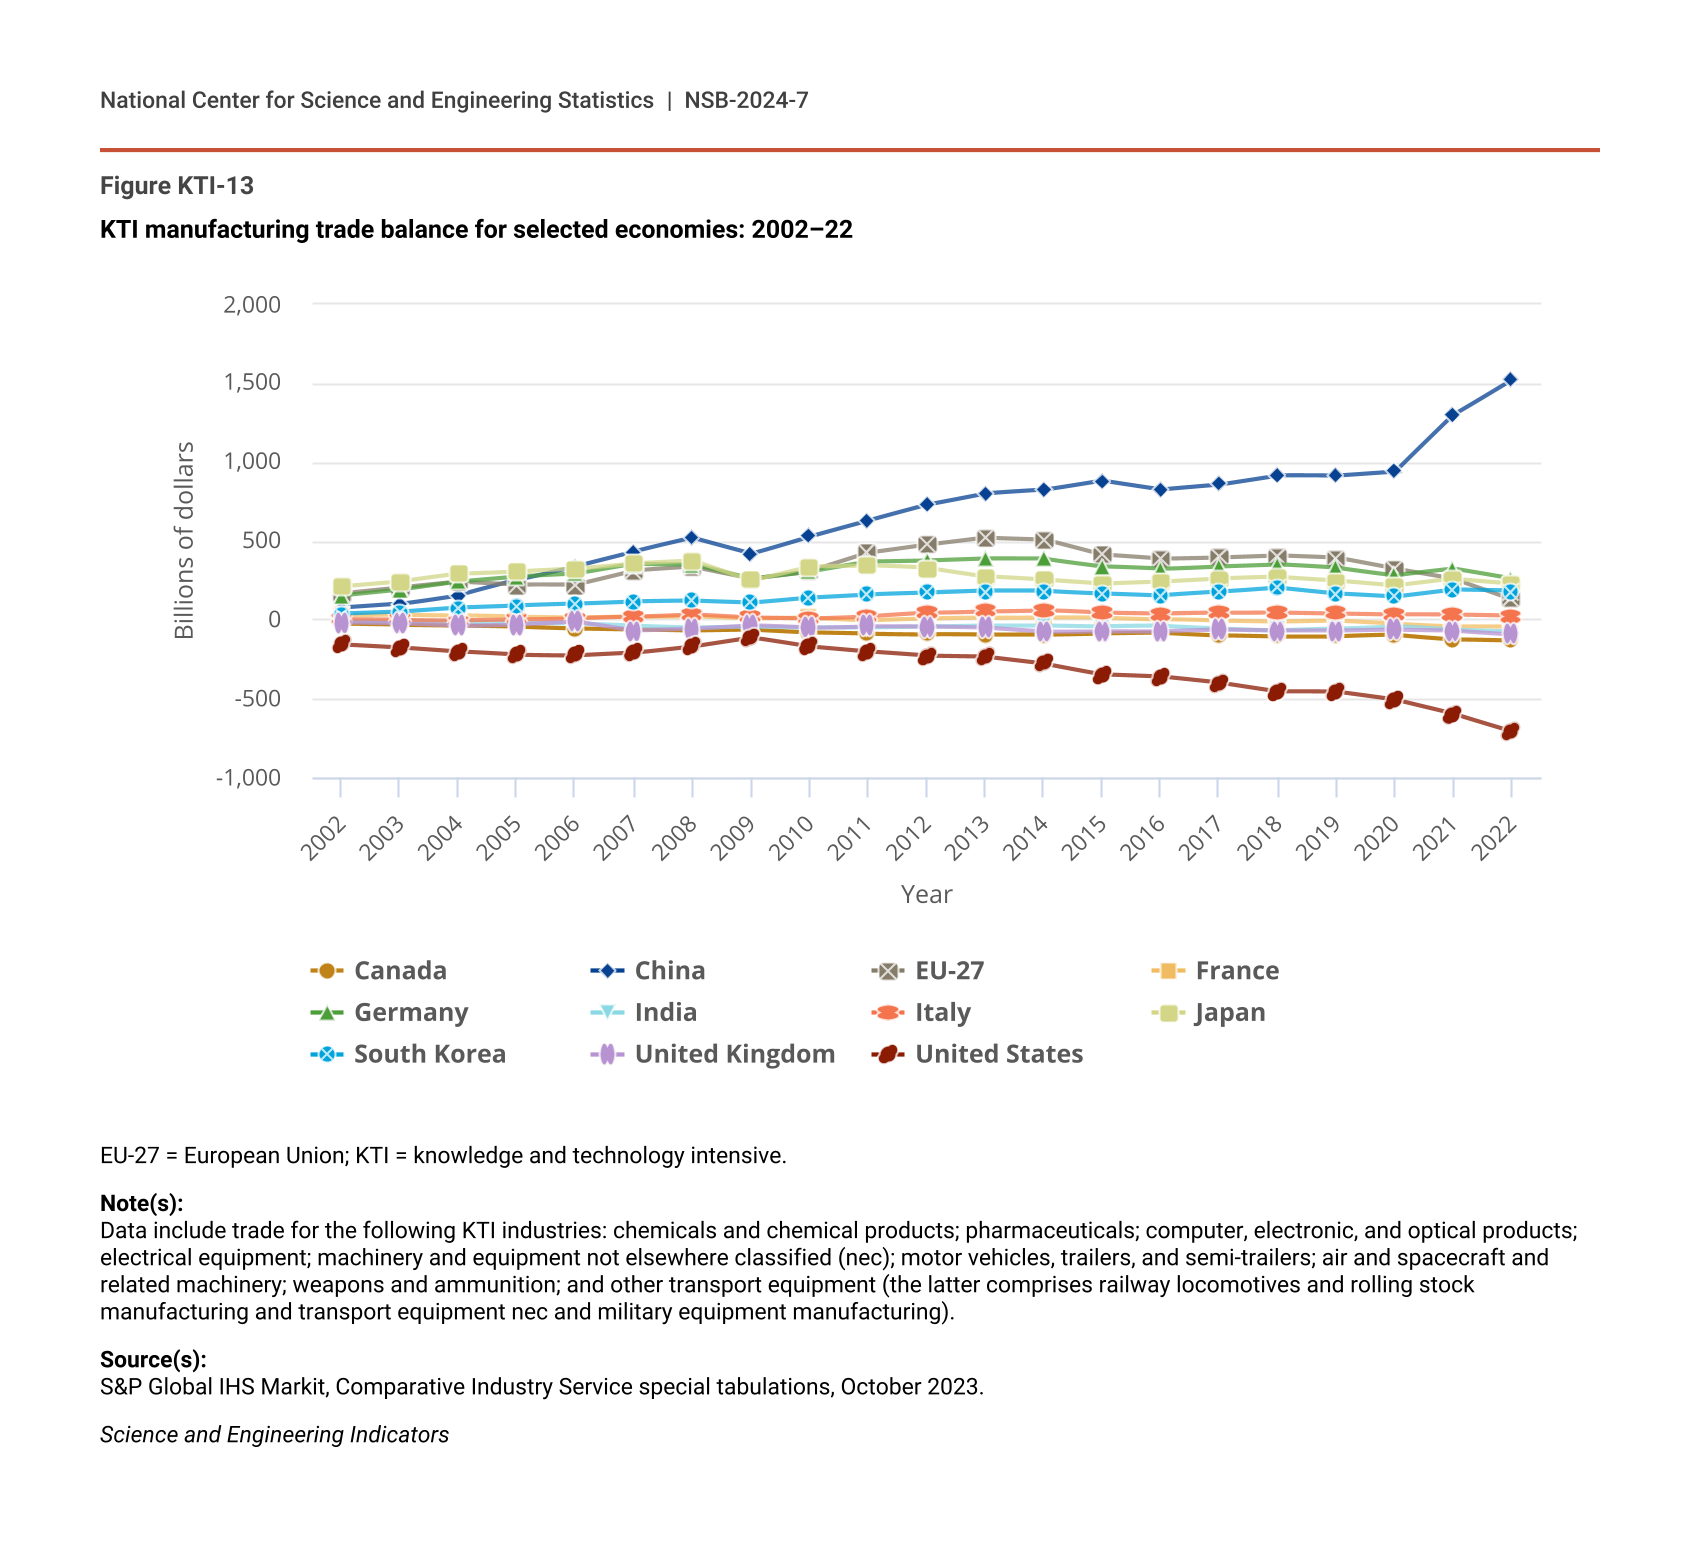
The United States had a KTI goods trade deficit of $708 billion in 2022 in current U.S. dollars (Figure KTI-13) based on S&P Global data. Across all goods, the U.S. trade deficit was $1.2 trillion in 2022, based on BEA and Census Bureau trade statistics (BEA 2023b, Table 2.1). In contrast, China had increasing trade surpluses in KTI goods, tripling from less than $500 million in 2009 to $1.5 trillion in 2022 in current U.S. dollars, based on S&P Global data. China’s overall manufacturing trade surplus experienced a similar pattern of growth based on the same source (Table SKTI-3).
KTI manufacturing trade balance for selected economies: 2002–22
| Year | Canada | China | EU-27 | France | Germany | India | Italy | Japan | South Korea | United Kingdom | United States |
|---|---|---|---|---|---|---|---|---|---|---|---|
| 2002 | -28.0 | 73.1 | 165.0 | 25.0 | 153.2 | -6.8 | -0.3 | 212.3 | 36.7 | -15.8 | -155.4 |
| 2003 | -33.6 | 98.5 | 201.4 | 29.3 | 189.6 | -9.5 | -2.2 | 242.0 | 49.8 | -25.5 | -175.8 |
| 2004 | -36.7 | 155.6 | 239.3 | 26.8 | 239.6 | -13.7 | -3.0 | 290.0 | 76.5 | -40.4 | -202.6 |
| 2005 | -43.7 | 250.7 | 221.1 | 17.4 | 271.5 | -19.2 | 1.1 | 306.1 | 89.3 | -30.0 | -223.8 |
| 2006 | -55.4 | 338.9 | 220.8 | 13.6 | 289.0 | -27.2 | 7.9 | 324.0 | 99.9 | -10.8 | -226.6 |
| 2007 | -62.3 | 431.7 | 312.3 | 19.3 | 353.0 | -40.7 | 17.4 | 358.5 | 114.1 | -68.6 | -209.6 |
| 2008 | -70.5 | 517.5 | 335.2 | 22.0 | 350.4 | -50.3 | 33.1 | 375.5 | 118.1 | -55.8 | -168.2 |
| 2009 | -64.7 | 418.4 | 261.3 | 6.4 | 259.2 | -42.9 | 12.4 | 248.9 | 106.3 | -36.0 | -111.6 |
| 2010 | -82.4 | 528.4 | 307.0 | 11.7 | 304.4 | -48.5 | 5.2 | 338.8 | 139.5 | -52.2 | -170.9 |
| 2011 | -90.5 | 628.8 | 422.4 | -4.6 | 366.7 | -50.9 | 19.8 | 344.5 | 160.0 | -41.2 | -203.4 |
| 2012 | -93.3 | 727.6 | 474.1 | 4.5 | 373.8 | -45.6 | 42.3 | 327.5 | 170.2 | -43.9 | -230.5 |
| 2013 | -97.2 | 799.5 | 520.0 | 10.2 | 385.9 | -38.6 | 52.8 | 273.8 | 182.5 | -51.8 | -235.5 |
| 2014 | -97.0 | 821.8 | 510.1 | 13.5 | 384.2 | -37.0 | 59.7 | 251.3 | 182.3 | -75.9 | -278.4 |
| 2015 | -87.8 | 882.6 | 412.9 | 12.3 | 337.2 | -43.9 | 42.2 | 226.2 | 168.0 | -73.7 | -346.5 |
| 2016 | -83.2 | 827.1 | 386.8 | 2.8 | 321.5 | -40.7 | 37.2 | 239.1 | 154.0 | -75.3 | -361.1 |
| 2017 | -98.9 | 857.8 | 395.3 | -9.4 | 339.0 | -55.8 | 42.9 | 259.1 | 175.1 | -65.1 | -400.9 |
| 2018 | -107.7 | 915.7 | 407.2 | -14.1 | 351.0 | -66.8 | 45.3 | 270.0 | 202.5 | -71.3 | -456.7 |
| 2019 | -106.7 | 912.3 | 392.8 | -8.0 | 328.2 | -56.9 | 39.5 | 248.3 | 165.3 | -72.5 | -459.4 |
| 2020 | -98.1 | 938.9 | 322.5 | -26.5 | 281.0 | -41.5 | 33.2 | 216.0 | 144.7 | -65.7 | -509.8 |
| 2021 | -124.7 | 1,298.7 | 260.3 | -41.9 | 321.5 | -65.6 | 30.3 | 259.0 | 190.2 | -71.0 | -597.8 |
| 2022 | -133.3 | 1,523.4 | 130.3 | -42.5 | 258.2 | -77.0 | 24.2 | 231.1 | 182.6 | -94.3 | -708.3 |
EU-27 = European Union; KTI = knowledge and technology intensive.
Note(s):
Data include trade for the following KTI industries: chemicals and chemical products; pharmaceuticals; computer, electronic, and optical products; electrical equipment; machinery and equipment not elsewhere classified (nec); motor vehicles, trailers, and semi-trailers; air and spacecraft and related machinery; weapons and ammunition; and other transport equipment (the latter comprises railway locomotives and rolling stock manufacturing and transport equipment nec and military equipment manufacturing).
Source(s):
S&P Global IHS Markit, Comparative Industry Service special tabulations, October 2023.
Science and Engineering Indicators
U.S. Trade in Value Added in KTI Output
The separation or fragmentation of production stages along supply chains, from R&D and design to production and marketing across locations, has been a distinctive feature of global value chains (GVCs) for decades (Baldwin and Freeman 2021). From the perspective of international trade statistics, these activities result in manufactured intermediate inputs crossing borders multiple times, creating issues of double counting in traditional or gross trade statistics (Johnson and Noguera 2012; Timmer et al. 2014). One way to analyze the role of supply chains in trade is with TiVA data that disaggregate gross exports into domestic versus imported content (Koopman, Wang, and Wei 2014; Timmer et al. 2014). This section presents TiVA statistics from a single-country perspective, with the United States as a reference (exporting) country. Statistics in this section are based on the North American Industry Classification System (NAICS). (See Table SAKTI-2. For related OECD TiVA indicators for the United States and other countries up to 2018, see OECD and sources therein.)
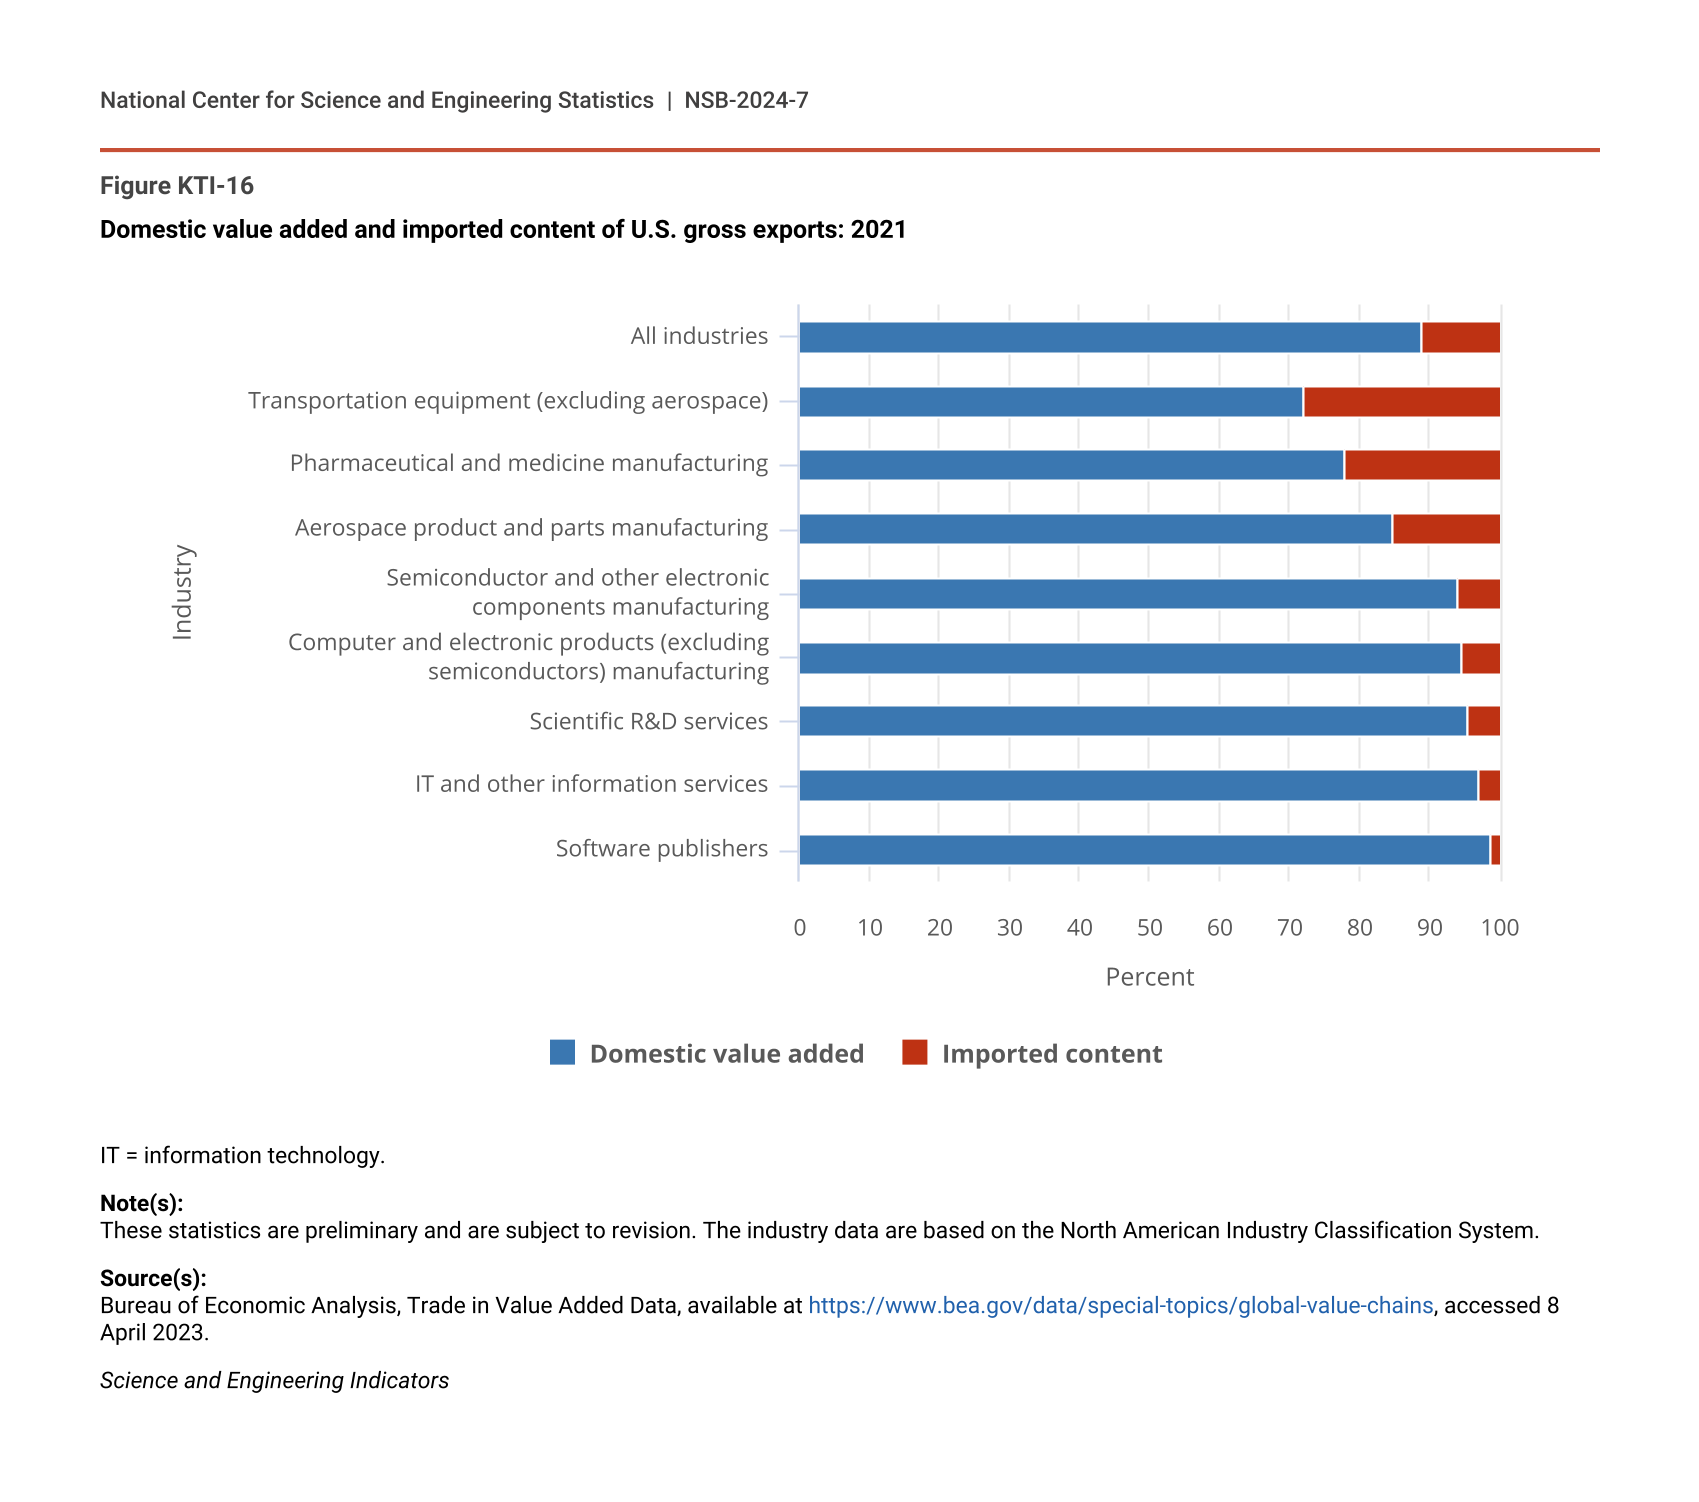
The interconnectedness of today’s global supply chains results in exports from a given country including value from domestic and imported inputs. Across all industries, the share of domestic content in U.S. gross exports is much larger than that of foreign content, fluctuating between 84% and 90% since 2007 (Table SKTI-4). This is consistent with the smaller role of trade overall in the U.S. economy compared with that in smaller advanced economies. Figure KTI-16 shows the distribution of domestic content versus imported content of U.S. gross exports for all industries and selected KTI industries. KTI services industries had the largest domestic content share. Among KTI manufacturing industries shown in the figure, transportation equipment (excluding aerospace) had the largest imported content share.
Domestic value added and imported content of U.S. gross exports: 2021
| Industry | Domestic value added | Imported content |
|---|---|---|
| Software publishers | 98.7 | 1.3 |
| IT and other information services | 97.1 | 2.9 |
| Scientific R&D services | 95.4 | 4.6 |
| Computer and electronic products (excluding semiconductors) manufacturing | 94.7 | 5.3 |
| Semiconductor and other electronic components manufacturing | 94.0 | 6.0 |
| Aerospace product and parts manufacturing | 84.8 | 15.2 |
| Pharmaceutical and medicine manufacturing | 78.0 | 22.0 |
| Transportation equipment (excluding aerospace) | 71.9 | 28.1 |
| All industries | 88.9 | 11.1 |
IT = information technology.
Note(s):
These statistics are preliminary and are subject to revision. The industry data are based on the North American Industry Classification System.
Source(s):
Bureau of Economic Analysis, Trade in Value Added Data, available at https://www.bea.gov/data/special-topics/global-value-chains, accessed 8 April 2023.
Science and Engineering Indicators
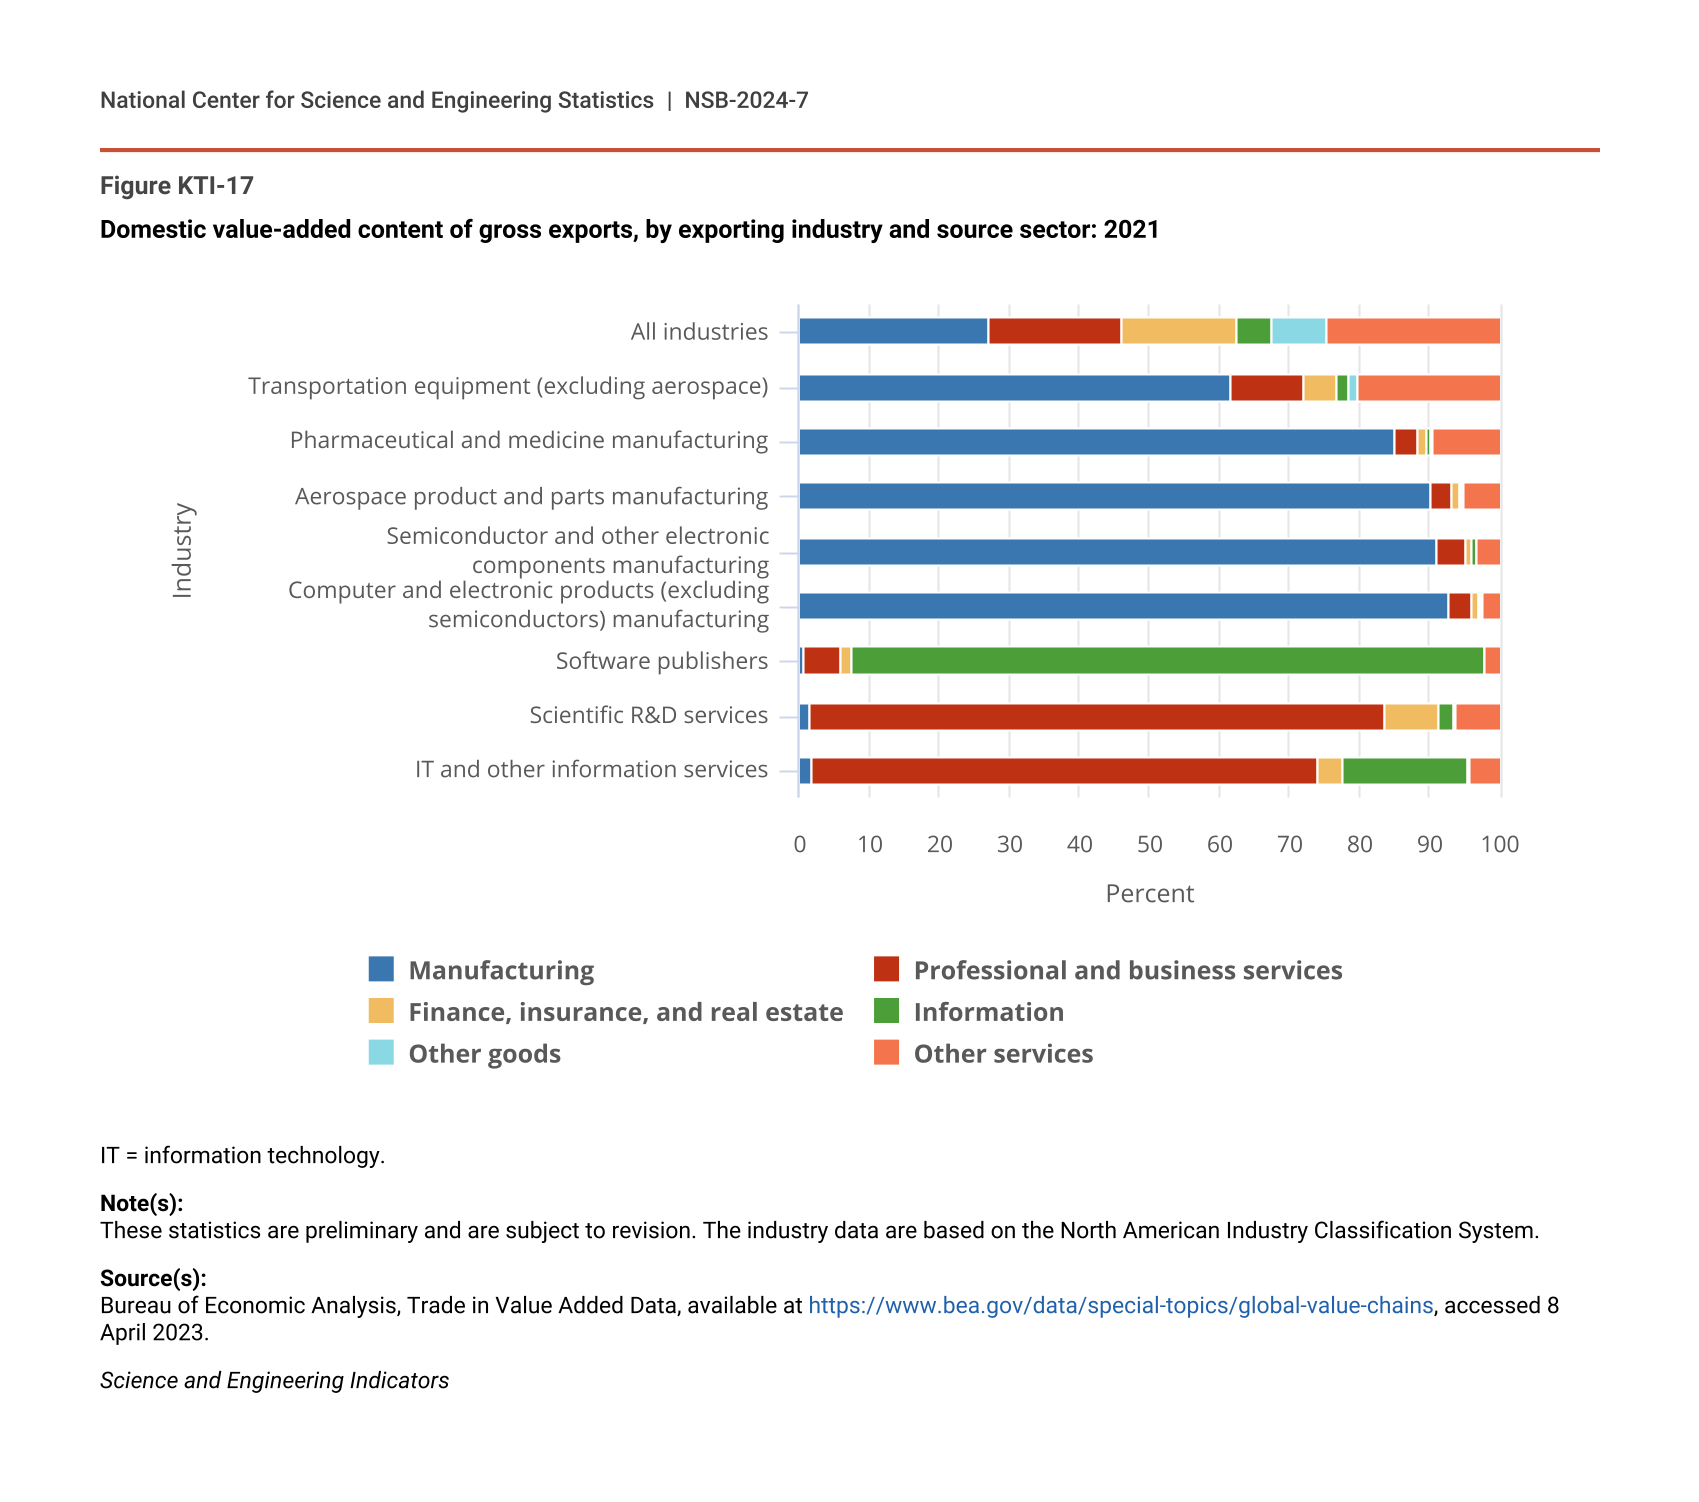
Figure KTI-17 shows the different industries that contributed to domestic value added in U.S. exports in 2021. Across all industries (KTI and non-KTI), domestically located manufacturing companies (regardless of domestic or foreign ownership) produced 27% of domestic value added of U.S. exports for that year. Thus, services and other nonmanufacturing industries produced almost three-fourths of the domestic value added in U.S. gross exports. However, the relative contribution of manufacturing and services to domestic value added in U.S. gross exports varies for specific exporting KTI industries. Notably, in 2021, nonmanufacturing industries contributed more domestic value added to the exports of the transportation equipment industry (excluding aerospace) compared with exports of other industries in Figure KTI-17.
Domestic value-added content of gross exports, by exporting industry and source sector: 2021
| Industry | Manufacturing | Professional and business services | Finance, insurance, and real estate | Information | Other goods | Other services |
|---|---|---|---|---|---|---|
| IT and other information services | 1.7 | 72.6 | 3.5 | 17.9 | 0.2 | 4.2 |
| Scientific R&D services | 1.4 | 82.1 | 8.0 | 1.9 | 0.4 | 6.2 |
| Software publishers | 0.6 | 5.5 | 1.3 | 90.5 | 0.1 | 2.0 |
| Computer and electronic products (excluding semiconductors) manufacturing | 92.9 | 3.3 | 0.8 | 0.4 | 0.1 | 2.5 |
| Semiconductor and other electronic components manufacturing | 91.0 | 4.2 | 0.9 | 0.5 | 0.1 | 3.2 |
| Aerospace product and parts manufacturing | 90.1 | 3.0 | 1.1 | 0.5 | 0.2 | 5.1 |
| Pharmaceutical and medicine manufacturing | 85.1 | 3.1 | 1.4 | 0.6 | 0.2 | 9.5 |
| Transportation equipment (excluding aerospace) | 61.7 | 10.2 | 4.9 | 1.9 | 1.0 | 20.3 |
| All industries | 27.1 | 18.9 | 16.4 | 5.2 | 7.7 | 24.6 |
IT = information technology.
Note(s):
These statistics are preliminary and are subject to revision. The industry data are based on the North American Industry Classification System.
Source(s):
Bureau of Economic Analysis, Trade in Value Added Data, available at https://www.bea.gov/data/special-topics/global-value-chains, accessed 8 April 2023.
Science and Engineering Indicators
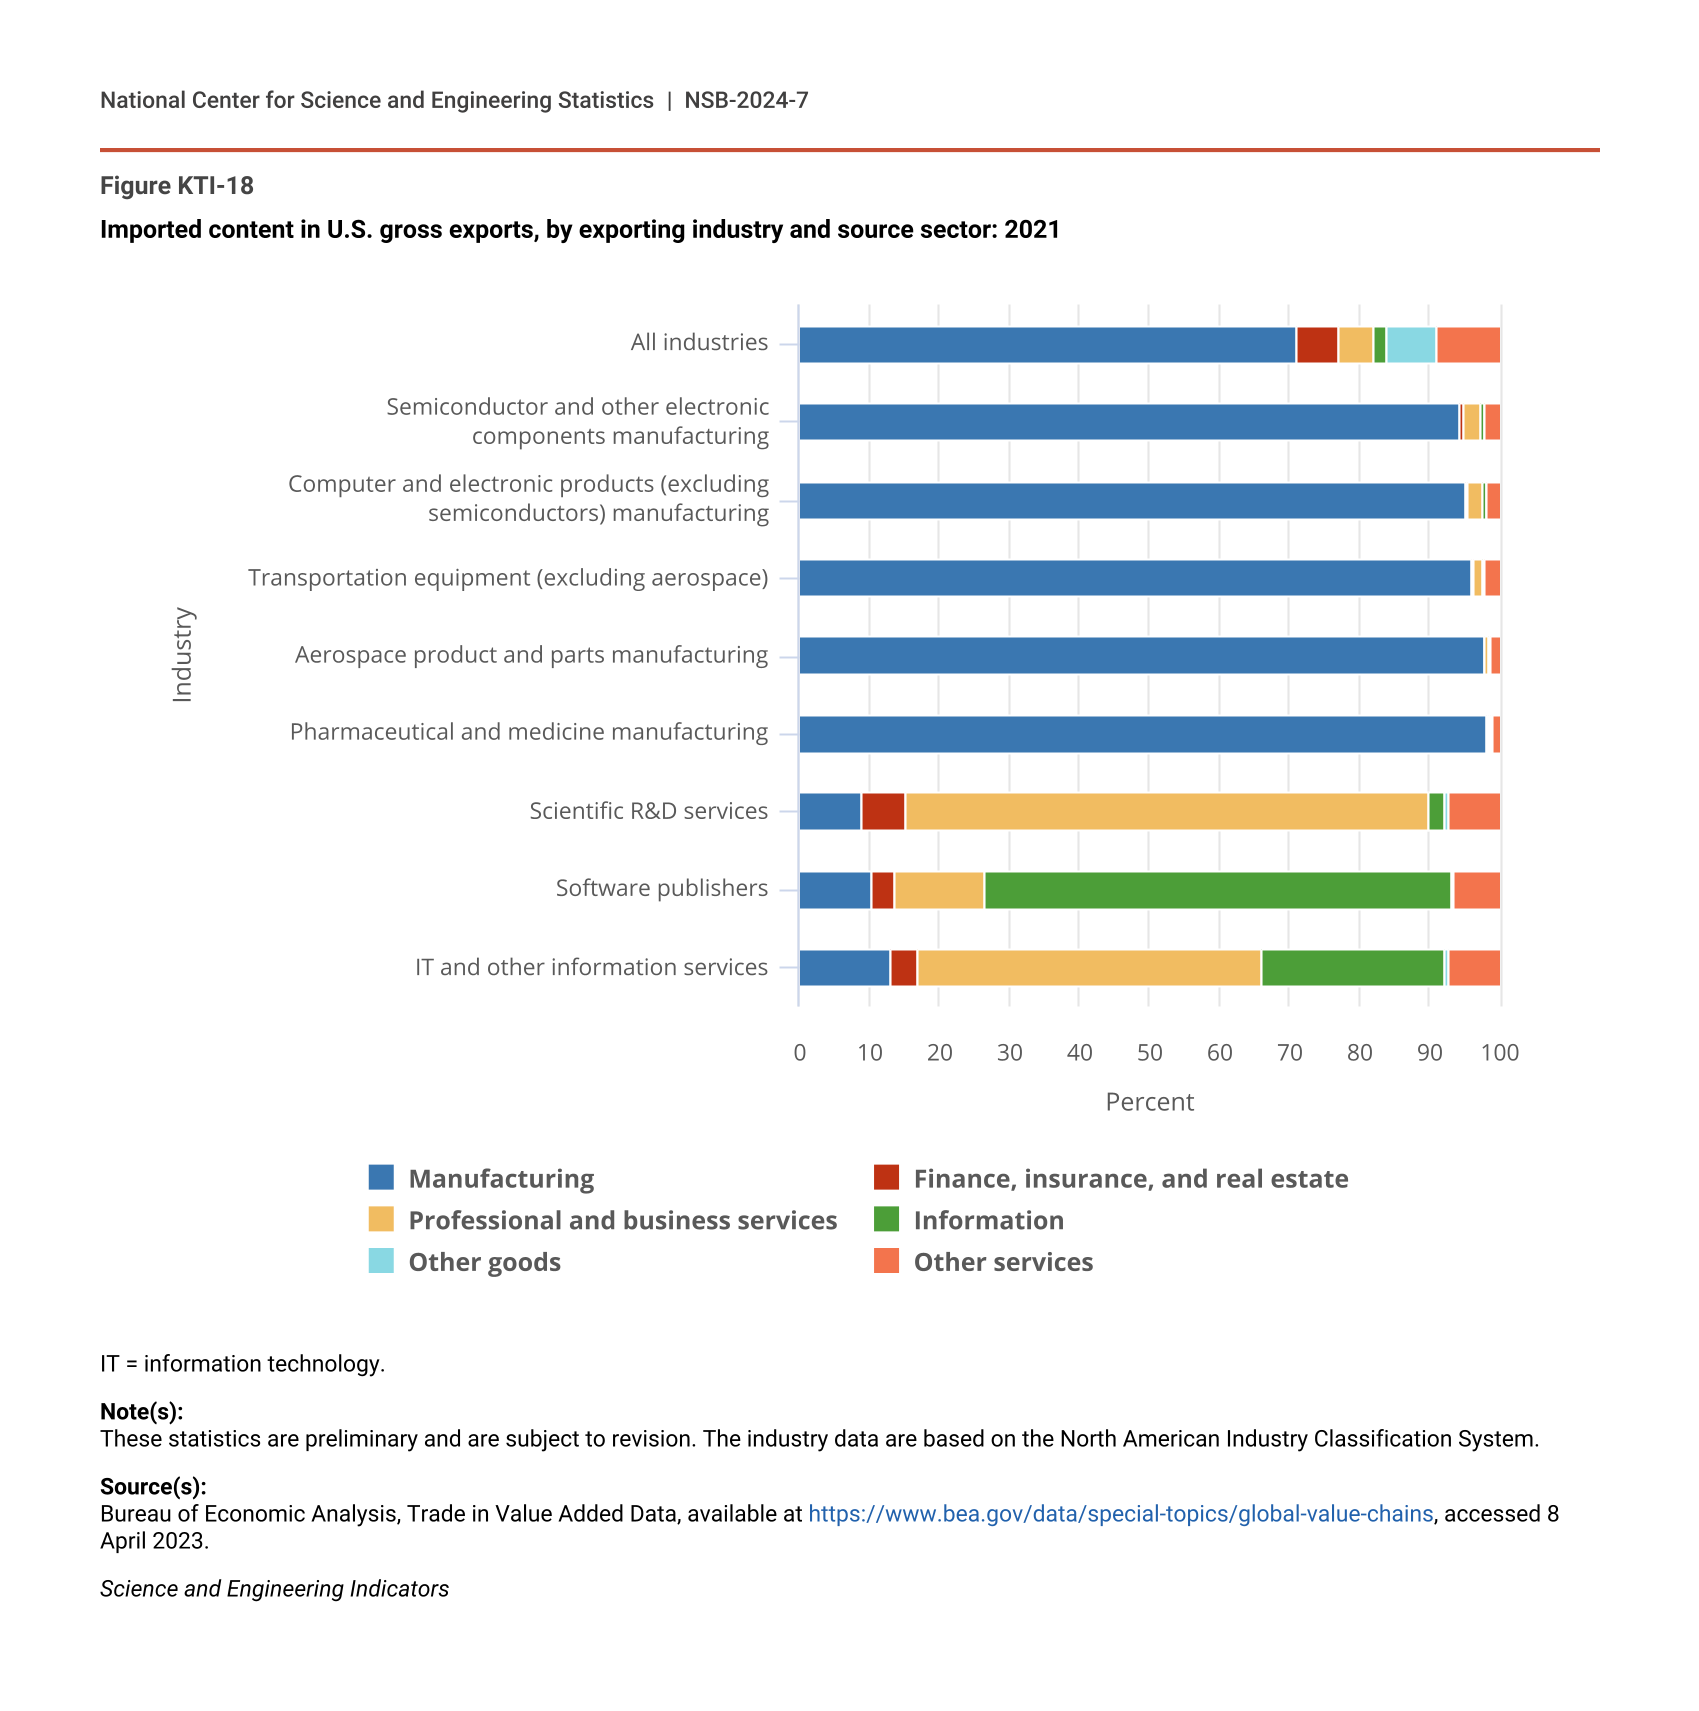
Figure KTI-18 shows the contribution of different industries to the foreign value-added content in U.S. exports in 2021. Similar to the case for domestic content, manufacturing imported content contributed the largest share for exports by KTI manufacturing industries. At the same time, for some U.S. exports such as those from pharmaceutical manufacturing, the value-added contribution of manufacturing was higher for the imported content (98%) than for the domestic content (85%) (Figure KTI-17 and Figure KTI-18).
Imported content in U.S. gross exports, by exporting industry and source sector: 2021
| Industry | Manufacturing | Finance, insurance, and real estate | Professional and business services | Information | Other goods | Other services |
|---|---|---|---|---|---|---|
| IT and other information services | 13.1 | 3.9 | 49.0 | 26.2 | 0.6 | 7.1 |
| Software publishers | 10.3 | 3.3 | 12.8 | 66.6 | 0.4 | 6.5 |
| Scientific R&D services | 9.0 | 6.1 | 74.8 | 2.3 | 0.8 | 7.0 |
| Pharmaceutical and medicine manufacturing | 98.2 | 0.2 | 0.4 | 0.1 | 0.1 | 0.9 |
| Aerospace product and parts manufacturing | 97.8 | 0.2 | 0.6 | 0.2 | 0.1 | 1.1 |
| Transportation equipment (excluding aerospace) | 95.9 | 0.5 | 1.0 | 0.3 | 0.2 | 2.0 |
| Computer and electronic products (excluding semiconductors) manufacturing | 95.1 | 0.5 | 2.1 | 0.5 | 0.1 | 1.7 |
| Semiconductor and other electronic components manufacturing | 94.4 | 0.5 | 2.5 | 0.5 | 0.2 | 2.0 |
| All industries | 71.1 | 5.9 | 5.1 | 1.8 | 7.0 | 9.0 |
IT = information technology.
Note(s):
These statistics are preliminary and are subject to revision. The industry data are based on the North American Industry Classification System.
Source(s):
Bureau of Economic Analysis, Trade in Value Added Data, available at https://www.bea.gov/data/special-topics/global-value-chains, accessed 8 April 2023.
Science and Engineering Indicators
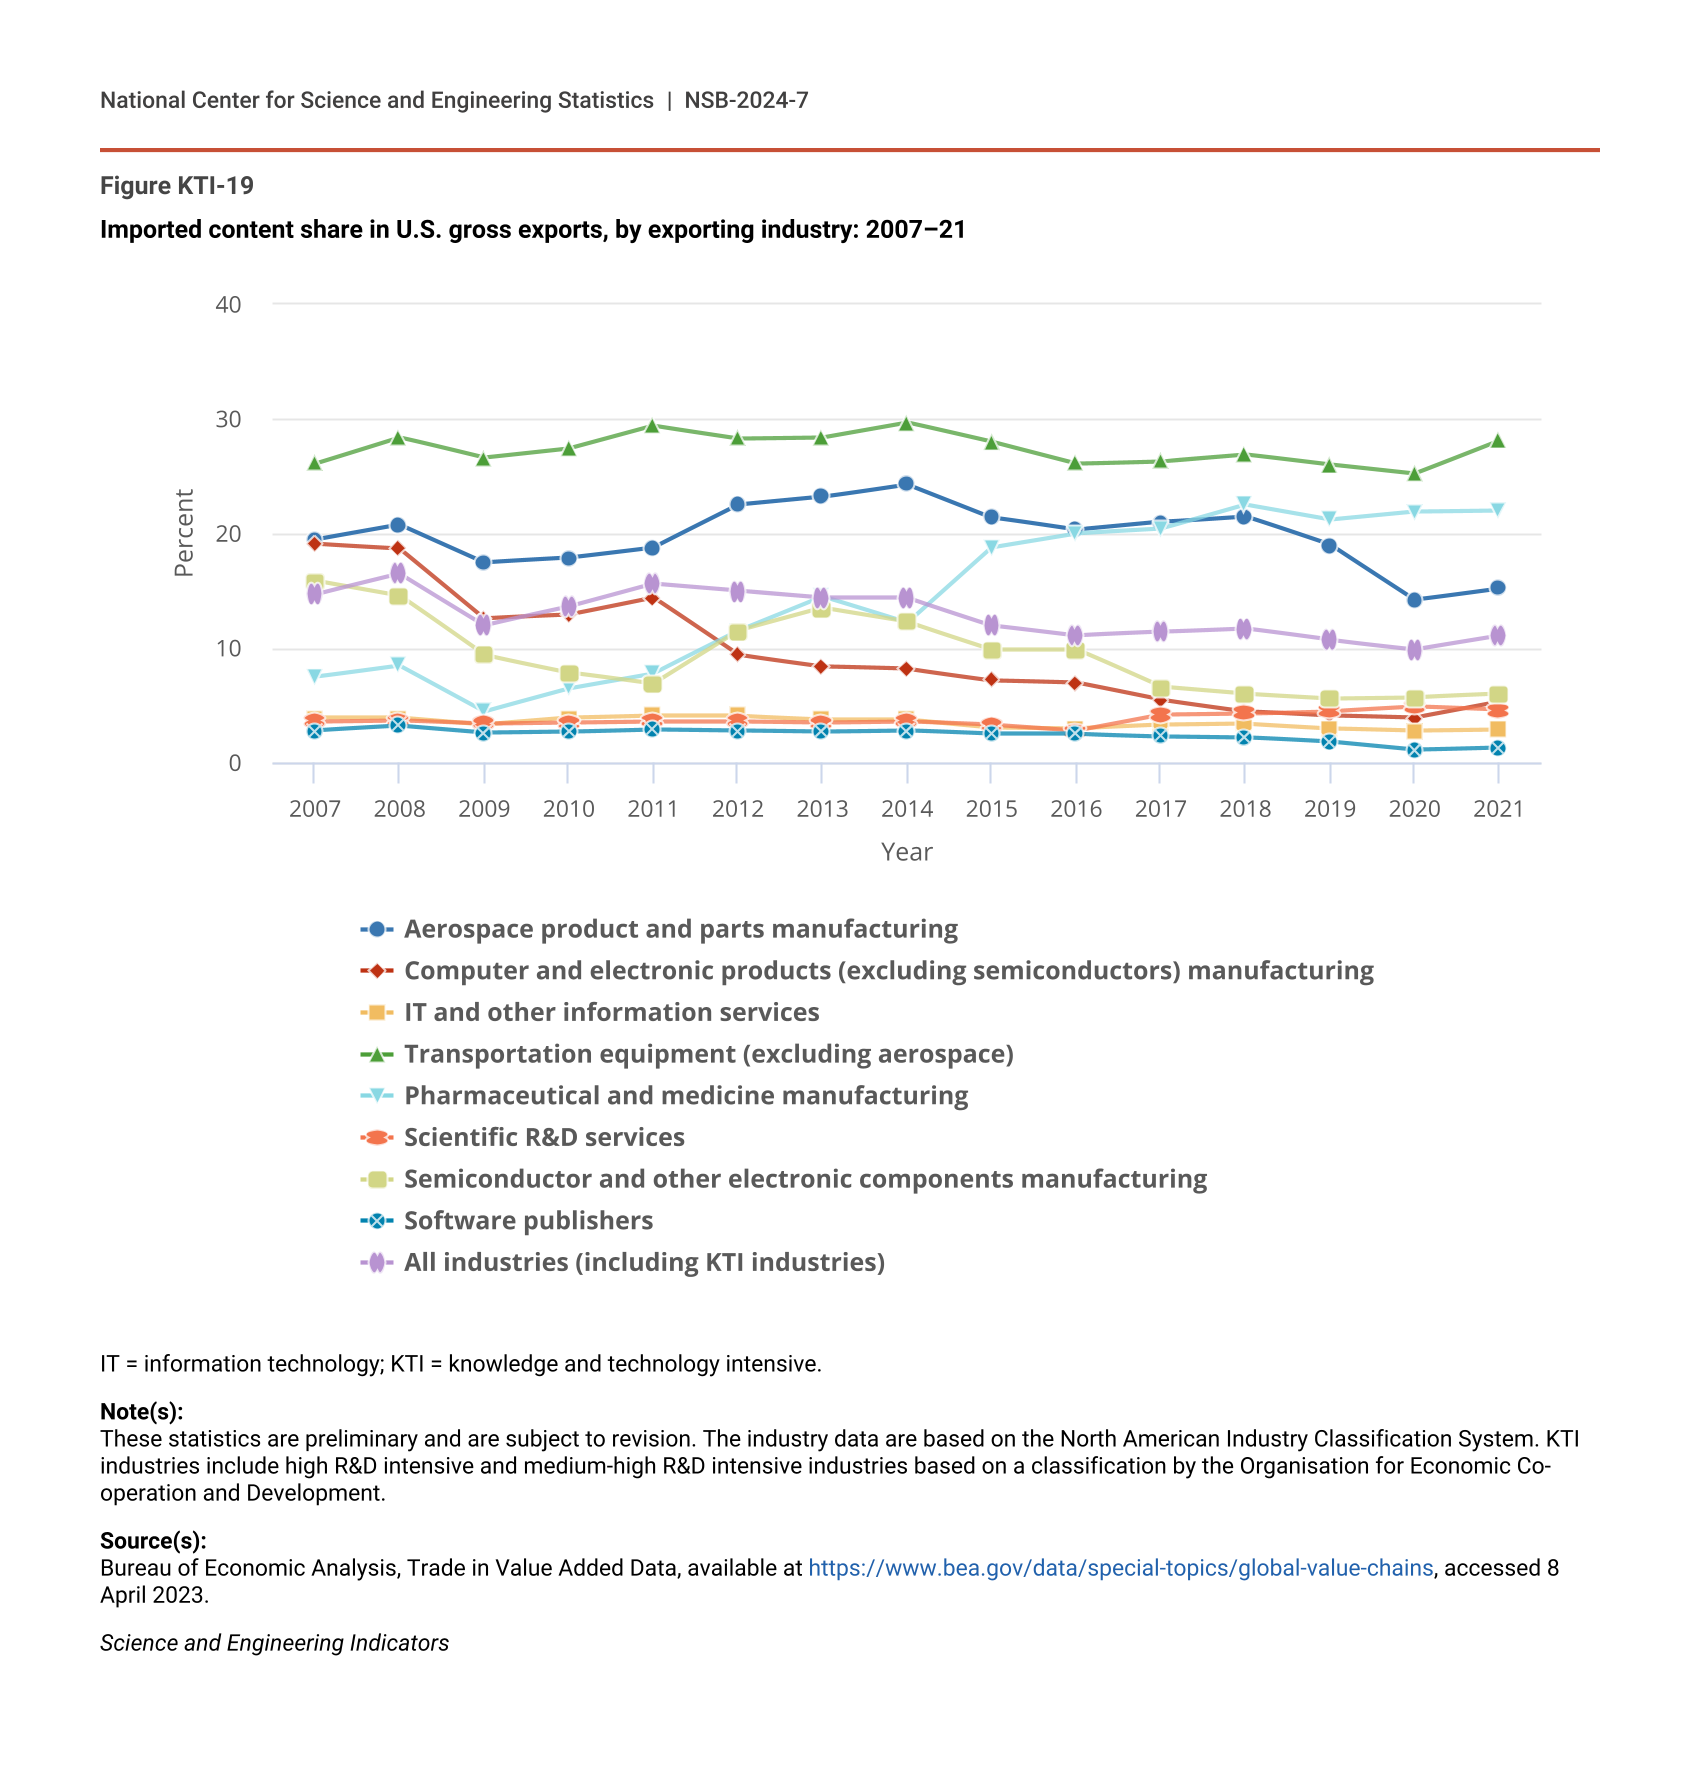
Figure KTI-19 examines trends in the imported content of U.S. exports within selected KTI industries. Across all industries (KTI and non-KTI), imported content declined from 17% in 2008 at the beginning of the financial crisis to 12% in 2015 to around 10% since 2019.
Imported content share in U.S. gross exports, by exporting industry: 2007–21
| Year | Aerospace product and parts manufacturing | Computer and electronic products (excluding semiconductors) manufacturing | IT and other information services | Transportation equipment (excluding aerospace) | Pharmaceutical and medicine manufacturing | Scientific R&D services | Semiconductor and other electronic components manufacturing | Software publishers | All industries (including KTI industries) |
|---|---|---|---|---|---|---|---|---|---|
| 2007 | 19.5 | 19.1 | 3.9 | 26.1 | 7.5 | 3.6 | 15.9 | 2.8 | 14.7 |
| 2008 | 20.8 | 18.7 | 3.9 | 28.4 | 8.5 | 3.7 | 14.6 | 3.2 | 16.5 |
| 2009 | 17.5 | 12.6 | 3.3 | 26.6 | 4.5 | 3.4 | 9.4 | 2.6 | 12.0 |
| 2010 | 17.9 | 12.9 | 3.9 | 27.4 | 6.5 | 3.5 | 7.9 | 2.7 | 13.6 |
| 2011 | 18.8 | 14.4 | 4.1 | 29.4 | 7.8 | 3.6 | 6.9 | 2.9 | 15.6 |
| 2012 | 22.5 | 9.4 | 4.1 | 28.3 | 11.5 | 3.6 | 11.5 | 2.8 | 15.0 |
| 2013 | 23.2 | 8.4 | 3.8 | 28.4 | 14.5 | 3.5 | 13.5 | 2.7 | 14.4 |
| 2014 | 24.3 | 8.2 | 3.8 | 29.7 | 12.2 | 3.6 | 12.3 | 2.8 | 14.4 |
| 2015 | 21.4 | 7.2 | 3.1 | 28.0 | 18.8 | 3.3 | 9.9 | 2.5 | 12.0 |
| 2016 | 20.3 | 7.0 | 3.0 | 26.1 | 20.0 | 2.8 | 9.9 | 2.5 | 11.1 |
| 2017 | 21.0 | 5.5 | 3.3 | 26.3 | 20.4 | 4.2 | 6.6 | 2.3 | 11.4 |
| 2018 | 21.5 | 4.5 | 3.4 | 26.9 | 22.5 | 4.3 | 6.0 | 2.2 | 11.7 |
| 2019 | 19.0 | 4.1 | 3.0 | 26.0 | 21.2 | 4.5 | 5.6 | 1.8 | 10.7 |
| 2020 | 14.2 | 3.9 | 2.8 | 25.2 | 21.9 | 4.9 | 5.7 | 1.1 | 9.9 |
| 2021 | 15.2 | 5.3 | 2.9 | 28.1 | 22.0 | 4.6 | 6.0 | 1.3 | 11.1 |
IT = information technology; KTI = knowledge and technology intensive.
Note(s):
These statistics are preliminary and are subject to revision. The industry data are based on the North American Industry Classification System. KTI industries include high R&D intensive and medium-high R&D intensive industries based on a classification by the Organisation for Economic Co-operation and Development.
Source(s):
Bureau of Economic Analysis, Trade in Value Added Data, available at https://www.bea.gov/data/special-topics/global-value-chains, accessed 8 April 2023.
Science and Engineering Indicators
The figure also shows that the share of imported content of U.S. exports has been the largest for transportation equipment (excluding aerospace) manufacturing, at 25% or more since 2007. The imported content share of pharmaceutical and medicine manufacturing exports increased from the single digits in the late 2000s to 20% in 2016, plateauing around 22% since then for the second-highest share of imported content among U.S. KTI industries. For exports by the aerospace product and parts manufacturing industry, this share fluctuated around 20% from 2007 to 2019, declining to about 15% since 2019. The imported content shares of U.S. exports by the computer and electronic products manufacturing and semiconductor manufacturing industries have been in the single digits since 2012 and 2017, respectively.