 An official website of the United States government
 Teachers of Mathematics and Science
Teachers play an essential role in student learning, and it is important that all students have access to qualified and effective teachers (NASEM 2020). As noted in the National Academies of Sciences, Engineering, and Medicine (NASEM) report Changing Expectations for the K–12 Teacher Workforce, “there is no uniformly agreed upon means of determining the ‘quality’ of teachers, but there is long-standing evidence from a variety of settings that teacher qualifications are inequitably distributed with students of color and students living in poverty tending to be assigned to less experienced and less credentialed teachers” (NASEM 2020:76). Some indicators of teacher qualifications—such as teacher certification, years of teaching experience, and a degree in the subject taught—vary widely across student demographic groups, and highly qualified teachers are less prevalent at schools with high-minority or high-poverty populations (Goldhaber, Quince, and Theobald 2018; NASEM 2020; Rahman et al. 2017).
This section uses data from the 2017–18 National Teacher and Principal Survey (NTPS) and the 2018 Teaching and Learning International Survey (TALIS) to report on characteristics of public middle and high school mathematics and science teachers in the United States and internationally.
U.S. Mathematics and Science Teachers
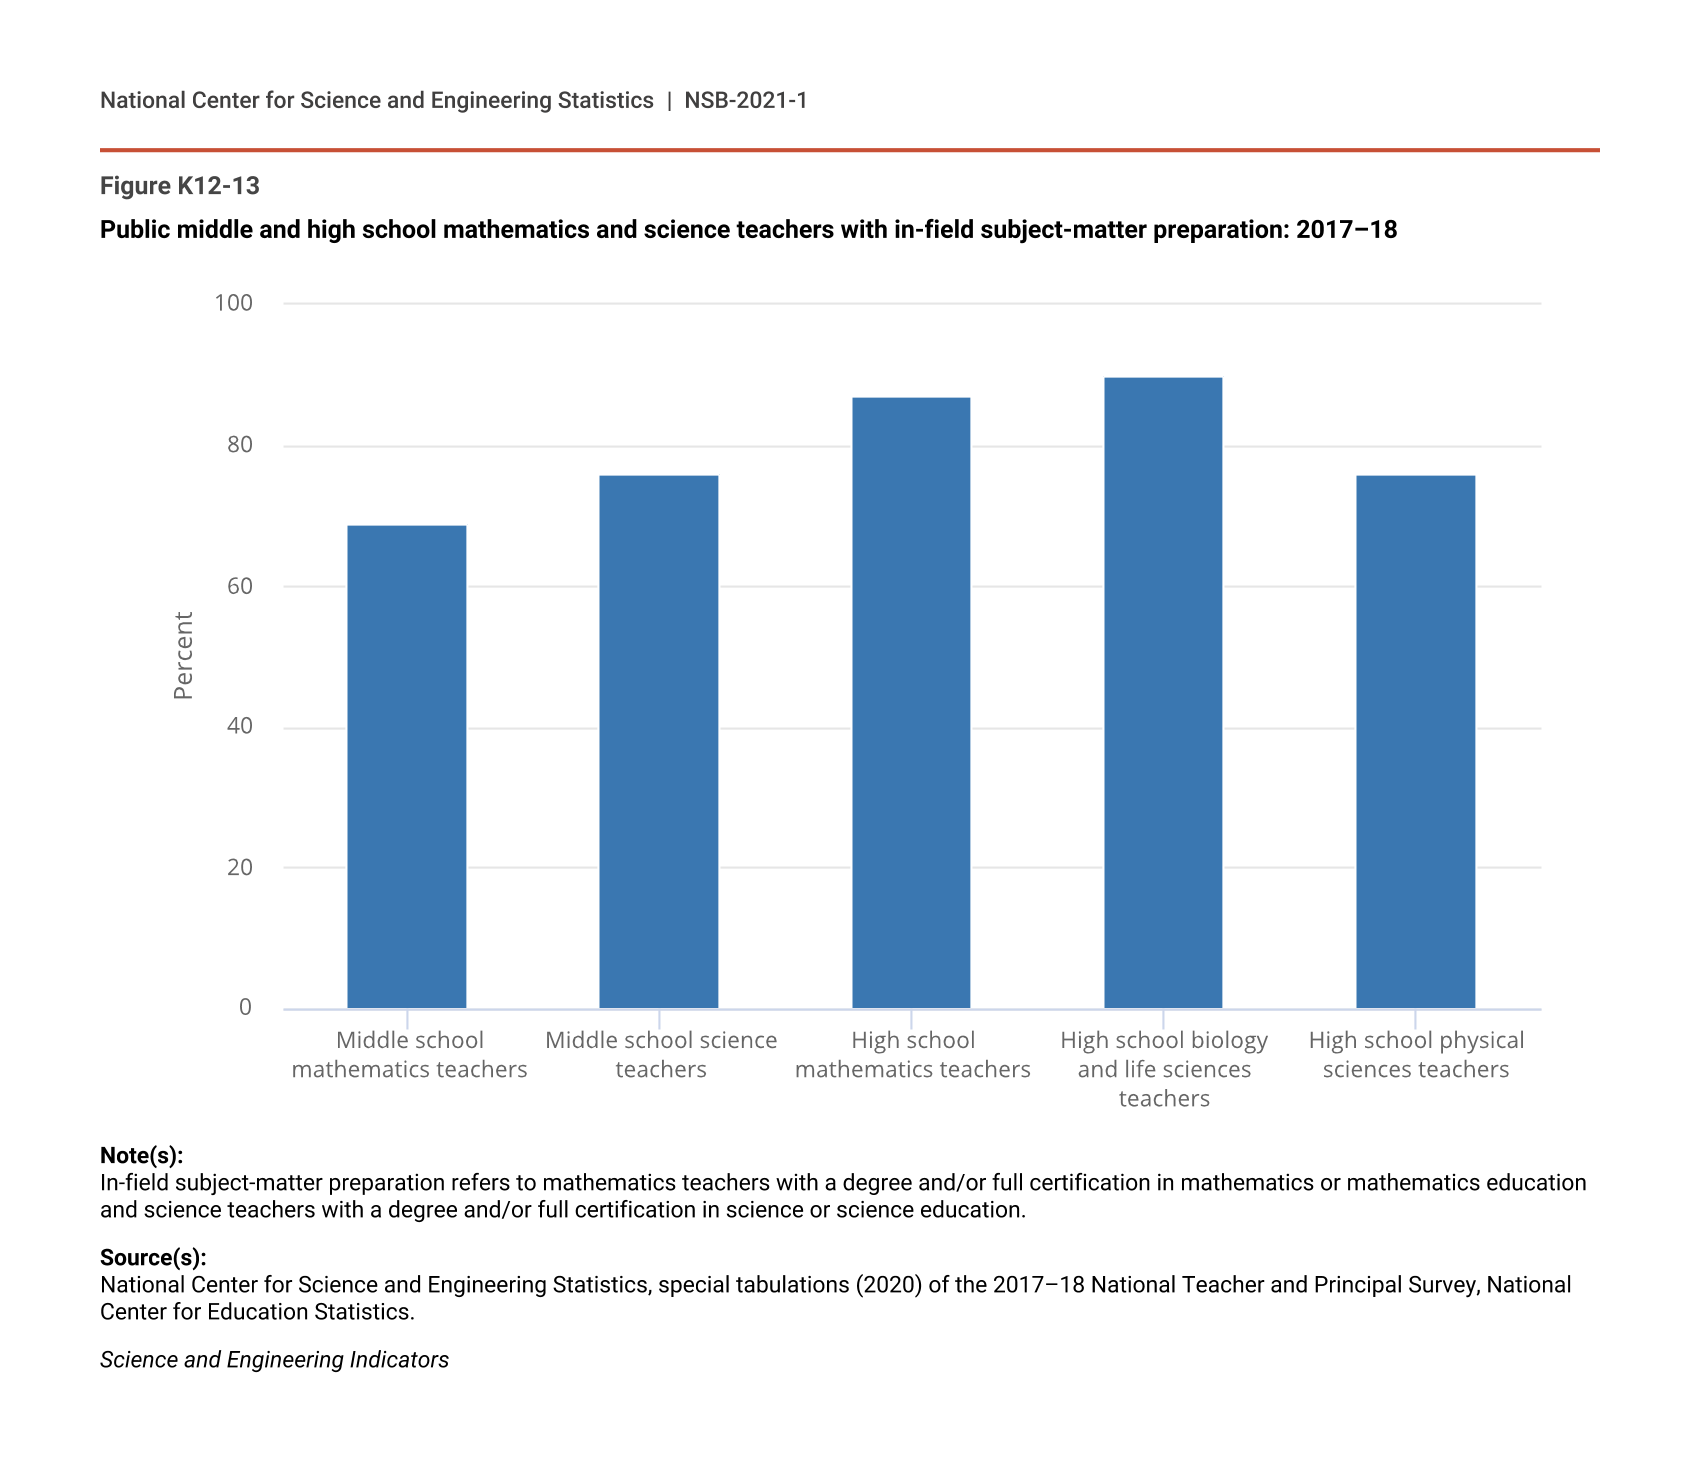
More than 90% of the nation’s public middle and high school mathematics and science teachers held a regular or advanced teaching certification, and nearly all held a bachelor’s degree or higher (Table K12-2). Their average annual salary was approximately $60,000 in 2017–18. A key aspect of teacher preparation is whether teachers have an academic degree or certification in the specific subject that they teach, referred to as an in-field degree. Research suggests that subject matter teachers with an in-field degree or certification are more effective (Shah et al. 2019). At the middle school level, 69% of mathematics teachers and 76% of science teachers held an in-field degree or certification (in mathematics or mathematics education, and science or science education, respectively) (Figure K12-13). At the high school level, about 90% of mathematics teachers and biology or life sciences teachers held in-field degrees or certifications, and 76% of physical sciences teachers did so.
Public middle and high school teachers with selected characteristics and average annual salaries of teachers, by teaching field: 2017–18
a Other teachers include those who teach any subject other than mathematics or science.
Source(s):
National Center for Science and Engineering Statistics, special tabulations (2020) of the 2017–18 National Teacher and Principal Survey, National Center for Education Statistics.
Science and Engineering Indicators
Public middle and high school mathematics and science teachers with in-field subject-matter preparation: 2017–18
| Teachers | In-field preparation |
|---|---|
| Middle school mathematics teachers | 69 |
| Middle school science teachers | 76 |
| High school mathematics teachers | 87 |
| High school biology and life sciences teachers | 90 |
| High school physical sciences teachers | 76 |
Note(s):
In-field subject-matter preparation refers to mathematics teachers with a degree and/or full certification in mathematics or mathematics education and science teachers with a degree and/or full certification in science or science education.
Source(s):
National Center for Science and Engineering Statistics, special tabulations (2020) of the 2017–18 National Teacher and Principal Survey, National Center for Education Statistics.
Science and Engineering Indicators
The percentage of teachers with in-field degrees or certifications varied by minority enrollment, school poverty level, and region. Middle school mathematics teachers with in-field degrees were less prevalent at high-minority-enrollment schools, and both middle school mathematics and science teachers with in-field degrees were less prevalent at high-poverty schools (Table K12-3). For example, 75% of middle school mathematics teachers at schools with less than 25% minority enrollment had an in-field degree or certification, compared with 61% of teachers at schools with 75% or more minority enrollment. Similarly, 76% and 80% of middle school science and mathematics teachers at schools with less than 35% of students eligible for free or reduced-price lunch had an in-field degree, compared with 62% and 68%, respectively, of teachers at schools with 75% or more students eligible. At the U.S. regional level, high school physical sciences and biology or life sciences teachers with in-field degrees were least prevalent in the South compared with other regions of the country: 60% of high school physical sciences teachers in the South had an in-field degree, compared with at least 79% of these teachers in the Northeast, Midwest, and West.
Public middle and high school mathematics and science teachers with in-field subject-matter preparation, by teaching field and selected school characteristics: 2017–18
a Minority enrollment includes students who are Black, Hispanic, Asian, Native Hawaiian or Pacific Islander, American Indian or Alaska Native, and Two or more races.
b School poverty level is the percentage of students in school eligible for free or reduced-price lunch.
Note(s):
In-field subject-matter preparation refers to mathematics teachers with a degree and/or full certification in mathematics or mathematics education and science teachers with a degree and/or full certification in science or science education.
Source(s):
National Center for Science and Engineering Statistics, special tabulations (2020) of the 2017–18 National Teacher and Principal Survey, National Center for Education Statistics.
Science and Engineering Indicators
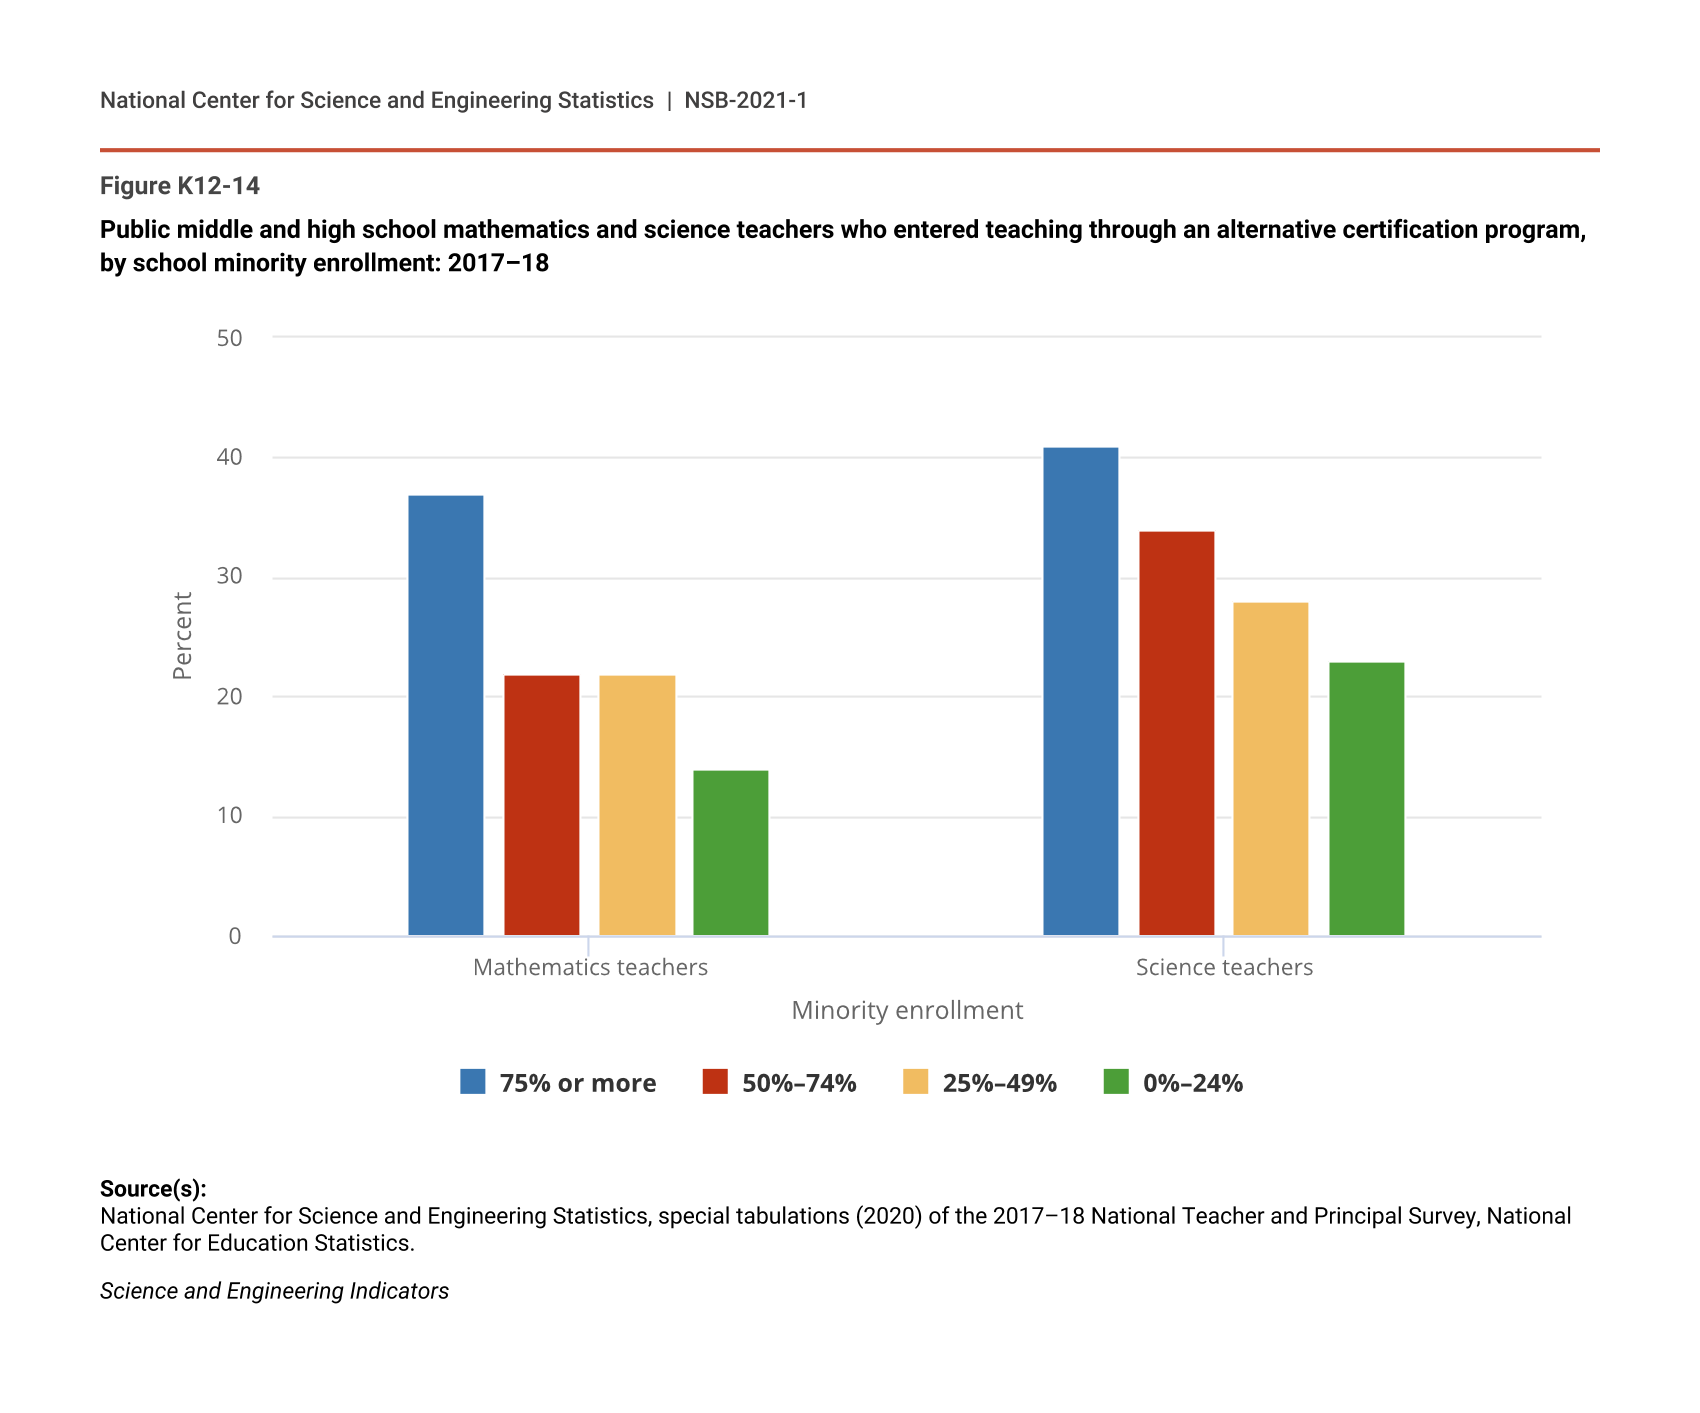
Another aspect of teacher qualification is the route that teachers take to earn their certification, either a traditional or alternative route. In a traditional certification program, prospective mathematics and science teachers typically complete coursework and spend time as a student teacher with a mentor teacher before earning their credential and teaching in their own classroom. Alternative routes to certification vary by state but typically allow candidates to begin teaching in their own classroom while simultaneously taking coursework needed to earn a credential (Carver-Thomas and Darling-Hammond 2017; Whitford, Zhang, and Katsiyannis 2018). Nationally, 24% of mathematics teachers and 30% of science teachers entered teaching through an alternative route to certification; however, greater proportions of teachers at high-minority-enrollment and high-poverty-enrollment schools entered through an alternative route to certification (Table SK12-15). In schools with a minority enrollment of 75% or more, 37% of mathematics teachers and 41% of science teachers entered teaching through an alternative route, compared with 14% of mathematics teachers and 23% of science teachers at schools with less than 25% minority enrollment (Figure K12-14). Patterns were similar at schools with high- and low-poverty enrollment. Entry into teaching through an alternative route also varied widely by region of the country, with mathematics and science teachers in the South entering teaching through alternative programs at higher rates than teachers in the Northeast, Midwest, or West.
Public middle and high school mathematics and science teachers who entered teaching through an alternative certification program, by school minority enrollment: 2017–18
| Minority enrollment | 75% or more | 50%–74% | 25%–49% | 0%–24% |
|---|---|---|---|---|
| Mathematics teachers | 37 | 22 | 22 | 14 |
| Science teachers | 41 | 34 | 28 | 23 |
Source(s):
National Center for Science and Engineering Statistics, special tabulations (2020) of the 2017–18 National Teacher and Principal Survey, National Center for Education Statistics.
Science and Engineering Indicators
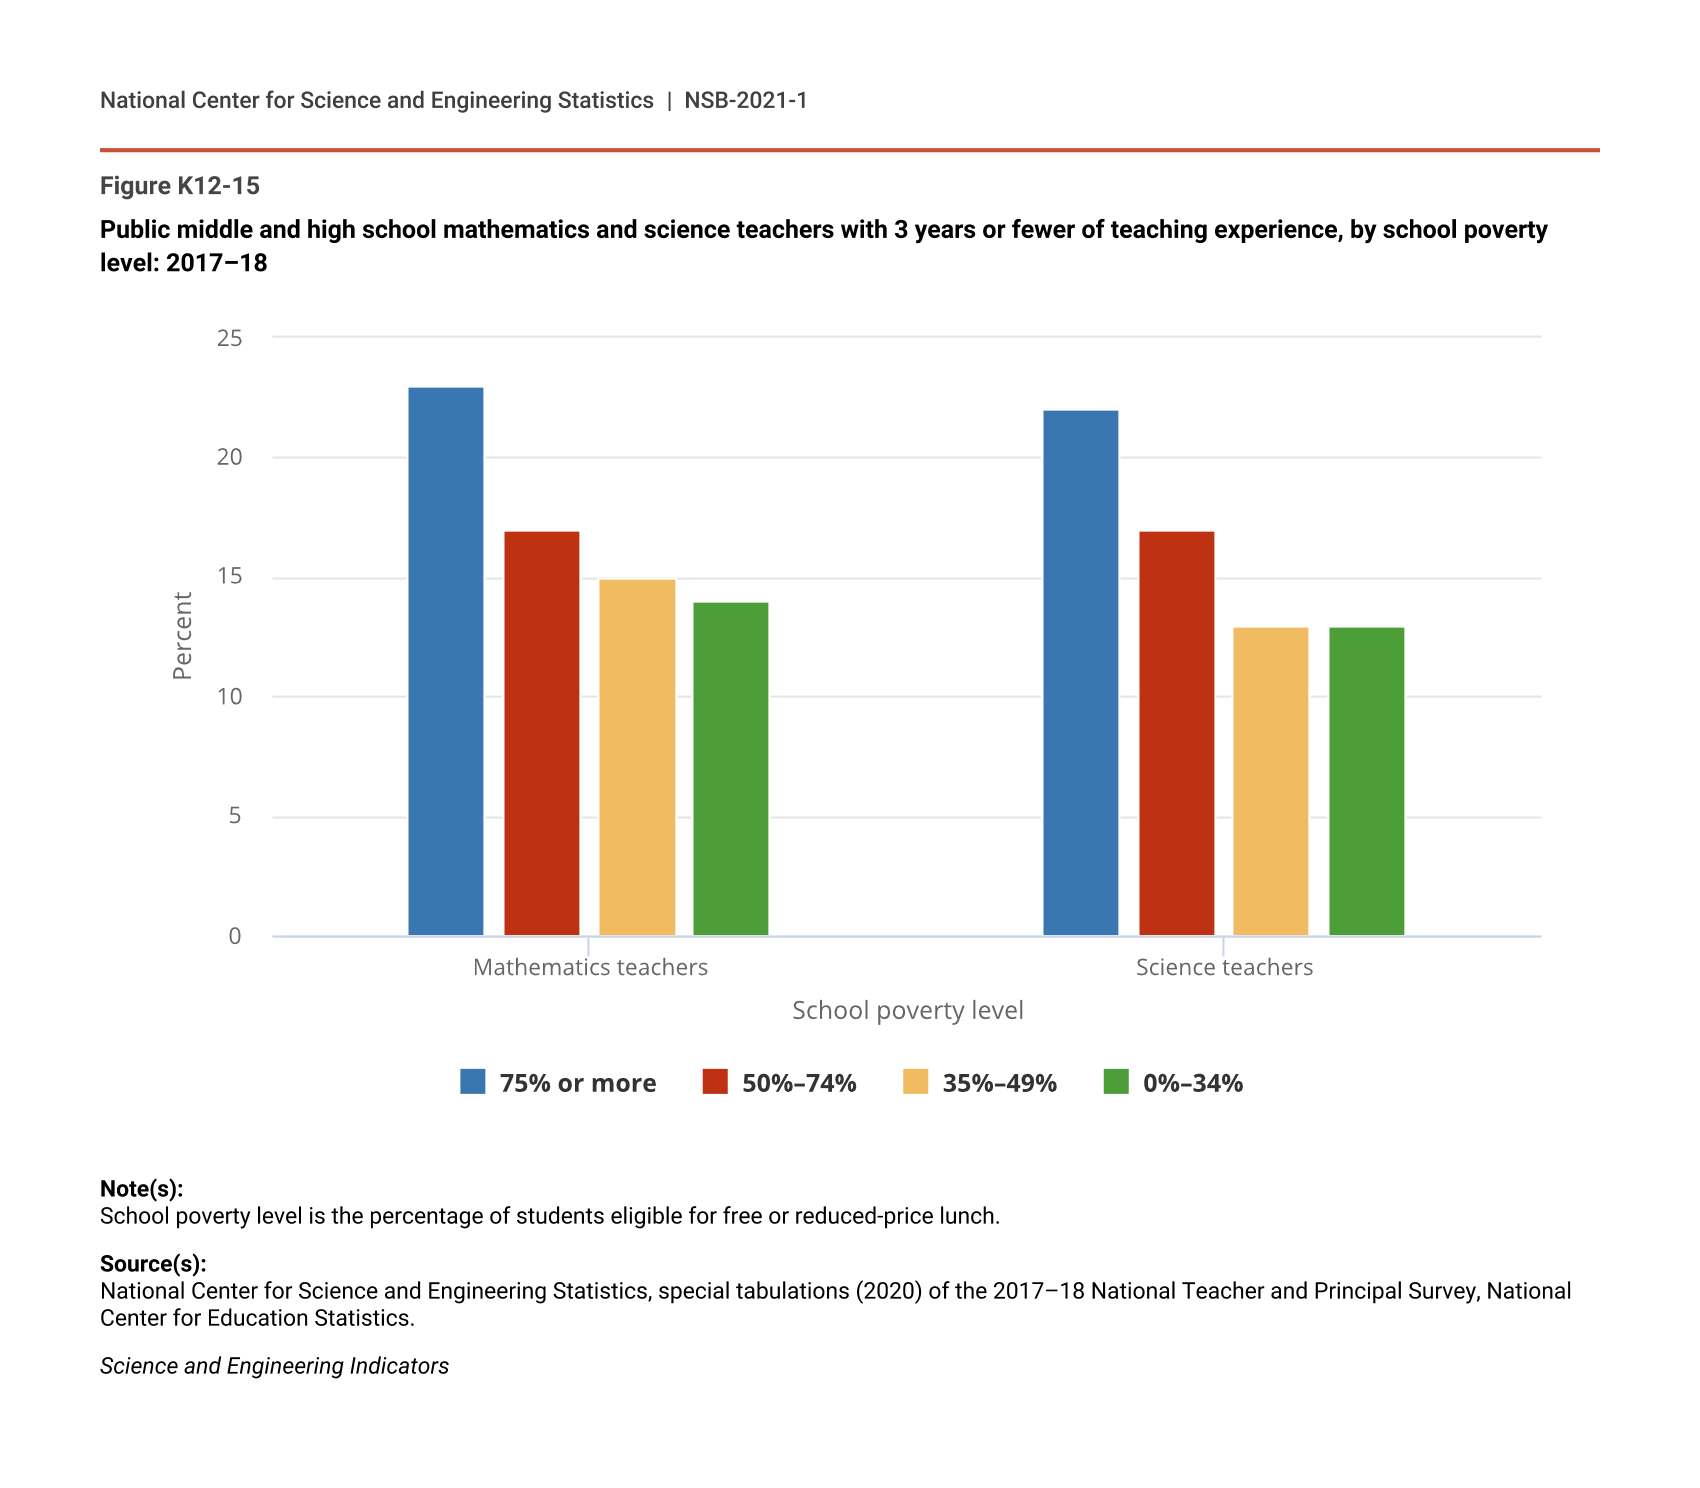
Less experienced mathematics and science teachers (as measured by years of teaching experience) were more prevalent at schools with high-minority and high-poverty enrollment (Table SK12-15). For example, 23% of teachers at high-poverty-enrollment schools had 3 years or fewer of teaching experience, compared with 14% of teachers at low-poverty-enrollment schools (Figure K12-15). There was also regional variation, particularly among science teachers, with 20% of science teachers in the South having 3 years or fewer of teaching experience, compared with 10% in the Northeast, 14% in the Midwest, and 15% in the West (Table SK12-16).
Public middle and high school mathematics and science teachers with 3 years or fewer of teaching experience, by school poverty level: 2017–18
| School poverty level | 75% or more | 50%–74% | 35%–49% | 0%–34% |
|---|---|---|---|---|
| Mathematics teachers | 23 | 17 | 15 | 14 |
| Science teachers | 22 | 17 | 13 | 13 |
Note(s):
School poverty level is the percentage of students eligible for free or reduced-price lunch.
Source(s):
National Center for Science and Engineering Statistics, special tabulations (2020) of the 2017–18 National Teacher and Principal Survey, National Center for Education Statistics.
Science and Engineering Indicators
The available data also provide information on the extent to which Black and Hispanic students are taught by teachers of the same race or ethnicity. Research indicates that Black, Hispanic, Native Hawaiian or Pacific Islander, and American Indian or Alaska Native students in general post higher scores on achievement tests and have higher levels of attendance and fewer suspensions when they have at least one same-race teacher (Egalite and Kisida 2018; Gershenson et al. 2018; NASEM 2020). Additionally, policymakers and educators want to increase the number of students from historically underrepresented minorities in STEM fields, and research suggests that having same-race STEM instructors encourages more underrepresented students to participate in STEM (Price 2010). Overall, in 2017–18, the population of middle and high school mathematics and science teachers was less racially and ethnically diverse than the U.S. student population. Approximately 80% of mathematics and science teachers were White, about 7% were Black, and 8% were Hispanic (Table K12-4). In contrast, the U.S. public school student population in 2019 was 48% White, 15% Black, and 27% Hispanic (Hussar et al. 2020).
Public middle and high school mathematics and science teachers who are White, Black, or Hispanic, by teaching field and minority enrollment in school: 2017–18
a Hispanic may be any race; race categories exclude Hispanic origin.
Source(s):
National Center for Science and Engineering Statistics, special tabulations (2020) of the 2017–18 National Teacher and Principal Survey, National Center for Education Statistics.
Science and Engineering Indicators
The findings from the 2017–18 NTPS data are consistent with this discrepancy. At schools with predominantly Black or Hispanic populations, the percentage of Black and Hispanic mathematics and science teachers was higher than at other schools, although still not as high as the percentage of Black or Hispanic students. At schools with more than 50% Black students, 41% of the mathematics teachers and 36% of the science teachers were Black; and at schools with more than 50% Hispanic students, 27% of the mathematics teachers and 31% of the science teachers were Hispanic (Table K12-4).
International Comparisons of Mathematics and Science Teachers
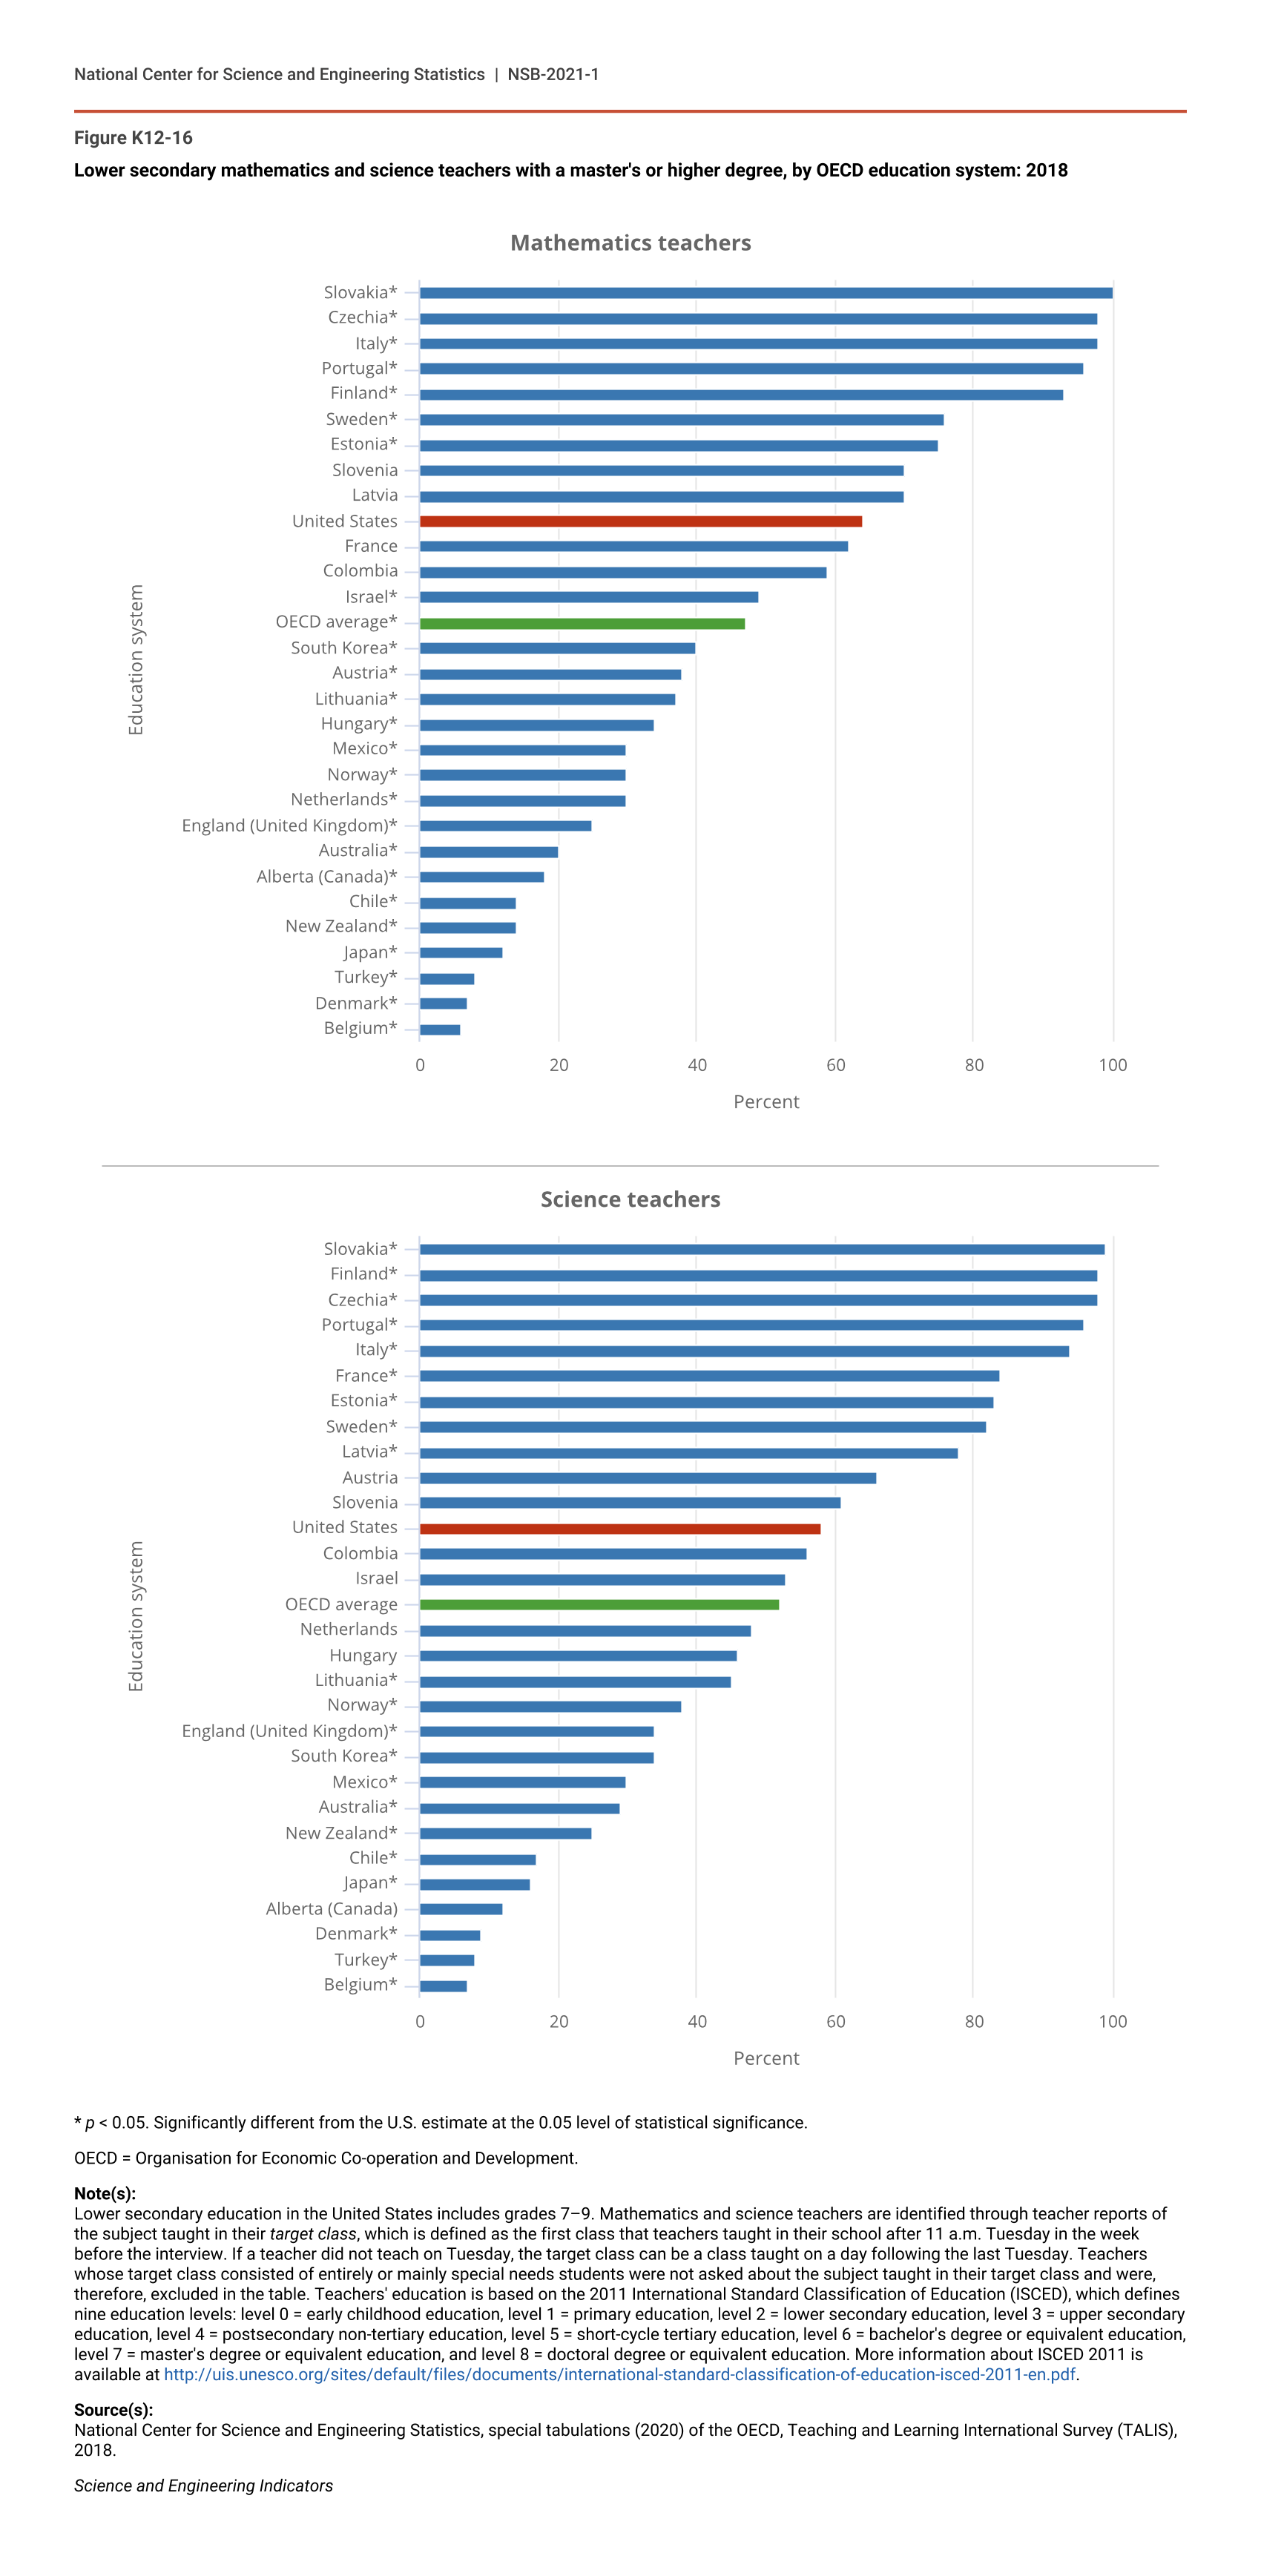
TALIS provides cross-country information on teacher attributes at the lower secondary level (grades 7–9). These data enable a comparison of U.S. mathematics and science teachers with their international peers on a variety of dimensions, although it is important to bear in mind that these dimensions are not measures of teacher quality or effectiveness. On average, a greater proportion of U.S. lower secondary mathematics teachers had a master’s degree or higher (64%), compared with teachers in OECD member countries (47%). The percentage of U.S. lower secondary science teachers with a master’s degree or higher (58%) was not significantly different from the average for teachers in OECD member countries (52%) (Figure K12-16). More than 90% of lower secondary mathematics and science teachers in Slovakia, Czechia, Italy, Portugal, and Finland had a master’s degree or higher, compared to less than 10% of lower secondary mathematics and science teachers in Belgium, Denmark, and Turkey.
Lower secondary mathematics and science teachers with a master's or higher degree, by OECD education system: 2018
| Education system | Mathematics teachers |
|---|---|
| Slovakia* | 100 |
| Czechia* | 98 |
| Italy* | 98 |
| Portugal* | 96 |
| Finland* | 93 |
| Sweden* | 76 |
| Estonia* | 75 |
| Slovenia | 70 |
| Latvia | 70 |
| United States | 64 |
| France | 62 |
| Colombia | 59 |
| Israel* | 49 |
| OECD average* | 47 |
| South Korea* | 40 |
| Austria* | 38 |
| Lithuania* | 37 |
| Hungary* | 34 |
| Mexico* | 30 |
| Norway* | 30 |
| Netherlands* | 30 |
| England (United Kingdom)* | 25 |
| Australia* | 20 |
| Alberta (Canada)* | 18 |
| Chile* | 14 |
| New Zealand* | 14 |
| Japan* | 12 |
| Turkey* | 8 |
| Denmark* | 7 |
| Belgium* | 6 |
| Education system | Science teachers |
|---|---|
| Slovakia* | 99 |
| Finland* | 98 |
| Czechia* | 98 |
| Portugal* | 96 |
| Italy* | 94 |
| France* | 84 |
| Estonia* | 83 |
| Sweden* | 82 |
| Latvia* | 78 |
| Austria | 66 |
| Slovenia | 61 |
| United States | 58 |
| Colombia | 56 |
| Israel | 53 |
| OECD average | 52 |
| Netherlands | 48 |
| Hungary | 46 |
| Lithuania* | 45 |
| Norway* | 38 |
| England (United Kingdom)* | 34 |
| South Korea* | 34 |
| Mexico* | 30 |
| Australia* | 29 |
| New Zealand* | 25 |
| Chile* | 17 |
| Japan* | 16 |
| Alberta (Canada) | 12 |
| Denmark* | 9 |
| Turkey* | 8 |
| Belgium* | 7 |
* p < 0.05. Significantly different from the U.S. estimate at the 0.05 level of statistical significance.
OECD = Organisation for Economic Co-operation and Development.
Note(s):
Lower secondary education in the United States includes grades 7–9. Mathematics and science teachers are identified through teacher reports of the subject taught in their target class, which is defined as the first class that teachers taught in their school after 11 a.m. Tuesday in the week before the interview. If a teacher did not teach on Tuesday, the target class can be a class taught on a day following the last Tuesday. Teachers whose target class consisted of entirely or mainly special needs students were not asked about the subject taught in their target class and were, therefore, excluded in the table. Teachers' education is based on the 2011 International Standard Classification of Education (ISCED), which defines nine education levels: level 0 = early childhood education, level 1 = primary education, level 2 = lower secondary education, level 3 = upper secondary education, level 4 = postsecondary non-tertiary education, level 5 = short-cycle tertiary education, level 6 = bachelor's degree or equivalent education, level 7 = master's degree or equivalent education, and level 8 = doctoral degree or equivalent education. More information about ISCED 2011 is available at http://uis.unesco.org/sites/default/files/documents/international-standard-classification-of-education-isced-2011-en.pdf.
Source(s):
National Center for Science and Engineering Statistics, special tabulations (2020) of the OECD, Teaching and Learning International Survey (TALIS), 2018.
Science and Engineering Indicators
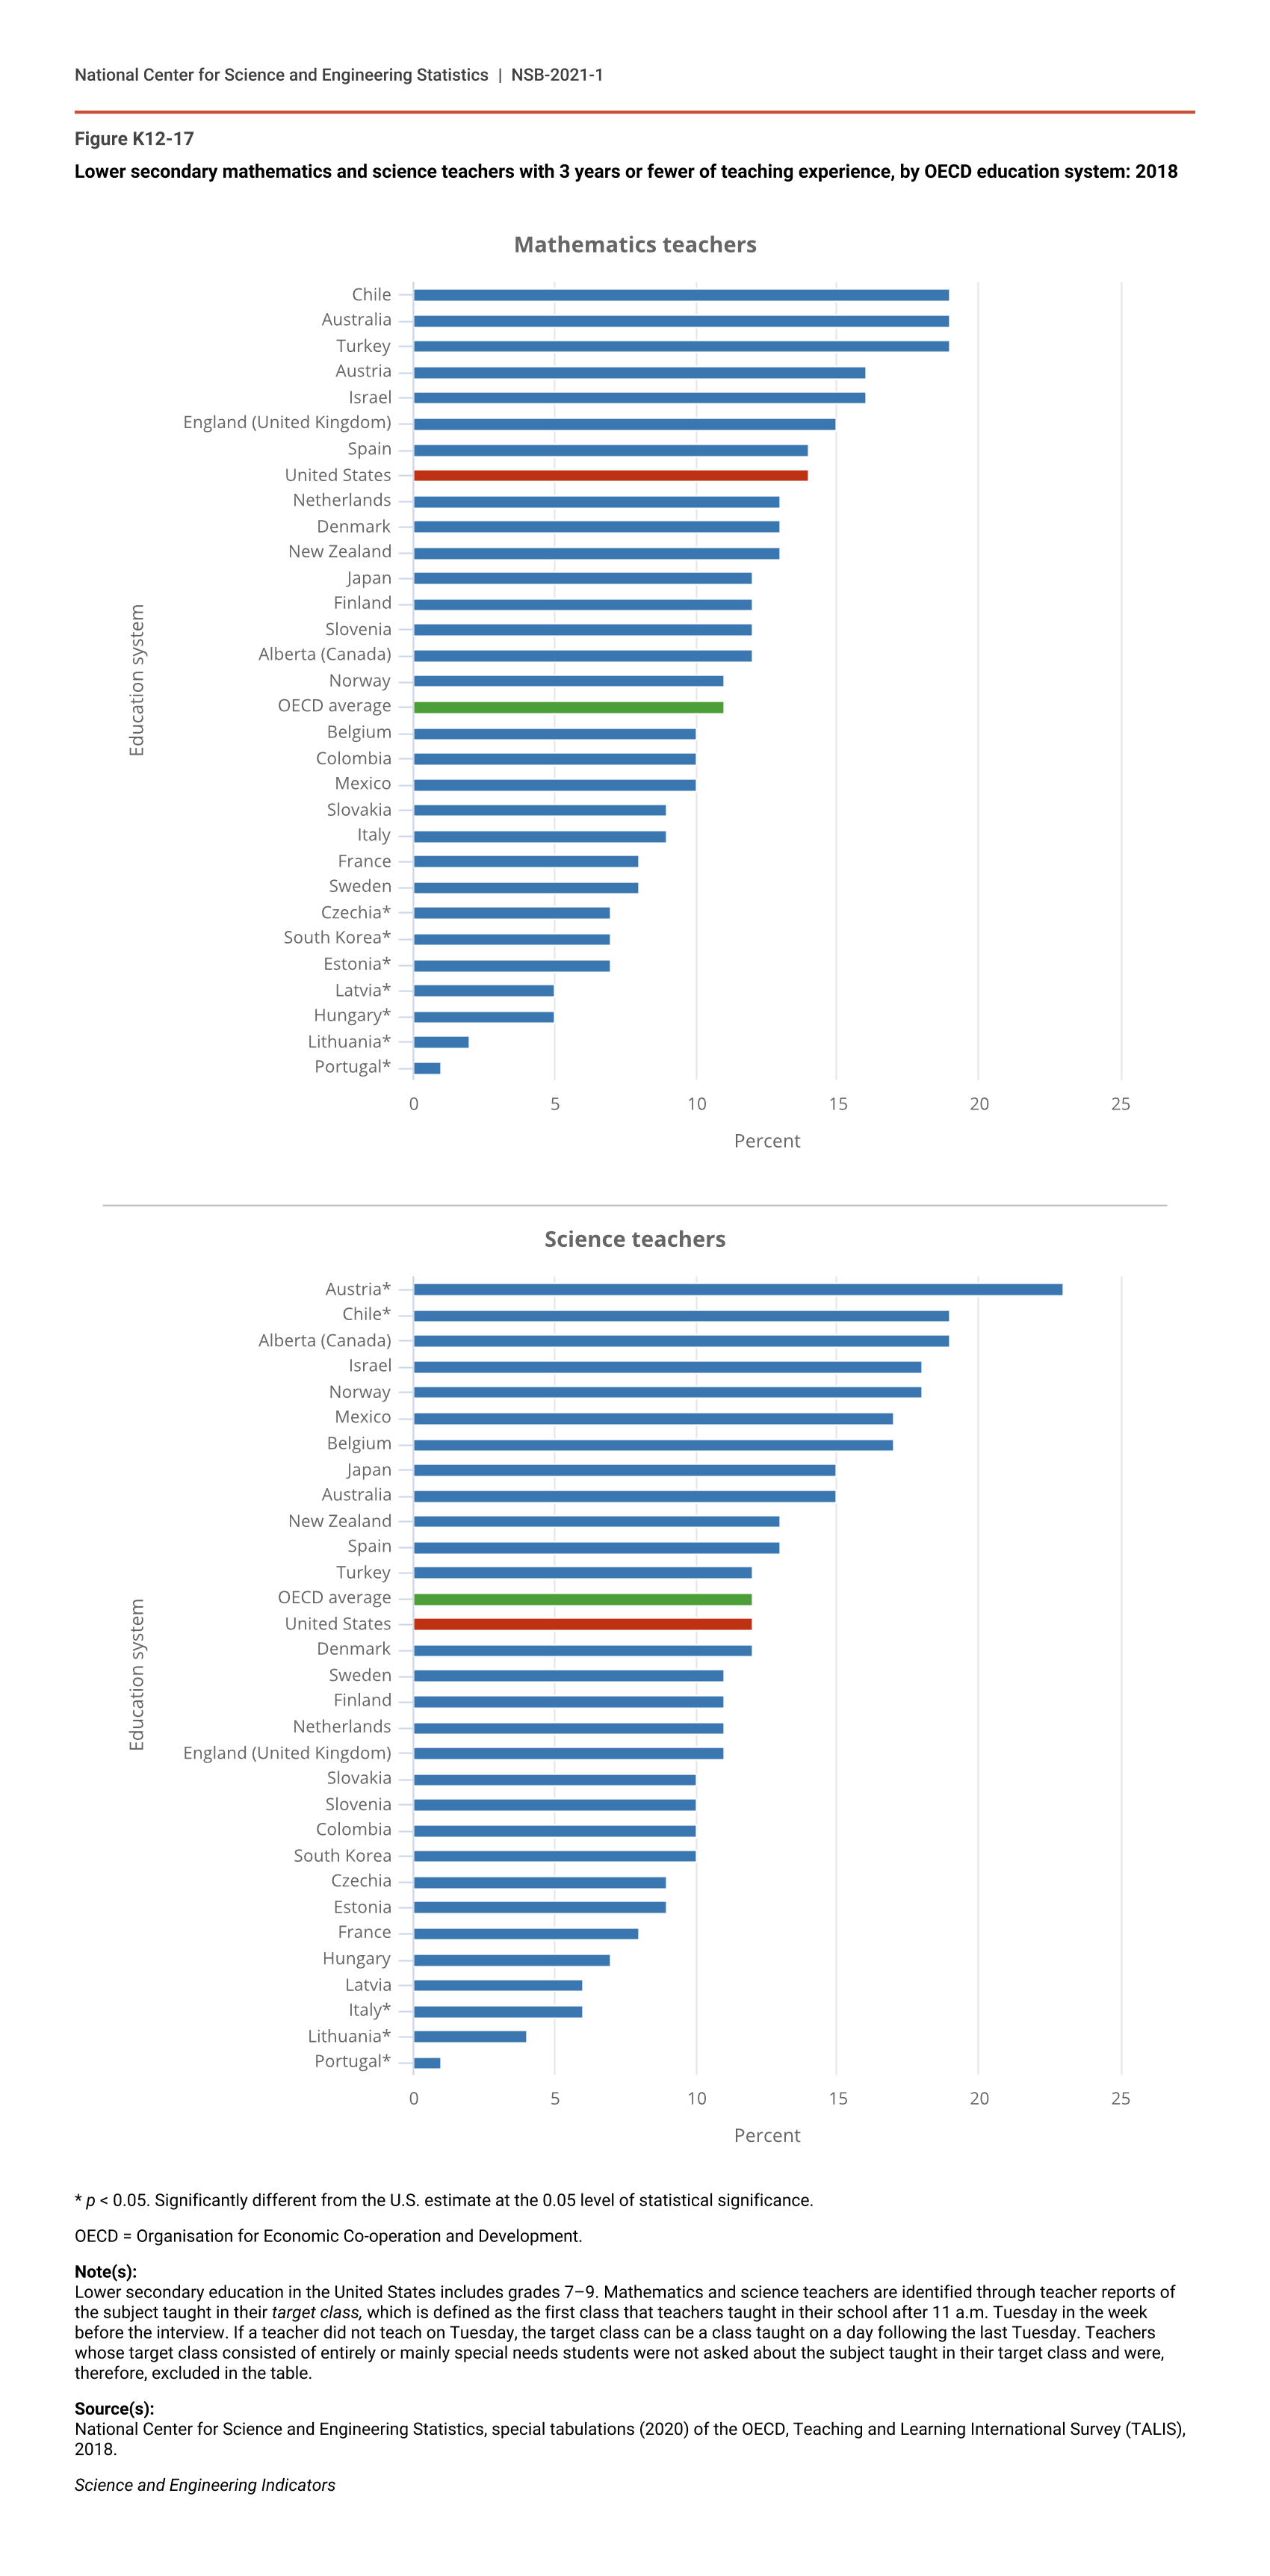
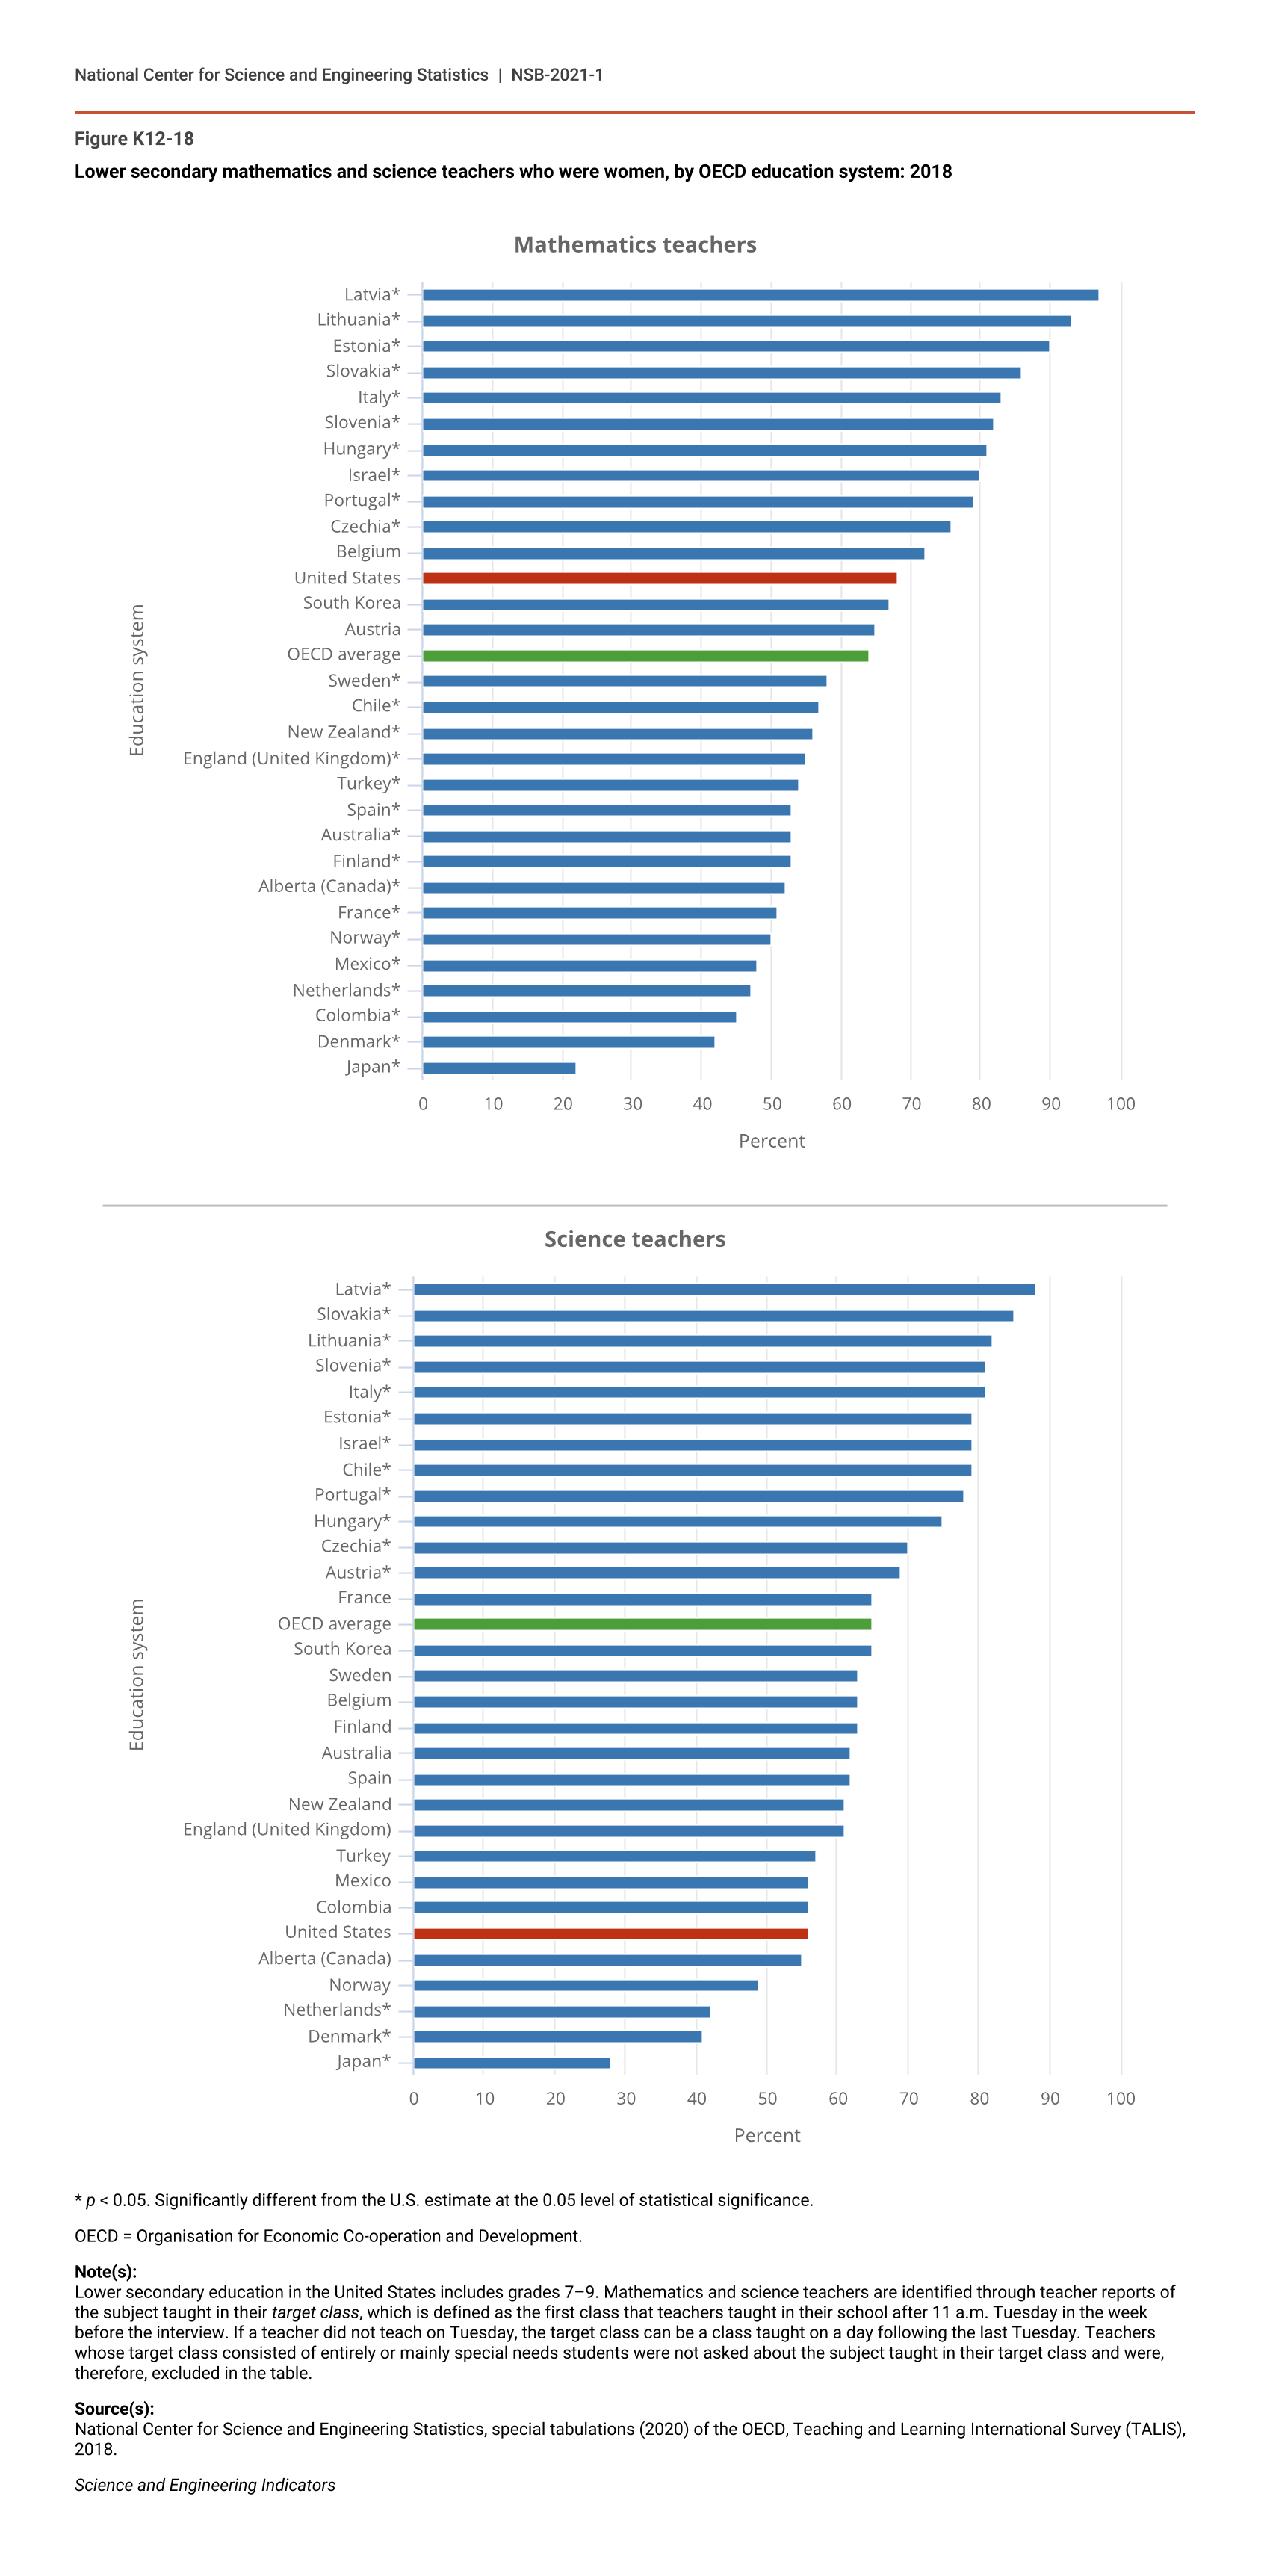
About 14% of U.S. lower secondary mathematics and science teachers had 3 years or fewer of teaching experience (Figure K12-17), which was not significantly different from most of the other OECD countries. Among science teachers, Austria (23%) and Chile (19%) had the highest percentage of teachers with 3 years or fewer of teaching experience, and Lithuania (4%) and Portugal (1%) had the least. In the United States, two-thirds of lower secondary mathematics teachers (68%) and more than half of lower secondary science teachers (56%) were women (Figure K12-18). Among OECD countries, Latvia had the highest concentration of female lower secondary mathematics (97%) and science (88%) teachers, whereas Japan had the lowest, with 22% female mathematics teachers and 28% female science teachers.
Lower secondary mathematics and science teachers with 3 years or fewer of teaching experience, by OECD education system: 2018
| Education system | Mathematics teachers |
|---|---|
| Chile | 19 |
| Australia | 19 |
| Turkey | 19 |
| Austria | 16 |
| Israel | 16 |
| England (United Kingdom) | 15 |
| Spain | 14 |
| United States | 14 |
| Netherlands | 13 |
| Denmark | 13 |
| New Zealand | 13 |
| Japan | 12 |
| Finland | 12 |
| Slovenia | 12 |
| Alberta (Canada) | 12 |
| Norway | 11 |
| OECD average | 11 |
| Belgium | 10 |
| Colombia | 10 |
| Mexico | 10 |
| Slovakia | 9 |
| Italy | 9 |
| France | 8 |
| Sweden | 8 |
| Czechia* | 7 |
| South Korea* | 7 |
| Estonia* | 7 |
| Latvia* | 5 |
| Hungary* | 5 |
| Lithuania* | 2 |
| Portugal* | 1 |
| Education system | Science teachers |
|---|---|
| Austria* | 23 |
| Chile* | 19 |
| Alberta (Canada) | 19 |
| Israel | 18 |
| Norway | 18 |
| Mexico | 17 |
| Belgium | 17 |
| Japan | 15 |
| Australia | 15 |
| New Zealand | 13 |
| Spain | 13 |
| Turkey | 12 |
| OECD average | 12 |
| United States | 12 |
| Denmark | 12 |
| Sweden | 11 |
| Finland | 11 |
| Netherlands | 11 |
| England (United Kingdom) | 11 |
| Slovakia | 10 |
| Slovenia | 10 |
| Colombia | 10 |
| South Korea | 10 |
| Czechia | 9 |
| Estonia | 9 |
| France | 8 |
| Hungary | 7 |
| Latvia | 6 |
| Italy* | 6 |
| Lithuania* | 4 |
| Portugal* | 1 |
* p < 0.05. Significantly different from the U.S. estimate at the 0.05 level of statistical significance.
OECD = Organisation for Economic Co-operation and Development.
Note(s):
Lower secondary education in the United States includes grades 7–9. Mathematics and science teachers are identified through teacher reports of the subject taught in their target class, which is defined as the first class that teachers taught in their school after 11 a.m. Tuesday in the week before the interview. If a teacher did not teach on Tuesday, the target class can be a class taught on a day following the last Tuesday. Teachers whose target class consisted of entirely or mainly special needs students were not asked about the subject taught in their target class and were, therefore, excluded in the table.
Source(s):
National Center for Science and Engineering Statistics, special tabulations (2020) of the OECD, Teaching and Learning International Survey (TALIS), 2018.
Science and Engineering Indicators
Lower secondary mathematics and science teachers who were women, by OECD education system: 2018
| Education system | Mathematics teachers |
|---|---|
| Latvia* | 97 |
| Lithuania* | 93 |
| Estonia* | 90 |
| Slovakia* | 86 |
| Italy* | 83 |
| Slovenia* | 82 |
| Hungary* | 81 |
| Israel* | 80 |
| Portugal* | 79 |
| Czechia* | 76 |
| Belgium | 72 |
| United States | 68 |
| South Korea | 67 |
| Austria | 65 |
| OECD average | 64 |
| Sweden* | 58 |
| Chile* | 57 |
| New Zealand* | 56 |
| England (United Kingdom)* | 55 |
| Turkey* | 54 |
| Spain* | 53 |
| Australia* | 53 |
| Finland* | 53 |
| Alberta (Canada)* | 52 |
| France* | 51 |
| Norway* | 50 |
| Mexico* | 48 |
| Netherlands* | 47 |
| Colombia* | 45 |
| Denmark* | 42 |
| Japan* | 22 |
| Education system | Science teachers |
|---|---|
| Latvia* | 88 |
| Slovakia* | 85 |
| Lithuania* | 82 |
| Slovenia* | 81 |
| Italy* | 81 |
| Estonia* | 79 |
| Israel* | 79 |
| Chile* | 79 |
| Portugal* | 78 |
| Hungary* | 75 |
| Czechia* | 70 |
| Austria* | 69 |
| France | 65 |
| OECD average | 65 |
| South Korea | 65 |
| Sweden | 63 |
| Belgium | 63 |
| Finland | 63 |
| Australia | 62 |
| Spain | 62 |
| New Zealand | 61 |
| England (United Kingdom) | 61 |
| Turkey | 57 |
| Mexico | 56 |
| Colombia | 56 |
| United States | 56 |
| Alberta (Canada) | 55 |
| Norway | 49 |
| Netherlands* | 42 |
| Denmark* | 41 |
| Japan* | 28 |
* p < 0.05. Significantly different from the U.S. estimate at the 0.05 level of statistical significance.
OECD = Organisation for Economic Co-operation and Development.
Note(s):
Lower secondary education in the United States includes grades 7–9. Mathematics and science teachers are identified through teacher reports of the subject taught in their target class, which is defined as the first class that teachers taught in their school after 11 a.m. Tuesday in the week before the interview. If a teacher did not teach on Tuesday, the target class can be a class taught on a day following the last Tuesday. Teachers whose target class consisted of entirely or mainly special needs students were not asked about the subject taught in their target class and were, therefore, excluded in the table.
Source(s):
National Center for Science and Engineering Statistics, special tabulations (2020) of the OECD, Teaching and Learning International Survey (TALIS), 2018.
Science and Engineering Indicators
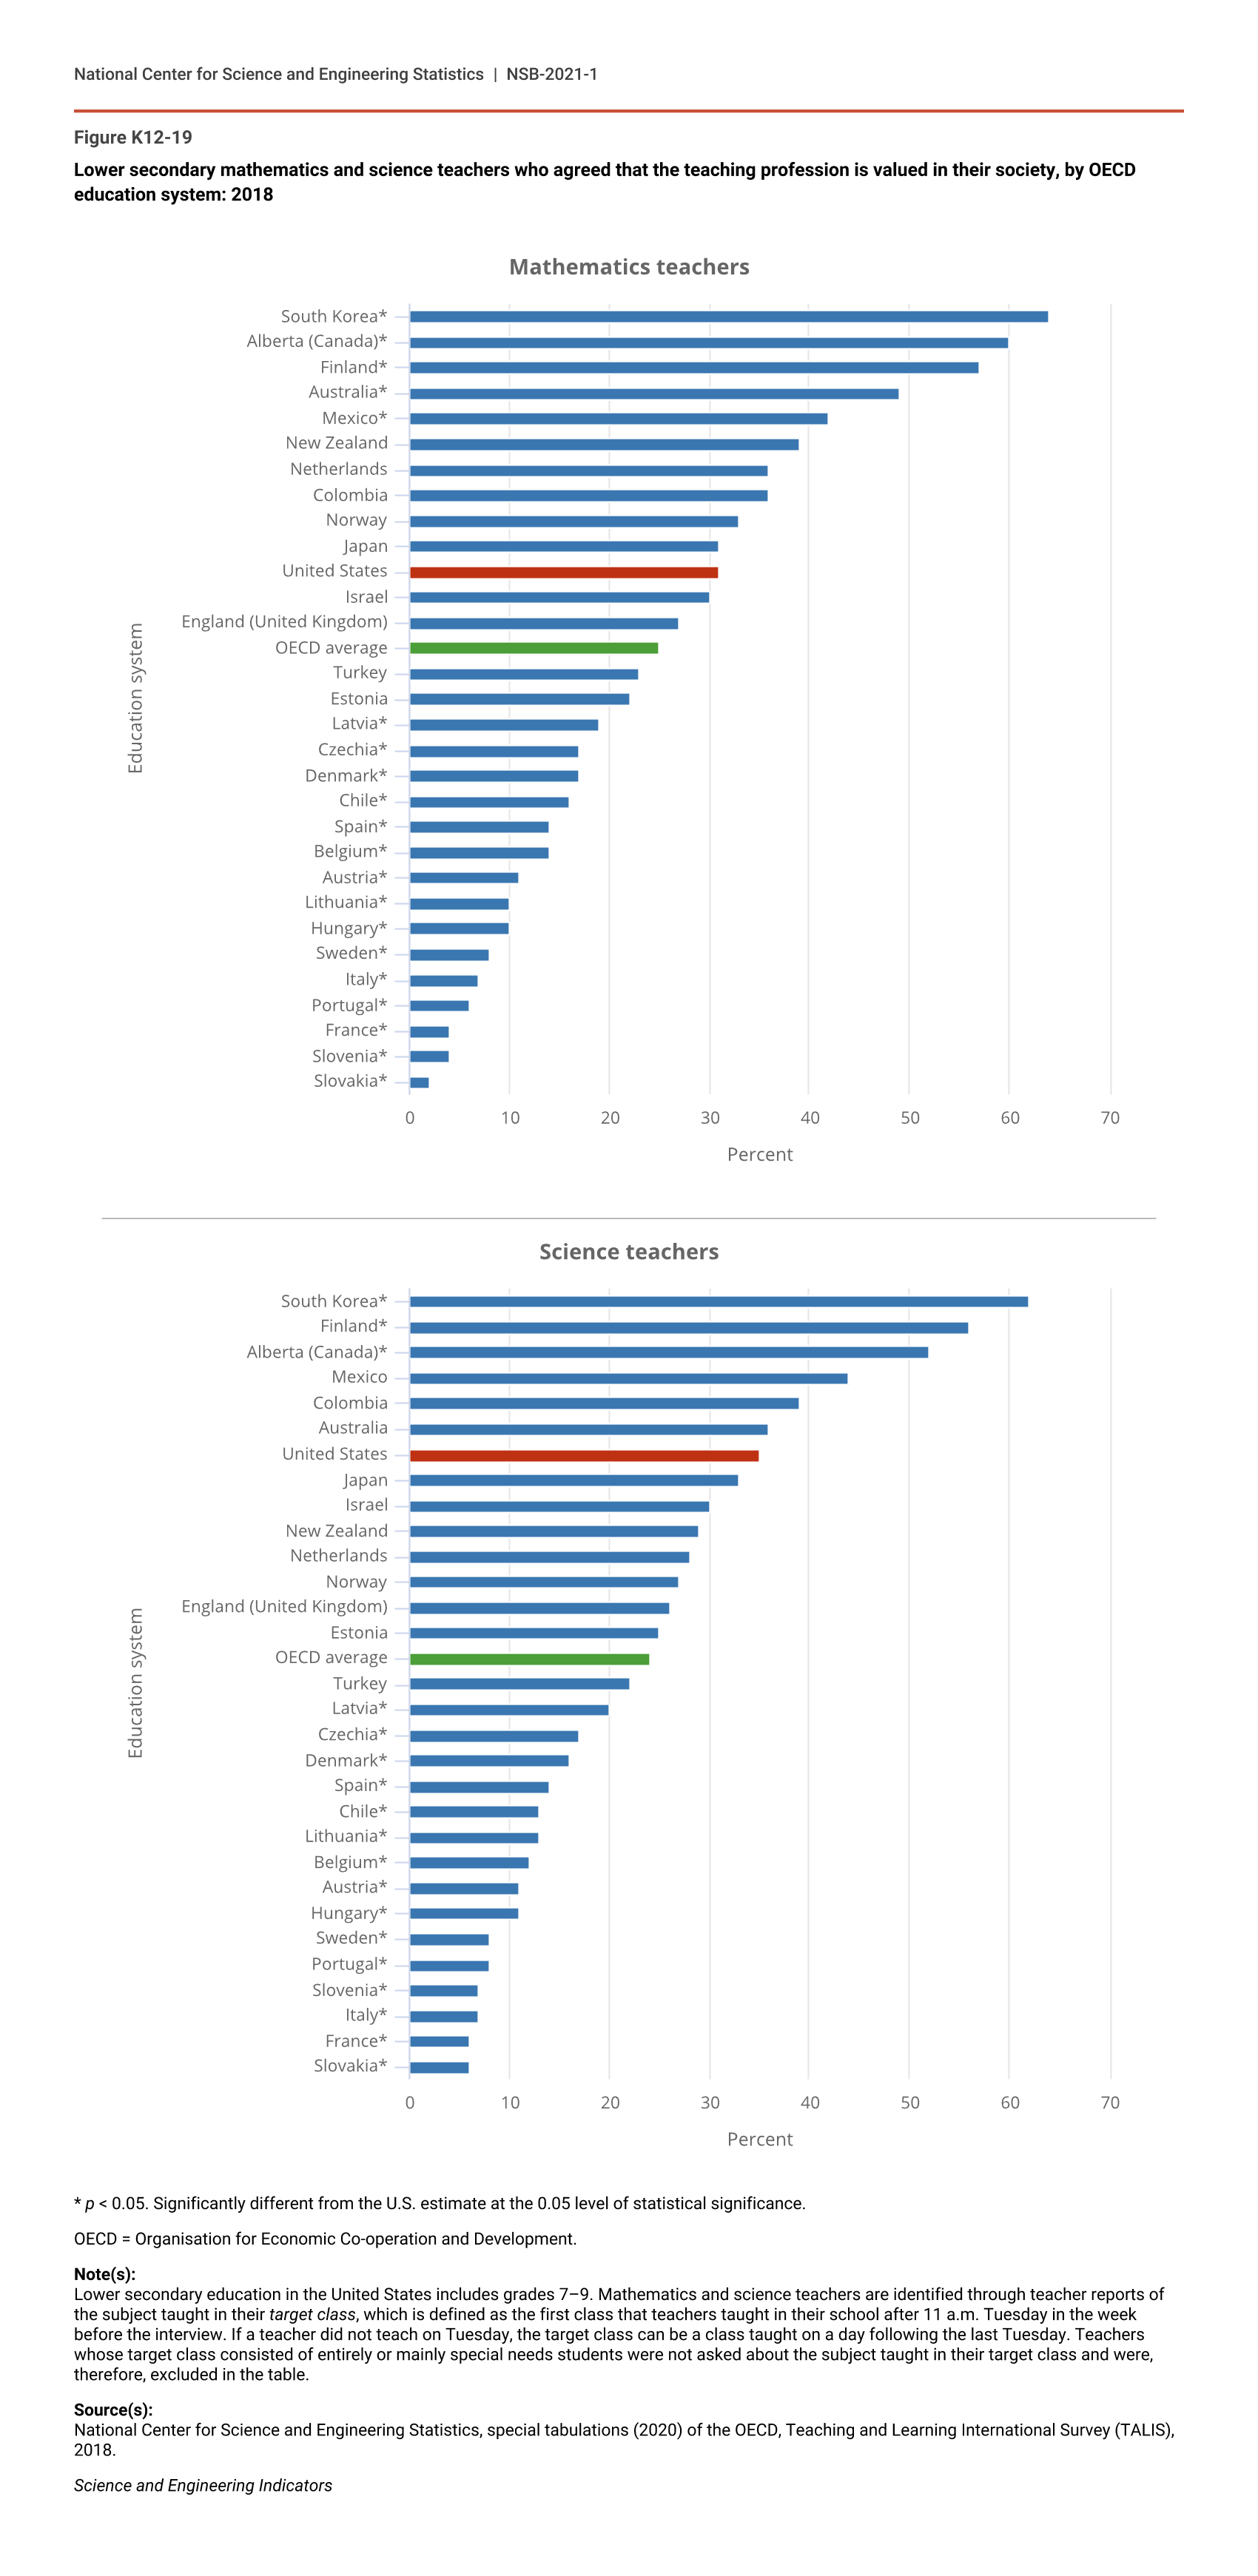
About one-third of U.S. lower secondary mathematics (31%) and science (35%) teachers agreed that the teaching profession is valued in U.S. society (Figure K12-19). This differs from other OECD countries; for example, in South Korea and Finland, 56% or more of lower secondary mathematics and science teachers believed that teaching is valued by society. In France and Slovakia, however, fewer than 7% of mathematics and science teachers believed so.
Lower secondary mathematics and science teachers who agreed that the teaching profession is valued in their society, by OECD education system: 2018
| Education system | Mathematics teachers |
|---|---|
| South Korea* | 64 |
| Alberta (Canada)* | 60 |
| Finland* | 57 |
| Australia* | 49 |
| Mexico* | 42 |
| New Zealand | 39 |
| Netherlands | 36 |
| Colombia | 36 |
| Norway | 33 |
| Japan | 31 |
| United States | 31 |
| Israel | 30 |
| England (United Kingdom) | 27 |
| OECD average | 25 |
| Turkey | 23 |
| Estonia | 22 |
| Latvia* | 19 |
| Czechia* | 17 |
| Denmark* | 17 |
| Chile* | 16 |
| Spain* | 14 |
| Belgium* | 14 |
| Austria* | 11 |
| Lithuania* | 10 |
| Hungary* | 10 |
| Sweden* | 8 |
| Italy* | 7 |
| Portugal* | 6 |
| France* | 4 |
| Slovenia* | 4 |
| Slovakia* | 2 |
| Education system | Science teachers |
|---|---|
| South Korea* | 62 |
| Finland* | 56 |
| Alberta (Canada)* | 52 |
| Mexico | 44 |
| Colombia | 39 |
| Australia | 36 |
| United States | 35 |
| Japan | 33 |
| Israel | 30 |
| New Zealand | 29 |
| Netherlands | 28 |
| Norway | 27 |
| England (United Kingdom) | 26 |
| Estonia | 25 |
| OECD average | 24 |
| Turkey | 22 |
| Latvia* | 20 |
| Czechia* | 17 |
| Denmark* | 16 |
| Spain* | 14 |
| Chile* | 13 |
| Lithuania* | 13 |
| Belgium* | 12 |
| Austria* | 11 |
| Hungary* | 11 |
| Sweden* | 8 |
| Portugal* | 8 |
| Slovenia* | 7 |
| Italy* | 7 |
| France* | 6 |
| Slovakia* | 6 |
* p < 0.05. Significantly different from the U.S. estimate at the 0.05 level of statistical significance.
OECD = Organisation for Economic Co-operation and Development.
Note(s):
Lower secondary education in the United States includes grades 7–9. Mathematics and science teachers are identified through teacher reports of the subject taught in their target class, which is defined as the first class that teachers taught in their school after 11 a.m. Tuesday in the week before the interview. If a teacher did not teach on Tuesday, the target class can be a class taught on a day following the last Tuesday. Teachers whose target class consisted of entirely or mainly special needs students were not asked about the subject taught in their target class and were, therefore, excluded in the table.
Source(s):
National Center for Science and Engineering Statistics, special tabulations (2020) of the OECD, Teaching and Learning International Survey (TALIS), 2018.
Science and Engineering Indicators