 An official website of the United States government
 STEM Pathways: Degree Attainment, Training, and Occupations
Education and training are fundamental to building the capacity of the STEM workforce. There are multiple pathways into the STEM workforce. These pathways include taking courses in STEM and career technical education at the secondary level (for more details, see the Indicators 2022 report “Elementary and Secondary STEM Education”), postsecondary education through attainment of 2- and 4-year degrees or certificates (for more details, see the forthcoming Indicators 2022 report “Higher Education in Science and Engineering”), or the acquisition of certifications or licenses (NASEM 2017). Not all STEM degree holders work in STEM occupations, and the degree to which STEM-capable workers enter and remain in the STEM workforce has implications for the U.S. S&E enterprise.
This section describes the STEM workforce based on the prevalence of degree attainment, certifications, and licenses among these workers. It also presents data on the level and type of degree attained by workers with a bachelor’s degree or higher in a subset of STEM occupations—that is, S&E and S&E-related occupations. (See the Glossary section for definitions of S&E occupations and S&E-related occupations.) The extent to which individuals with degrees in S&E or S&E-related fields (see the Glossary section for definitions of S&E fields and S&E-related fields) work in S&E and S&E-related occupations is also examined, as is the use of S&E expertise across occupations. The primary data source for the analysis of STEM workers with a bachelor’s degree or higher, NCSES’s NSCG, does not allow for workers in middle-skill occupations to be identified separately from those in non-STEM occupations. (See the Glossary section for definitions of middle-skill occupations and non-STEM occupations.) Hence, workers with a bachelor’s degree or higher in non-S&E occupations include those in middle-skill and non-STEM occupations. (See the Glossary section for definition of non-S&E occupations.)
Education and Training of Workers in STEM
Degree Attainment
A 4-year degree is one of the primary pathways for STEM workers. More STEM workers than non-STEM workers have a bachelor’s degree or higher. Based on the U.S. Census Bureau’s (2020a) 2019 ACS, approximately 45% of STEM workers hold a bachelor’s degree or higher, compared to 34% of workers in non-STEM occupations (Figure LBR-7). Within the STEM workforce, most workers in S&E occupations (76%) and S&E-related occupations (60%) hold a bachelor’s degree or higher. In contrast, only 12% of workers in middle-skill occupations hold a bachelor’s degree or higher.
Educational attainment of workers, by workforce, occupational group, and degree level: 2019
| Occupational group | High school diploma or GED or less | Some college, no degree | Associate's degree | Bachelor's degree or higher |
|---|---|---|---|---|
| Non-STEM | 34.4 | 23.5 | 8.4 | 33.8 |
| STEM | 25.0 | 17.8 | 12.2 | 45.0 |
| STEM: S&E occupations | 5.4 | 11.0 | 7.1 | 76.5 |
| STEM: S&E-related occupations | 8.0 | 14.4 | 17.2 | 60.4 |
| STEM: Middle-skill occupations | 52.1 | 25.0 | 10.7 | 12.2 |
GED = General Equivalency Diploma; STEM = science, technology, engineering, and mathematics.
Note(s):
Data include individuals ages 16–75 and exclude those in military occupations or currently enrolled in primary or secondary school.
Source(s):
U.S. Census Bureau, American Community Survey (ACS), 2019, Public Use Microdata Sample (PUMS), data as of 25 October 2020.
Science and Engineering Indicators
Among STEM workers with a bachelor’s degree or higher, most workers in S&E and S&E-related occupations have a degree in an S&E or S&E-related field. Based on the 2019 NSCG, 76% of workers with a bachelor’s degree or higher in S&E occupations have their highest degree in an S&E field, and another 11% have at least one degree (but not the highest) in an S&E or S&E-related field (Table LBR-2). Similarly, 60% of workers with a bachelor’s degree or higher in S&E-related occupations have their highest degree in an S&E-related field. In addition, almost one-quarter of S&E-related workers have their highest degree in an S&E field of study.
Educational background of employed adults with bachelor's degree or higher, by major occupation: 2019
s = suppressed for reasons of confidentiality and/or reliability.
STEM = science, technology, engineering, and mathematics.
Note(s):
Workers in non-S&E occupations are those with a bachelor's degree or above in non-STEM and middle-skill occupations. Percentages may not add to 100% because of rounding.
Source(s):
National Center for Science and Engineering Statistics, National Survey of College Graduates (NSCG), 2019.
Science and Engineering Indicators
Except for computer and mathematical scientists, most workers with a bachelor’s degree or higher in S&E occupations have their highest degree in the same broad field as that of their occupation (Table LBR-2). Among computer and mathematical scientists, 42% have their highest degree in a mathematical or computer science field, and 20% do not have a degree in any S&E or S&E-related field of study. In contrast, between 60% and 77% of life scientists, physical scientists, social scientists, and engineers have their highest degree in their respective broad field of study.
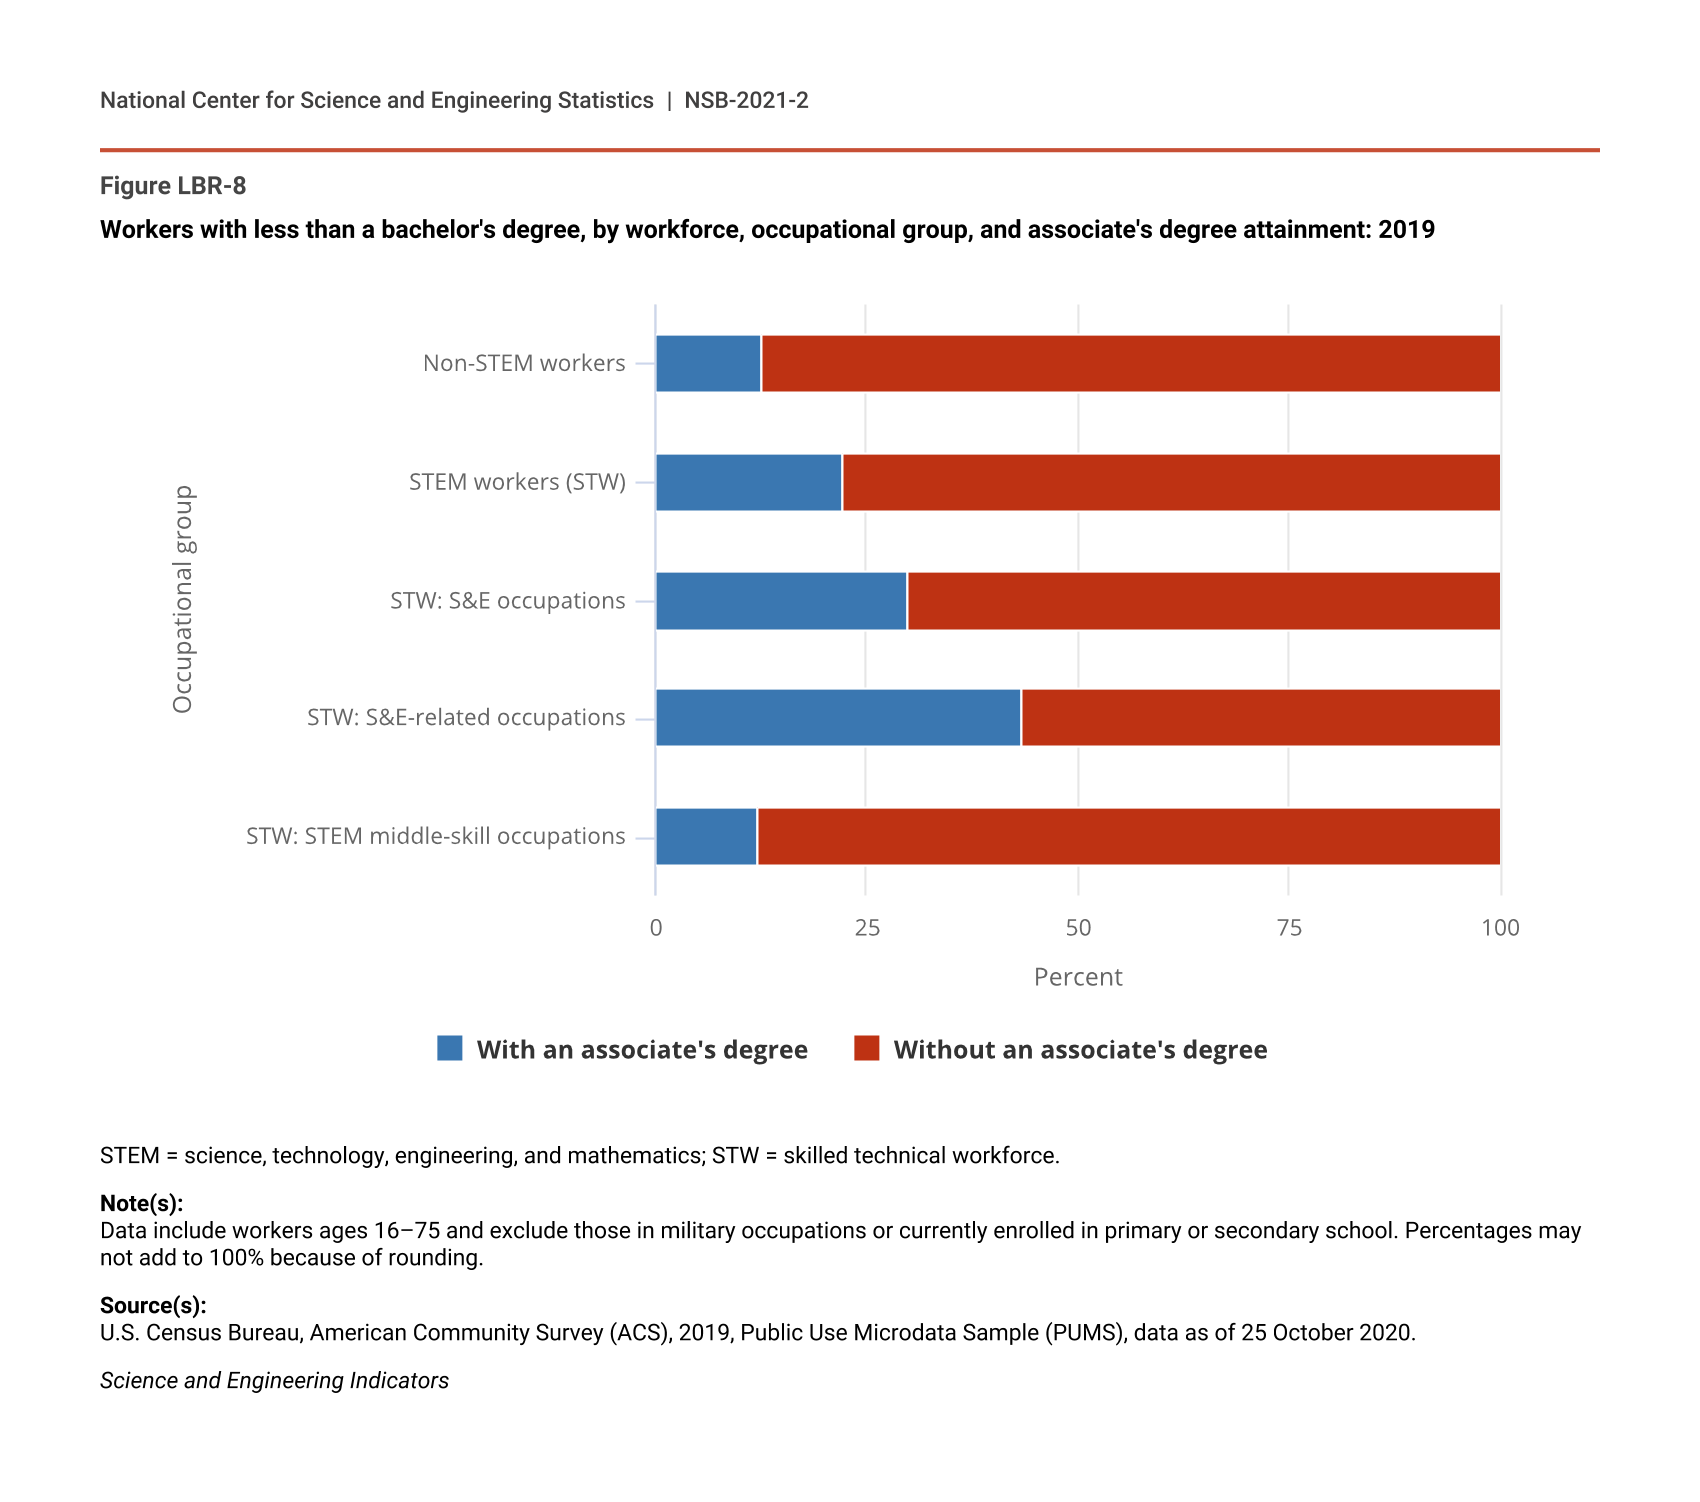
Associate’s degrees are another pathway to the STEM workforce, and about a quarter of associate's degrees awarded in 2019 were in S&E or S&E technology degree fields. (See forthcoming Indicators 2022 report “Higher Education in Science and Engineering” for more details on associate’s degree completions.) Compared to non-STEM workers without a bachelor’s degree, associate’s degrees are more prevalent among their STEM counterparts, but this varies among STEM occupational groups. Based on the 2019 ACS, 22% of the STW has an associate’s degree, which is higher than the 13% of non-STEM workers without a bachelor’s degree (Figure LBR-8). Within the STW, S&E-related workers, which are primarily in the health care fields, have an associate’s degree (44%) at a greater proportion than workers in S&E (30%) or STEM middle-skill (12%) occupations.
Workers with less than a bachelor's degree, by workforce, occupational group, and associate's degree attainment: 2019
| Occupational group | With an associate's degree | Without an associate's degree |
|---|---|---|
| Non-STEM workers | 12.7 | 87.3 |
| STEM workers (STW) | 22.2 | 77.8 |
| STW: S&E occupations | 30.0 | 70.0 |
| STW: S&E-related occupations | 43.5 | 56.5 |
| STW: STEM middle-skill occupations | 12.2 | 87.8 |
STEM = science, technology, engineering, and mathematics; STW = skilled technical workforce.
Note(s):
Data include workers ages 16–75 and exclude those in military occupations or currently enrolled in primary or secondary school. Percentages may not add to 100% because of rounding.
Source(s):
U.S. Census Bureau, American Community Survey (ACS), 2019, Public Use Microdata Sample (PUMS), data as of 25 October 2020.
Science and Engineering Indicators
Certifications and Licenses
A college degree is not the only pathway to a STEM career; other options for acquiring the skills needed to enter the STEM workforce include obtaining a certificate, certification, or license in a STEM area. These credentials are generally associated with an occupation, technology, or industry and recognize professionals who meet established knowledge, skill, and competency standards necessary to perform a specific job (Finamore and Foley 2017). Certifications are issued by a nongovernmental body, whereas licenses are awarded by a government agency and convey legal authority to work in an occupation (BLS 2019). Certificates are offered by a wide range of institutions but mostly by community colleges. Although data on STEM certificate completions are available in the forthcoming Indicators 2022 report “Higher Education in Science and Engineering,” less information is available on the certificate rates among workers in STEM occupations. Hence, this section focuses on certification and licensing by STEM workers.
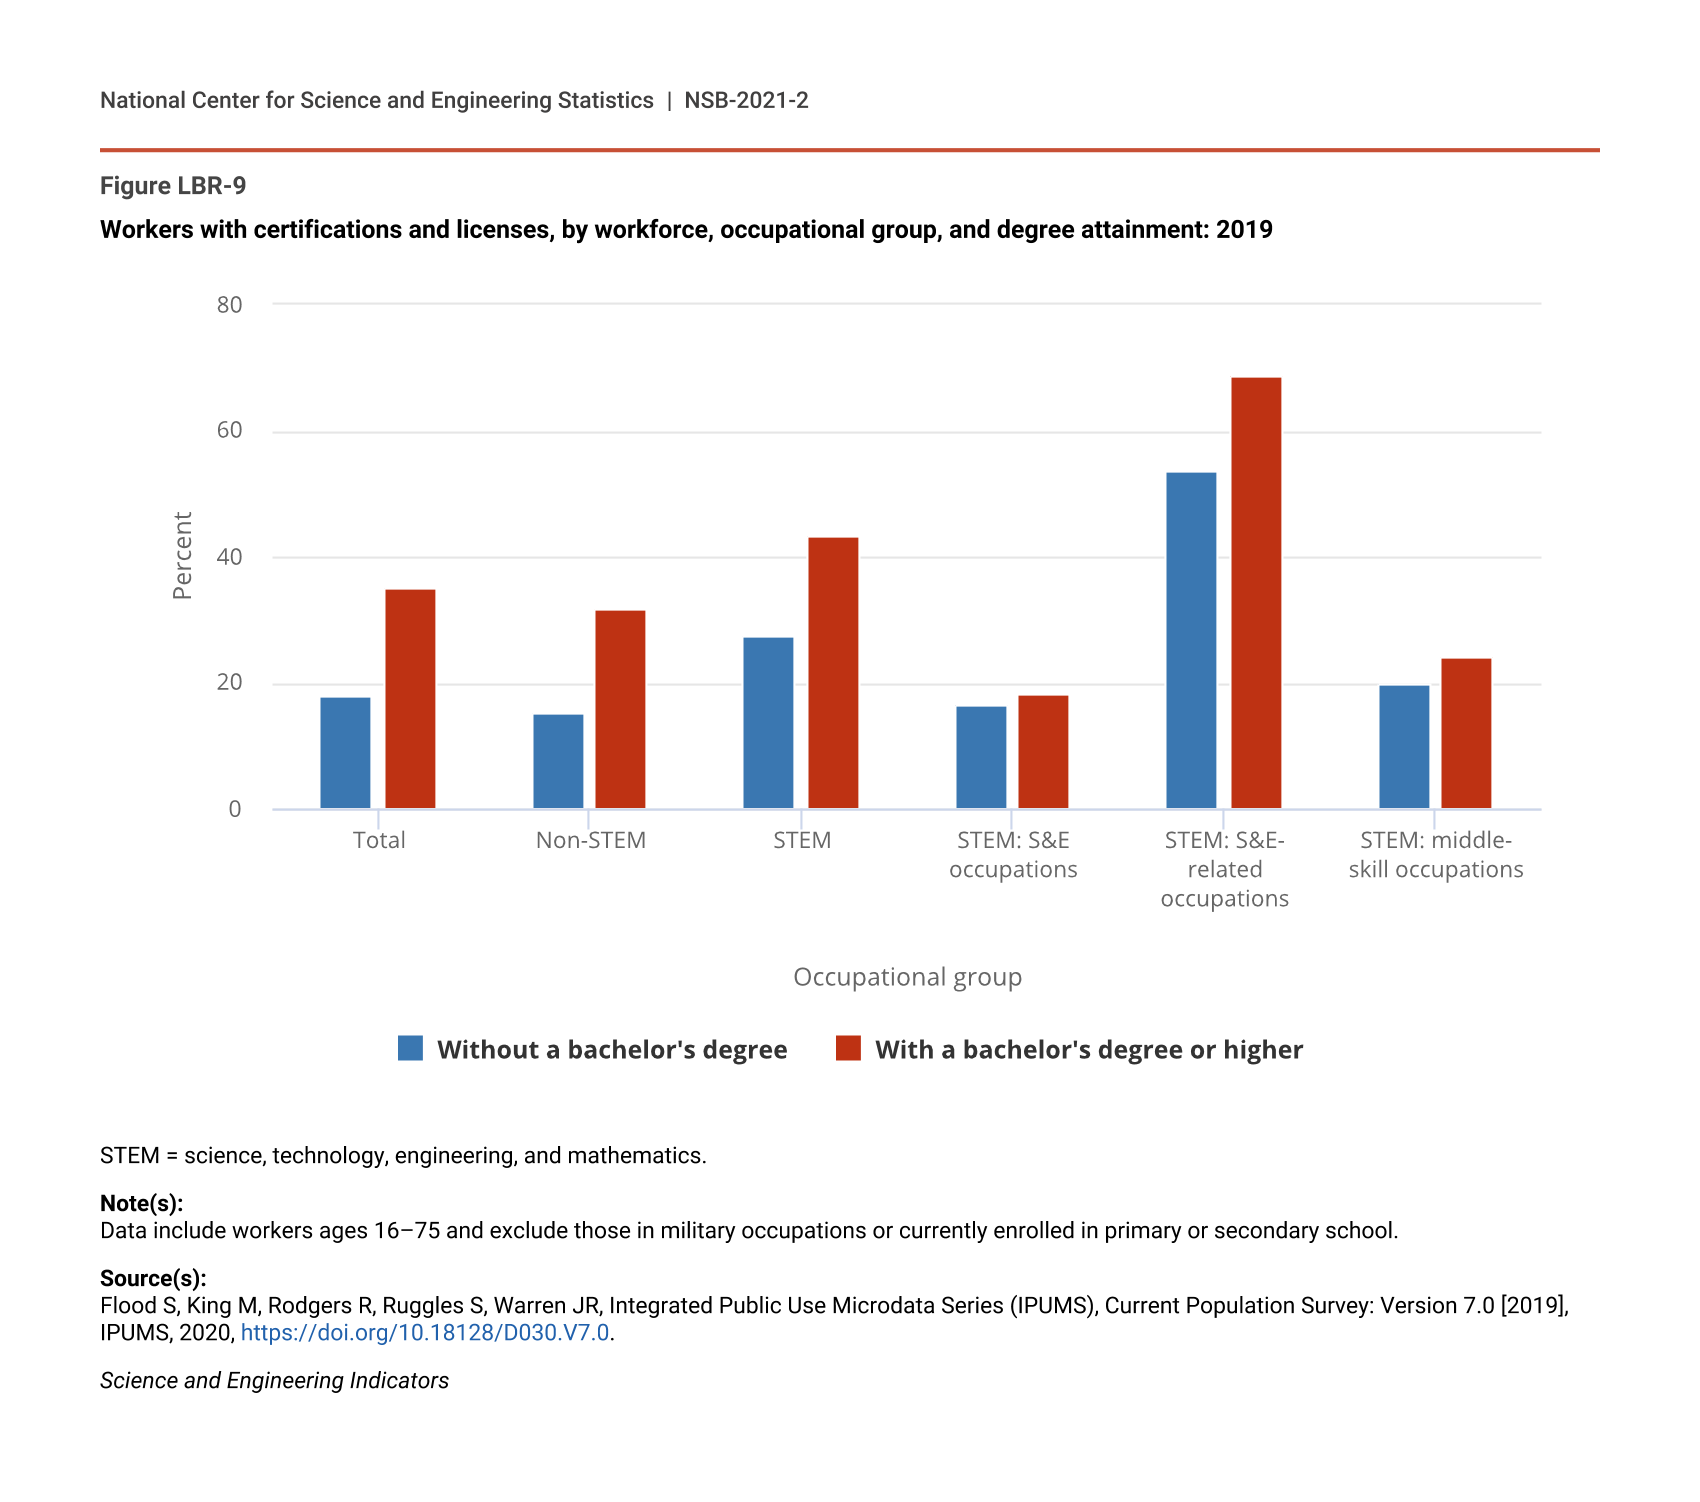
Although workers at all education levels obtain certifications and licenses, they are more prevalent among workers with a bachelor’s degree or higher, both within STEM occupations and in non-STEM occupations (Figure LBR-9). Based on the BLS 2019 Current Population Survey (CPS) (Flood et al. 2020), 35% of workers with a bachelor’s degree or higher held a certification or license compared to 18% of workers without a bachelor’s degree. Among STEM workers, 43% with a bachelor’s degree or higher held a certification or license compared to 28% without a bachelor’s degree; for non-STEM, the proportions were 32% and 15%, respectively.
Workers with certifications and licenses, by workforce, occupational group, and degree attainment: 2019
| Occupational group | Without a bachelor's degree | With a bachelor's degree or higher |
|---|---|---|
| Total | 17.7 | 35.0 |
| Non-STEM | 15.3 | 31.7 |
| STEM | 27.6 | 43.2 |
| STEM: S&E occupations | 16.4 | 18.2 |
| STEM: S&E-related occupations | 53.5 | 68.9 |
| STEM: middle-skill occupations | 19.7 | 24.0 |
STEM = science, technology, engineering, and mathematics.
Note(s):
Data include workers ages 16–75 and exclude those in military occupations or currently enrolled in primary or secondary school.
Source(s):
Flood S, King M, Rodgers R, Ruggles S, Warren JR, Integrated Public Use Microdata Series (IPUMS), Current Population Survey: Version 7.0 , IPUMS, 2020, https://doi.org/10.18128/D030.V7.0.
Science and Engineering Indicators
Among the STEM workforce, workers in S&E-related occupations held certifications and licenses at the highest proportions, both for those with and without a bachelor’s degree (69% and 53%, respectively), followed by workers in STEM middle-skill occupations (24% with a bachelor’s degree or higher, 20% without) and workers in S&E occupations (18% with a bachelor’s degree or higher, 16% without). Health care occupations make up the bulk of S&E-related occupations and likely account for the high prevalence of certifications and licenses among STEM workers in S&E-related occupations (Table SLBR-1).
For workers with a bachelor’s degree or higher holding certifications and licenses, the 2019 NSCG shows that credentials are primarily related to their work; only a small proportion, about 3% to 6%, hold certifications or licenses not related to their occupations (Table SLBR-3). These credentials are most prevalent among workers in S&E-related occupations, with 74% of workers in S&E-related occupations holding certifications and licenses related to their work, which corresponds to the high proportion of health-related occupations in the S&E-related broad occupational group. For S&E-related workers, the primary areas of certifications and licenses include nurse; health care practitioner, provider, and specialist; and other health care–related areas. Certifications and licenses are less prevalent among workers in S&E occupations, with approximately 22% holding credentials related to their work. The primary areas for S&E workers were different, including engineering, engineering technician and engineering technologist, computer networking administration and security, and project management, quality control, operations, and support (Table SLBR-3).
Application of STEM Skills and Expertise by Non-S&E Workers
Although workers with at least a bachelor’s degree in STEM occupations often have an S&E degree or S&E-related degree, individuals with their highest degree in S&E or S&E-related fields may also pursue careers in other areas. Based on the 2019 NSCG, 37% of those with their highest degree in an S&E field worked in S&E occupations; the rest worked in S&E-related occupations (14%) or non-S&E occupations (49%) (Table SLBR-4). Compared to S&E highest degree holders, individuals whose highest degree is in an S&E-related field (71%) are employed at greater proportions in occupations aligned with their broad field of degree.
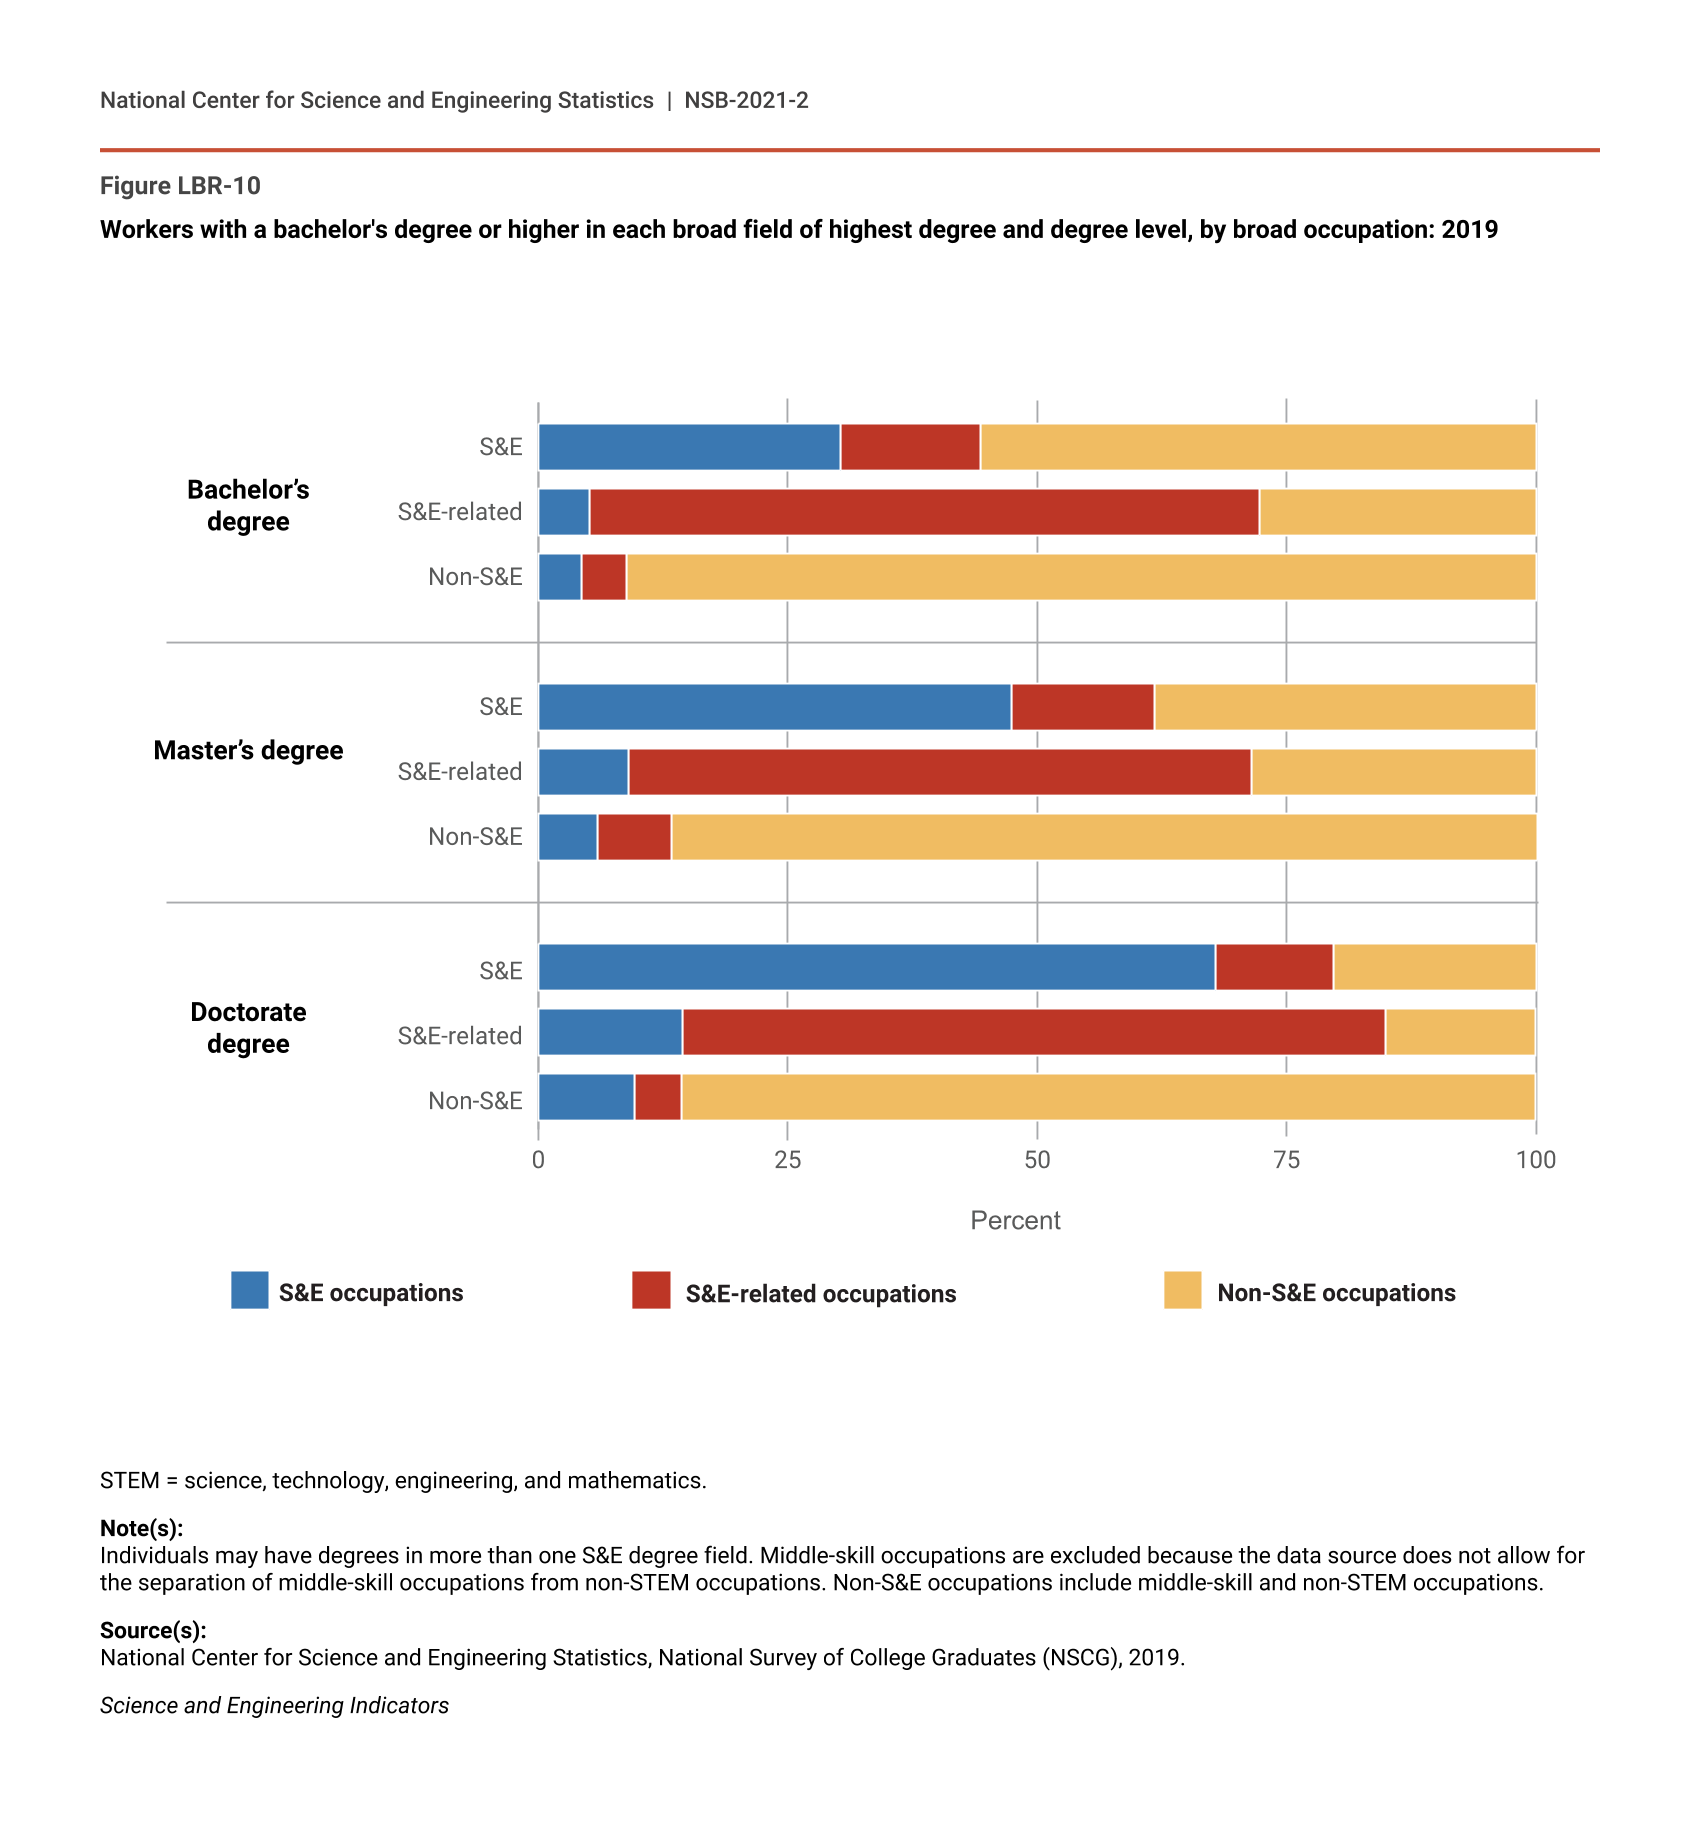
The extent to which individuals hold their highest degree in an S&E field and work in S&E occupations varies by level and field of degree. Workers with their highest degree in computer and mathematical sciences (56%) and engineering (40%) fields work the most in occupations in their major fields of study. In contrast, individuals with social sciences degrees (80%) work primarily in non-S&E occupations (Table SLBR-4). Additionally, individuals with doctorate degrees in S&E fields tend to work in S&E occupations, whereas the link between S&E field of study and S&E occupation is weaker at the bachelor’s and master’s degree levels (Figure LBR-10).
Workers with a bachelor's degree or higher in each broad field of highest degree and degree level, by broad occupation: 2019
STEM = science, technology, engineering, and mathematics.
Note(s):
Individuals may have degrees in more than one S&E degree field. Middle-skill occupations are excluded because the data source does not allow for the separation of middle-skill occupations from non-STEM occupations. Non-S&E occupations include middle-skill and non-STEM occupations.
Source(s):
National Center for Science and Engineering Statistics, National Survey of College Graduates (NSCG), 2019.
Science and Engineering Indicators
Occupation is not the only measure of the use of STEM training in a profession. Many individuals who hold their highest degree in S&E work in occupations related to their degrees, even though those occupations are not technically categorized as S&E. Most workers with their highest degree in an S&E field who are not working in S&E occupations (69%) reported that their occupations were closely or somewhat related to their highest degrees (Table SLBR-5). A similar relationship holds for workers with their highest degree in S&E-related fields not working in S&E-related occupations. This relationship is stronger as degree level increases.
S&E highest degree holders not working in S&E occupations report being employed in a wide variety of additional roles, including many that require leadership skills. In addition to S&E occupations, occupations in which relatively large numbers of S&E highest degree holders are employed include S&E-related occupations (2.1 million), such as health care practitioners or S&E managers, technicians, and technologists (Table SLBR-4). Other workers are employed in non-S&E occupations, including management-related occupations (1.7 million), such as financial or personnel specialists; non-S&E managers (1.2 million), such as executive-level managers or education administrators; and sales and marketing (1.0 million), which includes insurance and business services or sales of industrial machines, equipment, or supplies. The use of S&E expertise has become quite prevalent throughout today’s economy, regardless of occupation type. Approximately 53% of workers in jobs that are not categorized as S&E occupations state that their jobs require S&E technical expertise at the bachelor’s level.