 An official website of the United States government
 Data
Tables
Select "VIEW" to see the table. PDF and Excel are available for download.
Figures
Data Sources
DOWNLOAD DATA SOURCES| Item | Title | Provider | Product |
|---|---|---|---|
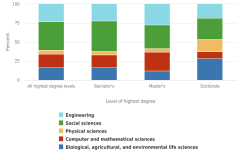
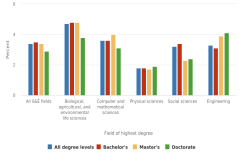
| Figure LBR-1 | Individuals with their highest degree in S&E, by field and level of highest degree: 2019 | National Center for Science and Engineering Statistics | National Survey of College Graduates |
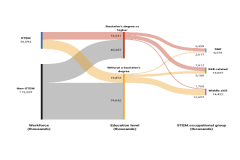
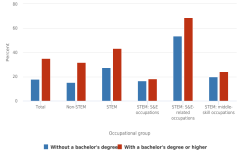
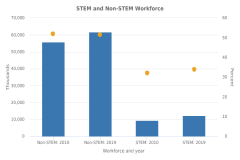
| Figure LBR-2 | U.S. workforce, by STEM occupational group and education level: 2019 | U.S. Census Bureau | American Community Survey |
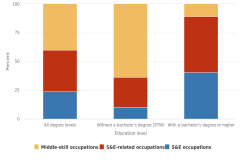
| Figure LBR-3 | Employment in STEM occupations, by occupational category and education level: 2019 | U.S. Census Bureau | American Community Survey |
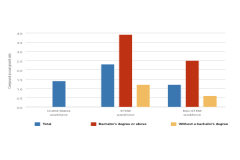
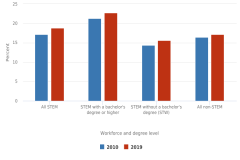
| Figure LBR-4 | Growth rate of employed adults in the United States, by workforce and degree level: 2010–19 | U.S. Census Bureau | American Community Survey |
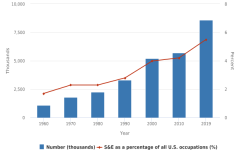
| Figure LBR-5 | Individuals employed in S&E occupations in the United States: Selected years, 1960–2019 | U.S. Census Bureau | American Community Survey |
| Figure LBR-5 | Individuals employed in S&E occupations in the United States: Selected years, 1960–2019 | U.S. Census Bureau | Decennial Census |
| Figure LBR-6 | Compound annual growth rate in the total number of employed individuals with highest degree in S&E, by field and level of highest degree: 2003–19 | National Center for Science and Engineering Statistics | National Survey of College Graduates |
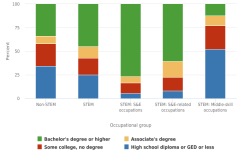
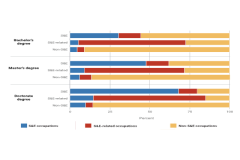
| Figure LBR-7 | Educational attainment of workers, by workforce, occupational group, and degree level: 2019 | U.S. Census Bureau | American Community Survey |
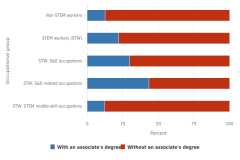
| Figure LBR-8 | Workers with less than a bachelor's degree, by workforce, occupational group, and associate's degree attainment: 2019 | U.S. Census Bureau | American Community Survey |
| Figure LBR-9 | Workers with certifications and licenses, by workforce, occupational group, and degree attainment: 2019 | Bureau of Labor Statistics | Current Population Survey |
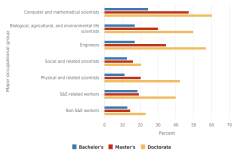
| Figure LBR-10 | Workers with a bachelor's degree or higher in each broad field of highest degree and degree level, by broad occupation: 2019 | National Center for Science and Engineering Statistics | National Survey of College Graduates |
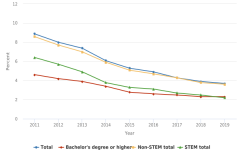
| Figure LBR-11 | Unemployment rate in each workforce: 2011–19 | Bureau of Labor Statistics | Current Population Survey |
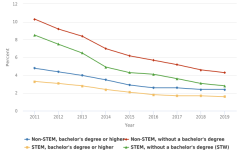
| Figure LBR-12 | Unemployment rate in each workforce, by degree attainment: 2011–19 | Bureau of Labor Statistics | Current Population Survey |
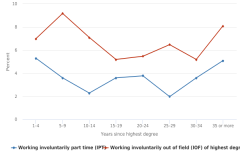
| Figure LBR-13 | S&E highest degree holders working involuntarily part time and out of field, by years since highest degree: 2019 | National Center for Science and Engineering Statistics | National Survey of College Graduates |
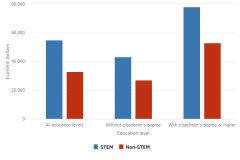
| Figure LBR-14 | Median salaries, by workforce and education level: 2019 | U.S. Census Bureau | American Community Survey |
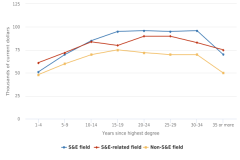
| Figure LBR-15 | Median salaries for workers with a bachelor's degree or higher, by broad field of degree and years since highest degree: 2019 | National Center for Science and Engineering Statistics | National Survey of College Graduates |
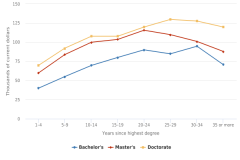
| Figure LBR-16 | Median salaries of S&E highest degree holders, by degree level and years since highest degree: 2019 | National Center for Science and Engineering Statistics | National Survey of College Graduates |
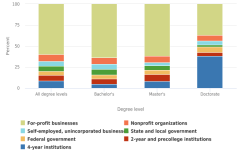
| Figure LBR-17 | S&E highest degree holders, by degree level and employment sector: 2019 | National Center for Science and Engineering Statistics | National Survey of College Graduates |
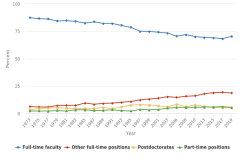
| Figure LBR-18 | SEH doctorate recipients employed in academia, by type of position: 1973–2019 | National Center for Science and Engineering Statistics | Survey of Doctorate Recipients |
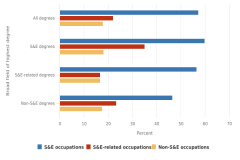
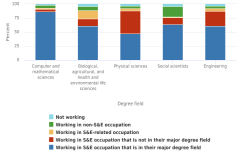
| Figure LBR-19 | Scientists and engineers with R&D and design activity, by broad field of highest degree and broad occupational category: 2019 | National Center for Science and Engineering Statistics | National Survey of College Graduates |
| Figure LBR-20 | Employed women, by workforce: 2010 and 2019 | U.S. Census Bureau | American Community Survey |
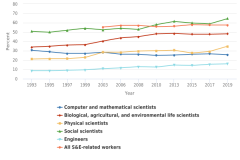
| Figure LBR-21 | Women with a bachelor's degree or higher in S&E and S&E-related occupations: Selected years, 1993–2019 | National Center for Science and Engineering Statistics | National Survey of College Graduates |
| Figure LBR-21 | Women with a bachelor's degree or higher in S&E and S&E-related occupations: Selected years, 1993–2019 | National Center for Science and Engineering Statistics | Scientists and Engineers Statistical Data System (SESTAT) |
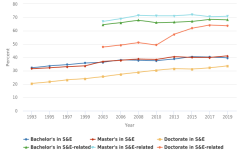
| Figure LBR-22 | Employed women with their highest degree in S&E and S&E-related fields, by degree level: Selected years, 1993–2019 | National Center for Science and Engineering Statistics | National Survey of College Graduates |
| Figure LBR-22 | Employed women with their highest degree in S&E and S&E-related fields, by degree level: Selected years, 1993–2019 | National Center for Science and Engineering Statistics | Scientists and Engineers Statistical Data System (SESTAT) |
| Figure LBR-22 | Employed women with their highest degree in S&E and S&E-related fields, by degree level: Selected years, 1993–2019 | National Center for Science and Engineering Statistics | Survey of Doctorate Recipients |
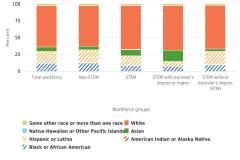
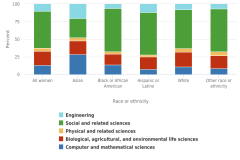
| Figure LBR-23 | Employed adults, by workforce, educational attainment, and race or ethnicity: 2019 | U.S. Census Bureau | American Community Survey |
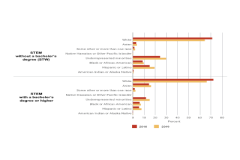
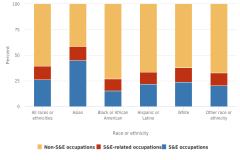
| Figure LBR-24 | STEM workforce, by degree level and race or ethnicity: 2010 and 2019 | U.S. Census Bureau | American Community Survey |
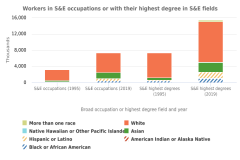
| Figure LBR-25 | Racial or ethnic distribution of workers with a bachelor's degree or higher, by broad occupation or highest degree field: Selected years, 1995, 2003, and 2019 | National Center for Science and Engineering Statistics | National Survey of College Graduates |
| Figure LBR-25 | Racial or ethnic distribution of workers with a bachelor's degree or higher, by broad occupation or highest degree field: Selected years, 1995, 2003, and 2019 | National Center for Science and Engineering Statistics | Scientists and Engineers Statistical Data System (SESTAT) |
| Figure LBR-26 | Employed underrepresented minorities with highest degree in S&E and S&E-related field, by degree level: 1993–2019 | National Center for Science and Engineering Statistics | National Survey of College Graduates |
| Figure LBR-26 | Employed underrepresented minorities with highest degree in S&E and S&E-related field, by degree level: 1993–2019 | National Center for Science and Engineering Statistics | Scientists and Engineers Statistical Data System (SESTAT) |
| Figure LBR-26 | Employed underrepresented minorities with highest degree in S&E and S&E-related field, by degree level: 1993–2019 | National Center for Science and Engineering Statistics | Survey of Doctorate Recipients |
| Figure LBR-27 | Median annual salaries of full-time workers with highest degrees in S&E or S&E-related fields, by sex: Selected years, 1995, 2003, and 2019 | National Center for Science and Engineering Statistics | National Survey of College Graduates |
| Figure LBR-27 | Median annual salaries of full-time workers with highest degrees in S&E or S&E-related fields, by sex: Selected years, 1995, 2003, and 2019 | National Center for Science and Engineering Statistics | Scientists and Engineers Statistical Data System (SESTAT) |
| Figure LBR-28 | Median annual salaries of full-time workers with highest degrees in S&E or S&E-related fields, by race or ethnicity: Selected years, 1995, 2003, and 2019 | National Center for Science and Engineering Statistics | National Survey of College Graduates |
| Figure LBR-28 | Median annual salaries of full-time workers with highest degrees in S&E or S&E-related fields, by race or ethnicity: Selected years, 1995, 2003, and 2019 | National Center for Science and Engineering Statistics | Scientists and Engineers Statistical Data System (SESTAT) |
| Figure LBR-29 | Employed women with highest degree in an S&E field, by race or ethnicity and field of degree: 2019 | National Center for Science and Engineering Statistics | National Survey of College Graduates |
| Figure LBR-30 | Employed women with their highest degree in an S&E field, by race or ethnicity and broad occupation: 2019 | National Center for Science and Engineering Statistics | National Survey of College Graduates |
| Figure LBR-31 | Foreign-born workers in STEM, by degree level: 2010 and 2019 | U.S. Census Bureau | American Community Survey |
| Figure LBR-32 | Foreign-born workers with a bachelor's degree or higher, by highest degree level and major occupation: 2019 | National Center for Science and Engineering Statistics | National Survey of College Graduates |
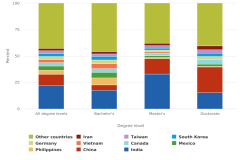
| Figure LBR-33 | Country of birth of foreign-born S&E highest degree holders living in the United States, by degree level: 2019 | National Center for Science and Engineering Statistics | National Survey of College Graduates |
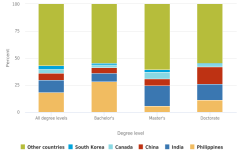
| Figure LBR-34 | Country of birth of foreign-born S&E-related highest degree holders living in the United States, by degree level: 2019 | National Center for Science and Engineering Statistics | National Survey of College Graduates |
| Figure LBR-35 | Employment of U.S. S&E doctorate recipients on temporary visas at graduation, by degree field at graduation (2008–17) and occupation (2019) | National Center for Science and Engineering Statistics | Survey of Doctorate Recipients |
| Figure LBR-35 | Employment of U.S. S&E doctorate recipients on temporary visas at graduation, by degree field at graduation (2008–17) and occupation (2019) | National Center for Science and Engineering Statistics | Survey of Earned Doctorates |
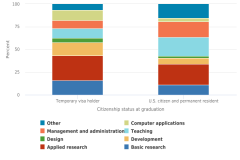
| Figure LBR-36 | Employed U.S. S&E doctorate recipients living in the United States, by primary work activity (2019) and citizenship status at graduation (2008–17) | National Center for Science and Engineering Statistics | Survey of Doctorate Recipients |
| Figure LBR-36 | Employed U.S. S&E doctorate recipients living in the United States, by primary work activity (2019) and citizenship status at graduation (2008–17) | National Center for Science and Engineering Statistics | Survey of Earned Doctorates |
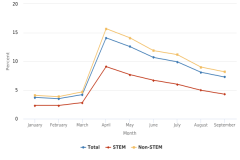
| Figure LBR-A | Monthly unemployment rates, by workforce: 2020 | Bureau of Labor Statistics | Current Population Survey |
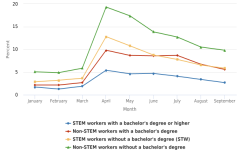
| Figure LBR-B | Monthly unemployment rates, by workforce and educational level: 2020 | Bureau of Labor Statistics | Current Population Survey |
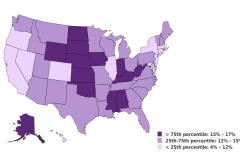
| Figure LBR-C | Employment in STEM workforce, by state: 2019 | U.S. Census Bureau | American Community Survey |
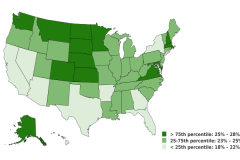
| Figure LBR-D | Employment of workers with a bachelor's degree or higher in STEM occupations, by state: 2019 | U.S. Census Bureau | American Community Survey |
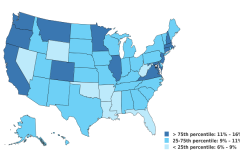
| Figure LBR-E | Employment of STEM workers without a bachelor's degree (STW), by state: 2019 | U.S. Census Bureau | American Community Survey |
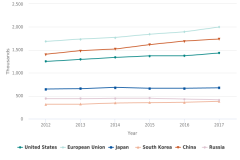
| Figure LBR-F | Estimated number of researchers in selected regions, countries, or economies: 2012–17 | Organisation for Economic Co-operation and Development | Main Science and Technology Indicators |
| Table LBR-1 | Measures and size of U.S. S&E workforce with a bachelor's degree or higher: 2019 | National Center for Science and Engineering Statistics | National Survey of College Graduates |
| Table LBR-1 | Measures and size of U.S. S&E workforce with a bachelor's degree or higher: 2019 | U.S. Census Bureau | American Community Survey |
| Table LBR-2 | Educational background of employed adults with bachelor's degree or higher, by major occupation: 2019 | National Center for Science and Engineering Statistics | National Survey of College Graduates |
| Table LBR-3 | Annual salaries in S&E and S&E-related occupations: 2016–19 | Bureau of Labor Statistics | Occupational Employment Statistics Survey |
| Table LBR-4 | Median salaries for recent SEH doctorate recipients up to 5 years after receiving degree, by field of degree and employment sector: 2019 | National Center for Science and Engineering Statistics | Survey of Doctorate Recipients |
| Table LBR-5 | Median salaries for recent SEH doctorate recipients in postdoctoral and non-postdoctoral positions up to 5 years after receiving degree: 2019 | National Center for Science and Engineering Statistics | Survey of Doctorate Recipients |
| Table LBR-6 | R&D and design activity of scientists and engineers employed in S&E occupations, by broad occupational category and highest degree level: 2019 | National Center for Science and Engineering Statistics | National Survey of College Graduates |
| Table LBR-7 | Women with a bachelor's degree or above, by broad occupational group and highest degree: 1993, 2003, 2019 | National Center for Science and Engineering Statistics | National Survey of College Graduates |
| Table LBR-7 | Women with a bachelor's degree or above, by broad occupational group and highest degree: 1993, 2003, 2019 | National Center for Science and Engineering Statistics | Scientists and Engineers Statistical Data System (SESTAT) |
| Table LBR-A | Bureau of Labor Statistics projections of employment and job openings in S&E and other selected occupations: 2019–29 | Bureau of Labor Statistics | Employment Projections |
| Table SLBR-1 | Employed adults in STEM and non-STEM occupations, by broad and detailed occupation: 2019 | U.S. Census Bureau | American Community Survey |
| Table SLBR-2 | Employed adults in the United States, by workforce type: 2010–19 | U.S. Census Bureau | American Community Survey |
| Table SLBR-3 | Certification and licenses held by workers with a bachelor's degree or higher, by broad occupational group: 2019 | National Center for Science and Engineering Statistics | National Survey of College Graduates |
| Table SLBR-4 | Scientists and engineers, by occupation and highest degree field: 2019 | National Center for Science and Engineering Statistics | National Survey of College Graduates |
| Table SLBR-5 | Relationship of highest degree to job among S&E and S&E-related highest degree holders not working in their broad degree field, by degree level: 2019 | National Center for Science and Engineering Statistics | National Survey of College Graduates |
| Table SLBR-6 | Unemployment rate, by selected groups: 1990–2019 | Bureau of Labor Statistics | Current Population Survey |
| Table SLBR-6 | Unemployment rate, by selected groups: 1990–2019 | National Bureau of Economic Research | Merged Outgoing Rotation Groups |
| Table SLBR-7 | Unemployment rates of scientists and engineers, by level of highest degree and broad occupational category: Selected years, 2003–19 | National Center for Science and Engineering Statistics | National Survey of College Graduates |
| Table SLBR-7 | Unemployment rates of scientists and engineers, by level of highest degree and broad occupational category: Selected years, 2003–19 | National Center for Science and Engineering Statistics | Scientists and Engineers Statistical Data System (SESTAT) |
| Table SLBR-8 | S&E highest degree holders who are working involuntarily part time or out of field, by S&E degree field: Selected years, 2010–19 | National Center for Science and Engineering Statistics | National Survey of College Graduates |
| Table SLBR-8 | S&E highest degree holders who are working involuntarily part time or out of field, by S&E degree field: Selected years, 2010–19 | National Center for Science and Engineering Statistics | Scientists and Engineers Statistical Data System (SESTAT) |
| Table SLBR-9 | Labor market indicators for recent S&E degree recipients up to 5 years after receiving degree, by level and field of highest degree: 2019 | National Center for Science and Engineering Statistics | National Survey of College Graduates |
| Table SLBR-10 | Employment characteristics of recent SEH doctorate recipients up to 3 years after receiving doctorate, by field of degree: 2001–19 | National Center for Science and Engineering Statistics | Survey of Doctorate Recipients |
| Table SLBR-11 | Postgraduation plans of doctorate recipients with definite commitments, by broad field of study: Selected years, 1979–2019 | National Center for Science and Engineering Statistics | Survey of Earned Doctorates |
| Table SLBR-12 | Employment sector of workers with a bachelor's degree or higher, by broad occupational category and degree field: 2019 | National Center for Science and Engineering Statistics | National Survey of College Graduates |
| Table SLBR-13 | Employment sector of S&E highest degree holders and workers in S&E occupations: 1993, 2003, and 2019 | National Center for Science and Engineering Statistics | National Survey of College Graduates |
| Table SLBR-13 | Employment sector of S&E highest degree holders and workers in S&E occupations: 1993, 2003, and 2019 | National Center for Science and Engineering Statistics | Scientists and Engineers Statistical Data System (SESTAT) |
| Table SLBR-14 | Self-employed scientists and engineers, by education, occupation, and type of business: 2019 | National Center for Science and Engineering Statistics | National Survey of College Graduates |
| Table SLBR-15 | Employment sector of S&E highest degree holders, by level and field of highest degree: 2019 | National Center for Science and Engineering Statistics | National Survey of College Graduates |
| Table SLBR-16 | Employment in major S&E occupational categories, by sector: 2019 | National Center for Science and Engineering Statistics | National Survey of College Graduates |
| Table SLBR-17 | Metropolitan areas with the largest number of workers in S&E occupations: 2019 | Bureau of Labor Statistics | Occupational Employment Statistics Survey |
| Table SLBR-18 | Metropolitan areas with the largest number of workers in S&E occupations as a percentage of all occupations: 2019 | Bureau of Labor Statistics | Occupational Employment Statistics Survey |
| Table SLBR-19 | Employment in S&E occupations, by major industry: 2019 | Bureau of Labor Statistics | Occupational Employment Statistics Survey |
| Table SLBR-20 | Employment of the skilled technical workforce, by major industry: 2019 | U.S. Census Bureau | American Community Survey |
| Table SLBR-21 | S&E doctorate holders employed in academia, by type of position and degree field: 1973–2019 | National Center for Science and Engineering Statistics | Survey of Doctorate Recipients |
| Table SLBR-22 | S&E doctorate holders employed in academia, by research priority, type of position, and degree field: 1973–2019 | National Center for Science and Engineering Statistics | Survey of Doctorate Recipients |
| Table SLBR-23 | S&E doctorate holders employed in academia with federal support, by degree field, research activity, and type of position: 1973–2019 | National Center for Science and Engineering Statistics | Survey of Doctorate Recipients |
| Table SLBR-24 | Employed scientists and engineers, by sex and occupation: 2019 | National Center for Science and Engineering Statistics | National Survey of College Graduates |
| Table SLBR-25 | Employed S&E highest degree holders, by sex and field of degree: 2019 | National Center for Science and Engineering Statistics | National Survey of College Graduates |
| Table SLBR-26 | Science, engineering, and health doctorate holders employed in academia, by type of position, sex, and degree field: 1973–2019 | National Center for Science and Engineering Statistics | Survey of Doctorate Recipients |
| Table SLBR-27 | Employed scientists and engineers, by race or ethnicity and occupation: 2019 | National Center for Science and Engineering Statistics | National Survey of College Graduates |
| Table SLBR-28 | Employed S&E highest degree holders, by race or ethnicity and field of degree: 2019 | National Center for Science and Engineering Statistics | National Survey of College Graduates |
| Table SLBR-29 | S&E doctorate holders employed in academia, by type of position, race or ethnicity, and degree field: 1973–2019 | National Center for Science and Engineering Statistics | Survey of Doctorate Recipients |
| Table SLBR-30 | Number and median salary of full-time workers with highest degree in S&E field, by sex and occupation: 2019 | National Center for Science and Engineering Statistics | National Survey of College Graduates |
| Table SLBR-31 | Number and median salary of full-time workers with highest degree in S&E field, by race or ethnicity and occupation: 2019 | National Center for Science and Engineering Statistics | National Survey of College Graduates |
| Table SLBR-32 | Employed S&E highest degree holders, by sex, race or ethnicity, field of highest degree, and broad occupational category: 2019 | National Center for Science and Engineering Statistics | National Survey of College Graduates |
| Table SLBR-33 | Employed women with their highest degree in an S&E field, by race or ethnicity and field of degree: 2019 | National Center for Science and Engineering Statistics | National Survey of College Graduates |
| Table SLBR-34 | Employed S&E highest degree holders, by race or ethnicity, sex, and field of degree: 2019 | National Center for Science and Engineering Statistics | National Survey of College Graduates |
| Table SLBR-35 | Race or ethnicity distribution of workers with a bachelor's degree or higher in broad occupational groups, by nativity: 2019 | National Center for Science and Engineering Statistics | National Survey of College Graduates |
| Table SLBR-36 | S&E doctorate holders employed in academia, by type of position, degree field, and citizenship: 2019 | National Center for Science and Engineering Statistics | Survey of Doctorate Recipients |
| Table SLBR-37 | Plans of noncitizen recipients of U.S. doctorates to stay in the United States, by field of doctorate and place of citizenship: 2008–19 | National Center for Science and Engineering Statistics | Survey of Earned Doctorates |