 An official website of the United States government
 Participation of Demographic Groups in STEM
Broadening participation in the U.S. STEM enterprise will lead to the expansion of STEM capabilities throughout the U.S. workforce and enhance the innovative capacity of the S&E enterprise in the United States (NSB 2020). Some demographic groups are represented to a lesser degree in STEM compared to the general population and may be seen as an underutilized source of talent for building the capacity of the S&E enterprise. Lower participation among certain demographic groups signals a lack of diversity in the workplace, which may negatively impact productivity, innovation, and entrepreneurship (Bell et al. 2019; Flabbi et al. 2019; Hsieh et al. 2019).
This section mostly focuses on sex, race or ethnicity, nativity, and citizenship of workers in STEM occupations by educational attainment. It also presents data on sex and race or ethnicity of workers with a bachelor’s degree or higher in a subset of STEM occupations—that is, S&E and S&E-related occupations. (See the Glossary section for definitions of S&E occupations and S&E-related occupations.) The primary data source for the analysis of STEM workers with a bachelor’s degree or higher, NCSES’s NSCG, does not allow workers in middle-skill occupations to be identified separately from those in non-STEM occupations. (See the Glossary section for definitions of middle-skill occupations and non-STEM occupations.) Hence, workers with a bachelor’s degree or higher in non-S&E occupations include those in middle-skill and non-STEM occupations. (See the Glossary section for non-S&E occupations.)
There is some limited analysis in this section on the demographic composition of the STW and of those with degrees in S&E and S&E-related fields. For more detailed analysis on the demographic composition of the STW and of those with degrees in S&E and S&E-related fields, see the NCSES report Women, Minorities, and Persons with Disabilities in Science and Engineering: 2021.
Women in STEM
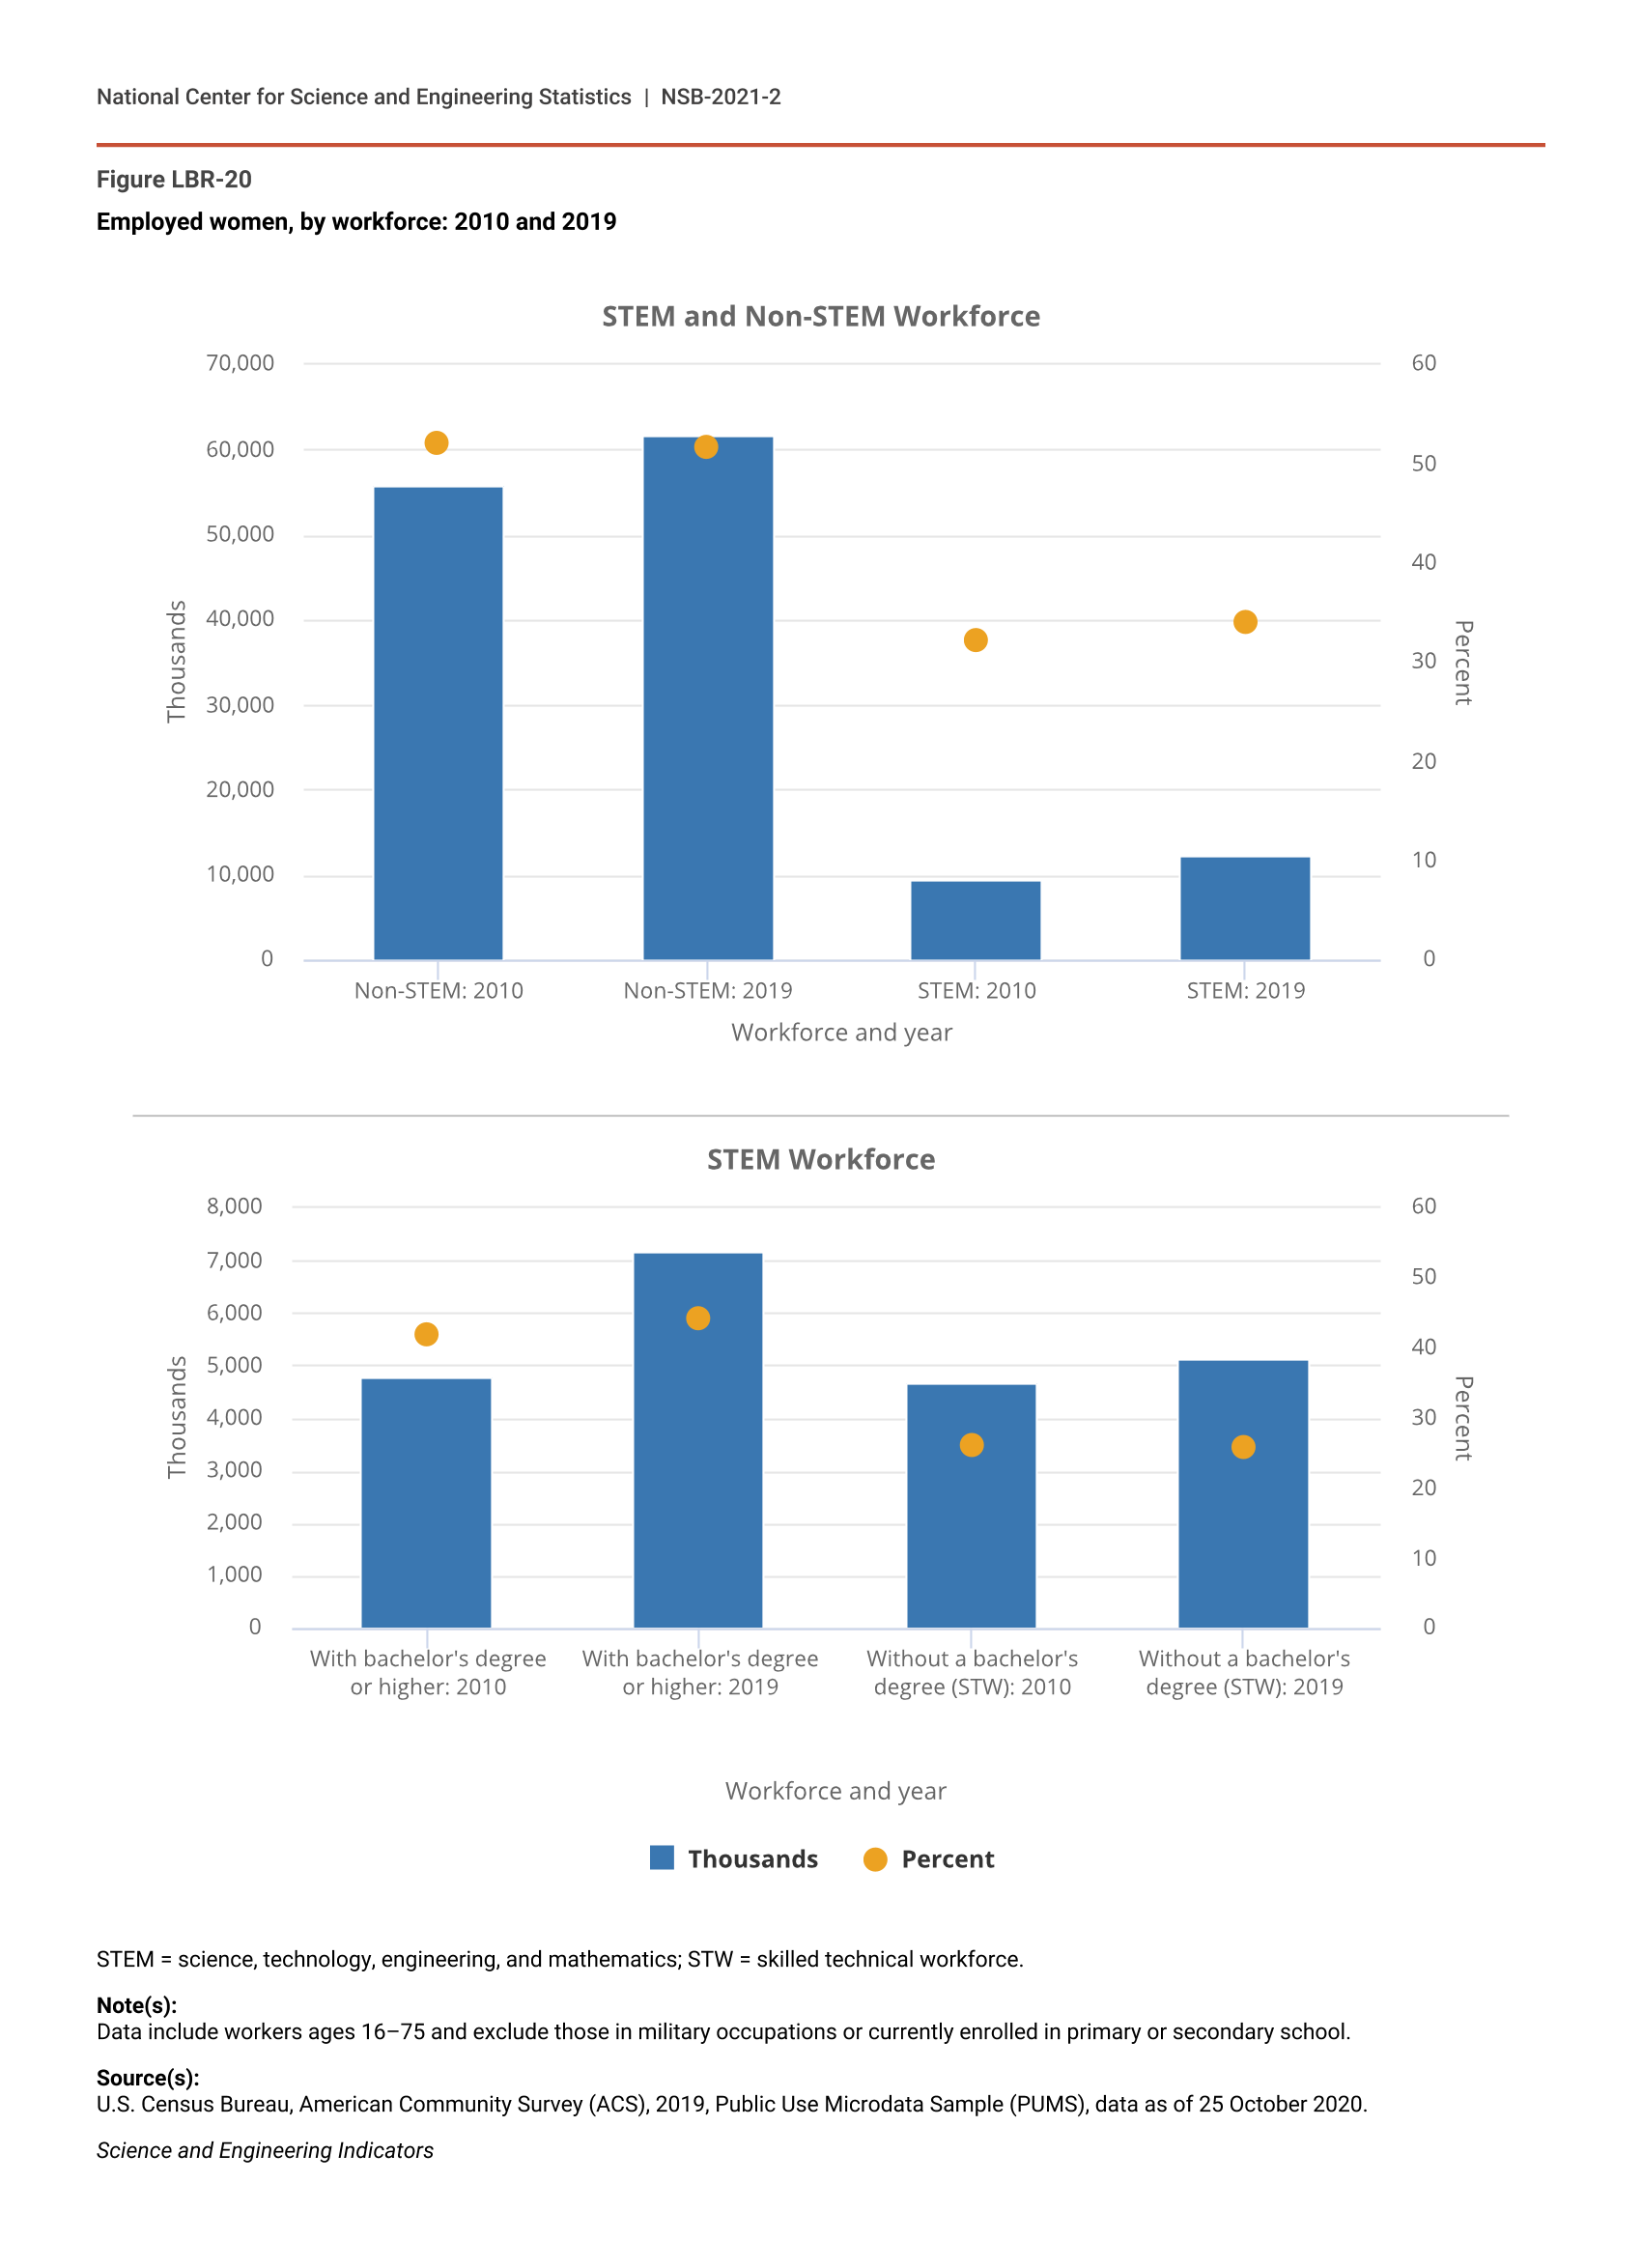
The representation of women in STEM varies across occupational groups and educational attainment. Based on the U.S. Census Bureau (2020a) 2019 ACS, women constituted 34% of the STEM workforce (12 million workers) but about 52% of the non-STEM workforce (62 million workers) (Figure LBR-20). Within STEM, women comprised 44% of workers with a bachelor’s degree or higher (7 million workers) and 26% of those without a bachelor’s degree, or in the STW (5 million workers) (Figure LBR-20).
Employed women, by workforce: 2010 and 2019
Figure data not available.
STEM = science, technology, engineering, and mathematics; STW = skilled technical workforce.
Note(s):
Data include workers ages 16–75 and exclude those in military occupations or currently enrolled in primary or secondary school.
Source(s):
U.S. Census Bureau, American Community Survey (ACS), 2019, Public Use Microdata Sample (PUMS), data as of 25 October 2020.
Science and Engineering Indicators
Since 2010, the proportion of women in the U.S. STEM workforce increased with uneven growth across STEM occupational groups and educational attainment. Overall, women in the STEM workforce increased from 32% in 2010 to 34% in 2019, nearly all of which was related to an increase in the proportion of women with a bachelor’s degree or higher in STEM, from 42% (5 million workers) in 2010 to 44% (7 million workers) in 2019. The proportion of women in the STW in 2010 and 2019 was 26% (5 million workers).
By 2019, the number of women with a bachelor’s degree or higher working in S&E occupations almost tripled since 1993 and nearly doubled in S&E-related occupations since 2003, but the distribution of women in these occupations was uneven (Table LBR-7). Data from the 2019 NSCG show that the proportion of women with a bachelor’s degree or higher in S&E occupations grew from 23% in 1993 to 29% in 2019, still well below their representation of the workforce with a bachelor’s degree or higher in 2019 (52%). In contrast, women with a bachelor’s degree or higher worked proportionately more in S&E-related occupations in 2019 (57%).
Women with a bachelor's degree or above, by broad occupational group and highest degree: 1993, 2003, 2019
NA = not available.
STEM = science, technology, engineering, and mathematics.
Note(s):
Middle-skill occupations are excluded because the data source does not allow for the separation of middle-skill occupations from non-STEM occupations. Percentages may not add to 100% because of rounding.
Source(s):
National Center for Science and Engineering Statistics, Scientists and Engineers Statistical Data System (SESTAT), 1993 and 2003, and National Survey of College Graduates (NSCG), 2019.
Science and Engineering Indicators
Within S&E-related occupations, women with a bachelor’s degree or higher represented 70% of health care workers, the majority of which are nurse practitioners, pharmacists, registered nurses, dietitians, therapists, and physician assistants (Table SLBR-24). Compared to their representation among bachelor’s degree holders overall, women also had higher representation among health technologists and technicians (66%), postsecondary teachers in health and related sciences (70%) and other health workers (70%). Among the higher salaried positions in health, such as family and general practitioners (Table LBR-3), women accounted for less than their proportion of the workforce with a bachelor’s degree or higher (43%).
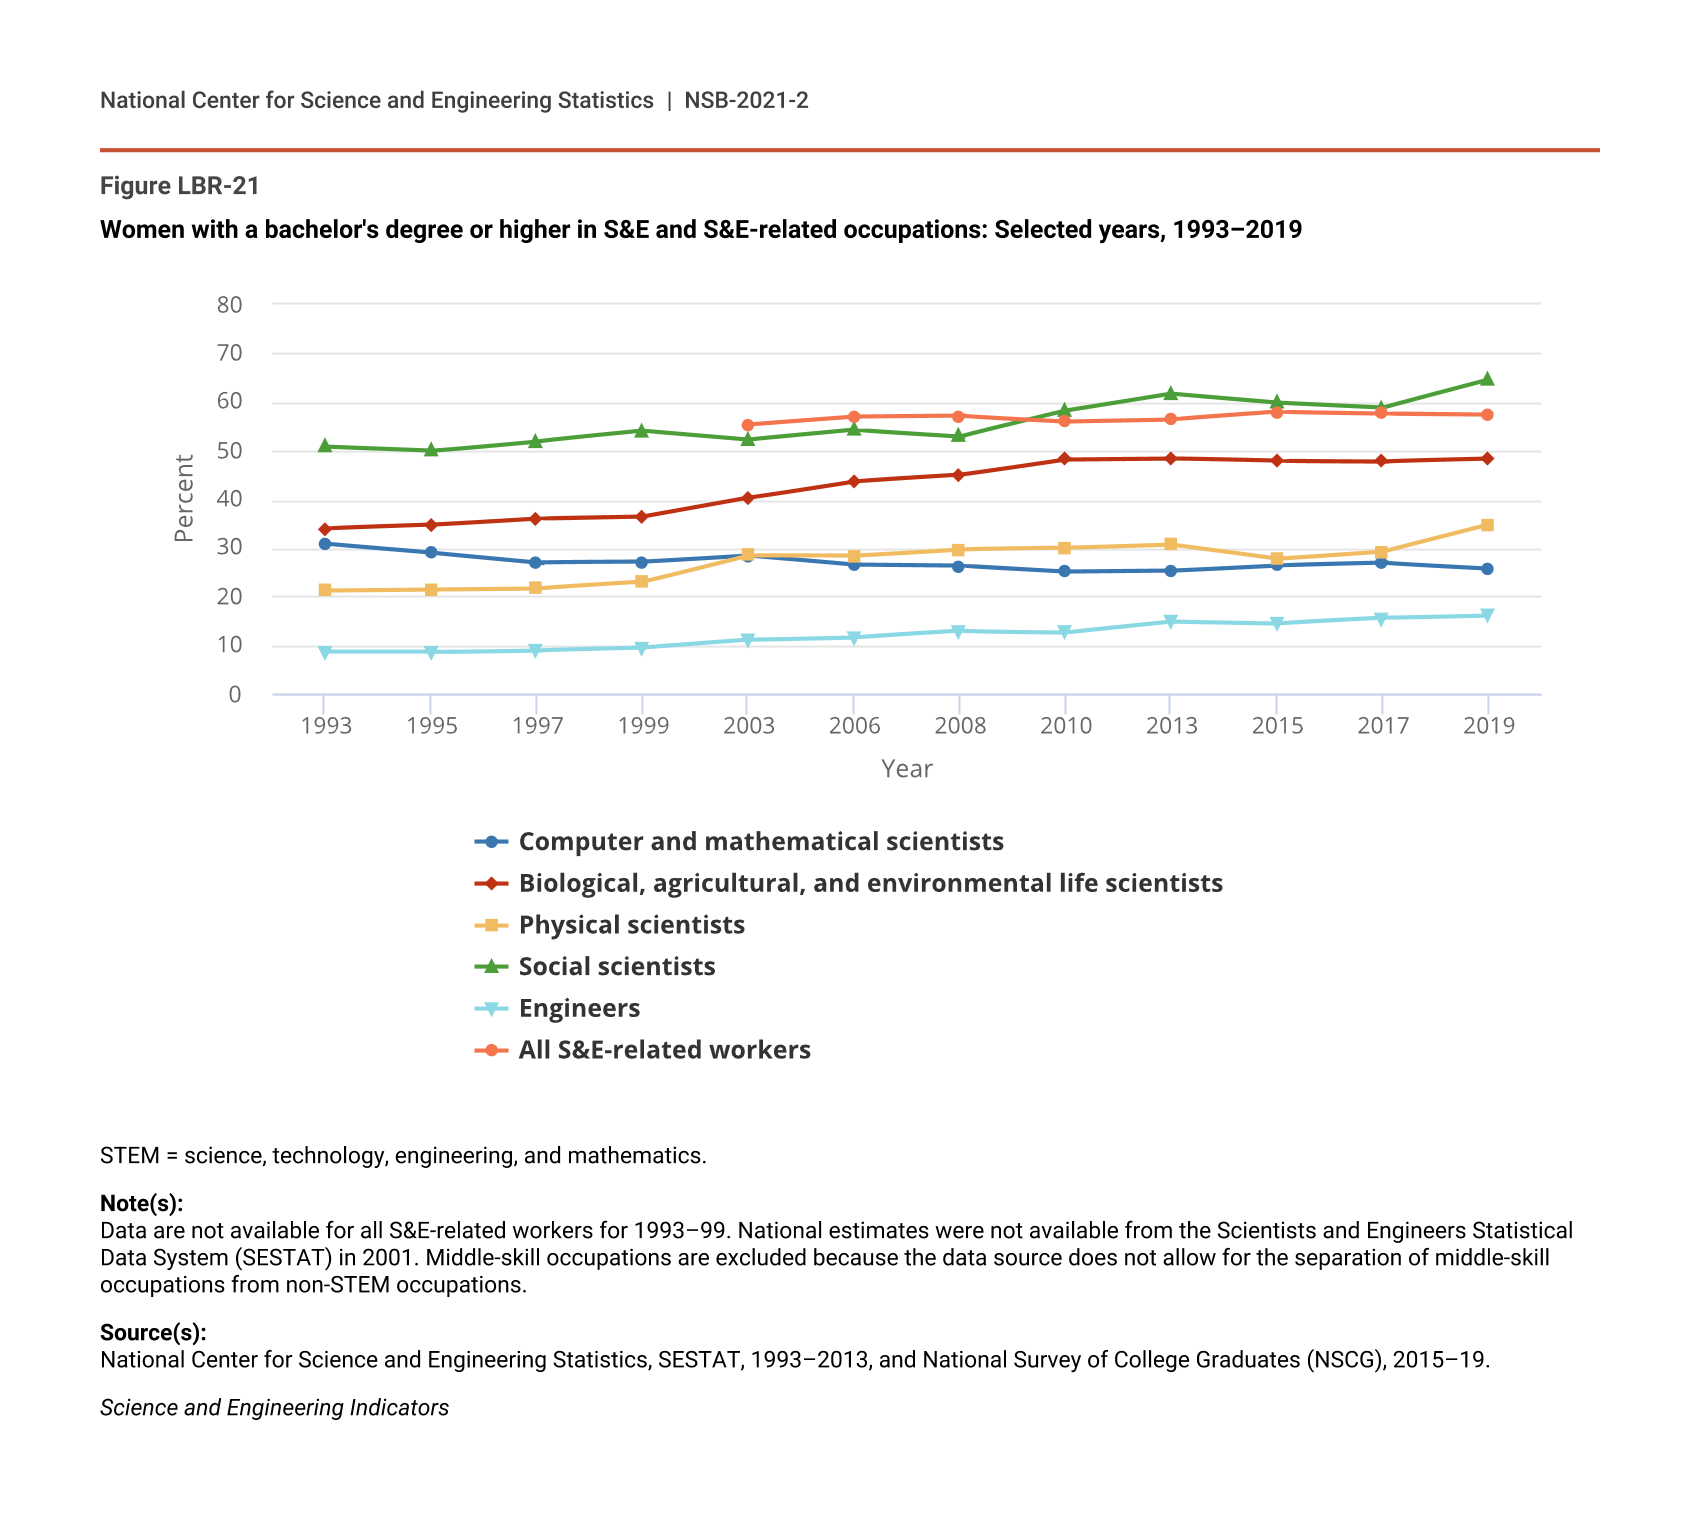
With the exception of computer and mathematical sciences, the proportion of women with a bachelor’s degree or higher in the major occupational categories within S&E grew between 1993 and 2019, but women are unevenly distributed across them (Figure LBR-21). In 2019, women account for 48% of life scientists and 65% of social scientists but only 35% of physical scientists and 26% of computer and mathematical scientists. Representation of women is the lowest in engineering (16%) among the major occupational categories in S&E. Furthermore, the representation of women varies within these major occupational categories. For example, 65% of social scientists are women, and among the detailed occupations within the social sciences, women accounted for 24% of economists and 81% of psychologists (Table SLBR-24). The distribution of women among S&E degree fields mirrors the distribution of women among S&E occupations associated with those fields (Table SLBR-25).
Women with a bachelor's degree or higher in S&E and S&E-related occupations: Selected years, 1993–2019
| Year | Computer and mathematical scientists | Biological, agricultural, and environmental life scientists | Physical scientists | Social scientists | Engineers | All S&E-related workers |
|---|---|---|---|---|---|---|
| 1993 | 30.8 | 34.0 | 21.3 | 50.7 | 8.6 | NA |
| 1995 | 29.0 | 34.7 | 21.5 | 49.9 | 8.6 | NA |
| 1997 | 27.0 | 36.0 | 21.7 | 51.9 | 9.0 | NA |
| 1999 | 27.1 | 36.4 | 23.0 | 54.0 | 9.5 | NA |
| 2003 | 28.4 | 40.3 | 28.5 | 52.2 | 11.1 | 55.3 |
| 2006 | 26.5 | 43.7 | 28.4 | 54.2 | 11.6 | 56.9 |
| 2008 | 26.3 | 45.0 | 29.7 | 52.9 | 12.9 | 57.1 |
| 2010 | 25.1 | 48.2 | 30.0 | 58.1 | 12.7 | 56.0 |
| 2013 | 25.3 | 48.4 | 30.7 | 61.6 | 14.9 | 56.4 |
| 2015 | 26.4 | 47.9 | 27.8 | 59.8 | 14.5 | 57.9 |
| 2017 | 26.9 | 47.8 | 29.3 | 58.8 | 15.6 | 57.6 |
| 2019 | 25.8 | 48.3 | 34.8 | 64.5 | 16.1 | 57.4 |
STEM = science, technology, engineering, and mathematics.
Note(s):
Data are not available for all S&E-related workers for 1993–99. National estimates were not available from the Scientists and Engineers Statistical Data System (SESTAT) in 2001. Middle-skill occupations are excluded because the data source does not allow for the separation of middle-skill occupations from non-STEM occupations.
Source(s):
National Center for Science and Engineering Statistics, SESTAT, 1993–2013, and National Survey of College Graduates (NSCG), 2015–19.
Science and Engineering Indicators
Within the SEH doctoral academic workforce, the number of women more than doubled between 1997 and 2019 and grew at a faster rate than men (Table SLBR-26). The 2019 SDR shows that women accounted for 39% of SEH doctorates employed in academia in 2019, up from 25% in 1997, and they accounted for 33% of full-time senior faculty (including full professors and associate professors) in 2019, up from 17% in 1997. The proportion of women in the doctoral academic workforce varies across disciplines (Table SLBR-26).
Compared to their representation in S&E and S&E-related occupations, women accounted for a greater proportion of individuals with highest degrees in S&E and S&E-related fields in 2019. The proportion of women holding their highest degree in S&E increased from 31% in 1993 to 40% in 2019, and a similar increase occurred with S&E-related highest degree holders (Table LBR-7). However, the proportion of working women with any level of S&E-related degree consistently exceeds that for the proportion of women with S&E degrees (Figure LBR-22). While female representation among employed S&E highest degree holders (40%) is below that of the workforce with a bachelor’s degree or higher (52%), it is still higher than female representation in S&E occupations (29%). Hence, the underrepresentation of women in S&E occupations is only partially a result of low representation with an S&E or S&E-related educational background.
Employed women with their highest degree in S&E and S&E-related fields, by degree level: Selected years, 1993–2019
| Year | Bachelor's in S&E | Master's in S&E | Doctorate in S&E | Bachelor's in S&E-related | Master's in S&E-related | Doctorate in S&E-related |
|---|---|---|---|---|---|---|
| 1993 | 32.3 | 31.7 | 20.4 | NA | NA | NA |
| 1995 | 33.7 | 32.3 | 21.8 | NA | NA | NA |
| 1997 | 34.7 | 33.0 | 23.1 | NA | NA | NA |
| 1999 | 35.9 | 33.7 | 24.1 | NA | NA | NA |
| 2003 | 36.4 | 36.9 | 25.7 | 64.5 | 67.0 | 47.9 |
| 2006 | 38.1 | 37.9 | 27.3 | 66.0 | 69.0 | 49.2 |
| 2008 | 37.8 | 38.9 | 28.8 | 67.9 | 71.6 | 51.1 |
| 2010 | 37.6 | 38.4 | 30.3 | 66.2 | 71.2 | 49.4 |
| 2013 | 38.9 | 40.5 | 31.6 | 66.5 | 71.1 | 57.3 |
| 2015 | 40.5 | 40.1 | 31.3 | 67.0 | 72.1 | 62.0 |
| 2017 | 40.3 | 39.9 | 32.3 | 68.5 | 70.7 | 64.2 |
| 2019 | 39.7 | 41.1 | 33.6 | 68.3 | 70.9 | 63.7 |
Note(s):
Data are not available for S&E-related fields for 1993–99.
Source(s):
National Center for Science and Engineering Statistics, Scientists and Engineers Statistical Data System (SESTAT), 1993–2013, National Survey of College Graduates (NSCG), 2015–19, and Survey of Doctorate Recipients (SDR), 2015–19.
Science and Engineering Indicators
Representation of Race or Ethnicity in STEM
Underrepresentation of certain races and ethnicities has long been a focus of policymakers interested in the development and employment of diverse human capital to maintain the United States’ global competitiveness in STEM. Blacks or African Americans, Hispanics or Latinos, and American Indians or Alaska Natives together make up a greater share of the general population than they do of those working in S&E occupations and with S&E degrees. These races and ethnicities are referred to as underrepresented minorities in this report. In contrast, Whites and Asians tend to comprise about the same or greater portions of S&E workers and S&E degree holders compared to their proportions of the general population.
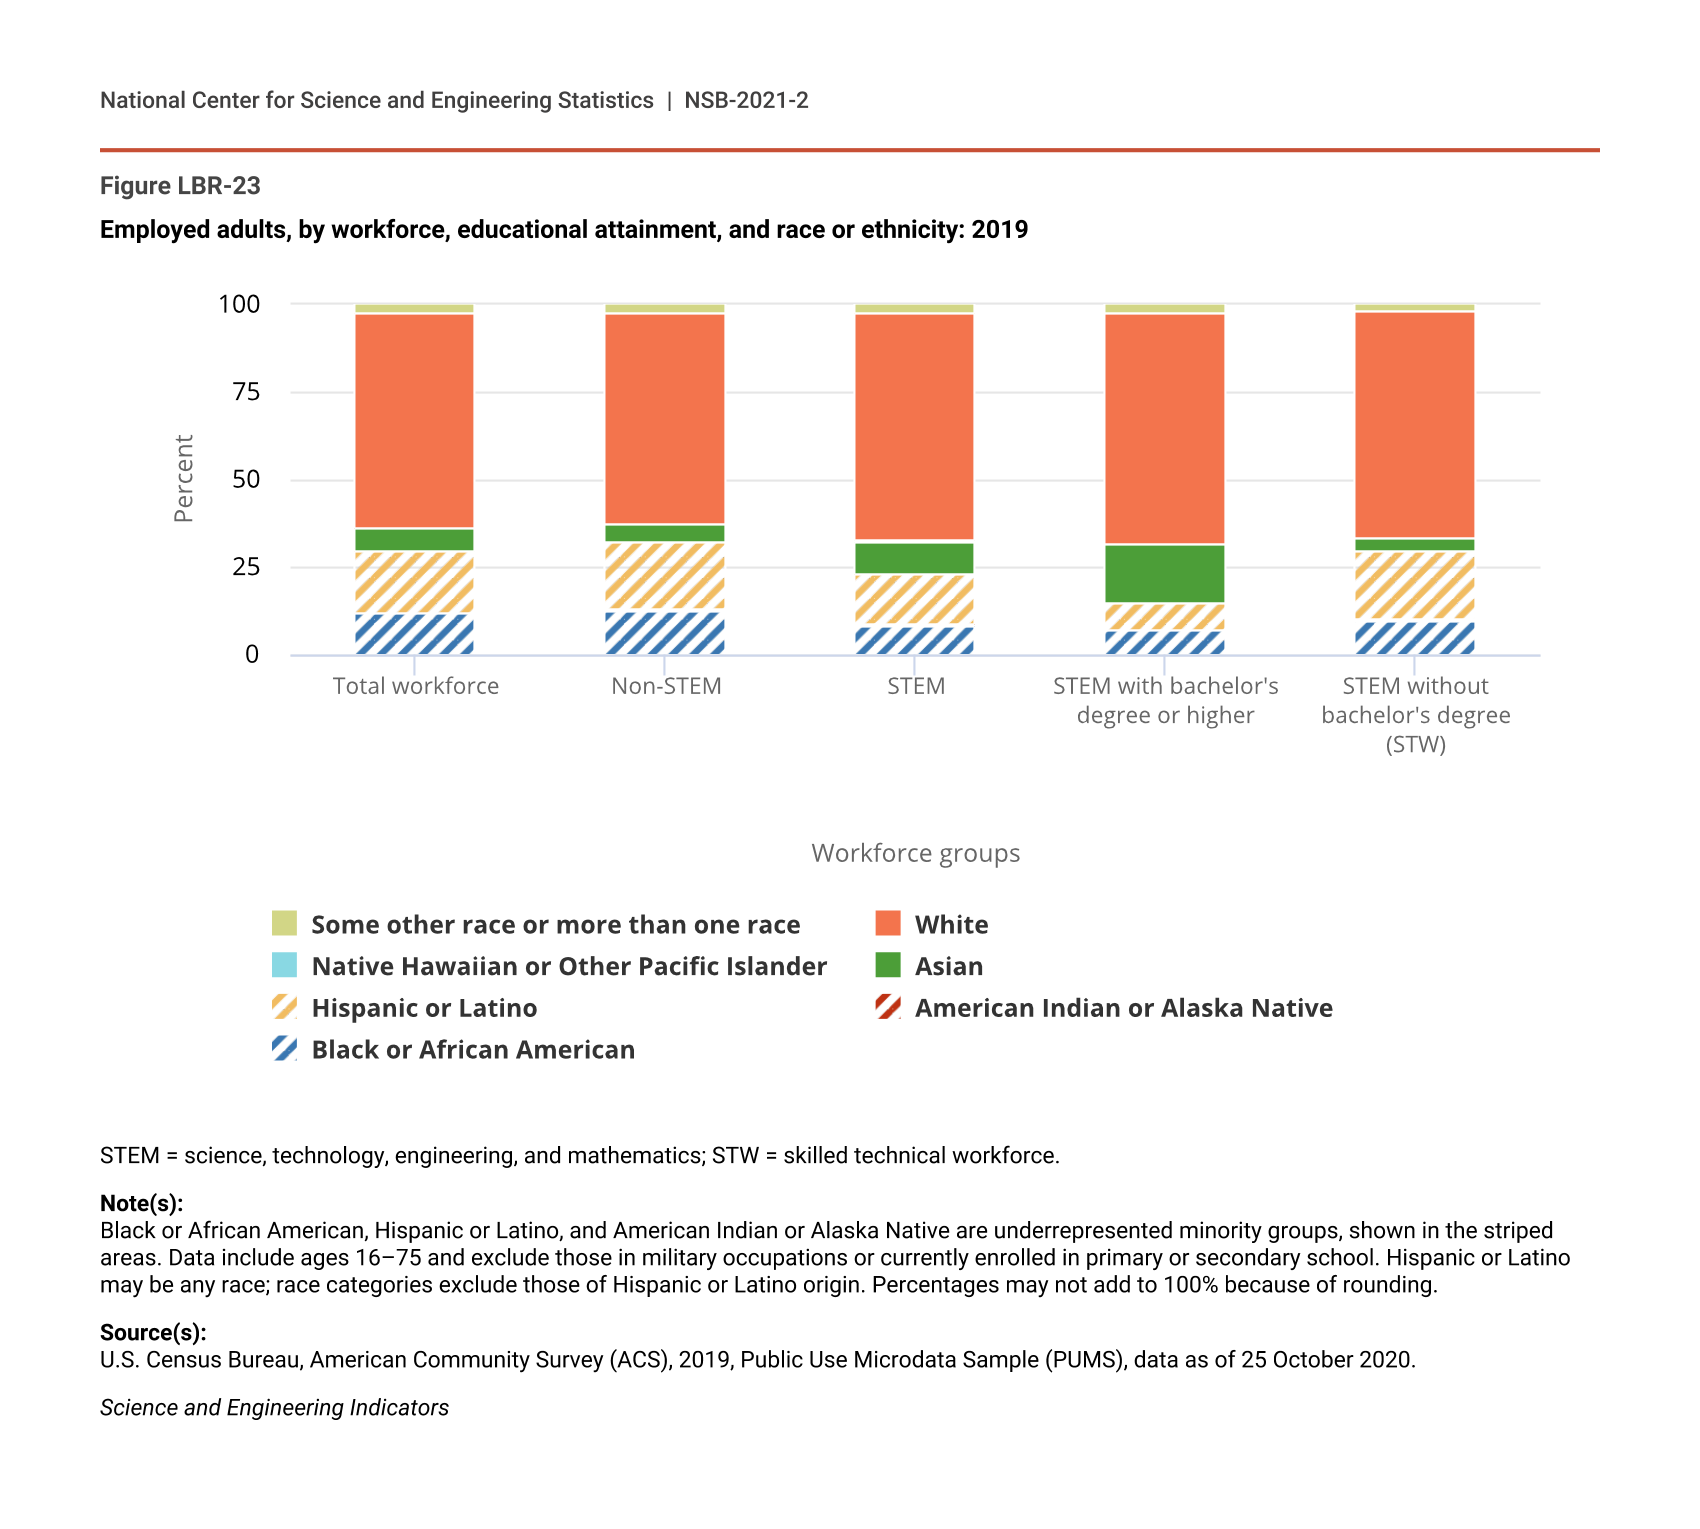
According to the U.S. Census Bureau (2020a) 2019 ACS, Asians and Whites represent a greater share of STEM (9% and 65%, respectively) compared to all Asians and all Whites in the U.S. workforce (6% and 61%, respectively) (Figure LBR-23). However, the representation of Asians in STEM is primarily driven by their representation among STEM workers with a bachelor’s degree or higher (16%), whereas Asians are underrepresented among STEM workers without a bachelor’s degree, or the STW (4%). In contrast, Whites represent a greater share of STEM workers with at least a bachelor’s degree (66%) and of the STW (65%).
Employed adults, by workforce, educational attainment, and race or ethnicity: 2019
Figure data not available.
STEM = science, technology, engineering, and mathematics; STW = skilled technical workforce.
Note(s):
Black or African American, Hispanic or Latino, and American Indian or Alaska Native are underrepresented minority groups, shown in the striped areas. Data include ages 16–75 and exclude those in military occupations or currently enrolled in primary or secondary school. Hispanic or Latino may be any race; race categories exclude those of Hispanic or Latino origin. Percentages may not add to 100% because of rounding.
Source(s):
U.S. Census Bureau, American Community Survey (ACS), 2019, Public Use Microdata Sample (PUMS), data as of 25 October 2020.
Science and Engineering Indicators
Hispanic or Latino and Black or African American workers are underrepresented in STEM, with the greater discrepancy being among those with a bachelor’s degree or higher than those without a bachelor’s degree. Hispanic or Latino workers make up 18% of the U.S. workforce but represent 14% of STEM workers. Similarly, Black or African American workers make up 12% of the U.S. working population but represent only 9% of STEM workers. In the STEM workforce with a bachelor’s degree or higher, Hispanic or Latino workers represent 8% of the workforce, and Black or African American workers represent 7%. However, at 19% of the STW, Hispanic or Latino workers are more than their proportion of the working population. Black or African American workers are underrepresented at 10% in the STW.
The proportion of Black or African American and Hispanic or Latino workers increased in both the STEM workforce with at least a bachelor’s degree and the STW between 2010 and 2019. In STEM, the number of Black or African Americans with a bachelor’s degree or higher increased 67%, and those in the STW increased 24%. Similarly, Hispanic or Latino STEM workers grew 99% for those with a bachelor’s degree or higher and 44% for those in the STW. Participation increased for these groups at a higher rate than White STEM workers with a bachelor’s degree or higher and those in the STW. This resulted in an increase in the proportion of Black or African American workers in STEM with and without a bachelor’s degree by approximately 1 percentage point in each and an increase in the proportion of Hispanic or Latino workers by 2 percentage points among those with a bachelor’s degree or higher and 4 percentage points among those without a bachelor’s degree (Figure LBR-24).
STEM workforce, by degree level and race or ethnicity: 2010 and 2019
STEM = science, technology, engineering, and mathematics; STW = skilled technical workforce.
Note(s):
Data include workers ages 16–75 and exclude those in military occupations or currently enrolled in primary or secondary school. Hispanic or Latino may be any race; race categories exclude those of Hispanic or Latino origin. Percentages may not add to 100% because of rounding.
Source(s):
U.S. Census Bureau, American Community Survey (ACS), 2019, Public Use Microdata Sample (PUMS), data as of 25 October 2020.
Science and Engineering Indicators
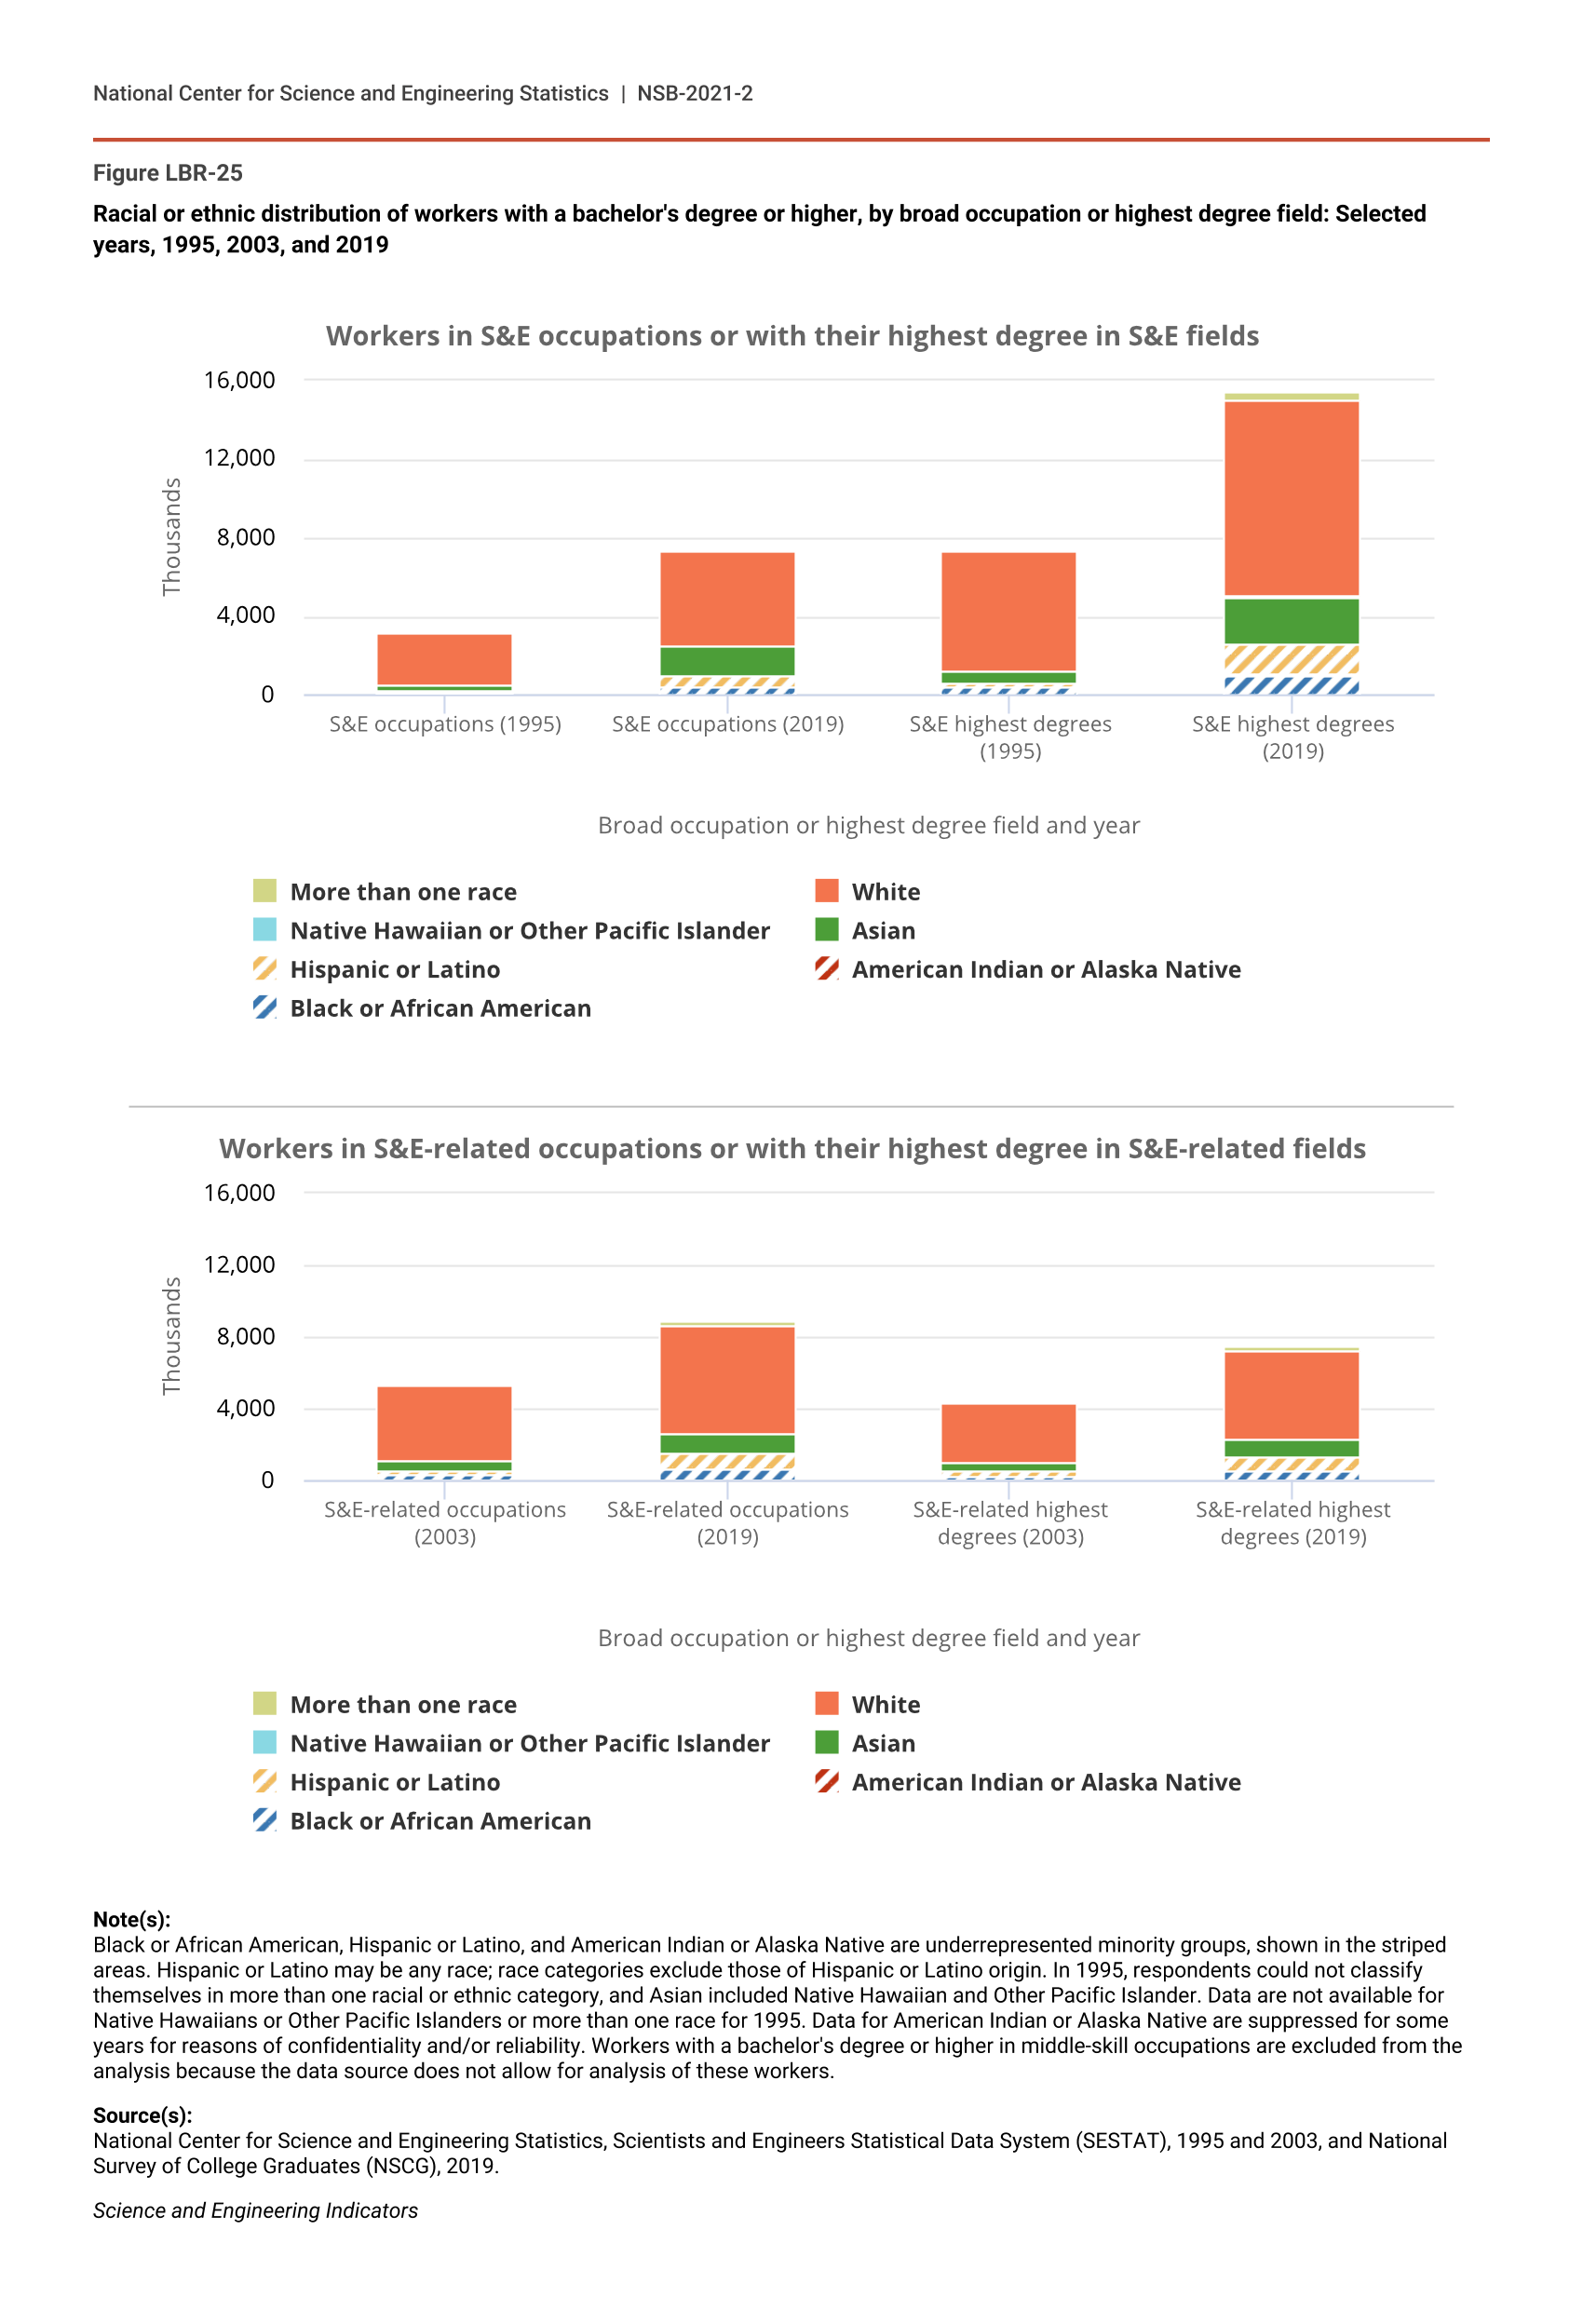
Among STEM workers with a bachelor’s degree or higher, growth among races or ethnicities in S&E and S&E-related occupations was uneven. The NSCG shows that the number of Hispanics or Latinos working in S&E occupations sextupled between 1995 and 2019 and tripled for Blacks or African Americans (Figure LBR-25). A similar trend emerges among workers in these races or ethnicities with their highest degree in S&E fields. As a result, the representation of Hispanics or Latinos working in S&E occupations grew from 3% in 1995 to 8% in 2019 and holding their highest degree in S&E fields grew from 3% to 9%. In contrast, during this same period, the proportion of Blacks or African Americans working in S&E occupations grew from 3% to 5%, and those holding their highest degree in S&E fields grew from 5% to 7%. In S&E-related occupations, Hispanic or Latino workers tripled, and Black or African workers more than doubled between 2003 and 2019, resulting in increased representation of both races or ethnicities (Figure LBR-25).
Racial or ethnic distribution of workers with a bachelor's degree or higher, by broad occupation or highest degree field: Selected years, 1995, 2003, and 2019
Figure data not available.
Note(s):
Black or African American, Hispanic or Latino, and American Indian or Alaska Native are underrepresented minority groups, shown in the striped areas. Hispanic or Latino may be any race; race categories exclude those of Hispanic or Latino origin. In 1995, respondents could not classify themselves in more than one racial or ethnic category, and Asian included Native Hawaiian and Other Pacific Islander. Data are not available for Native Hawaiians or Other Pacific Islanders or more than one race for 1995. Data for American Indian or Alaska Native are suppressed for some years for reasons of confidentiality and/or reliability. Workers with a bachelor's degree or higher in middle-skill occupations are excluded from the analysis because the data source does not allow for analysis of these workers.
Source(s):
National Center for Science and Engineering Statistics, Scientists and Engineers Statistical Data System (SESTAT), 1995 and 2003, and National Survey of College Graduates (NSCG), 2019.
Science and Engineering Indicators
Although racial or ethnic representation among STEM workers with a bachelor’s degree or higher has improved, there is wide variation in representation across detailed occupations within S&E. Compared to their share of S&E occupations overall (5%), Black or African American workers were proportionately higher among postsecondary teachers in the social and related sciences (9%), computer support specialists (10%), network and computer systems administrators (11%), and information security analysts (17%) (Table SLBR-27). Black or African American workers in S&E-related occupations (7% overall) were also more highly represented as medical and health services managers (13%), other health workers (14%), and electrical, electronic, and industrial and mechanical technicians (11%). Hispanics or Latinos, who are 8% of workers in S&E occupations overall, had a relatively large presence among social scientists (12%). Detailed occupational categories within S&E with relatively high concentration of Hispanics or Latinos include other social and related scientists (23%), civil, architectural, or sanitary engineers (10%), and industrial engineers (14%). Similar to Black or African American counterparts, Hispanic or Latino workers in S&E-related occupations (9% overall) were also more highly represented as biological and life sciences technologists and technicians (20%) and other engineering technologists and technicians (15%). Asian workers in S&E occupations (21%) have higher representation among computer and mathematical scientists (25%). The racial or ethnic groups of S&E highest degree holders vary in a manner similar to their occupation groups (Table SLBR-28).
Similar to the overall trends in the STEM workforce with a bachelor’s degree or higher, underrepresented minorities have increased representation within the SEH doctoral academic workforce. The SDR shows that the proportion of underrepresented minorities in all academic positions and full-time faculty positions increased from 6% in 1997 to 9% in 2019 (Table SLBR-29). Among all academic positions in the SEH doctoral workforce (i.e., full-time faculty, postdocs, and other positions), underrepresented minorities had the highest representation in the social sciences (13%) and psychology (12%) degree fields and the lowest in computer and information sciences (6%), physical sciences (7%), and mathematics and statistics (7%).
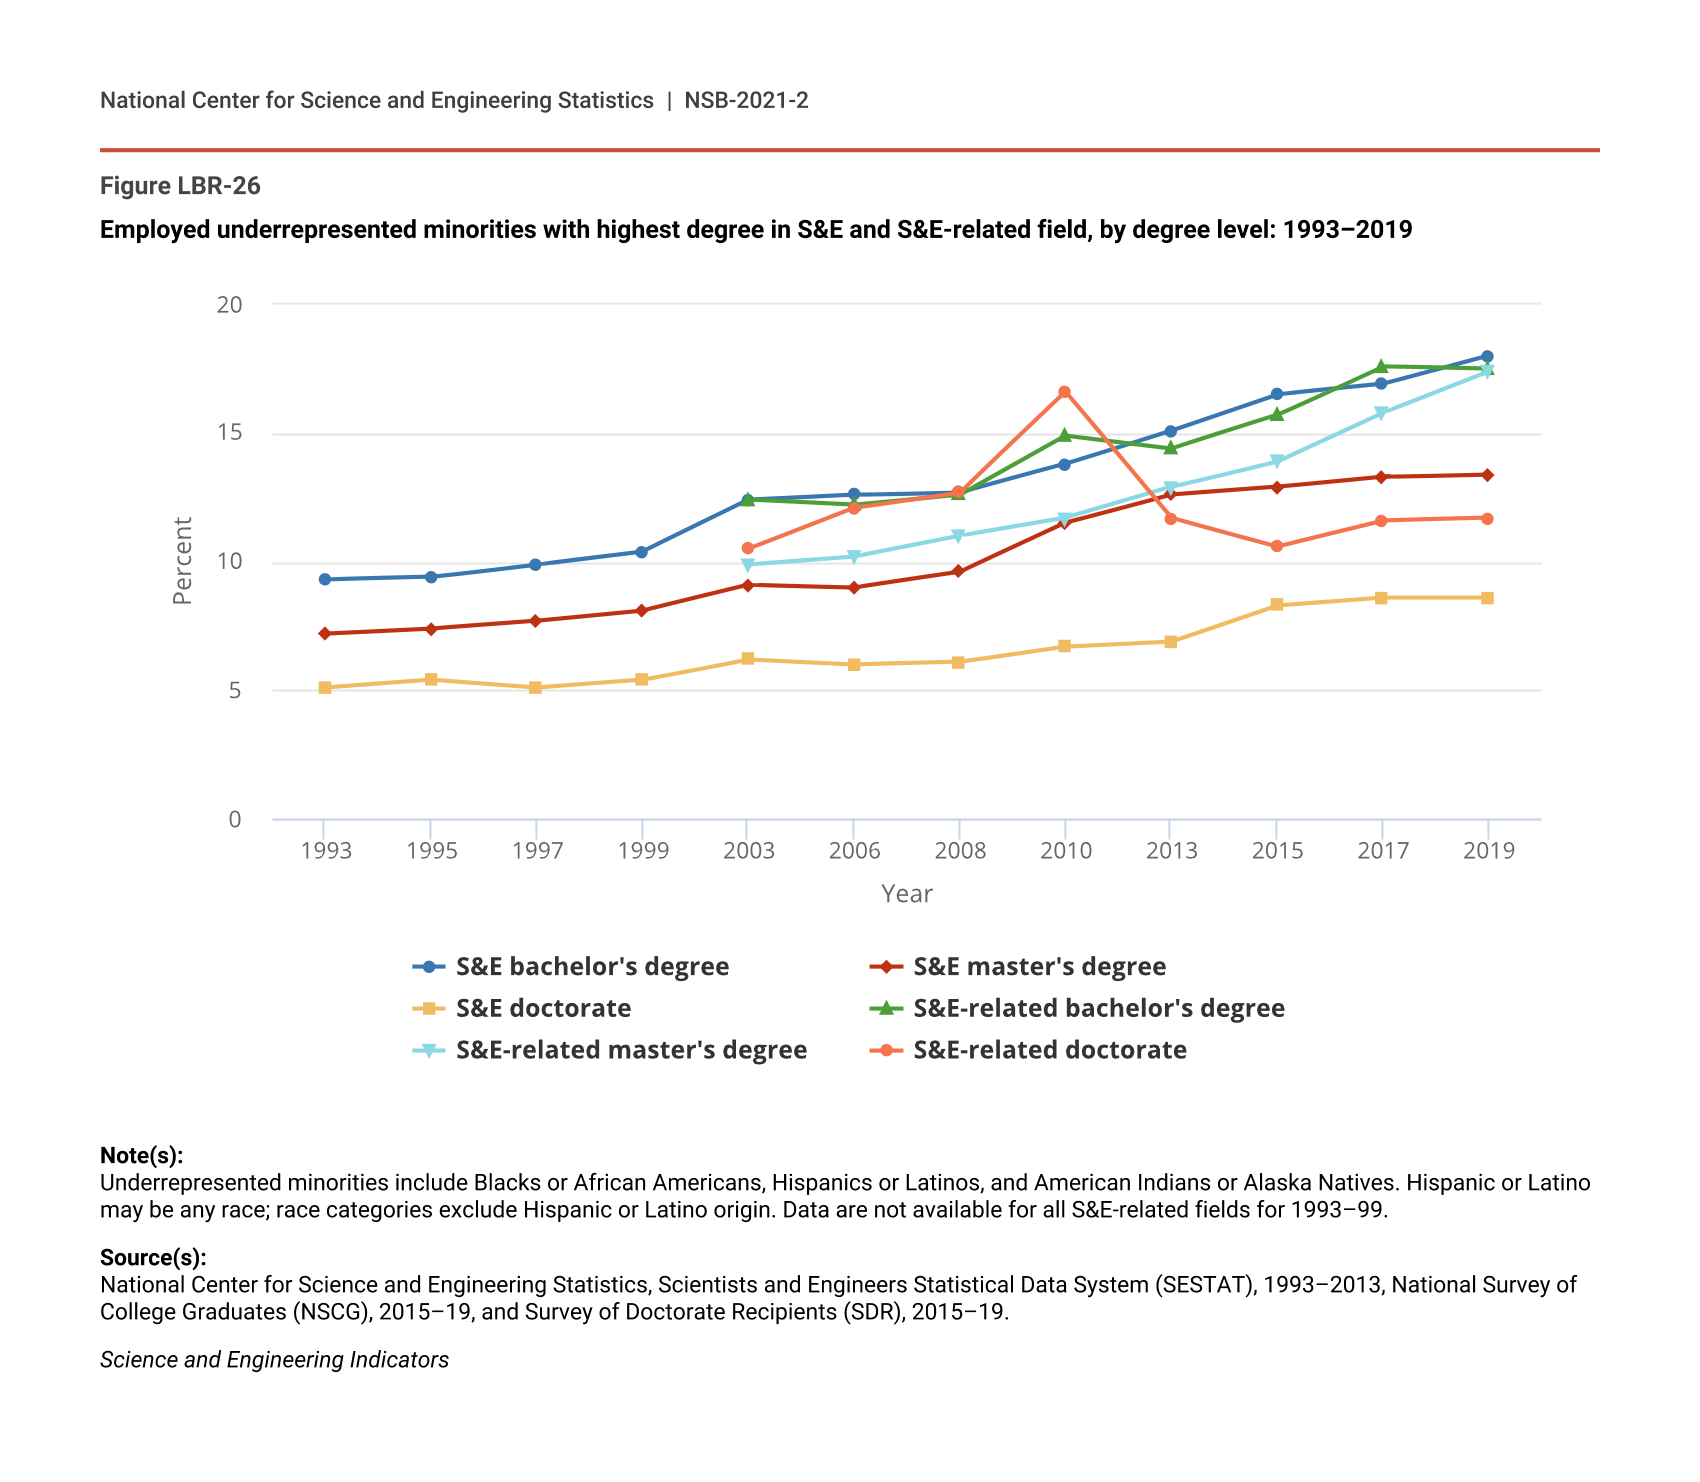
With the exception of S&E-related doctorate degrees, the percentage of underrepresented minorities holding a highest degree in S&E and S&E-related fields has consistently increased across all degree levels in the past few decades (Figure LBR-26). The number of underrepresented minorities with their highest degree in S&E more than doubled across all degree levels since 1993. Similarly, underrepresented minorities with their highest degree in an S&E-related field doubled at the bachelor’s level and tripled at the master’s level since 2003. However, the number of underrepresented minorities with their highest degree in an S&E-related field at the doctorate level declined between 2003 and 2019.
Employed underrepresented minorities with highest degree in S&E and S&E-related field, by degree level: 1993–2019
| Year | S&E bachelor's degree | S&E master's degree | S&E doctorate | S&E-related bachelor's degree | S&E-related master's degree | S&E-related doctorate |
|---|---|---|---|---|---|---|
| 1993 | 9.3 | 7.2 | 5.1 | NA | NA | NA |
| 1995 | 9.4 | 7.4 | 5.4 | NA | NA | NA |
| 1997 | 9.9 | 7.7 | 5.1 | NA | NA | NA |
| 1999 | 10.4 | 8.1 | 5.4 | NA | NA | NA |
| 2003 | 12.4 | 9.1 | 6.2 | 12.4 | 9.9 | 10.5 |
| 2006 | 12.6 | 9.0 | 6.0 | 12.2 | 10.2 | 12.1 |
| 2008 | 12.7 | 9.6 | 6.1 | 12.6 | 11 | 12.7 |
| 2010 | 13.8 | 11.5 | 6.7 | 14.9 | 11.7 | 16.6 |
| 2013 | 15.1 | 12.6 | 6.9 | 14.4 | 12.9 | 11.7 |
| 2015 | 16.5 | 12.9 | 8.3 | 15.7 | 13.9 | 10.6 |
| 2017 | 16.9 | 13.3 | 8.6 | 17.6 | 15.8 | 11.6 |
| 2019 | 18.0 | 13.4 | 8.6 | 17.5 | 17.4 | 11.7 |
Note(s):
Underrepresented minorities include Blacks or African Americans, Hispanics or Latinos, and American Indians or Alaska Natives. Hispanic or Latino may be any race; race categories exclude Hispanic or Latino origin. Data are not available for all S&E-related fields for 1993–99.
Source(s):
National Center for Science and Engineering Statistics, Scientists and Engineers Statistical Data System (SESTAT), 1993–2013, National Survey of College Graduates (NSCG), 2015–19, and Survey of Doctorate Recipients (SDR), 2015–19.
Science and Engineering Indicators
Salary Differences across Sex and Race or Ethnicity
Persistent salary differences exist between men and women and across races or ethnicities. These differences can reflect myriad factors, including fields of education and occupation; employment sector; psychological factors (e.g., reluctance of women to negotiate); and discrimination (Blau and Kahn 2017; Pager and Shepherd 2008). Although the analysis presented in this section cannot attribute differences in salary between sex and race or ethnicity to such factors, examination of salary differences over time reveals whether differences are widening or shrinking.
Women with their highest degree in an S&E degree field working full-time generally receive less pay than their male counterparts across all major occupational groups. According to the NSCG, the 2019 median annual salary of men with their highest degree in S&E was about 50% higher than women (Table SLBR-30). However, this percentage wage difference was smaller for women with their highest degree in S&E working in S&E occupations (22%) compared to those working in S&E-related occupations (43%) and non-S&E occupations (45%).
To account for changes in the cost of living over time, nominal median salaries are deflated by the personal consumption expenditure price index (BEA 2020). Constant dollar median salaries for S&E highest degree holders have increased for women from $47,000 in 1995 to $57,000 in 2019 and men from $69,000 to $86,000 (Figure LBR-27). Since 2003, constant dollar median salaries for S&E-related highest degree holders have increased for women from $63,000 to $68,000 in 2019 but have declined for men from $92,000 to $86,000.
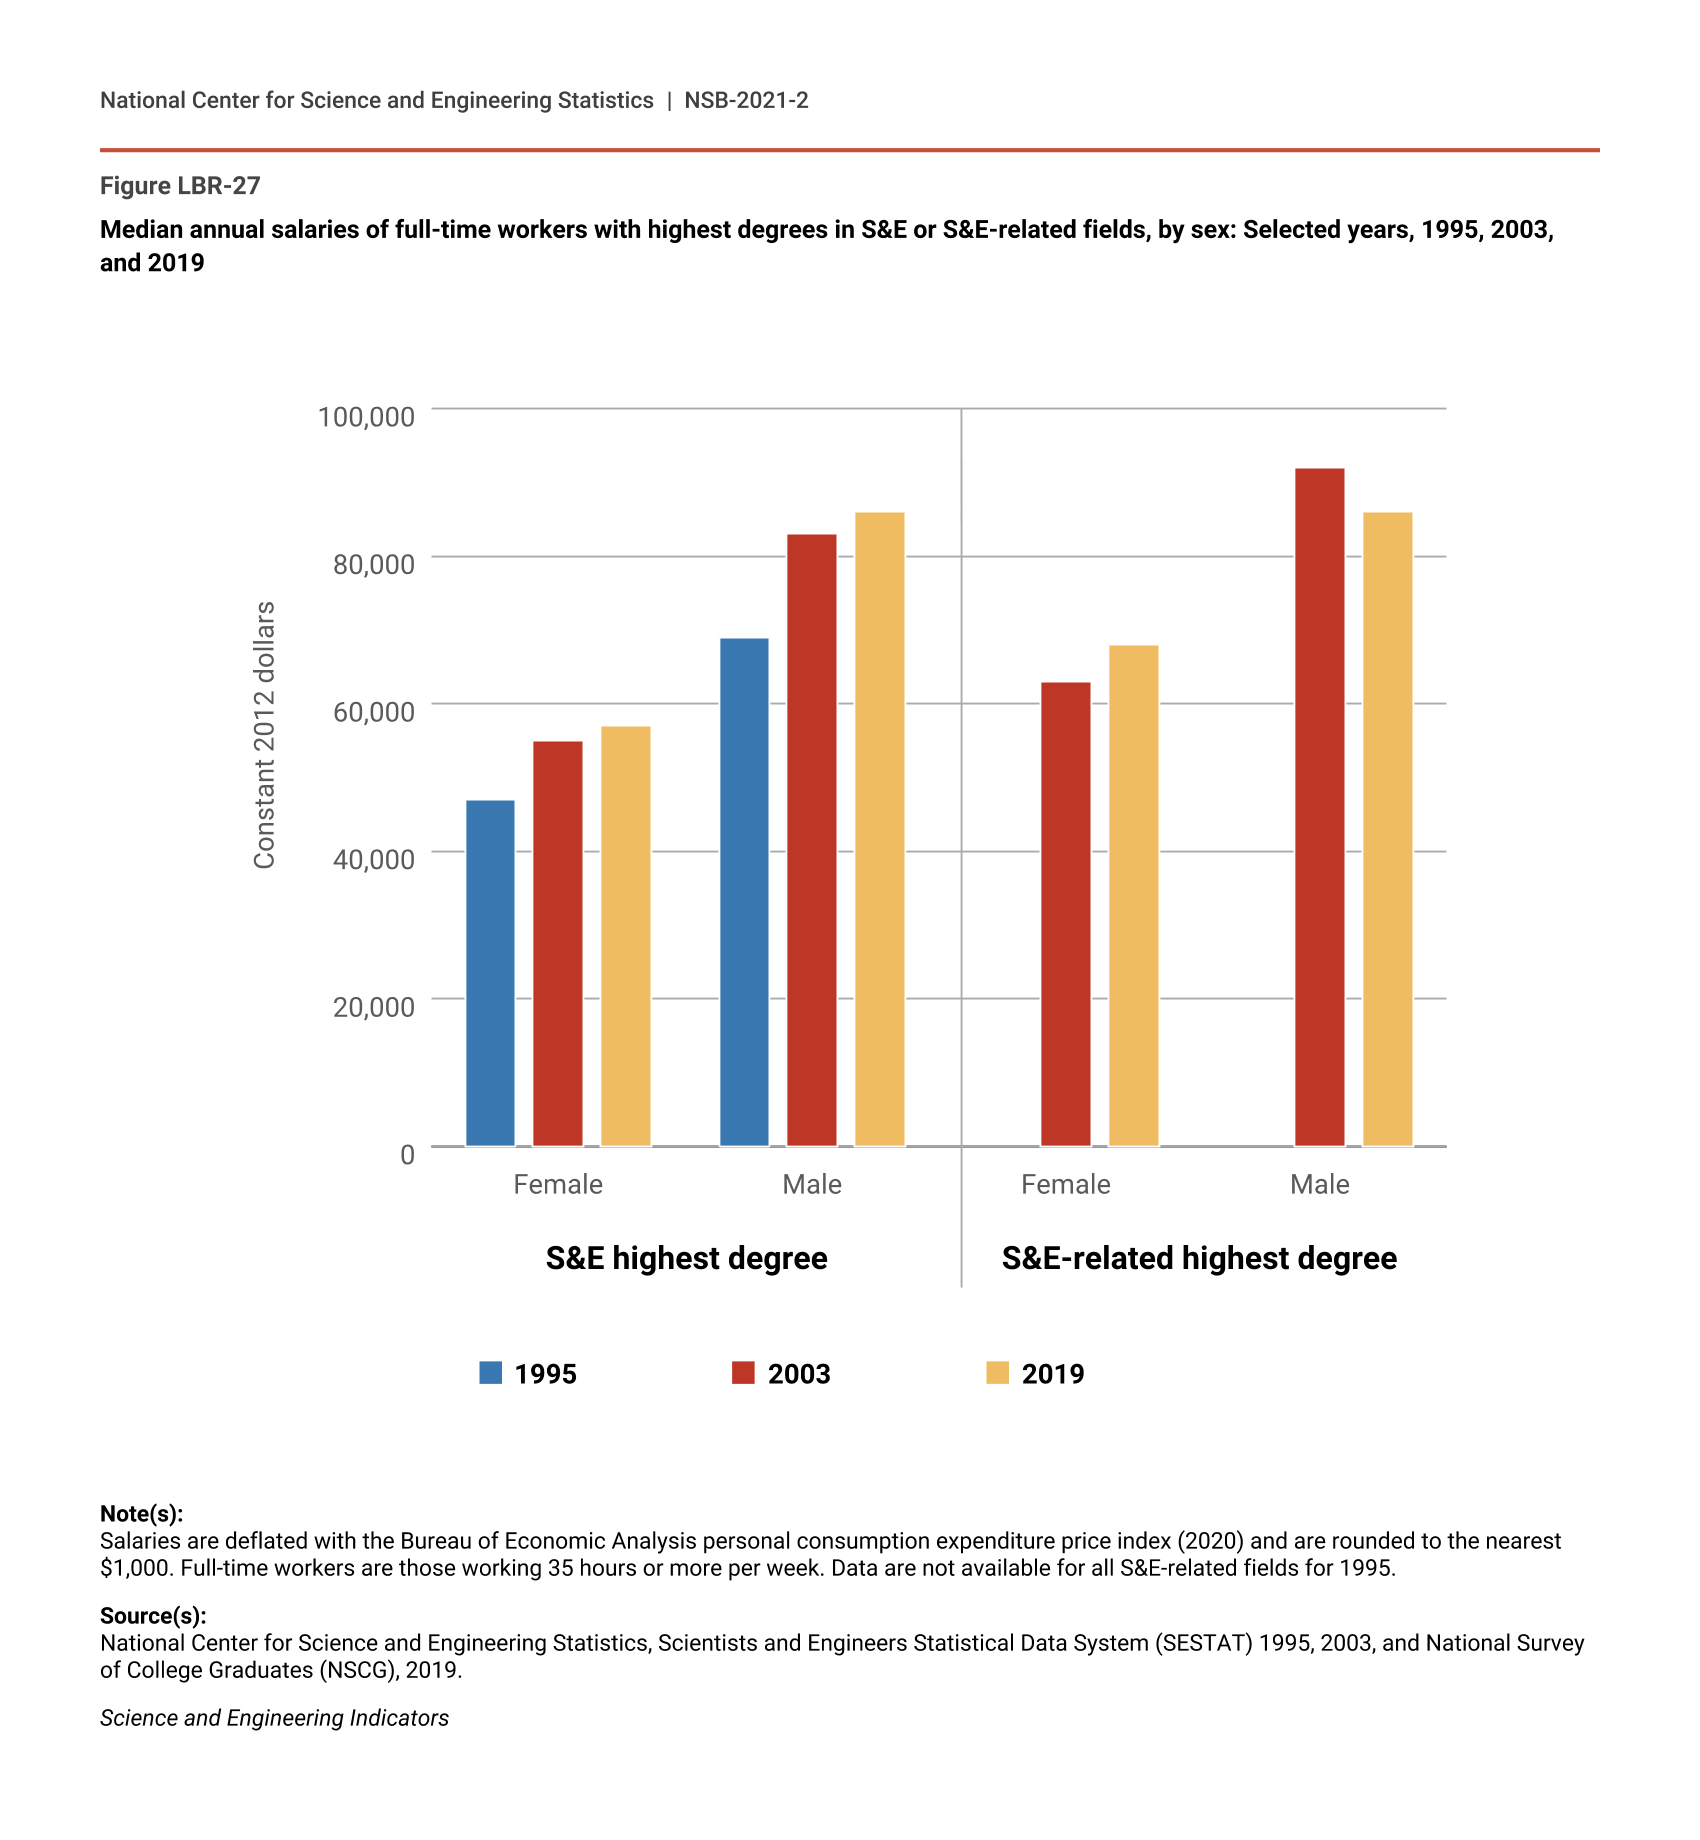
Median annual salaries of full-time workers with highest degrees in S&E or S&E-related fields, by sex: Selected years, 1995, 2003, and 2019
Note(s):
Salaries are deflated with the Bureau of Economic Analysis personal consumption expenditure price index (2020) and are rounded to the nearest $1,000. Full-time workers are those working 35 hours or more per week. Data are not available for all S&E-related fields for 1995.
Source(s):
National Center for Science and Engineering Statistics, Scientists and Engineers Statistical Data System (SESTAT) 1995, 2003, and National Survey of College Graduates (NSCG), 2019.
Science and Engineering Indicators
Salaries also vary across race or ethnicity for individuals with their highest degree in S&E fields. Median salaries of S&E highest degree holders ranged from $60,000 to $100,000 in 2019. Among full-time workers with their highest degree in an S&E field, the lowest median salaries ($60,000–$65,000) were for Black or African American, Hispanic or Latino, or American Indian or Alaska Native workers (Table SLBR-31). The highest earning workers in both degree groups were Asians ($100,000) and Native Hawaiian or Other Pacific Islanders ($100,000). Between 1995 and 2003, constant dollar salaries grew for S&E highest degree holders who were Asian, Black or African American, Hispanic or Latino, and White (Figure LBR-28). Since 2003, constant dollar salaries of S&E highest degree holders have been flat across races or ethnicities, with the exception of Asians.
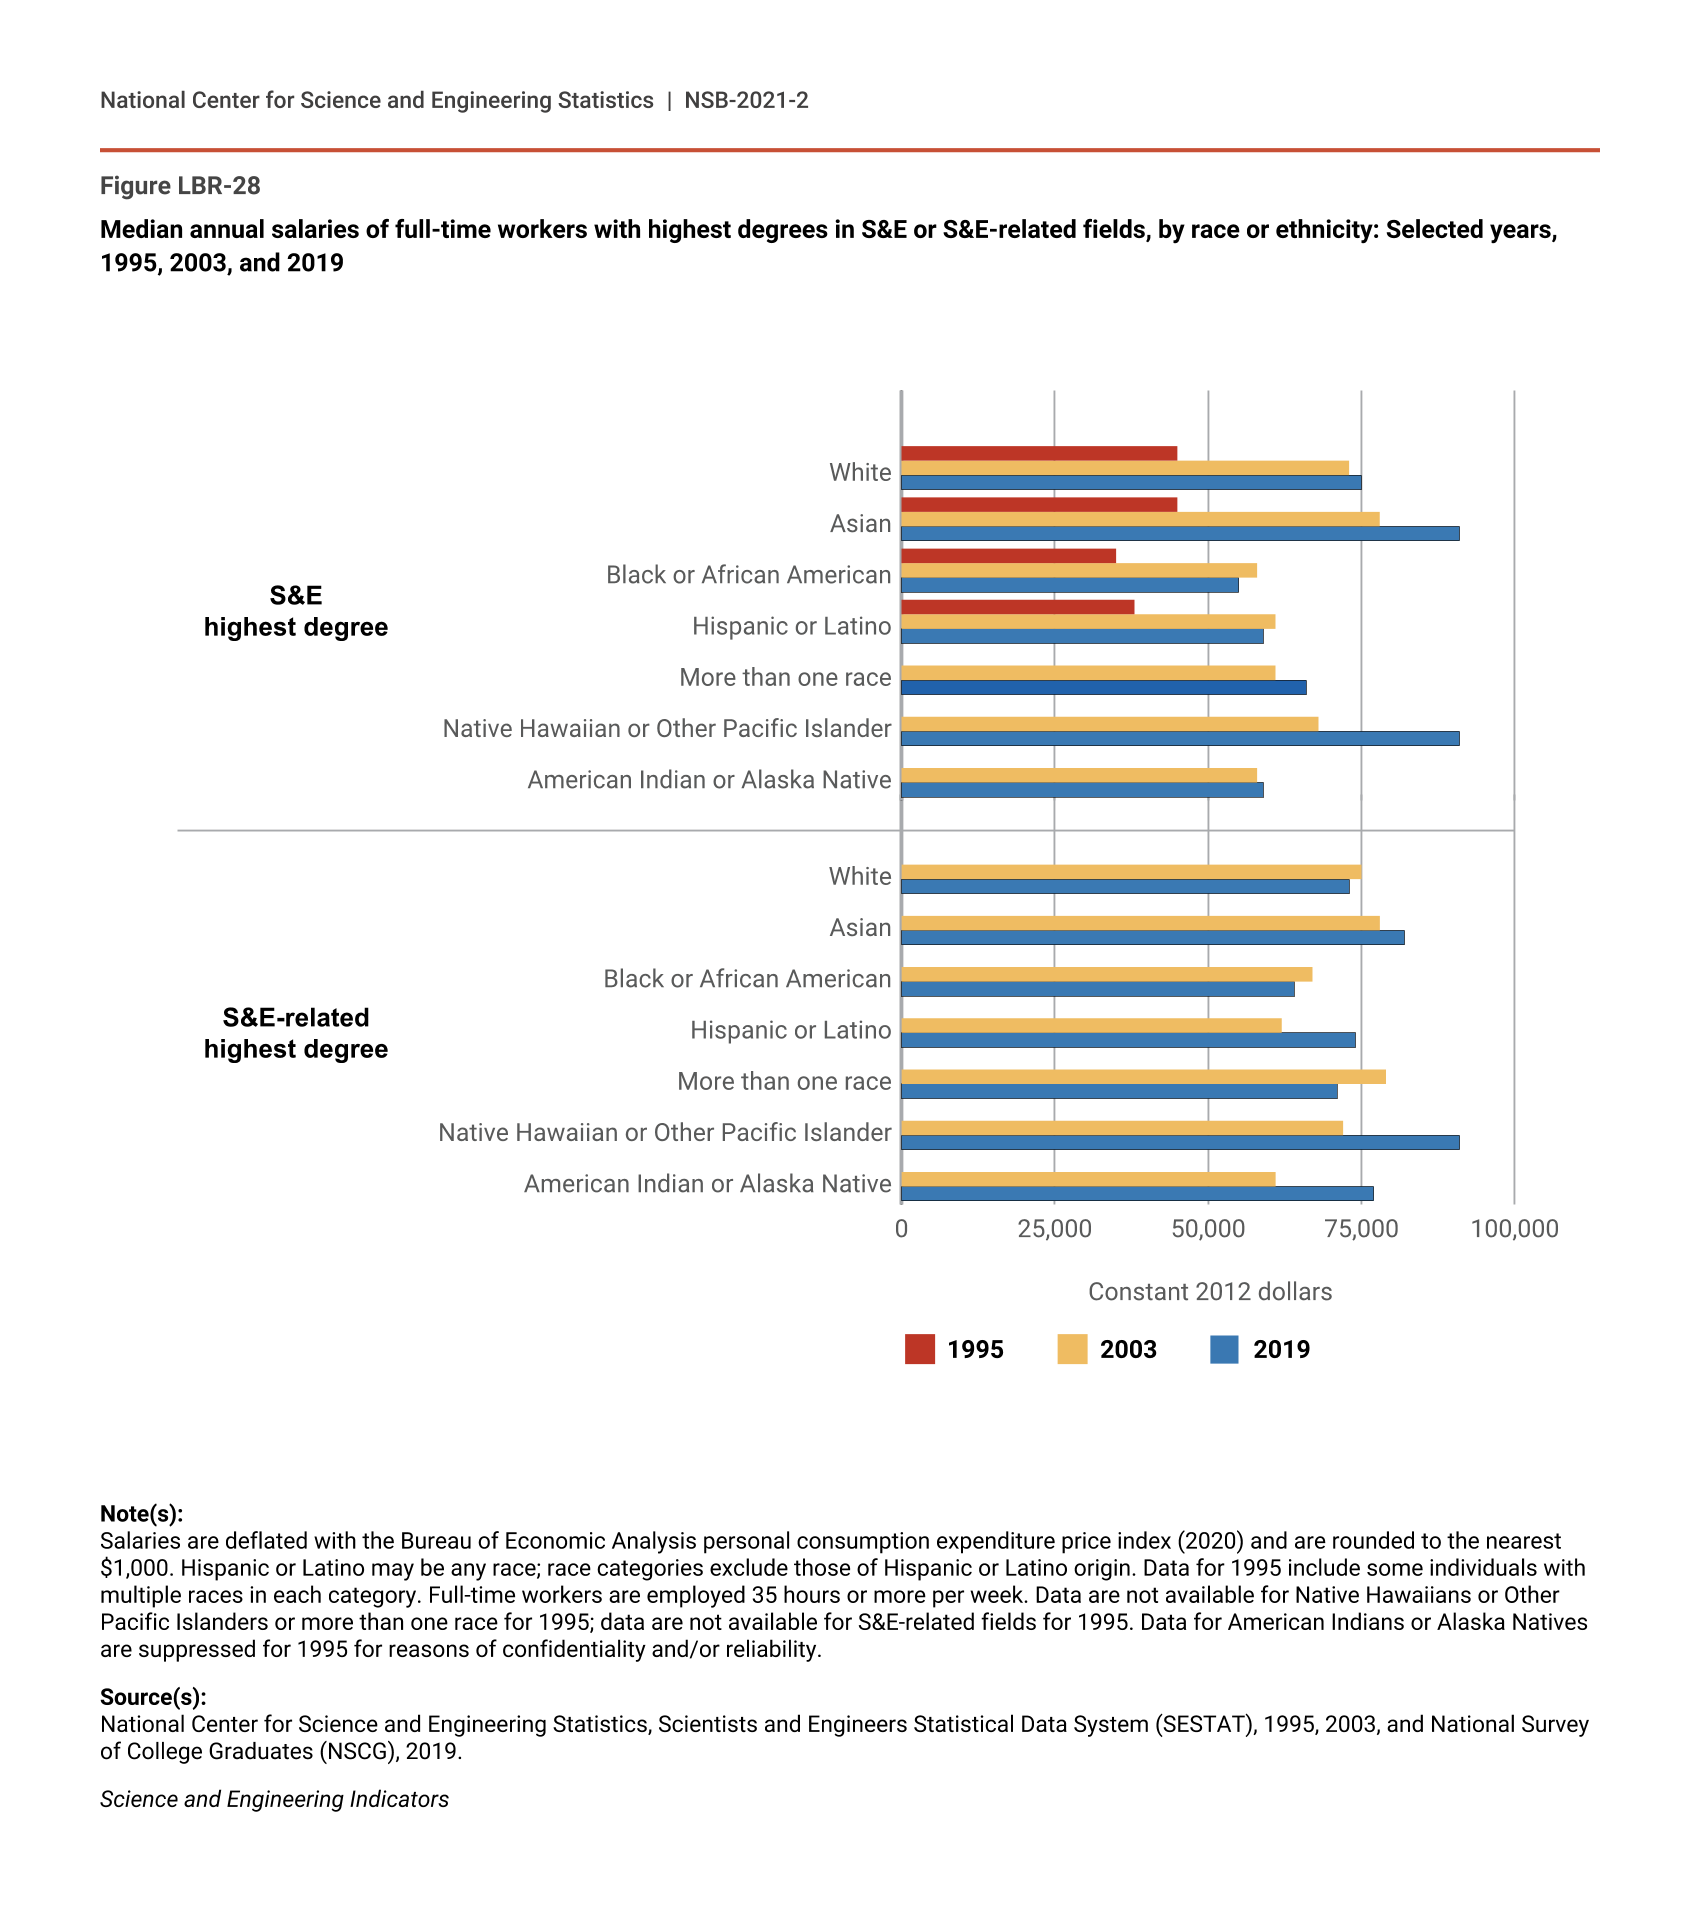
Median annual salaries of full-time workers with highest degrees in S&E or S&E-related fields, by race or ethnicity: Selected years, 1995, 2003, and 2019
Note(s):
Salaries are deflated with the Bureau of Economic Analysis personal consumption expenditure price index (2020) and are rounded to the nearest $1,000. Hispanic or Latino may be any race; race categories exclude those of Hispanic or Latino origin. Data for 1995 include some individuals with multiple races in each category. Full-time workers are employed 35 hours or more per week. Data are not available for Native Hawaiians or Other Pacific Islanders or more than one race for 1995; data are not available for S&E-related fields for 1995. Data for American Indians or Alaska Natives are suppressed for 1995 for reasons of confidentiality and/or reliability.
Source(s):
National Center for Science and Engineering Statistics, Scientists and Engineers Statistical Data System (SESTAT), 1995, 2003, and National Survey of College Graduates (NSCG), 2019.
Science and Engineering Indicators
Differences in average age, work experience, academic training, sector and occupation of employment, and other characteristics can make direct comparison of salary statistics misleading. Lower salaries are generally concentrated in degree fields that have higher concentrations of women and racial or ethnic minorities. For example, among the major occupation categories, the highest paying positions in S&E in 2019 were in engineering and in mathematical and computer sciences, which are disproportionately held by men (Table SLBR-30). Statistical models can estimate the size of the salary difference between groups when various salary-related factors are considered. Previous statistical analysis on salary differences suggests that attributes related to human capital (e.g., knowledge and skills) rather than demographic attributes have a greater influence in explaining the salary differences observed among S&E highest degree holders by sex and race or ethnicity (NSB 2019b). Nonetheless, the analysis also shows that measurable differences in human capital do not entirely explain salary differences between demographic groups.
Intersectionality in STEM
Intersectionality describes a framework for understanding how multiple intersecting social identities (e.g., sex, race or ethnicity, sexual orientation, disability, and class) affect life outcomes in ways that are qualitatively and quantitatively different from the impact of a single social identity (Armstrong and Jovanovic 2015; Cole 2009). Recent analysis shows that some intersecting social identities face compounded nonlinear discriminatory penalties in the labor market (Paul et al. 2018). In terms of the STEM workforce, educational pathways, representation, and earnings varied for intersecting identities based on sex and race or ethnicity (Hanson 2013; Martinez and Gayfield 2019).
In 2019, with the exception of Asian women, employed women with their highest degree in the social sciences were the majority (55%–62%) of each race or ethnicity among employed female S&E highest degree holders (Figure LBR-29). The remaining women, again in all races and ethnicities except Asian, were distributed across the other four broad fields, with the lowest proportion of each group holding degrees in physical sciences. In contrast, Asian women were more evenly distributed, with 20%–30% of Asian women having their highest degrees in computer and mathematical sciences, life sciences, social and related sciences, or engineering. Highest degree holders in the physical sciences were the smallest proportion of Asian, Hispanic or Latino, and White women (3%–5%).
Employed women with highest degree in an S&E field, by race or ethnicity and field of degree: 2019
| Race or ethnicity | Computer and mathematical sciences | Biological, agricultural, and environmental life sciences | Physical and related sciences | Social and related sciences | Engineering |
|---|---|---|---|---|---|
| All women | 13.2 | 19.9 | 4.4 | 52.4 | 10.1 |
| Asian | 28.3 | 19.4 | 4.4 | 27.4 | 20.5 |
| Black or African American | 13.6 | 15.3 | 3.3 | 61.9 | 6.0 |
| Hispanic or Latino | 7.5 | 17.4 | 2.7 | 60.6 | 11.9 |
| White | 10.7 | 21.1 | 4.9 | 55.3 | 8.0 |
| Other race or ethnicity | 8.7 | 18.2 | 5.4 | 60.8 | 6.8 |
Note(s):
Hispanic or Latino may be any race; race categories exclude those of Hispanic or Latino origin. Other race or ethnicity includes American Indian or Alaska Native, Native Hawaiian or Other Pacific Islander, and more than one race. Percentages may not add to 100% because of rounding.
Source(s):
National Center for Science and Engineering Statistics, National Survey of College Graduates (NSCG), 2019.
Science and Engineering Indicators
Female S&E highest degree holders tend to work proportionately less in S&E occupations (26%) compared to men (45%) (Figure LBR-30; Table SLBR-32). However, the extent to which women with their highest degree in an S&E field worked in S&E occupations varied by race or ethnicity. Among women with their highest degree in an S&E field, Asian women worked proportionately more in S&E occupations (45%) compared to White (24%), Hispanic or Latino (22%), other races or ethnicities (21%), and Black or African American women (15%) (Figure LBR-30).
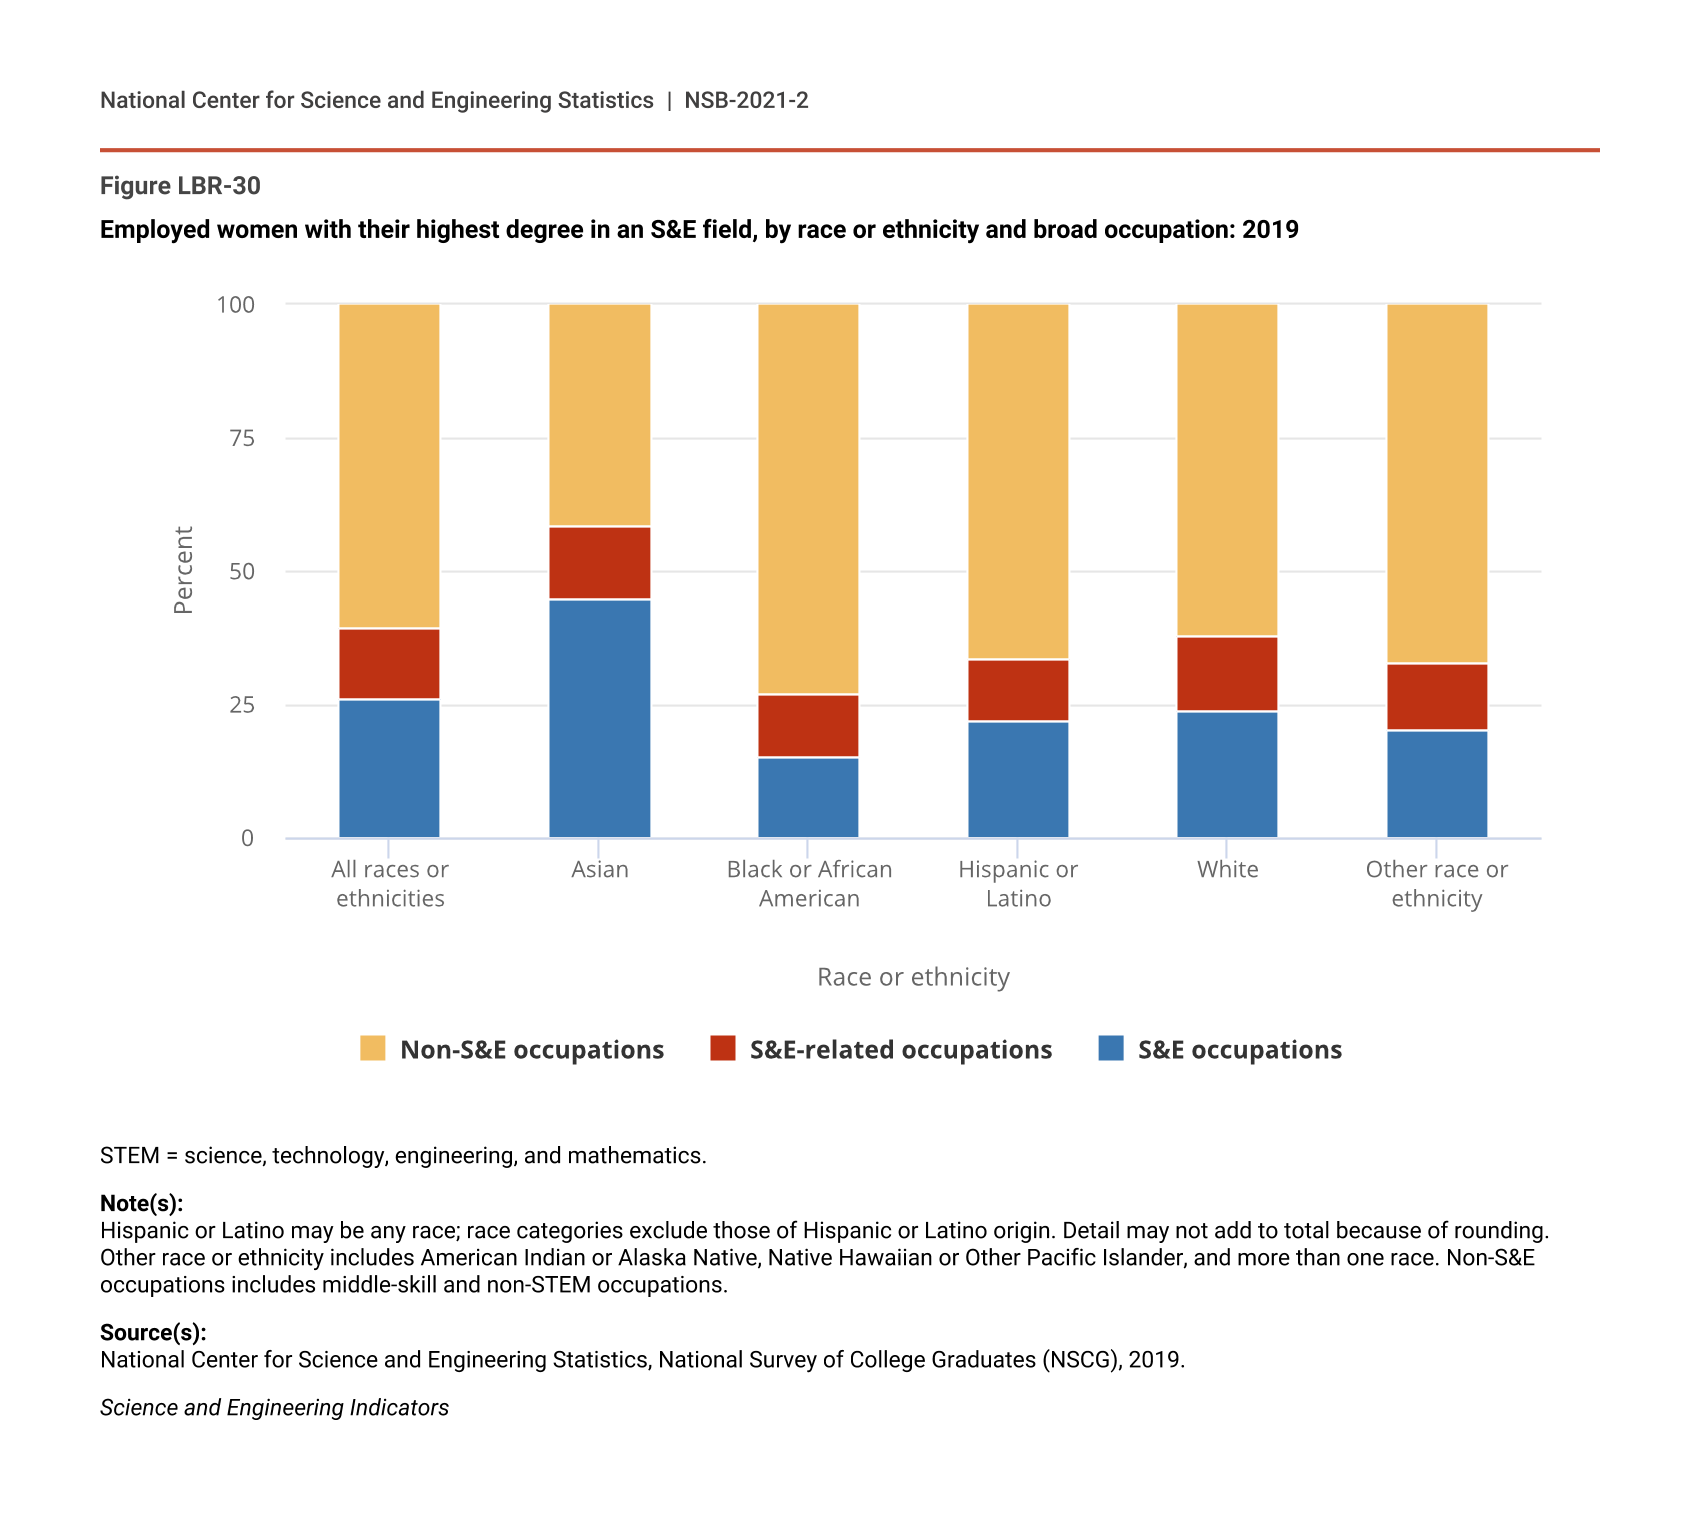
Employed women with their highest degree in an S&E field, by race or ethnicity and broad occupation: 2019
| Race or ethnicity | S&E occupations | S&E-related occupations | Non-S&E occupations |
|---|---|---|---|
| All races or ethnicities | 26.0 | 13.3 | 60.7 |
| Asian | 44.9 | 13.5 | 41.6 |
| Black or African American | 15.2 | 11.8 | 73.1 |
| Hispanic or Latino | 22.0 | 11.7 | 66.3 |
| White | 23.9 | 13.8 | 62.3 |
| Other race or ethnicity | 20.5 | 12.4 | 67.1 |
STEM = science, technology, engineering, and mathematics.
Note(s):
Hispanic or Latino may be any race; race categories exclude those of Hispanic or Latino origin. Detail may not add to total because of rounding. Other race or ethnicity includes American Indian or Alaska Native, Native Hawaiian or Other Pacific Islander, and more than one race. Non-S&E occupations includes middle-skill and non-STEM occupations.
Source(s):
National Center for Science and Engineering Statistics, National Survey of College Graduates (NSCG), 2019.
Science and Engineering Indicators
Although the majority of Black or African American women with their highest degree in an S&E field were in the social sciences (Figure LBR-29), only 6% of them worked in S&E occupations (Table SLBR-33). In contrast, Black or African American women with their highest degree in engineering and computer and mathematical sciences worked in S&E occupations at higher proportions (38% and 41%, respectively). Nearly three-fourths of Black or African American women with their highest degree in an S&E field (73%) worked in non-S&E occupations, primarily in management-related occupations (16%), social services (11%), and other non-S&E occupations (28%) (Table SLBR-34).
Foreign-Born Workers in STEM
The U.S. S&E enterprise has long benefitted from the S&E skills and knowledge of foreign-born STEM workers (Abramitzky and Boustan 2017; Kerr and Kerr 2017; Khanna and Lee 2019). Foreign-born workers are those born in countries other than the United States regardless of citizenship; a subset of foreign-born workers comprises noncitizens who are temporarily in the United States on visas or are permanent residents. U.S. policies on immigration and citizenship shape employers’ access to this critical source of STEM talent (Kerr and Kerr 2020). Most of this section is based on 2019 data and does not reflect changes in immigration based on the COVID-19 pandemic or recent changes to immigration law after 2019 (DHS/USCIS 2020b; 2020c; DOL 2020b).
According to the U.S. Census Bureau’s (2020a) 2019 ACS, a considerable proportion of STEM workers are foreign born, and both the number and proportion of foreign-born STEM workers rose between 2010 and 2019 (Figure LBR-31). In 2019, foreign-born workers accounted for 19% of the STEM workforce, increasing from 17% since 2010. Foreign-born workers with a bachelor’s degree or higher comprise a larger share of the STEM workforce (23%) than those without a bachelor’s degree (16%). Most foreign-born workers with a bachelor’s degree or higher in S&E and S&E-related occupations are Asian or White, but the distribution of race or ethnicity of these workers varies by broad occupational category (Table SLBR-35).
Foreign-born workers in STEM, by degree level: 2010 and 2019
| Workforce and degree level | 2010 | 2019 |
|---|---|---|
| All STEM | 17.1 | 18.8 |
| STEM with a bachelor's degree or higher | 21.3 | 22.7 |
| STEM without a bachelor's degree (STW) | 14.4 | 15.6 |
| All non-STEM | 16.4 | 17.1 |
STEM = science, technology, engineering, and mathematics; STW = skilled technical workforce.
Note(s):
Data include workers ages 16–75 and exclude those in military occupations or currently enrolled in primary or secondary school.
Source(s):
U.S. Census Bureau, American Community Survey (ACS), 2010, 2019, Public Use Microdata Sample (PUMS), data as of 25 October 2020.
Science and Engineering Indicators
In 2019, the proportion of foreign-born workers with a bachelor’s degree or higher was greater among workers in S&E and S&E-related occupations compared to those in non-S&E occupations. However, their distribution varied by occupation and degree level (Figure LBR-32). The 2019 NSCG shows that foreign-born workers accounted for 21% of workers in S&E occupations at the bachelor’s degree level, 38% at the master’s degree level, and 45% at the doctoral degree level. Foreign-born workers accounted for 25% of computer and mathematical scientists at the bachelor’s degree level and 60% of computer and mathematical scientists with doctorates. Similarly, approximately one-half of engineers and life scientists at the doctoral degree level, and about one-third of these workers at the master’s degree level were foreign born. In comparison, foreign-born workers were less common among social and related scientists and physical and related scientists among most degree levels. In addition, data from the 2019 SDR show that among U.S.-trained S&E doctorate holders employed in the higher education sector, 33% were foreign born in 2019, with more than half of them being U.S. citizens (Table SLBR-36).
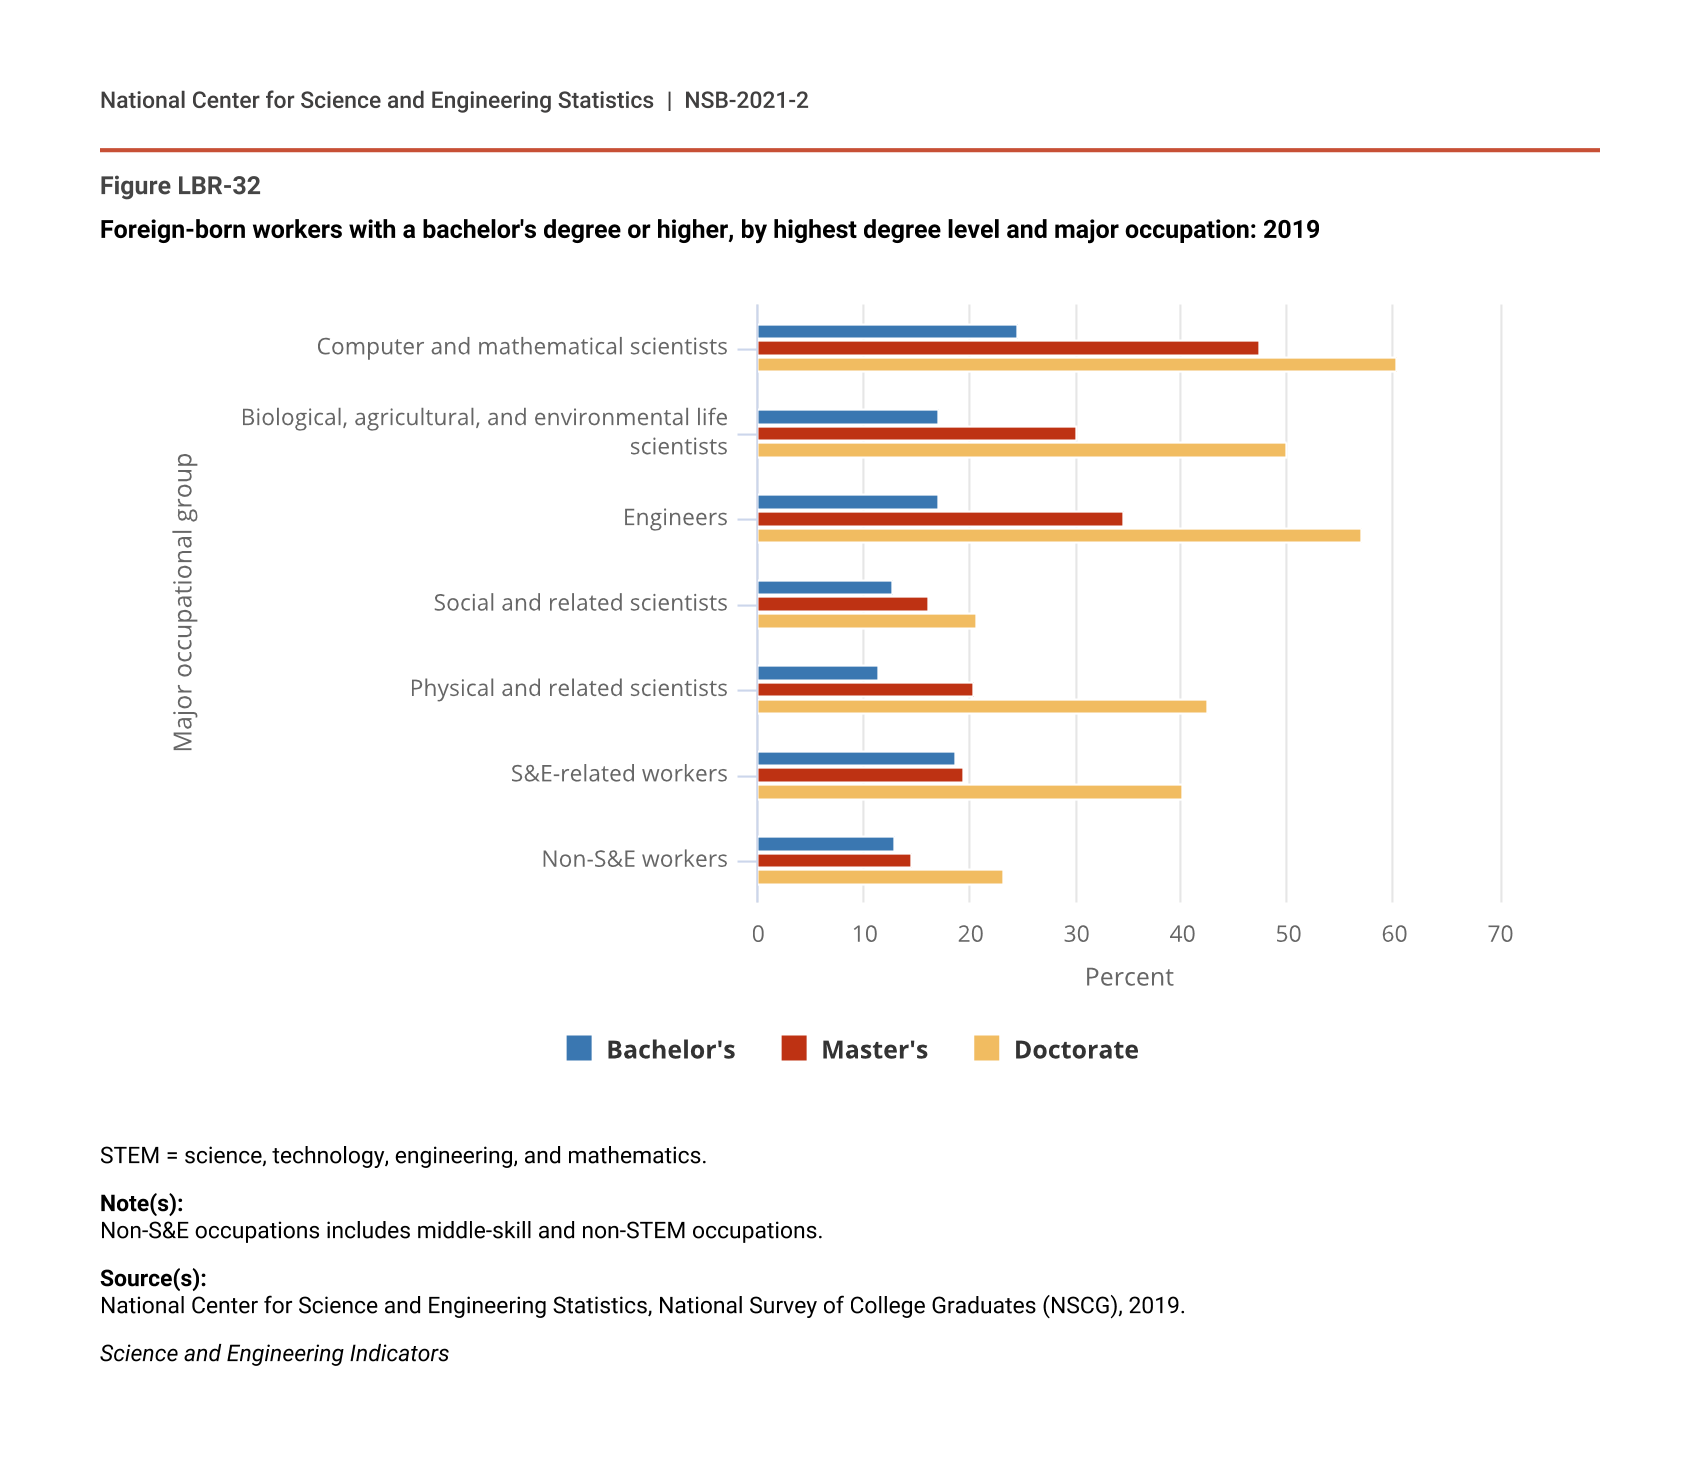
Foreign-born workers with a bachelor's degree or higher, by highest degree level and major occupation: 2019
| Major occupational group | Bachelor's | Master's | Doctorate |
|---|---|---|---|
| Computer and mathematical scientists | 24.6 | 47.3 | 60.3 |
| Biological, agricultural, and environmental life scientists | 17.1 | 30.1 | 50.0 |
| Engineers | 17.2 | 34.6 | 57.1 |
| Social and related scientists | 12.8 | 16.2 | 20.6 |
| Physical and related scientists | 11.4 | 20.5 | 42.4 |
| S&E-related workers | 18.7 | 19.4 | 40.2 |
| Non-S&E workers | 12.9 | 14.5 | 23.2 |
STEM = science, technology, engineering, and mathematics.
Note(s):
Non-S&E occupations includes middle-skill and non-STEM occupations.
Source(s):
National Center for Science and Engineering Statistics, National Survey of College Graduates (NSCG), 2019.
Science and Engineering Indicators
Among S&E highest degree holders in the United States in 2019 who are foreign born, one-half were from Asia, with India (22%) and China (11%) as the leading birthplaces (Figure LBR-33). For those with S&E doctorates, however, China provided a higher proportion (24%) than India (15%). These patterns, by source region and country, have been stable since at least 2003 (NSB 2016; NSB 2018; NSB 2019b).
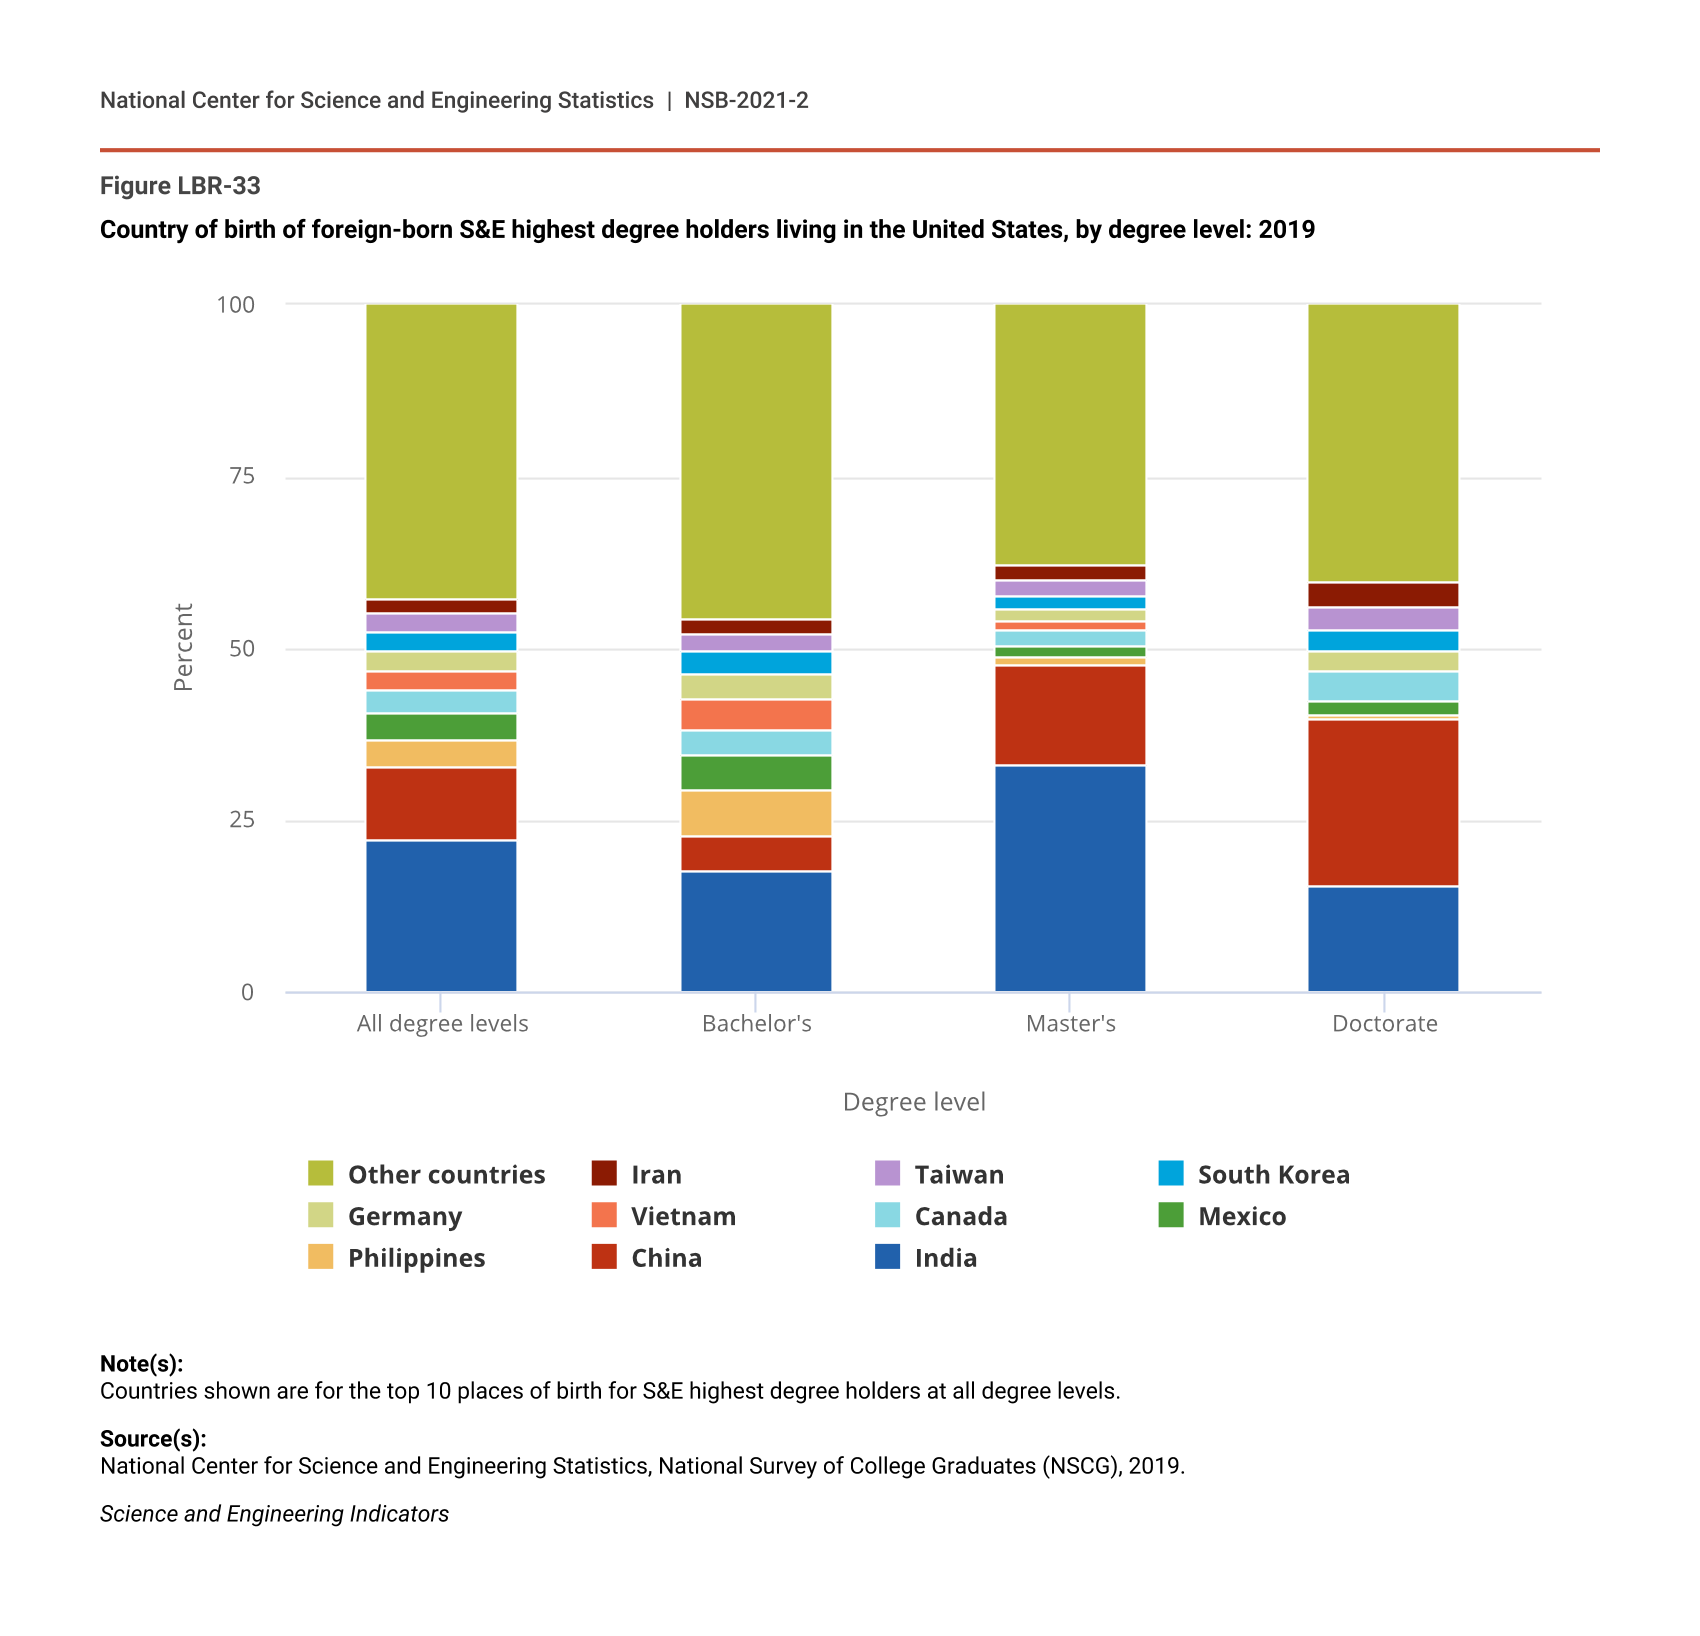
Country of birth of foreign-born S&E highest degree holders living in the United States, by degree level: 2019
Figure data not available.
Note(s):
Countries shown are for the top 10 places of birth for S&E highest degree holders at all degree levels.
Source(s):
National Center for Science and Engineering Statistics, National Survey of College Graduates (NSCG), 2019.
Science and Engineering Indicators
About 56% of foreign-born individuals with their highest degree in S&E-related fields also came from Asian countries. Among the top five places of birth, the Philippines is the leading place of birth (18%), followed by India (11%) and China (6%) (Figure LBR-34). At the doctoral degree level, China (16%), India (15%), and the Philippines (11%) are the leading birthplaces, but at the master’s degree level, India (19%) is the leading birthplace, and at the bachelor’s degree level, the Philippines is the leading birthplace.
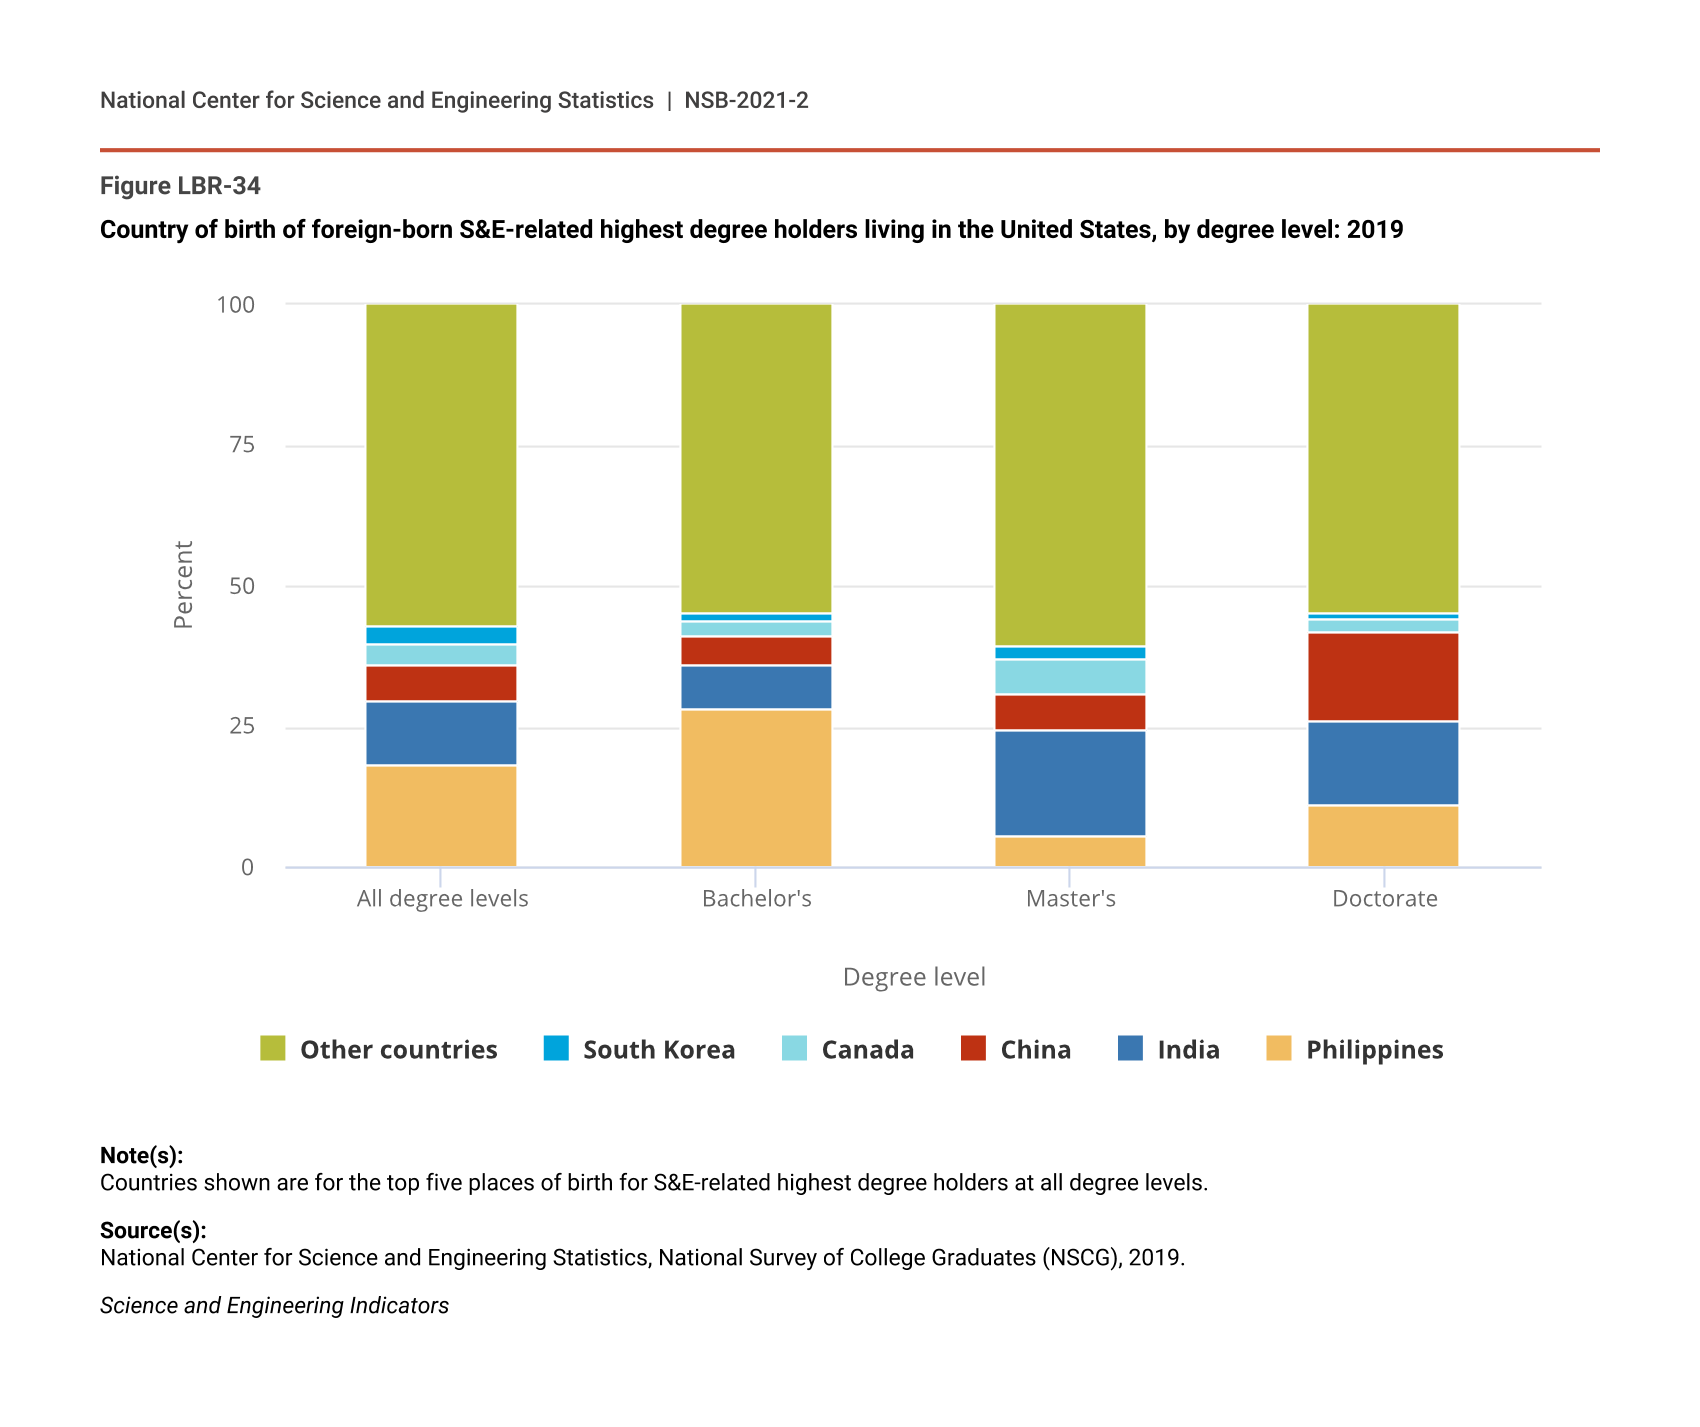
Country of birth of foreign-born S&E-related highest degree holders living in the United States, by degree level: 2019
Figure data not available.
Note(s):
Countries shown are for the top five places of birth for S&E-related highest degree holders at all degree levels.
Source(s):
National Center for Science and Engineering Statistics, National Survey of College Graduates (NSCG), 2019.
Science and Engineering Indicators
Universities and firms help shape the pool of noncitizens in the U.S. STEM workforce. Universities select international students to receive F-1 (student) and J-1 (exchange visitor) visas (see forthcoming Indicators 2022 report “Higher Education in Science and Engineering” for more details on trends in student visas), and many of these visa holders stay in the United States after graduation to work, which is discussed more in the next section. Firms select skilled noncitizens for work-based purposes primarily through the H-1B temporary visas. In 2019, the United States issued about 188,000 H-1B visas, the majority of which are in S&E or S&E-related occupations (U.S. Department of State, Bureau of Consular Affairs 2020a, 2020b; DHS/USCIS 2020a). Almost three-quarters of these new H-1B visa recipients were from India, and 13% were from China (DHS/USCIS 2020a). The composition of the H-1B visa trends has been stable for over a decade (NSB 2019b).
Stay Rates of Noncitizen U.S.-Trained S&E Doctorates
Most U.S. S&E doctorates who are noncitizens at graduation expect to remain in the United States after graduation. According to the NCSES (2020b) 2019 SED, more than three-fourths (77%) of noncitizen recipients (both temporary visa holders and permanent residents) of S&E doctorates who graduated during the 2016–19 period planned to remain in the United States in the year after graduation (Table SLBR-37). The proportion of noncitizen S&E doctorate recipients that plan to stay in the United States after graduation is more generally referred to as the expected stay rate or the 1-year stay rate. These rates have been stable over the last decade. One-half of noncitizens at graduation had definite plans to stay in the United States, either continuing employment or accepting an offer of a postdoc or other employment in the United States.
Expected stay rates vary by place of citizenship. Students from China and India, two of the largest source countries for recipients of U.S. S&E doctoral degrees on temporary visas (see forthcoming Indicators 2022 report “Higher Education in Science and Engineering” for more details on foreign-born enrollment and degree attainment at U.S. institutions), have relatively high expected stay rates (82%–88%) (Table SLBR-37). Stay rates also vary somewhat by field of degree; doctoral recipients in the social sciences (59%) have lower stay rates than those receiving doctorate degrees in other broad S&E fields of study. The expected stay rates by country and by field are consistent with the 5- and 10-year stay rates reported in the Indicators 2020 “Science and Engineering Labor Force” report.
Many S&E doctorate recipients on temporary visas at graduation who remain in the United States for subsequent employment become U.S. citizens or permanent residents (Okrent and Burke 2021). Based on the 2017 SDR and the 2006–15 SED, approximately 31% of the 2006–15 graduating cohort of S&E doctorate recipients that were in the United States in 2017 were temporary visa holders at the time of graduation. In 2017, more than two-thirds of these temporary visa holders had become U.S. citizens or permanent residents.
The 2019 SDR and the 2008–17 SED show that among U.S. S&E doctorate recipients on temporary visas at graduation (2008–17) and in the United States in 2019, the vast majority were working (between 95% and 98% across degree fields) in 2019. Across all fields, 64% worked in the same field as their doctoral degree. At the one extreme, 87% of temporary visa holders at graduation with a doctorate in mathematics and computer sciences were working as computer and mathematical scientists (Figure LBR-35). At the other extreme, 47% of temporary visa holders at graduation with a doctorate in the physical sciences worked as physical scientists, but 40% worked in other S&E occupations.
Employment of U.S. S&E doctorate recipients on temporary visas at graduation, by degree field at graduation (2008–17) and occupation (2019)
| Degree field | Working in S&E occupation that is in their major degree field | Working in S&E occupation that is not in their major degree field | Working in S&E-related occupation | Working in non-S&E occupation | Not working |
|---|---|---|---|---|---|
| Computer and mathematical sciences | 86.7 | 4.3 | 2.2 | 4.9 | 1.9 |
| Biological, agricultural, and health and environmental life sciences | 60.5 | 13.2 | 15.2 | 6.8 | 4.3 |
| Physical sciences | 47.2 | 40.3 | 4.8 | 3.9 | 3.7 |
| Social scientists | 63.4 | 12.3 | 1.5 | 18.5 | 4.3 |
| Engineering | 60.4 | 26.9 | 5.1 | 4.2 | 3.3 |
Note(s):
Percentages are based on the number of doctorate recipients who reported citizenship status at the time of graduation in the Survey of Earned Doctorates (SED).
Source(s):
National Center for Science and Engineering Statistics, Survey of Doctorate Recipients (SDR), 2019, and SED, 2008–17.
Science and Engineering Indicators
Of the remaining fields, most U.S. S&E doctorate recipients on temporary visas at graduation (2008–17) worked in an S&E or S&E-related occupation in 2019 (Figure LBR-35). Some 87% of engineering doctorates on temporary visas at graduation worked as engineers or in other S&E occupations. A relatively large proportion of doctorates in biological, agricultural, and health and environmental life sciences on temporary visas at graduation worked in S&E-related occupations (15%), which includes health-related occupations. Compared to other fields, social sciences doctorate holders worked proportionately the most in non-S&E occupations (19%).
Although there are differences in the work activities of S&E doctorate recipients who were on temporary visas compared to U.S. citizens and permanent residents at the time of graduation, both tend to engage primarily in R&D and design or teaching (Figure LBR-36). In 2019, about 63% of U.S. S&E doctorate recipients on temporary visas at graduation engaged primarily in R&D and design of equipment, processes, structures, and models, whereas 43% of U.S. citizens or permanent residents worked mostly in these activities. U.S. citizens and permanent residents comprised a larger proportion of doctorate recipients engaged in teaching at 21% compared to 10% of temporary visa holders. This is related to temporary visa holders being employed at higher proportions in nonacademic occupations compared to U.S. citizens and permanent residents (Okrent and Burke 2021). Temporary visa holders at graduation also worked more than U.S. citizens and permanent residents in computer application activities (12% vs. 4%), whereas U.S. citizens and permanent residents engaged more in management and administrative activities (17% vs. 9%).
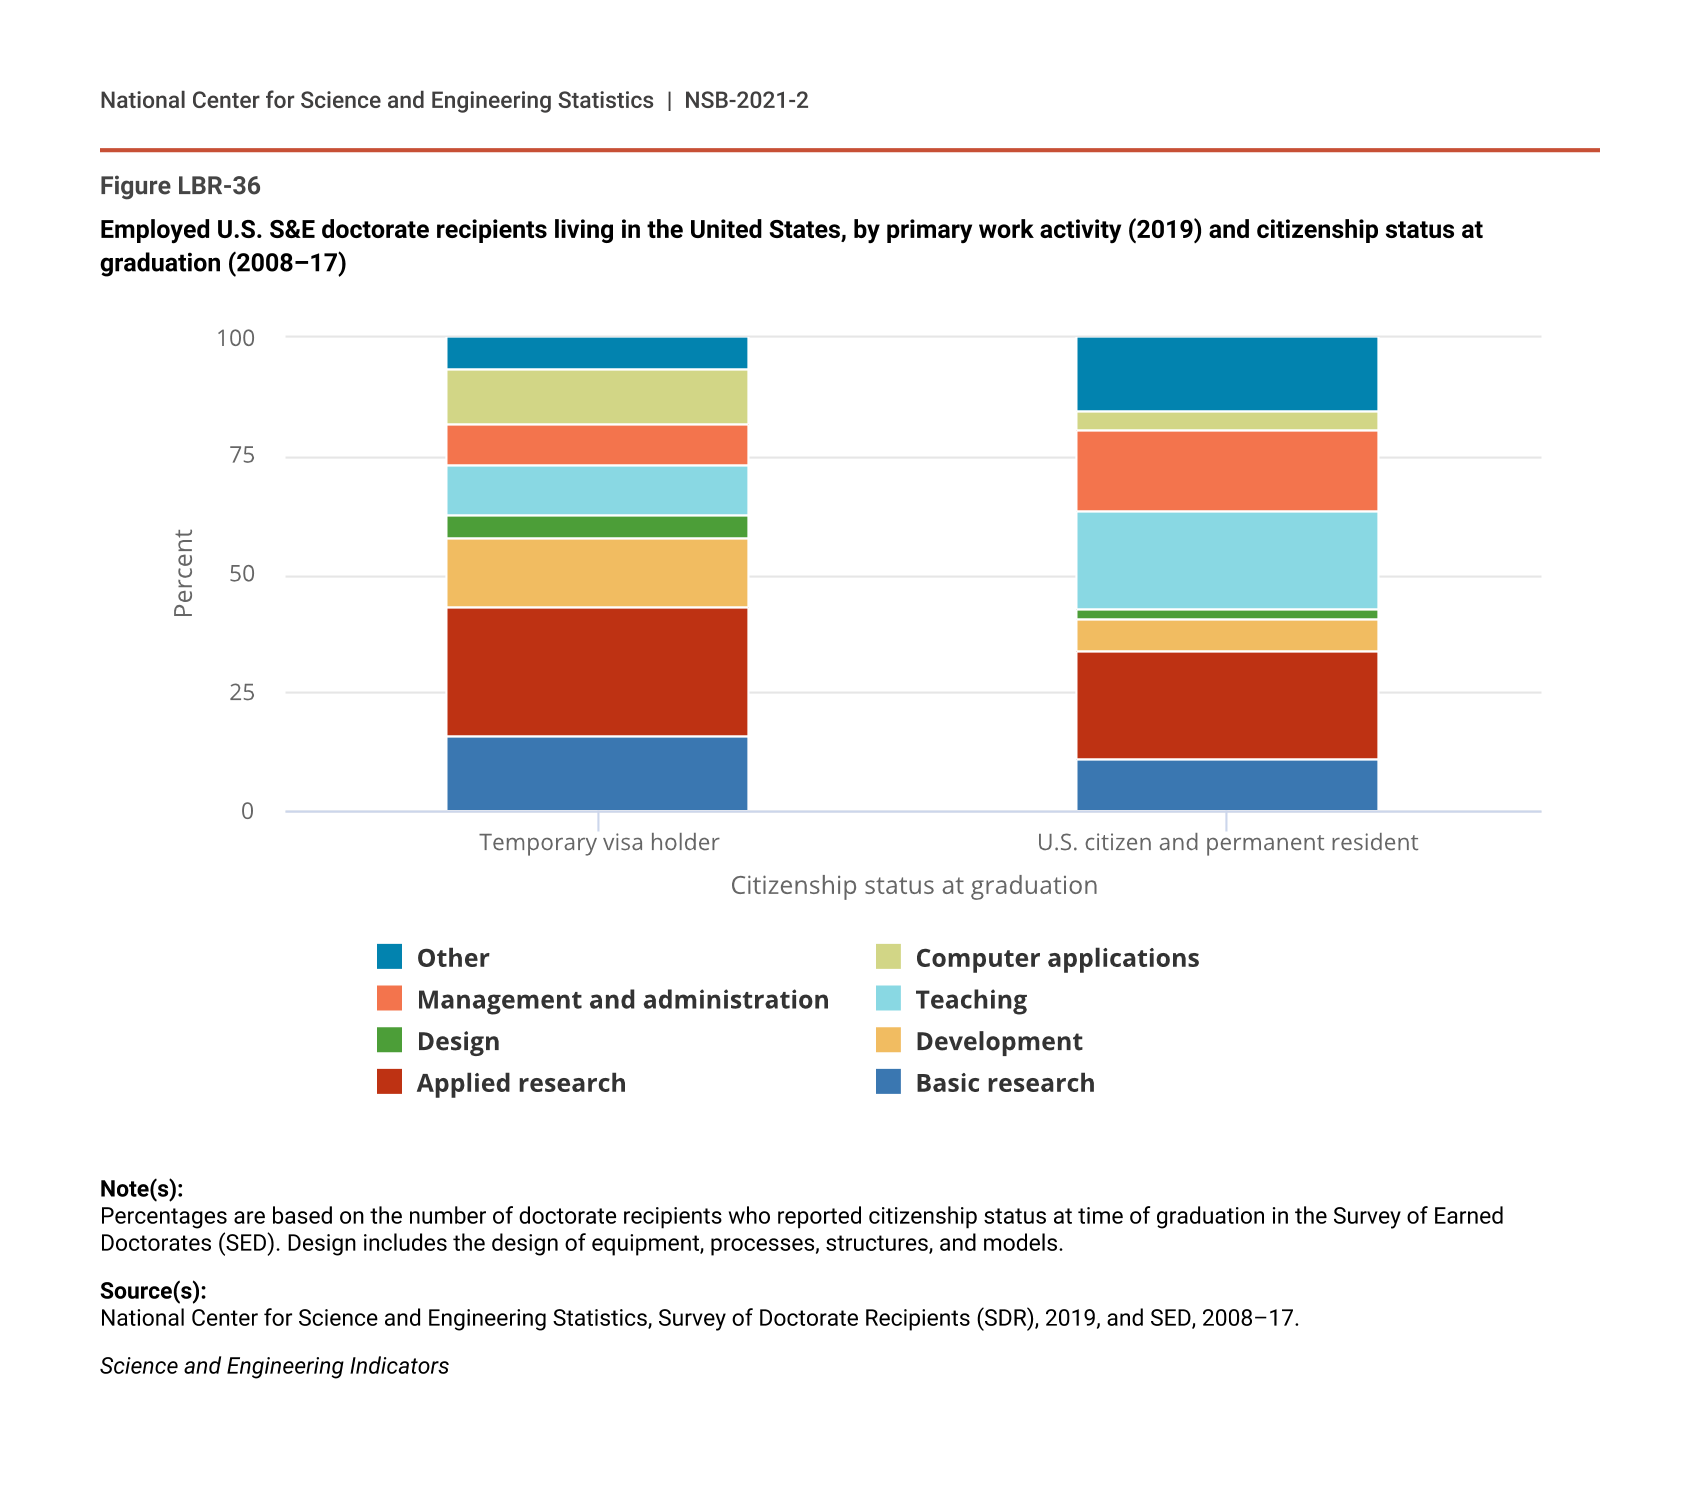
Employed U.S. S&E doctorate recipients living in the United States, by primary work activity (2019) and citizenship status at graduation (2008–17)
| Citizenship status at graduation | Basic research | Applied research | Development | Design | Teaching | Management and administration | Computer applications | Other |
|---|---|---|---|---|---|---|---|---|
| Temporary visa holder | 15.75 | 27.31 | 14.82 | 4.87 | 10.49 | 8.65 | 11.52 | 6.59 |
| U.S. citizen and permanent resident | 11.0 | 23.0 | 6.4 | 2.2 | 20.8 | 17.0 | 4.3 | 15.3 |
Note(s):
Percentages are based on the number of doctorate recipients who reported citizenship status at time of graduation in the Survey of Earned Doctorates (SED). Design includes the design of equipment, processes, structures, and models.
Source(s):
National Center for Science and Engineering Statistics, Survey of Doctorate Recipients (SDR), 2019, and SED, 2008–17.
Science and Engineering Indicators