 An official website of the United States government
 Education, Training, and Academic R&D
Undergraduate and graduate students and postdoctoral researchers (postdocs) are vital to the academic R&D enterprise and constitute a significant portion of the individuals funded by research grants at many institutions (IRIS 2021). Education and training often go hand-in-hand with R&D performance at colleges and universities, and investments made by the federal government, academic institutions, and other funders in the education and training of S&E students and postdocs relate closely to their investments in academic R&D. For example, around 70% of full-time S&E graduate students primarily funded by the federal government in 2019 received research assistantships (RAs), which come from research grants. More than 80% of federally funded postdocs were paid through research grants. Additionally, the majority of S&E graduate students and postdocs are affiliated with the same universities that perform most of the nation’s academic R&D (NCSES GSS 2019: Table 5-3).
Salaries, wages, and fringe benefits make up the largest component of academic R&D direct costs, and this section of the report adds detail to this component. The available data focus on financial support for graduate students and postdocs. Additional aspects of graduate study, including degrees by field and debt, are available in the forthcoming Indicators 2022 report "Higher Education in Science and Engineering." Likewise, other aspects of the postdoctoral labor force, including salaries and demographics, can be found in the Indicators 2022 report “The STEM Labor Force of Today: Scientists, Engineers, and Skilled Technical Workers.” Comprehensive data on sources of support for undergraduates participating in research are not available. For information on how the COVID-19 pandemic affected academic R&D, see sidebar COVID-19 and Academic R&D.
Financial Support for S&E Graduate Students and Postdocs
Graduate Students
Graduate students’ sources of financial support depended on their level of study. Master’s students were largely self-supporting, whereas only a small minority of doctoral students self-financed. In 2019, around two-thirds of S&E master’s students paid for their graduate program using personal sources (NCSES GSS 2019: Table 3-1); by contrast, less than 10% of doctoral students did so. These differences generally held across all S&E fields.
Other main sources of support for graduate students included academic institutions (where a student is enrolled) and the federal government. Academic institutions were the primary source of support for 24% of master’s students and 59% of doctoral students. Institutional support includes tuition waivers and stipends. The federal government was the primary source of support for 5% of master’s students and a quarter of doctoral students. Federal support includes financial support provided by federal agencies but excludes federally guaranteed student loans.
Financial support for graduate students may be delivered through various mechanisms, including RAs, teaching assistantships (TAs), and fellowships. TAs and fellowships are mainly institutionally funded, whereas nearly half of RAs are funded through federal academic research grants.
Most doctoral students are supported by multiple sources or mechanisms during graduate school, even in a single academic year. Patterns of support varied by field (Figure URD-20; NCSES GSS 2019: Table 3-5) and the type of institution attended. For example, full-time S&E graduate students from the Carnegie very high research doctoral universities were less likely to self-support than those who attended other types of institutions. Even among this group of institutions, however, public and private universities used funding mechanisms differently.
Full-time S&E doctoral students, by field and mechanism of primary support: 2019
| Field | Research assistantship | Teaching assistantship | Fellowship | Traineeship | Other | Self-support |
|---|---|---|---|---|---|---|
| All S&E | 38.3 | 26.2 | 15.4 | 4.1 | 7.0 | 9.1 |
| Agricultural sciences | 62.7 | 14.9 | 8.0 | 0.8 | 4.7 | 8.9 |
| Biological and biomedical sciences | 42.2 | 14.9 | 19.3 | 11.7 | 7.6 | 4.2 |
| Computer sciences | 44.1 | 26.4 | 11.7 | 1.5 | 5.7 | 10.6 |
| Earth and physical sciences | 41.1 | 36.1 | 13.1 | 1.6 | 4.1 | 4.0 |
| Engineering | 53.2 | 16.4 | 13.6 | 1.6 | 7.3 | 7.9 |
| Mathematics and statistics | 13.8 | 61.3 | 13.3 | 1.5 | 4.0 | 6.2 |
| Psychology | 22.3 | 31.3 | 11.5 | 3.9 | 8.8 | 22.2 |
| Social sciences | 14.4 | 40.4 | 23.2 | 2.1 | 7.1 | 12.8 |
Note(s):
Self-support includes any loans (including federal) and support from personal or family financial contributions. Total for All S&E includes health fields. Earth and physical sciences includes physical sciences plus geosciences, atmospheric sciences, and ocean sciences.
Source(s):
National Center for Science and Engineering Statistics, Survey of Graduate Students and Postdoctorates in Science and Engineering (GSS).
Science and Engineering Indicators
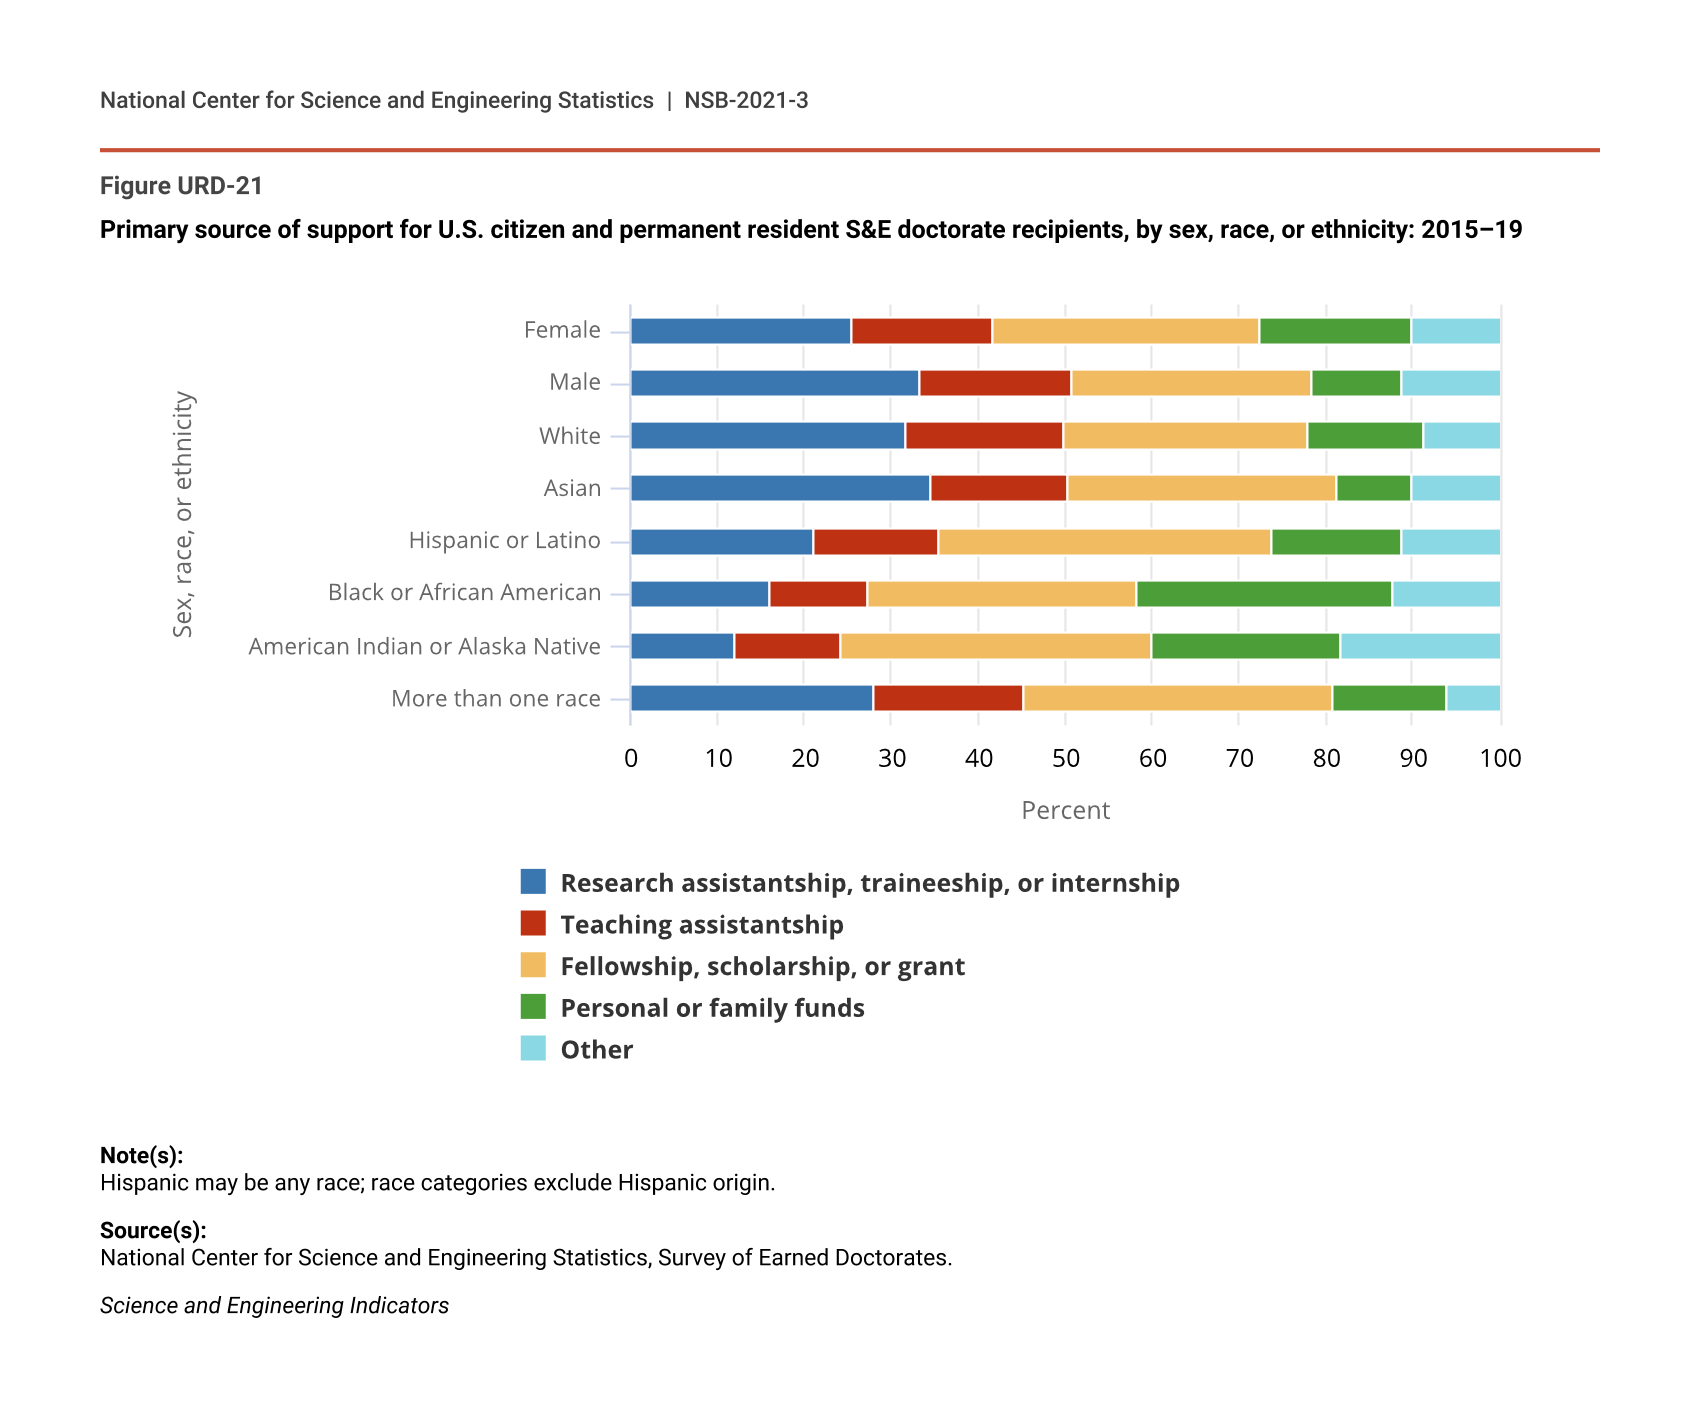
Funding mechanisms also vary by demographic groups (Figure URD-21; NCSES SED 2019: Table 35). Overall, among U.S. citizens and permanent residents who earned S&E doctorates between 2015 and 2019, men (33%) were more likely to be supported by RAs than women (25%), whereas women (17%) were more likely to self-support than men (11%). Women (16%) and men (17%) were around equally likely to be supported by TAs. Asians (35%) and Whites (32%) were more likely to have primary RA, traineeship, or internship support than doctoral recipients from underrepresented minority groups. Twenty-one percent of Hispanics or Latinos, 16% of Blacks or African Americans, and 12% of American Indians or Alaska Natives who earned S&E doctorates between 2015 and 2019 had RAs, traineeships, or internships as their primary source of financial support (NCSES WMPD 2021: Table 7-23.) Additionally, Blacks or African Americans (30%) and American Indians or Alaska Natives (22%) were more likely to self-support than other groups.
Primary source of support for U.S. citizen and permanent resident S&E doctorate recipients, by sex, race, or ethnicity: 2015–19
| Sex, race, or ethnicity | Research assistantship, traineeship, or internship | Teaching assistantship | Fellowship, scholarship, or grant | Personal or family funds | Other |
|---|---|---|---|---|---|
| Female | 25.44 | 16.34 | 30.66 | 17.43 | 10.13 |
| Male | 33.45 | 17.42 | 27.43 | 10.50 | 11.20 |
| White | 31.75 | 18.20 | 27.90 | 13.49 | 8.65 |
| Asian | 34.49 | 15.78 | 31.06 | 8.56 | 10.11 |
| Hispanic or Latino | 21.18 | 14.32 | 38.25 | 15.09 | 11.15 |
| Black or African American | 16.0 | 11.4 | 31.0 | 29.6 | 12.2 |
| American Indian or Alaska Native | 12.0 | 12.3 | 35.7 | 21.8 | 18.3 |
| More than one race | 28.1 | 17.2 | 35.6 | 13.2 | 5.9 |
Note(s):
Hispanic may be any race; race categories exclude Hispanic origin.
Source(s):
National Center for Science and Engineering Statistics, Survey of Earned Doctorates.
Science and Engineering Indicators
Doctorate recipients who are temporary visa holders exhibit different patterns of support than U.S. citizens and permanent residents. Overall, including non-S&E fields, temporary visa holders are more likely to hold RAs or traineeships, less likely to hold fellowships or use their own resources, and around equally likely to be supported by a TA. However, the patterns vary between broad fields of study (NCSES SED 2019: Table 35).
To some extent, demographic differences in support mechanisms related to differences between groups in fields studied and institutions attended. However, certain patterns held across fields. For example, Black doctorate recipients were more likely than those from other groups to use personal sources of funding in almost every S&E field for which data were available (NCSES WMPD 2021: Table 7-23).
Postdocs
Almost all U.S. academic postdoctoral appointments were concentrated at Carnegie very high research doctoral universities (83%), high research doctoral universities (5%), and medical schools and centers (10%) (NCSES GSS 2019: Table 5-3). Just over half of postdocs (53%) were at public institutions (NCSES GSS 2019: Table 5-1). Postdoctoral appointments were concentrated in the biological and biomedical sciences and health sciences (62% in 2019: NCSES GSS 2019: Table 3-2). Earth and physical sciences (13%) and engineering (12%) constituted most of the remainder.
In 2019, the federal government funded around half of all postdocs, down from around 60% in 2009 (NCSES GSS 2009: Table 70). The federal government funded 40% of postdocs or more in all fields except mathematics and statistics (30%) and social sciences (22%). In 2019, institutions funded around a quarter of all postdocs and roughly this amount in most fields save mathematics and statistics (50%) and social sciences (44%). Other domestic sources funded 15% of postdocs, and foreign sources around 2%.
Most postdocs (60%), including 81% of those funded by the federal government, were funded through research grants. Postdocs were also funded through fellowships (11%), traineeships (5%), and other mechanisms of support (23%) (NCSES GSS 2019: Table 3-6).
Federal Support for S&E Graduate Students and Postdocs
Federal support for S&E graduate students and postdocs reflects a continuation of the historic partnership between the federal government and the nation’s research universities to integrate the performance of basic scientific research and the education and training of the next generation of scientists and engineers (National Research Council 2012). It is an indicator of the strength of the university–government partnership.
The proportion of individuals in different roles (e.g., students, postdocs, faculty, staff) supported varies by agency. For example, in 2019, NIH supported roughly equal numbers of graduate students (21,000) and postdocs (19,500), whereas NSF supported far more graduate students (21,800) than postdocs (3,600).
Graduate Students
The federal government supported 15% of full-time S&E graduate students (around 74,000) in 2019 (NCSES GSS 2019: Table 1-6), down from nearly 21% (84,000) in 2004. This overall figure masks differences in federal support for master’s students (about 11,500, or 5%) and doctoral students (about 62,000, or 25%). Put another way, in 2019, 84% of S&E graduate students supported by the federal government were doctoral students (NCSES GSS 2019: Table 3-1). This pattern is true for all S&E fields with the federal government supporting a higher percentage of doctoral students than master’s students (NCSES GSS 2019: Table 3-1).
The largest numbers of federally supported graduate students were in engineering (24,000), biological and biomedical sciences (18,500), and earth and physical sciences (13,000). Together, these fields contained around half of total graduate students but three-quarters of federally supported students (NCSES GSS 2019: Table 3-1).
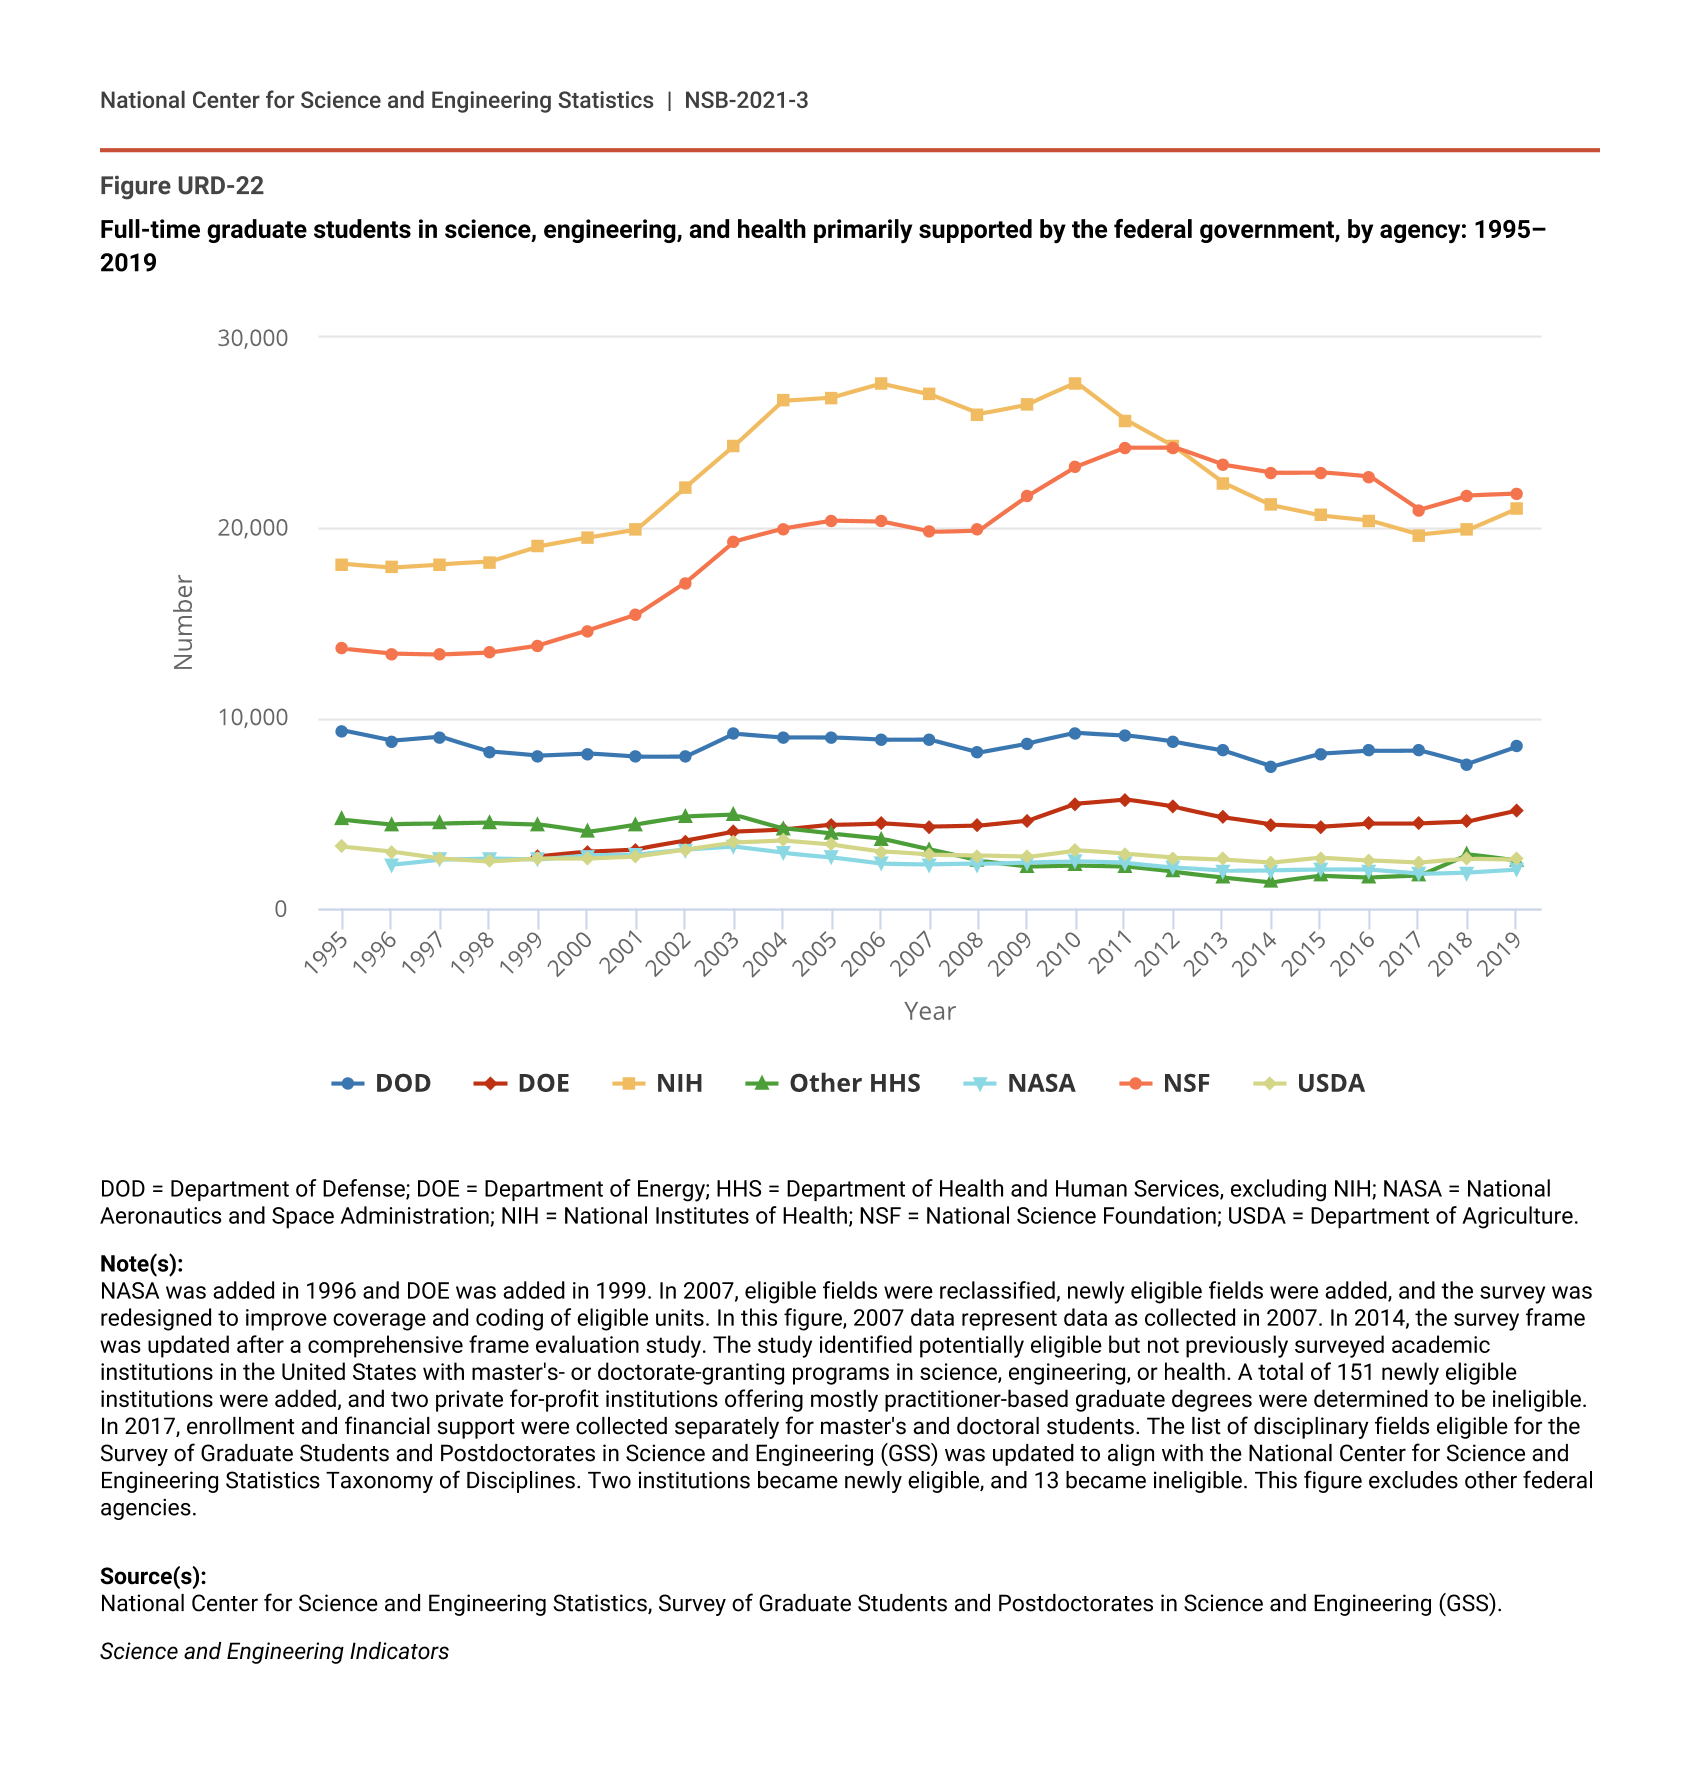
NSF (22,000) and NIH (21,000) supported the most graduate students in 2019. Together, these two agencies supported nearly 60% of federally supported graduate students (NCSES GSS 2019: Table 1-7). Other agencies supporting substantial numbers of S&E graduate students in 2019 were DOD (8,500), DOE (5,100), and USDA (2,600); additional agencies were HHS (excluding NIH, 2,500) and NASA (2,100) (see Figure URD-22).
Full-time graduate students in science, engineering, and health primarily supported by the federal government, by agency: 1995–2019
| Year | DOD | DOE | NIH | Other HHS | NASA | NSF | USDA |
|---|---|---|---|---|---|---|---|
| 1995 | 9,339 | NA | 18,109 | 4,666 | NA | 13,661 | 3,254 |
| 1996 | 8,802 | NA | 17,929 | 4,432 | 2,309 | 13,412 | 3,004 |
| 1997 | 9,021 | NA | 18,087 | 4,443 | 2,586 | 13,362 | 2,646 |
| 1998 | 8,259 | NA | 18,215 | 4,489 | 2,646 | 13,459 | 2,485 |
| 1999 | 8,026 | 2,749 | 19,019 | 4,423 | 2,579 | 13,835 | 2,634 |
| 2000 | 8,141 | 2,995 | 19,472 | 4,018 | 2,780 | 14,599 | 2,630 |
| 2001 | 7,960 | 3,116 | 19,904 | 4,433 | 2,819 | 15,429 | 2,735 |
| 2002 | 7,977 | 3,548 | 22,129 | 4,830 | 3,082 | 17,135 | 3,100 |
| 2003 | 9,204 | 4,024 | 24,309 | 4,922 | 3,230 | 19,308 | 3,468 |
| 2004 | 9,007 | 4,135 | 26,689 | 4,211 | 2,916 | 19,975 | 3,563 |
| 2005 | 8,993 | 4,392 | 26,868 | 3,912 | 2,691 | 20,387 | 3,351 |
| 2006 | 8,867 | 4,480 | 27,587 | 3,662 | 2,364 | 20,339 | 3,000 |
| 2007 | 8,885 | 4,284 | 27,015 | 3,086 | 2,317 | 19,792 | 2,810 |
| 2008 | 8,219 | 4,341 | 26,003 | 2,496 | 2,344 | 19,882 | 2,770 |
| 2009 | 8,683 | 4,608 | 26,506 | 2,200 | 2,426 | 21,682 | 2,706 |
| 2010 | 9,233 | 5,512 | 27,615 | 2,255 | 2,472 | 23,226 | 3,061 |
| 2011 | 9,107 | 5,738 | 25,670 | 2,201 | 2,394 | 24,226 | 2,862 |
| 2012 | 8,748 | 5,343 | 24,256 | 1,921 | 2,173 | 24,243 | 2,664 |
| 2013 | 8,304 | 4,803 | 22,372 | 1,642 | 2,006 | 23,307 | 2,577 |
| 2014 | 7,454 | 4,401 | 21,191 | 1,382 | 2,013 | 22,899 | 2,420 |
| 2015 | 8,127 | 4,309 | 20,641 | 1,715 | 2,036 | 22,924 | 2,676 |
| 2016 | 8,291 | 4,482 | 20,381 | 1,635 | 2,025 | 22,677 | 2,535 |
| 2017 | 8,323 | 4,480 | 19,645 | 1,719 | 1,818 | 20,946 | 2,415 |
| 2018 | 7,600 | 4,568 | 19,903 | 2,842 | 1,899 | 21,711 | 2,619 |
| 2019 | 8,495 | 5,119 | 21,025 | 2,498 | 2,057 | 21,801 | 2,580 |
DOD = Department of Defense; DOE = Department of Energy; HHS = Department of Health and Human Services, excluding NIH; NASA = National Aeronautics and Space Administration; NIH = National Institutes of Health; NSF = National Science Foundation; USDA = Department of Agriculture.
Note(s):
NASA was added in 1996 and DOE was added in 1999. In 2007, eligible fields were reclassified, newly eligible fields were added, and the survey was redesigned to improve coverage and coding of eligible units. In this figure, 2007 data represent data as collected in 2007. In 2014, the survey frame was updated after a comprehensive frame evaluation study. The study identified potentially eligible but not previously surveyed academic institutions in the United States with master's- or doctorate-granting programs in science, engineering, or health. A total of 151 newly eligible institutions were added, and two private for-profit institutions offering mostly practitioner-based graduate degrees were determined to be ineligible. In 2017, enrollment and financial support were collected separately for master's and doctoral students. The list of disciplinary fields eligible for the Survey of Graduate Students and Postdoctorates in Science and Engineering (GSS) was updated to align with the National Center for Science and Engineering Statistics Taxonomy of Disciplines. Two institutions became newly eligible, and 13 became ineligible. This figure excludes other federal agencies.
Source(s):
National Center for Science and Engineering Statistics, Survey of Graduate Students and Postdoctorates in Science and Engineering (GSS).
Science and Engineering Indicators
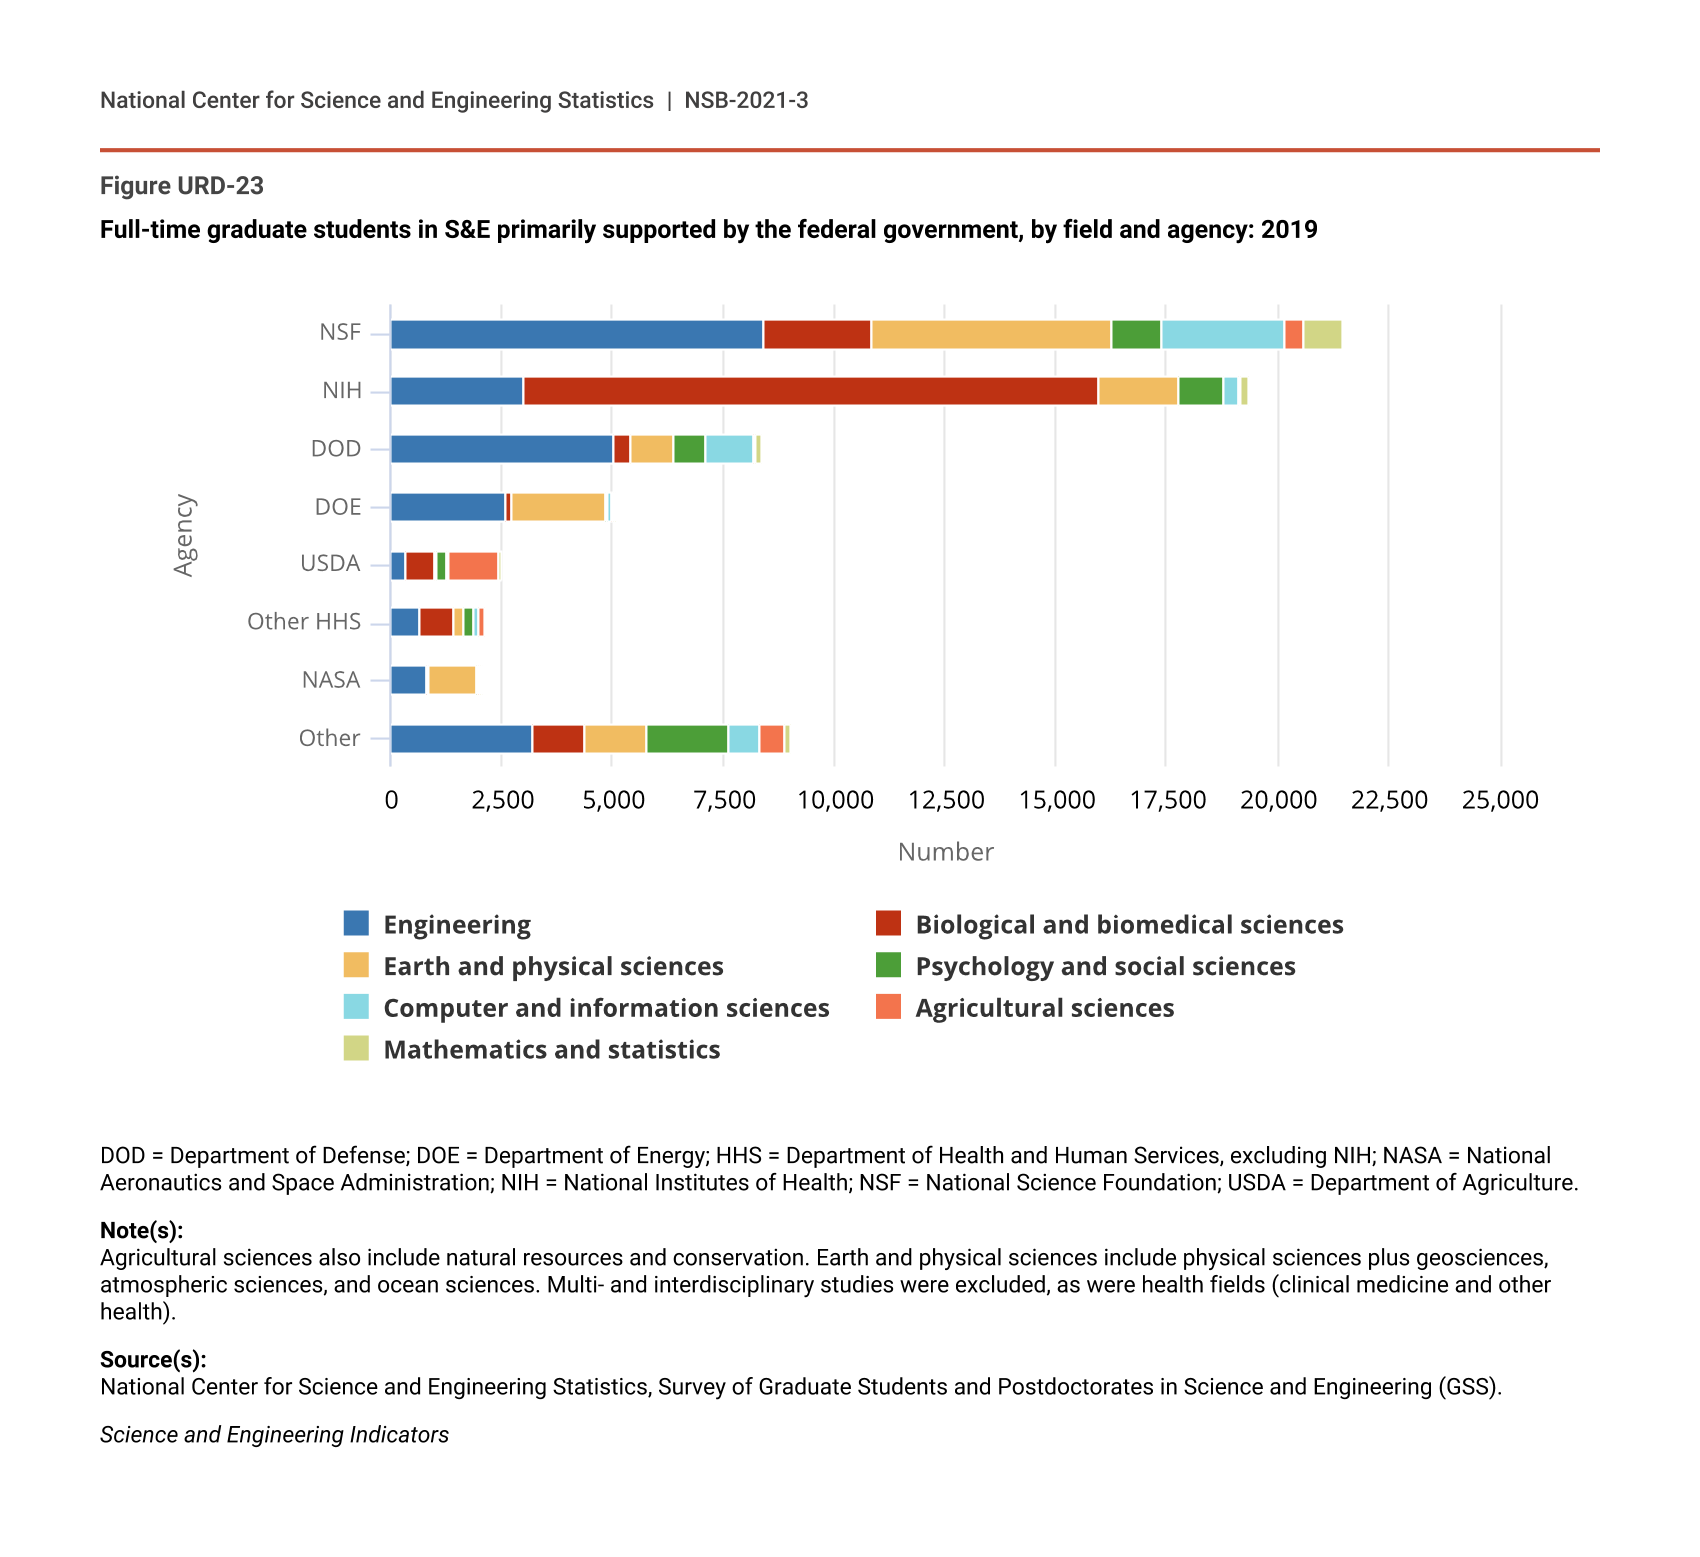
In their support patterns across fields, agencies took on portfolios consistent with their missions (Figure URD-23, NCSES GSS 2019: Table 3-3). NSF supported substantial numbers of students across a range of fields, whereas over 60% of those supported by NIH were in biological and biomedical sciences. Sixty percent of the students funded by DOD studied engineering, and more than 90% funded by DOE were in earth and physical sciences and engineering.
Full-time graduate students in S&E primarily supported by the federal government, by field and agency: 2019
| Agency | Engineering | Biological and biomedical sciences | Earth and physical sciences | Psychology and social sciences | Computer and information sciences | Agricultural sciences | Mathematics and statistics |
|---|---|---|---|---|---|---|---|
| NSF | 8,401 | 2,441 | 5,401 | 1,138 | 2,776 | 425 | 882 |
| NIH | 3,000 | 12,999 | 1,785 | 1,032 | 308 | 68 | 182 |
| DOD | 5,030 | 359 | 996 | 695 | 1,097 | 40 | 151 |
| DOE | 2,581 | 136 | 2,129 | 24 | 111 | 68 | 40 |
| USDA | 339 | 633 | 57 | 247 | 32 | 1,140 | 21 |
| Other HHS | 655 | 737 | 242 | 249 | 77 | 146 | 29 |
| NASA | 804 | 59 | 1,051 | 41 | 35 | 39 | 19 |
| Other | 3,202 | 1,189 | 1,373 | 1,858 | 688 | 569 | 139 |
DOD = Department of Defense; DOE = Department of Energy; HHS = Department of Health and Human Services, excluding NIH; NASA = National Aeronautics and Space Administration; NIH = National Institutes of Health; NSF = National Science Foundation; USDA = Department of Agriculture.
Note(s):
Agricultural sciences also include natural resources and conservation. Earth and physical sciences include physical sciences plus geosciences, atmospheric sciences, and ocean sciences. Multi- and interdisciplinary studies were excluded, as were health fields (clinical medicine and other health).
Source(s):
National Center for Science and Engineering Statistics, Survey of Graduate Students and Postdoctorates in Science and Engineering (GSS).
Science and Engineering Indicators
RAs were the primary mechanism the federal government used to fund graduate students. Among full-time S&E graduate students primarily funded by the federal government in 2019, 71% received RAs, followed by fellowships (12%) and traineeships (8%).
Postdocs
The federal government supported half (49%, around 32,500) of S&E postdocs in 2019 (NCSES GSS 2019: Table 3-2). The largest numbers of federally supported postdocs were in biological and biomedical sciences (12,000), clinical medicine (7,500), and earth and physical sciences (5,000). These fields contained around three-quarters of total postdocs and around the same proportion of those funded by the federal government (NCSES GSS 2019: Table 3-2).
NIH supported the most postdocs in 2019: around 19,500 (60% of total federally supported postdocs) (NCSES GSS 2019: Table 3-4). Other agencies supporting postdocs included NSF (3,600), DOD (2,400), and DOE (2,000). In total, these four agencies account for 85% of federally supported postdocs.
As with their support of graduate students, agencies funded postdocs across fields in a manner consistent with their missions (NCSES GSS 2019: Table 3-4). NSF supported postdocs across a range of fields. Eighty percent of postdocs supported by NIH were in biological and biomedical sciences or clinical medicine. DOD funded postdocs primarily in engineering (40%) and earth and physical sciences (19%), as did DOE (32% in engineering, and 53% in earth and physical sciences).
RAs continue to be the primary mechanism the federal government uses to fund postdocs. Among postdocs primarily funded by the federal government in 2019, 81% received RAs, followed by fellowships and traineeships (8% each), with the remainder funded by other mechanisms.
Institutional Support for S&E Graduate Students and Postdocs
Graduate Students
In 2019, institutions supported 41% of full-time S&E graduate students (around 206,000), more than any other source including self-support (NCSES GSS 2019: Table 3-1); this is a long-standing trend. Institutions supported nearly a quarter of master’s students (60,000) and nearly 60% of doctoral students (146,000). Put another way, around 70% of S&E graduate students supported by institutions were doctoral students.
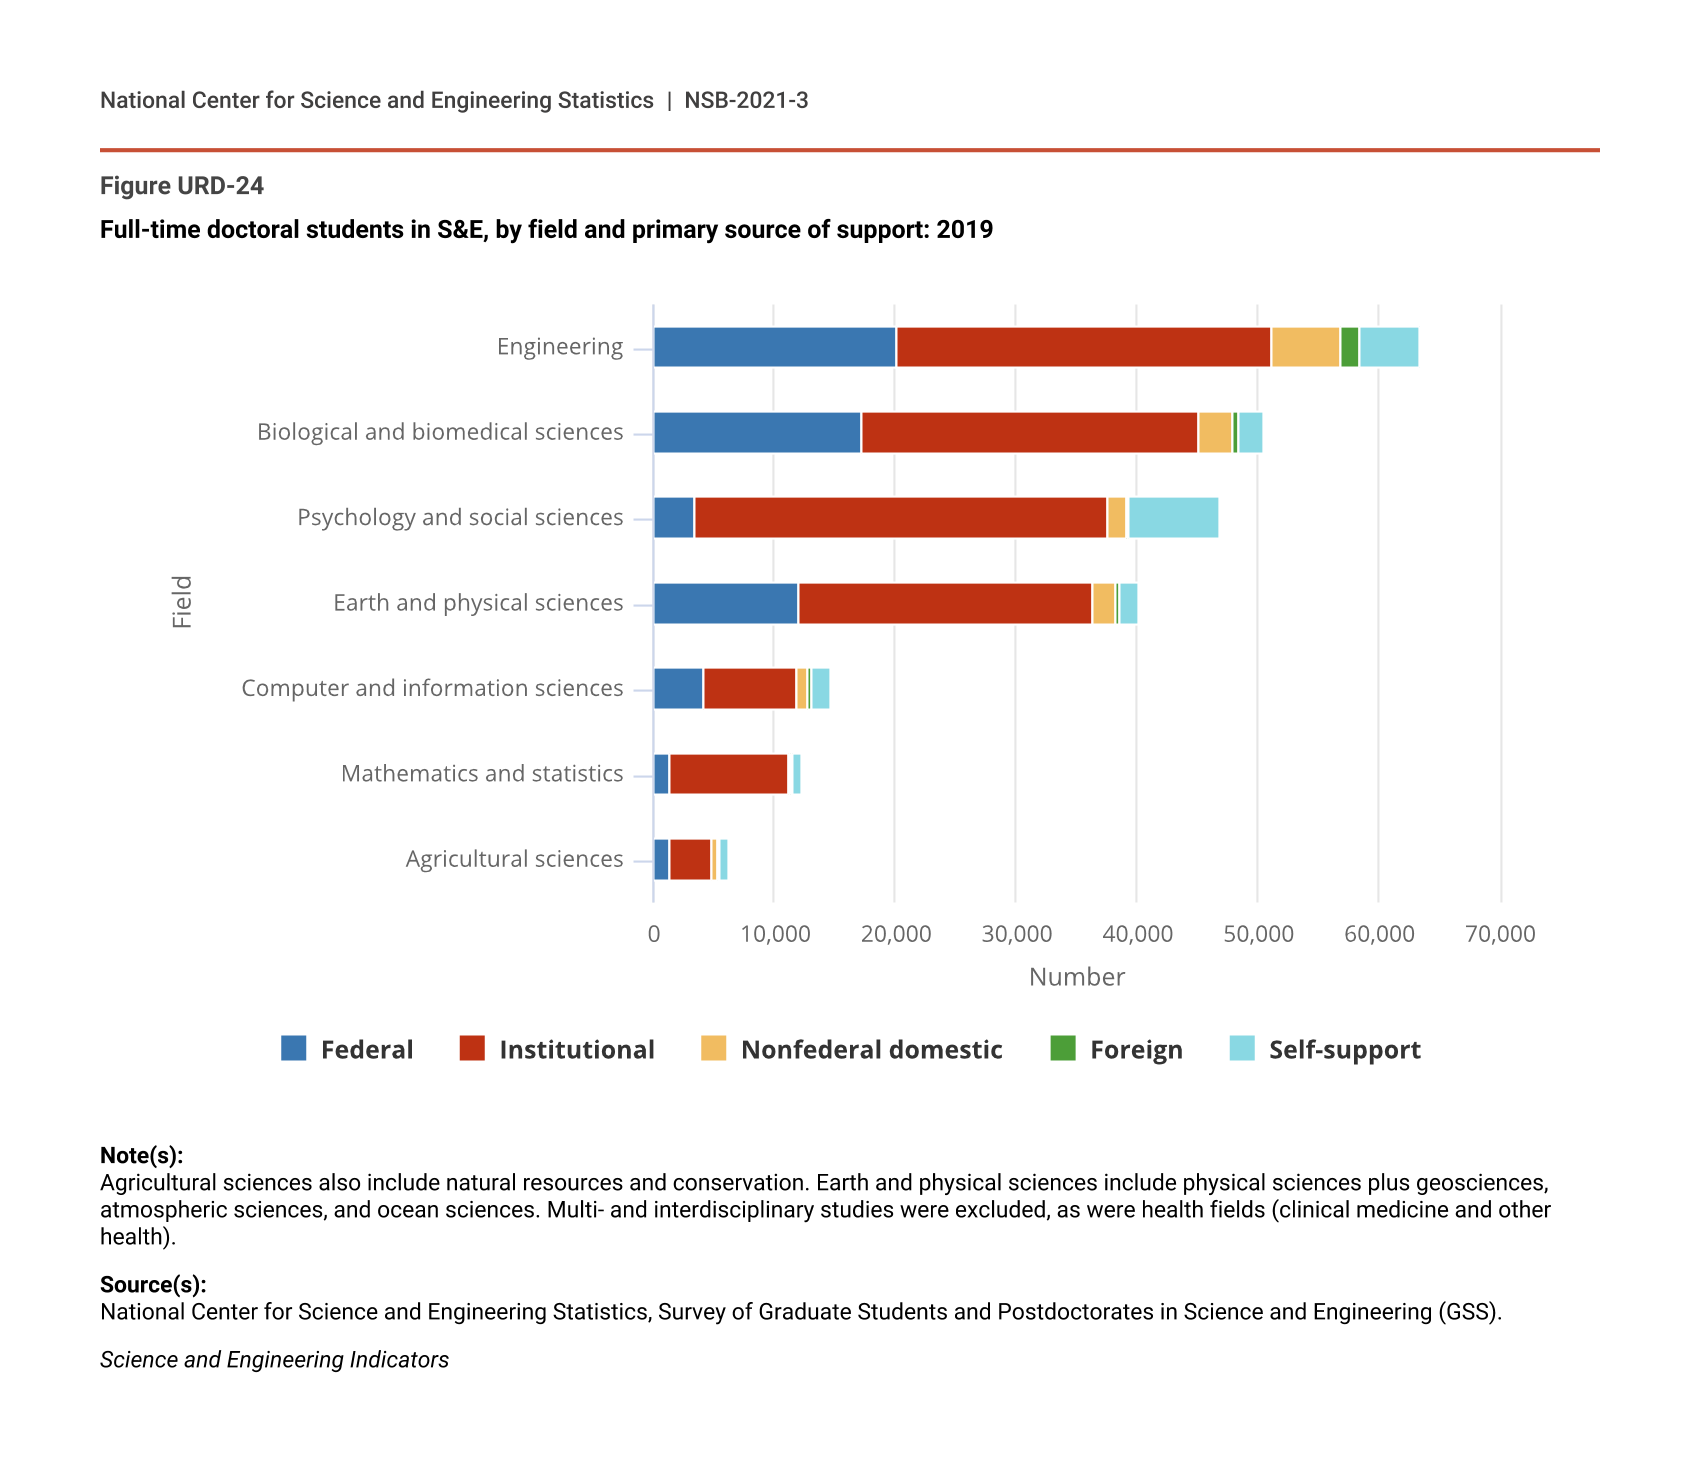
The largest numbers of institutionally supported graduate students were in engineering (44,000), biological and biomedical sciences (34,000), and social sciences (33,000). Across fields and levels, institutions supported more students than the federal government. For full-time S&E doctoral students, institutions supported higher numbers than any other source across fields (Figure URD-24). The percentage of full-time doctoral students supported by institutions varied from just under half for engineering to 80% for mathematics and statistics (NCSES GSS 2019: Table 3-1).
Institutions mainly used TAs to support graduate students; 42% of institutionally funded graduate students in 2019 had TAs. RAs (around a quarter) and fellowships (17%) accounted for most of the rest.
Full-time doctoral students in S&E, by field and primary source of support: 2019
| Field | Federal | Institutional | Nonfederal domestic | Foreign | Self-support |
|---|---|---|---|---|---|
| Engineering | 20,250 | 30,982 | 5,685 | 1,494 | 4,983 |
| Biological and biomedical sciences | 17,290 | 27,880 | 2,835 | 376 | 2,095 |
| Psychology and social sciences | 3,478 | 34,085 | 1,504 | 292 | 7,563 |
| Earth and physical sciences | 12,092 | 24,296 | 1,815 | 341 | 1,586 |
| Computer and information sciences | 4,063 | 7,777 | 961 | 238 | 1,546 |
| Mathematics and statistics | 1,306 | 9,911 | 243 | 102 | 760 |
| Agricultural sciences | 1,381 | 3,429 | 605 | 80 | 675 |
Note(s):
Agricultural sciences also include natural resources and conservation. Earth and physical sciences include physical sciences plus geosciences, atmospheric sciences, and ocean sciences. Multi- and interdisciplinary studies were excluded, as were health fields (clinical medicine and other health).
Source(s):
National Center for Science and Engineering Statistics, Survey of Graduate Students and Postdoctorates in Science and Engineering (GSS).
Science and Engineering Indicators
Postdocs
Institutions funded around a quarter of academic postdocs (about 15,500) in 2019 (NCSES GSS 2019: Table 3-2). The largest numbers of institutionally funded postdocs were in biological and biomedical sciences (4,000), clinical medicine (4,000), and engineering (2,000). Institutions funded fewer postdocs than did the federal government for all broad fields except mathematics and statistics and social sciences. Institutions mainly funded postdocs through other support (around half) and RAs (around a third).
Other Support for S&E Graduate Students and Postdocs
Nonfederal Domestic Support
Other nonfederal domestic sources, including businesses and nonprofits, supported around 4% of S&E graduate students in 2019, including about 2% of master’s students (4,900) and 6% of doctoral students (14,000) (NCSES GSS 2019: Table 3-1). These sources supported the largest numbers of students in engineering (7,400), biological and biomedical sciences (3,300), and earth and physical sciences (2,000). They funded the largest percentages of total students in agricultural sciences (12%), engineering (6%), and natural resources and conservation (5%).
Nonfederal domestic sources supported 15% of total S&E postdocs (10,000) and between 8% and 18% of postdocs across fields (NCSES GSS 2019: Table 3-2). These sources funded the most postdocs in biological and biomedical sciences (3,300), clinical medicine (2,600), and engineering (1,400).
Foreign Support
In 2019, less than 1% of S&E graduate students were supported by foreign sources, including around 1,500 master’s students (0.6%) and 3,200 doctoral students (1.3%). Foreign sources funded less than 3% of students across degree levels and fields. They supported the most students in engineering (2,000) (NCSES GSS 2019: Table 3-1).
Foreign sources also supported around 2.5% of academic postdocs (1,600). Most of these were in clinical medicine (400), biological and biomedical sciences (400), and engineering (300) (NCSES GSS 2019: Table 3-2).