 An official website of the United States government
 U.S. and Global Research and Development
A nation’s innovative capacity is driven not only by development of a workforce equipped to perform technologically advanced activities but also by its investments in R&D. Global R&D expenditures tripled from $726 billion in 2000 to an estimated $2.4 trillion in 2019. Although the United States spent more on R&D than any other country in 2019, its global share has declined as R&D growth in several middle-income countries has outpaced that of the United States. Most growth in U.S. R&D performance and funding is attributable to the business sector. The U.S. government is the second-largest funder of R&D performance, but its proportion of total R&D has declined.
Global R&D
Based on R&D expenditures, a few countries perform most of the global R&D. In 2019, the United States (27% or $656 billion) and China (22% or $526 billion) performed about half of the global R&D (Figure 12)., These shares are markedly different from those reported in Indicators 2020 because of revisions to the estimates of purchasing power parities (PPP), a measure which enables direct comparisons of R&D expenditures across countries (see sidebar Revisions to Global Research and Development for more details). Japan (7%), Germany (6%), and South Korea (4%) were also substantial performers. Other top-performing countries—for example, France, India, and the United Kingdom—account for about 2% to 3% each of the global total. Many other countries also conduct R&D, with annual expenditures well below these top countries.
Gross domestic expenditures on R&D, by selected country: 2000–19
| Year | United States | France | Germany | United Kingdom | China | Japan | South Korea | India |
|---|---|---|---|---|---|---|---|---|
| 2000 | 269.5 | 33.3 | 53.9 | 25.2 | 32.9 | 98.9 | 18.5 | 16.8 |
| 2001 | 280.2 | 36.1 | 56.2 | 26.3 | 38.4 | 103.8 | 21.3 | 17.5 |
| 2002 | 279.9 | 38.3 | 58.6 | 27.9 | 47.9 | 108.2 | 22.5 | 18.1 |
| 2003 | 293.9 | 37.1 | 61.0 | 28.6 | 56.8 | 112.4 | 24.1 | 19.8 |
| 2004 | 305.6 | 38.1 | 62.9 | 29.4 | 69.7 | 117.5 | 27.9 | 23.1 |
| 2005 | 328.1 | 39.5 | 64.0 | 30.6 | 86.2 | 128.7 | 30.6 | 27.9 |
| 2006 | 353.3 | 42.3 | 69.5 | 33.3 | 104.7 | 138.7 | 35.4 | 30.4 |
| 2007 | 380.3 | 44.2 | 73.4 | 35.2 | 123.3 | 147.5 | 40.6 | 33.6 |
| 2008 | 407.2 | 46.6 | 81.2 | 36.5 | 145.1 | 148.7 | 43.9 | 37.6 |
| 2009 | 406.4 | 49.7 | 82.8 | 36.5 | 184.1 | 137.4 | 45.8 | 39.7 |
| 2010 | 410.1 | 50.9 | 87.0 | 37.6 | 212.1 | 140.6 | 52.2 | 41.2 |
| 2011 | 429.8 | 53.6 | 95.8 | 38.8 | 246.5 | 148.4 | 58.4 | 42.4 |
| 2012 | 434.3 | 55.1 | 100.5 | 38.5 | 289.2 | 152.3 | 64.9 | 45.8 |
| 2013 | 455.1 | 58.4 | 102.9 | 41.5 | 323.4 | 164.7 | 68.2 | 45.8 |
| 2014 | 477.0 | 60.6 | 109.6 | 43.8 | 346.3 | 169.6 | 73.1 | 47.6 |
| 2015 | 495.9 | 61.6 | 114.1 | 45.7 | 366.1 | 168.5 | 76.9 | 49.6 |
| 2016 | 522.7 | 63.7 | 122.5 | 48.1 | 393.0 | 160.3 | 80.8 | 51.8 |
| 2017 | 556.3 | 65.7 | 133.7 | 50.8 | 420.8 | 166.6 | 90.3 | 55.1 |
| 2018 | 607.5 | 68.6 | 142.1 | 54.2 | 465.5 | 172.8 | 99.0 | 58.7 |
| 2019 | 657.5 | 72.8 | 147.5 | 56.9 | 525.7 | 173.3 | 102.5 | NA |
Note(s):
PPP is purchasing power parity. Data are for the top eight R&D-performing countries. Data are not available for all countries for all years. Gross domestic expenditures on R&D were revised from those reported in previous years of Science and Engineering Indicators. These data revisions were mostly due to 2020 revisions of the PPP estimates. See sidebar Revisions to Global Research and Development for more details.
Source(s):
NCSES, National Patterns of R&D Resources; OECD, MSTI March 2021 release; UNESCO, UIS, R&D dataset.
Indicators 2022: R&D
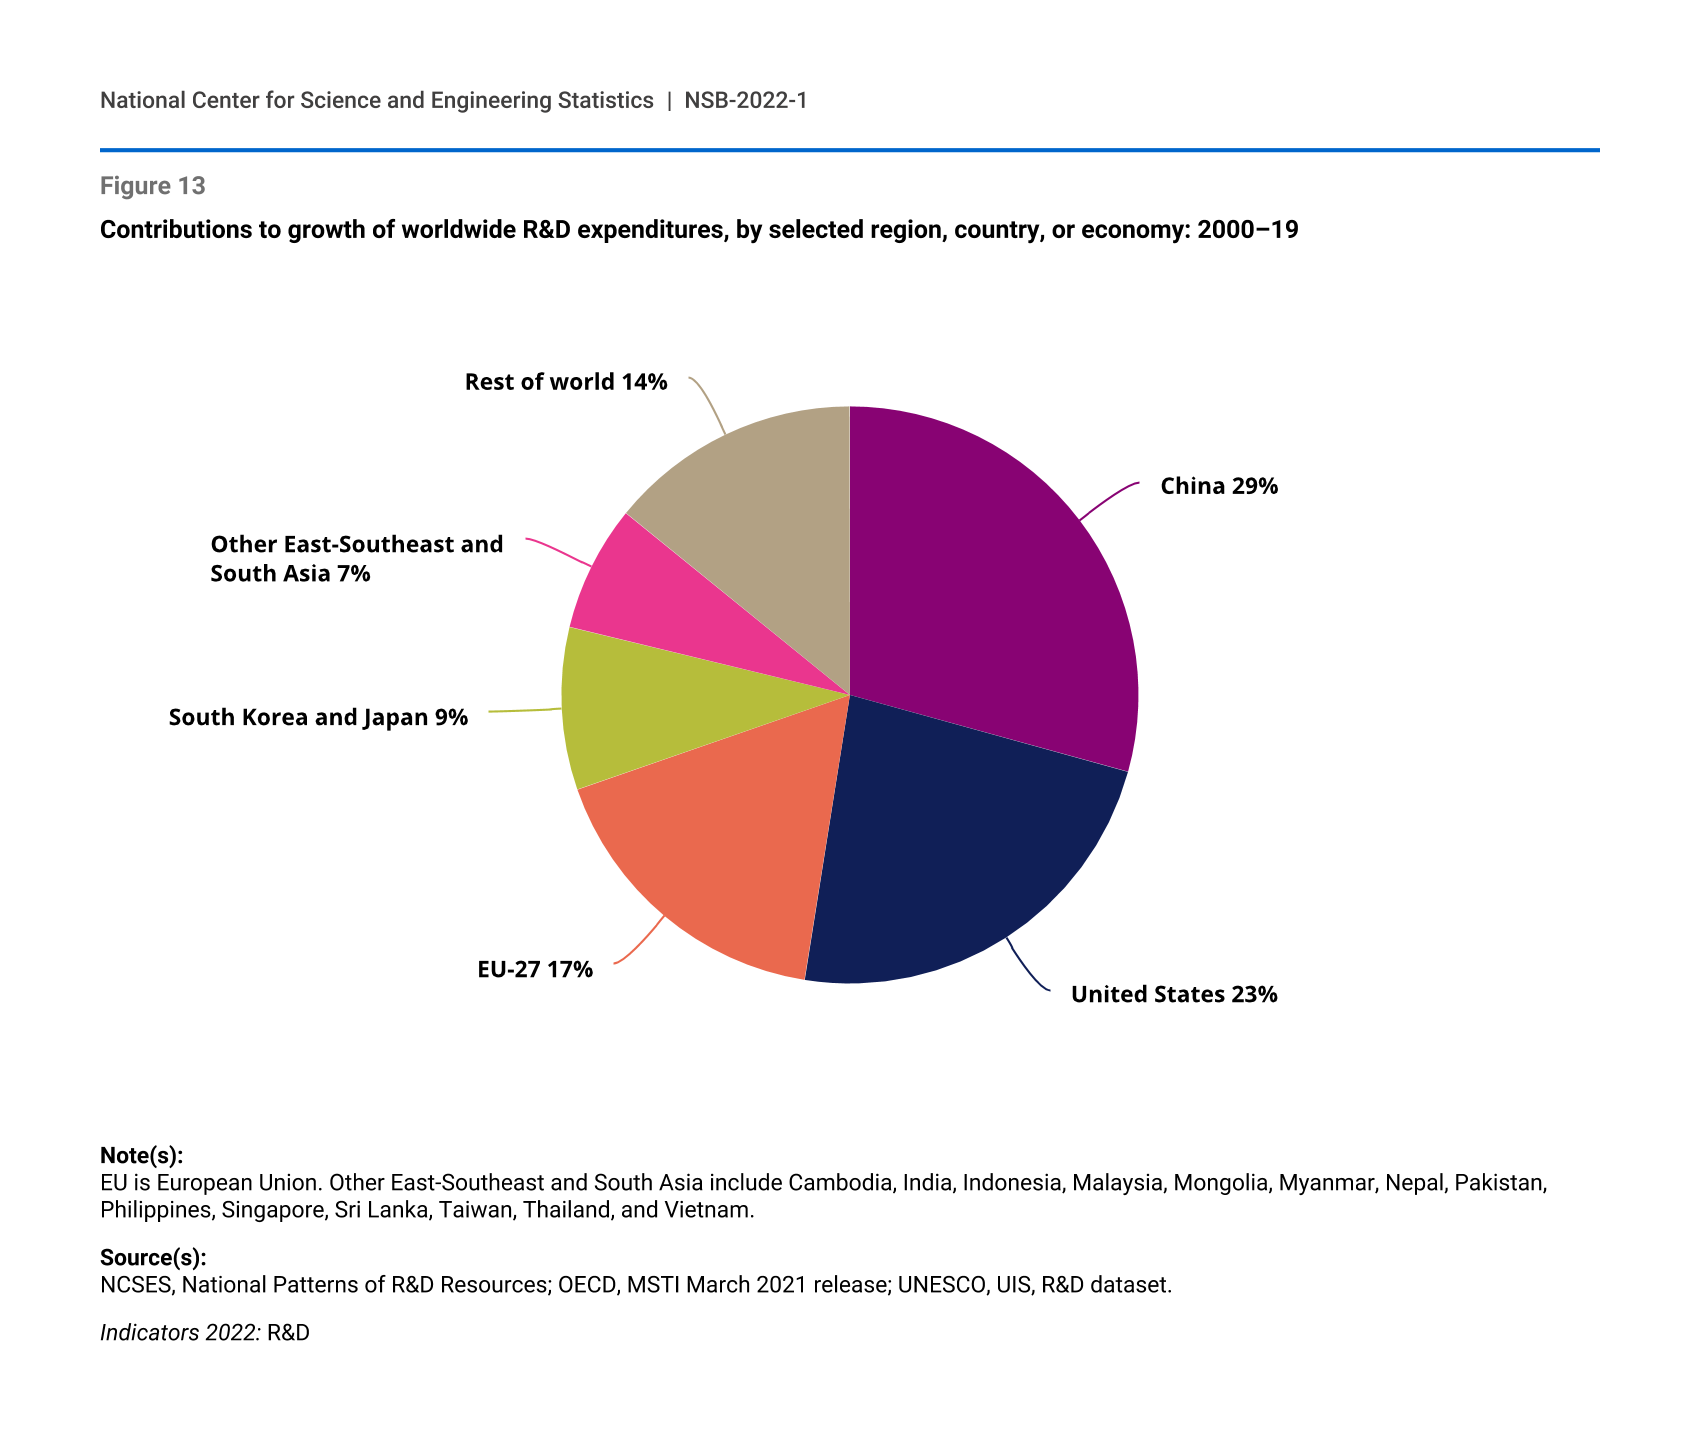
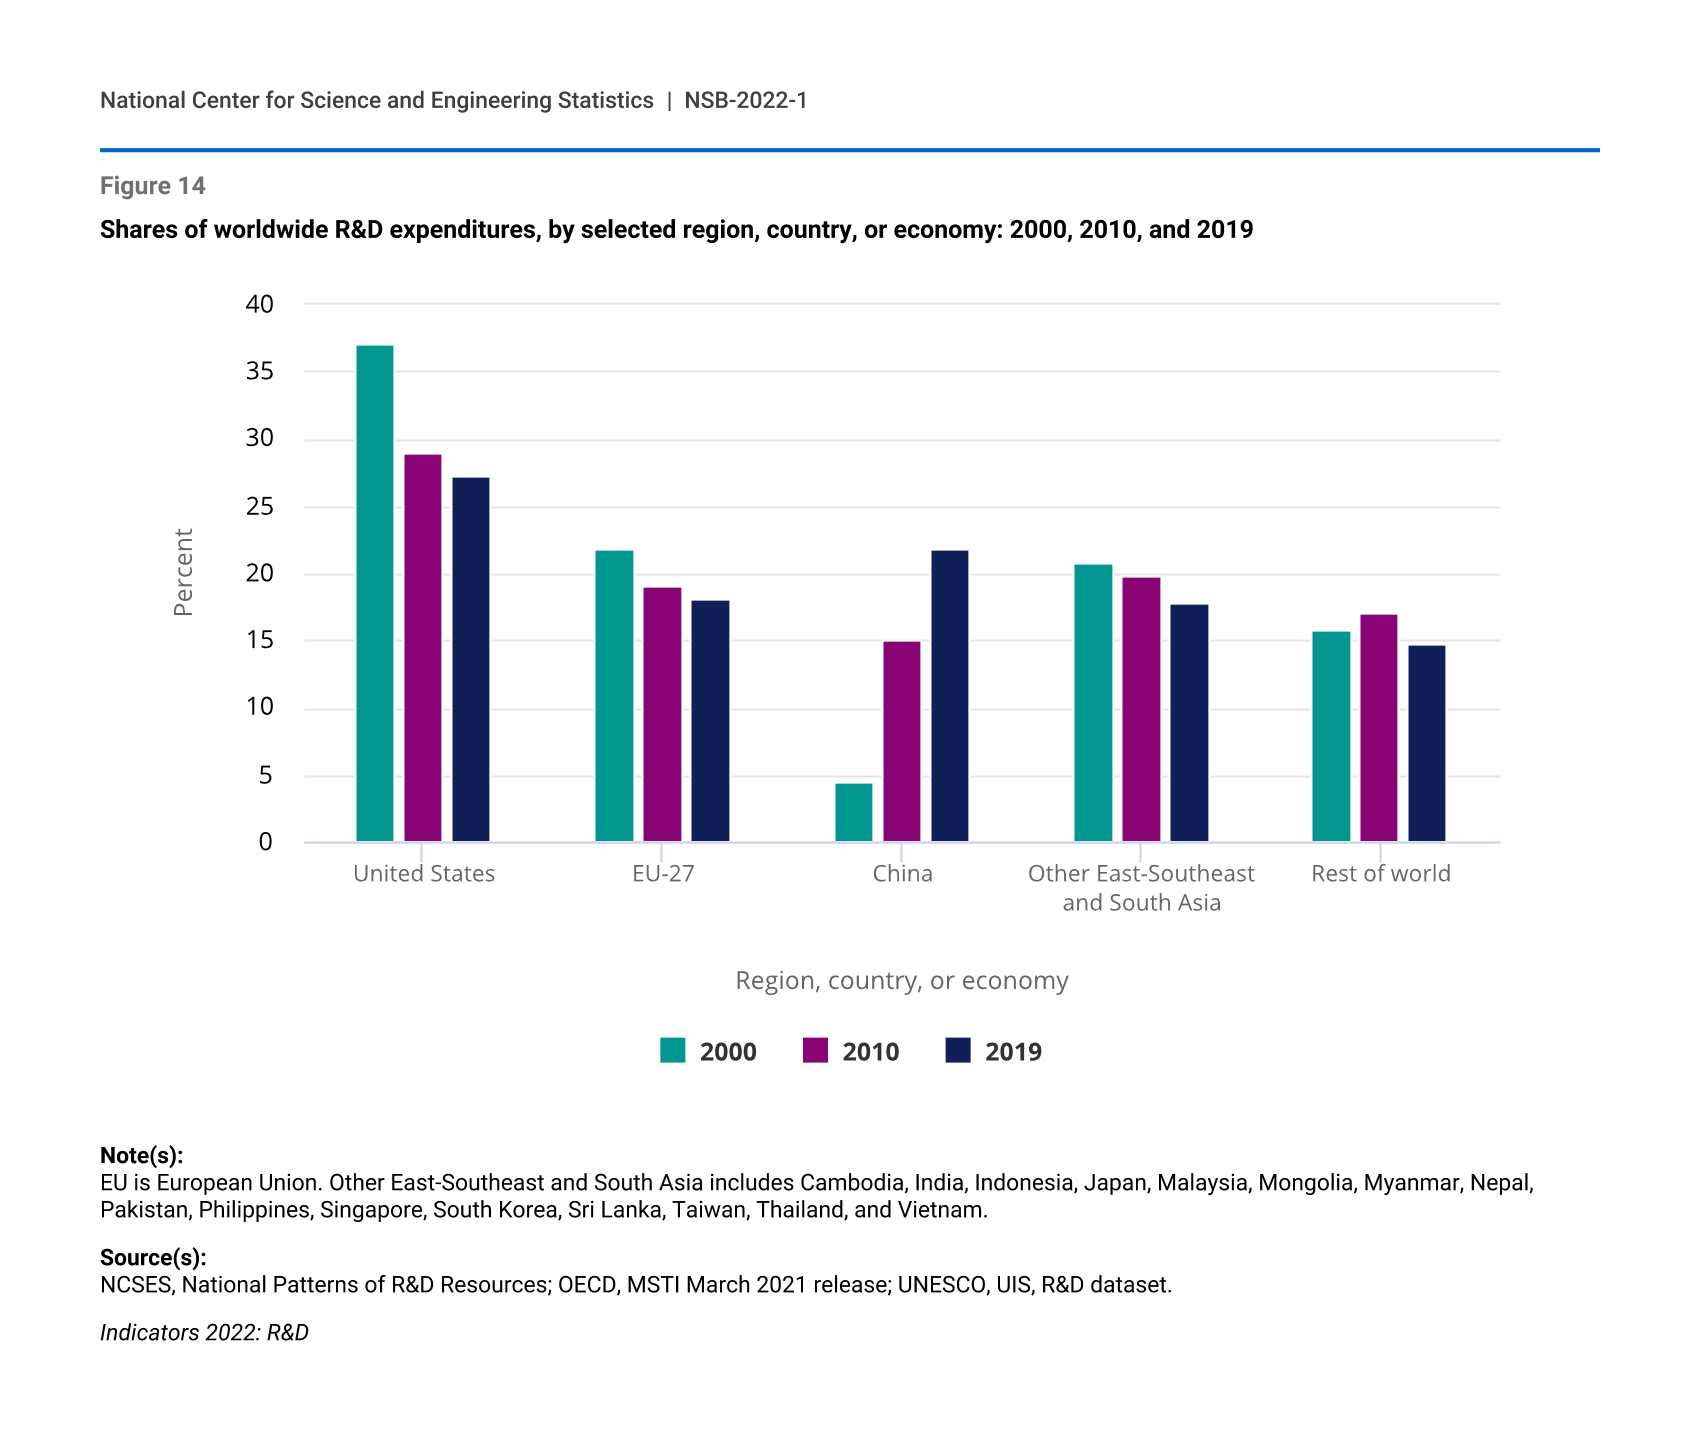
A notable trend over the past decade has been the growth in R&D spending in the regions of East-Southeast Asia and South Asia, compared with the other major R&D-performing areas. The United States contributed 23% to growth in global R&D performance from 2000 to 2019, whereas countries in the regions of East-Southeast Asia and South Asia, including China, Japan, Malaysia, Singapore, South Korea, Taiwan, and India contributed 46% to the growth in global R&D during this period. China alone contributed 29% to growth in global R&D, buoyed by its high annual R&D growth (Figure 13). The annual increase of China’s R&D, averaging 10.6% annually from 2010 to 2019, continues to greatly exceed that of the United States, with an annual average of 5.4% from 2010 to 2019. Consequently, the share of global R&D performed by the United States declined from 29% in 2010 to 27% in 2019, whereas the share by China increased from 15% to 22% (Figure 14). More recently, R&D growth in China has slowed to a rate that is similar to the United States.
Contributions to growth of worldwide R&D expenditures, by selected region, country, or economy: 2000–19
| Region, country, or economy | Percent |
|---|---|
| China | 29 |
| United States | 23 |
| EU-27 | 17 |
| South Korea and Japan | 9 |
| Other East-Southeast and South Asia | 7 |
| Rest of world | 14 |
Note(s):
EU is European Union. Other East-Southeast and South Asia include Cambodia, India, Indonesia, Malaysia, Mongolia, Myanmar, Nepal, Pakistan, Philippines, Singapore, Sri Lanka, Taiwan, Thailand, and Vietnam.
Source(s):
NCSES, National Patterns of R&D Resources; OECD, MSTI March 2021 release; UNESCO, UIS, R&D dataset.
Indicators 2022: R&D
Shares of worldwide R&D expenditures, by selected region, country, or economy: 2000, 2010, and 2019
| Region, country, or economy | 2000 | 2010 | 2019 |
|---|---|---|---|
| United States | 37.1 | 29.0 | 27.3 |
| EU-27 | 21.8 | 19.1 | 18.2 |
| China | 4.5 | 15.0 | 21.9 |
| Other East-Southeast and South Asia | 20.7 | 19.8 | 17.9 |
| Rest of world | 15.8 | 17.0 | 14.8 |
Note(s):
EU is European Union. Other East-Southeast and South Asia includes Cambodia, India, Indonesia, Japan, Malaysia, Mongolia, Myanmar, Nepal, Pakistan, Philippines, Singapore, South Korea, Sri Lanka, Taiwan, Thailand, and Vietnam.
Source(s):
NCSES, National Patterns of R&D Resources; OECD, MSTI March 2021 release; UNESCO, UIS, R&D dataset.
Indicators 2022: R&D
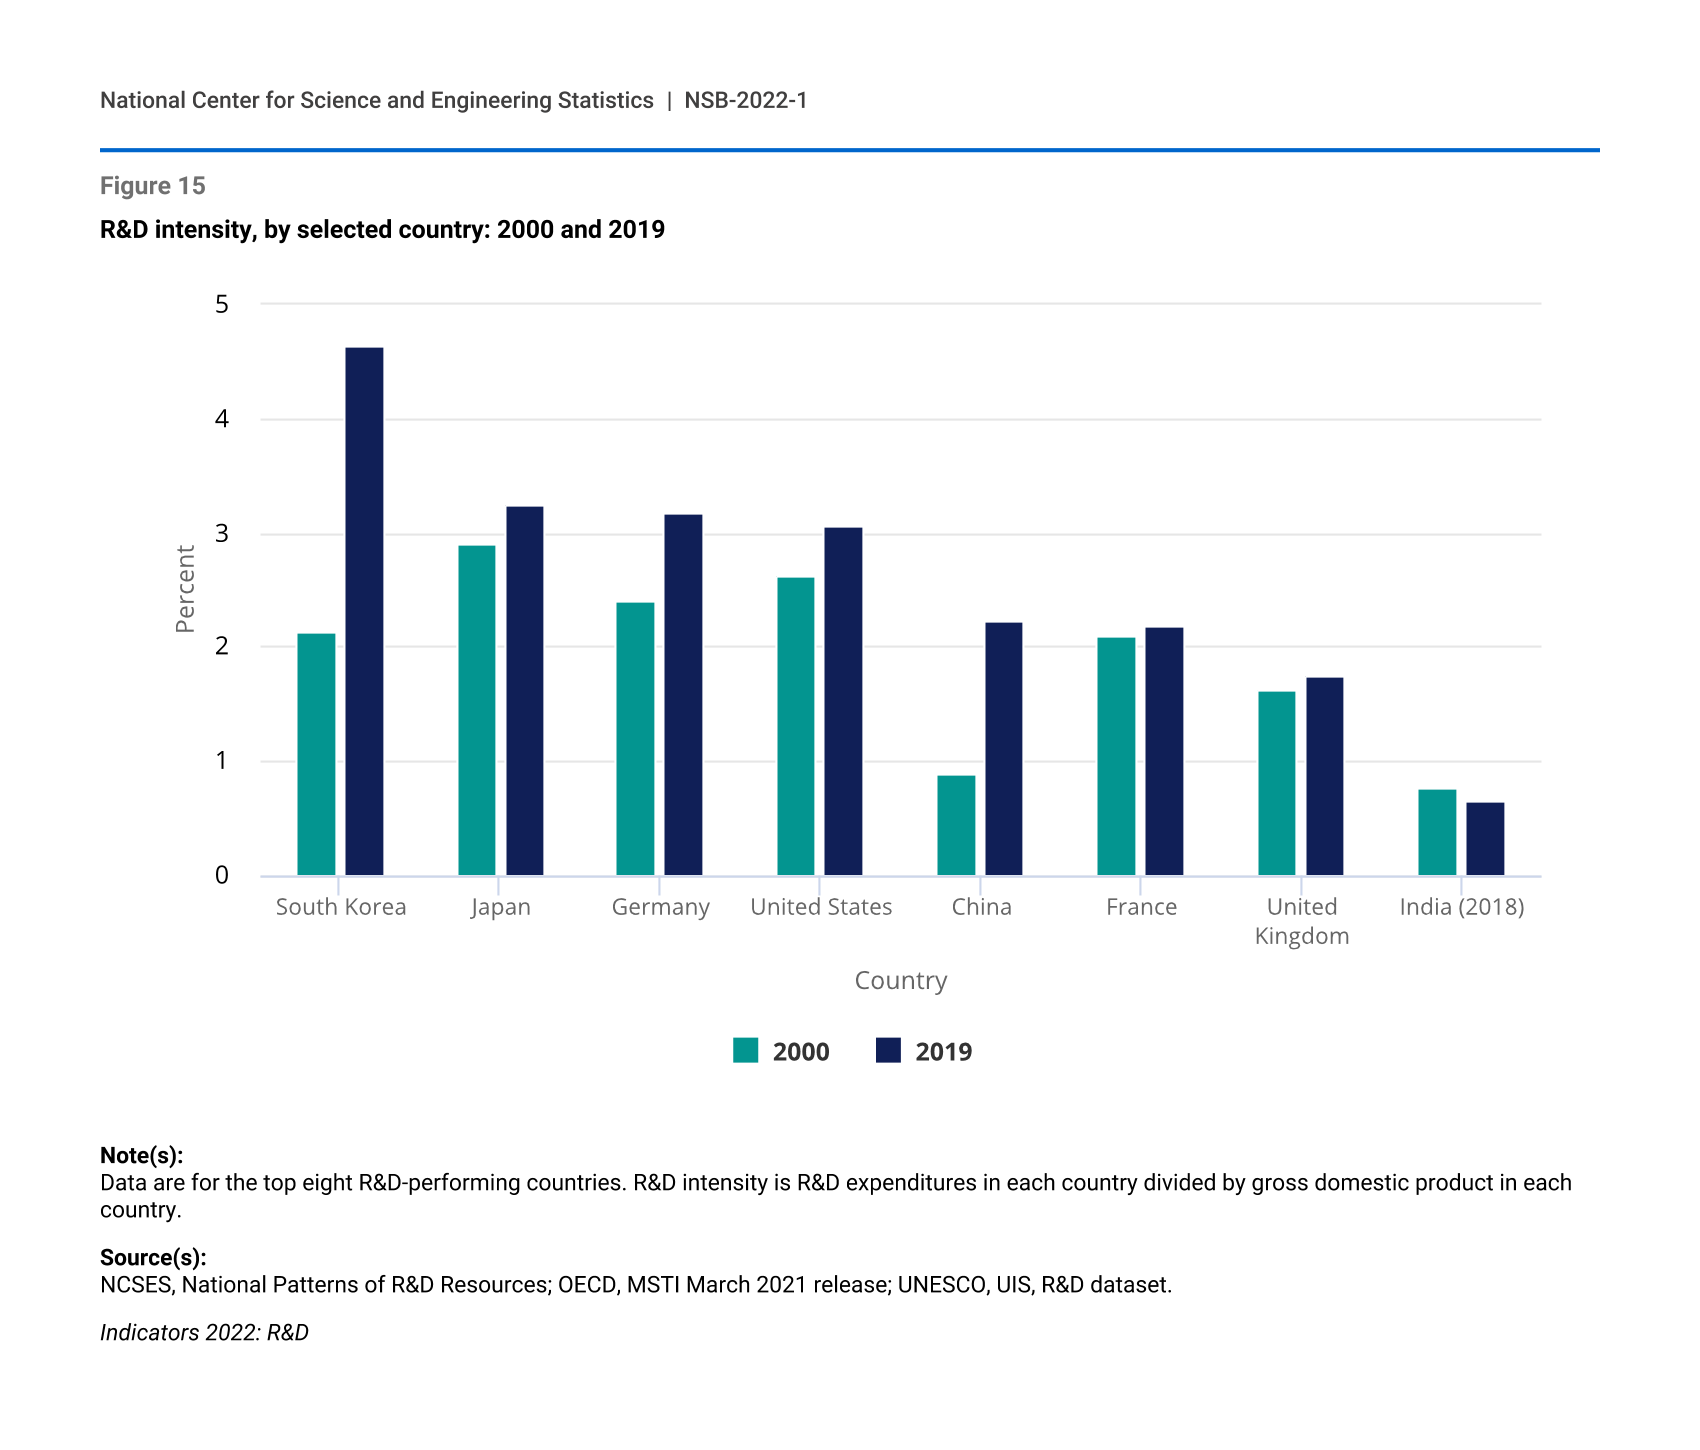
Several countries with smaller economies, including Israel, South Korea, and Taiwan, have greater R&D intensities than the United States (see Glossary section for definition of R&D intensity). However, R&D intensity increased across several of the top R&D-performing countries from 2000 to 2019 (Figure 15). U.S. R&D intensity ranged from 2.5% to just under 3.0% for nearly 2 decades, with the most recent 2019 estimate exceeding 3.0% for the first time, based on a preliminary estimate of U.S. total R&D expenditures (Figure 15). From 2000 to 2019, South Korea and China had the most growth in R&D intensity, growing from 2.1% to 4.6% and from 0.9% to 2.2%, respectively. R&D intensity in Germany also grew from 2.4% to 3.2%.
Countries vary in the amount of R&D expenditures on basic research, applied research, and experimental development (see Glossary section for definitions of basic research, applied research, and experimental development). For example, the United States spends a higher share of R&D funding on basic research than does China, and China spends a higher share of R&D funding on experimental development than does the United States. In 2018, China spent 83% of its R&D expenditures on experimental development, compared with 64% in the United States. Although the shares spent on experimental development differed, the United States ($388.6 billion) and China ($387.9 billion) spent similar amounts. Overall, the United States spent $607.5 billion in R&D activity, with $101.1 billion (17%) of annual R&D spending classified as basic research, and China spent $26 billion (6%) of annual R&D spending on basic research. Other countries, such as France, spent a higher proportion of R&D funds on basic research, but none spend more than China or the United States in absolute amounts.
Within most of the top R&D-performing countries, the business sector funds the most R&D—60% or more in 2018. In each of the leading Asian countries—Japan, China, and South Korea—the business sector accounted for more than 75% of R&D funding. The business share of total R&D funding was lower but still more than 60% in the United States and Germany.
R&D intensity, by selected country: 2000 and 2019
| Country | 2000 | 2019 |
|---|---|---|
| South Korea | 2.13 | 4.64 |
| Japan | 2.91 | 3.24 |
| Germany | 2.41 | 3.18 |
| United States | 2.63 | 3.07 |
| China | 0.89 | 2.23 |
| France | 2.09 | 2.19 |
| United Kingdom | 1.62 | 1.76 |
| India (2018) | 0.76 | 0.65 |
Note(s):
Data are for the top eight R&D-performing countries. R&D intensity is R&D expenditures in each country divided by gross domestic product in each country.
Source(s):
NCSES, National Patterns of R&D Resources; OECD, MSTI March 2021 release; UNESCO, UIS, R&D dataset.
Indicators 2022: R&D
U.S. Performance and Funding Trends
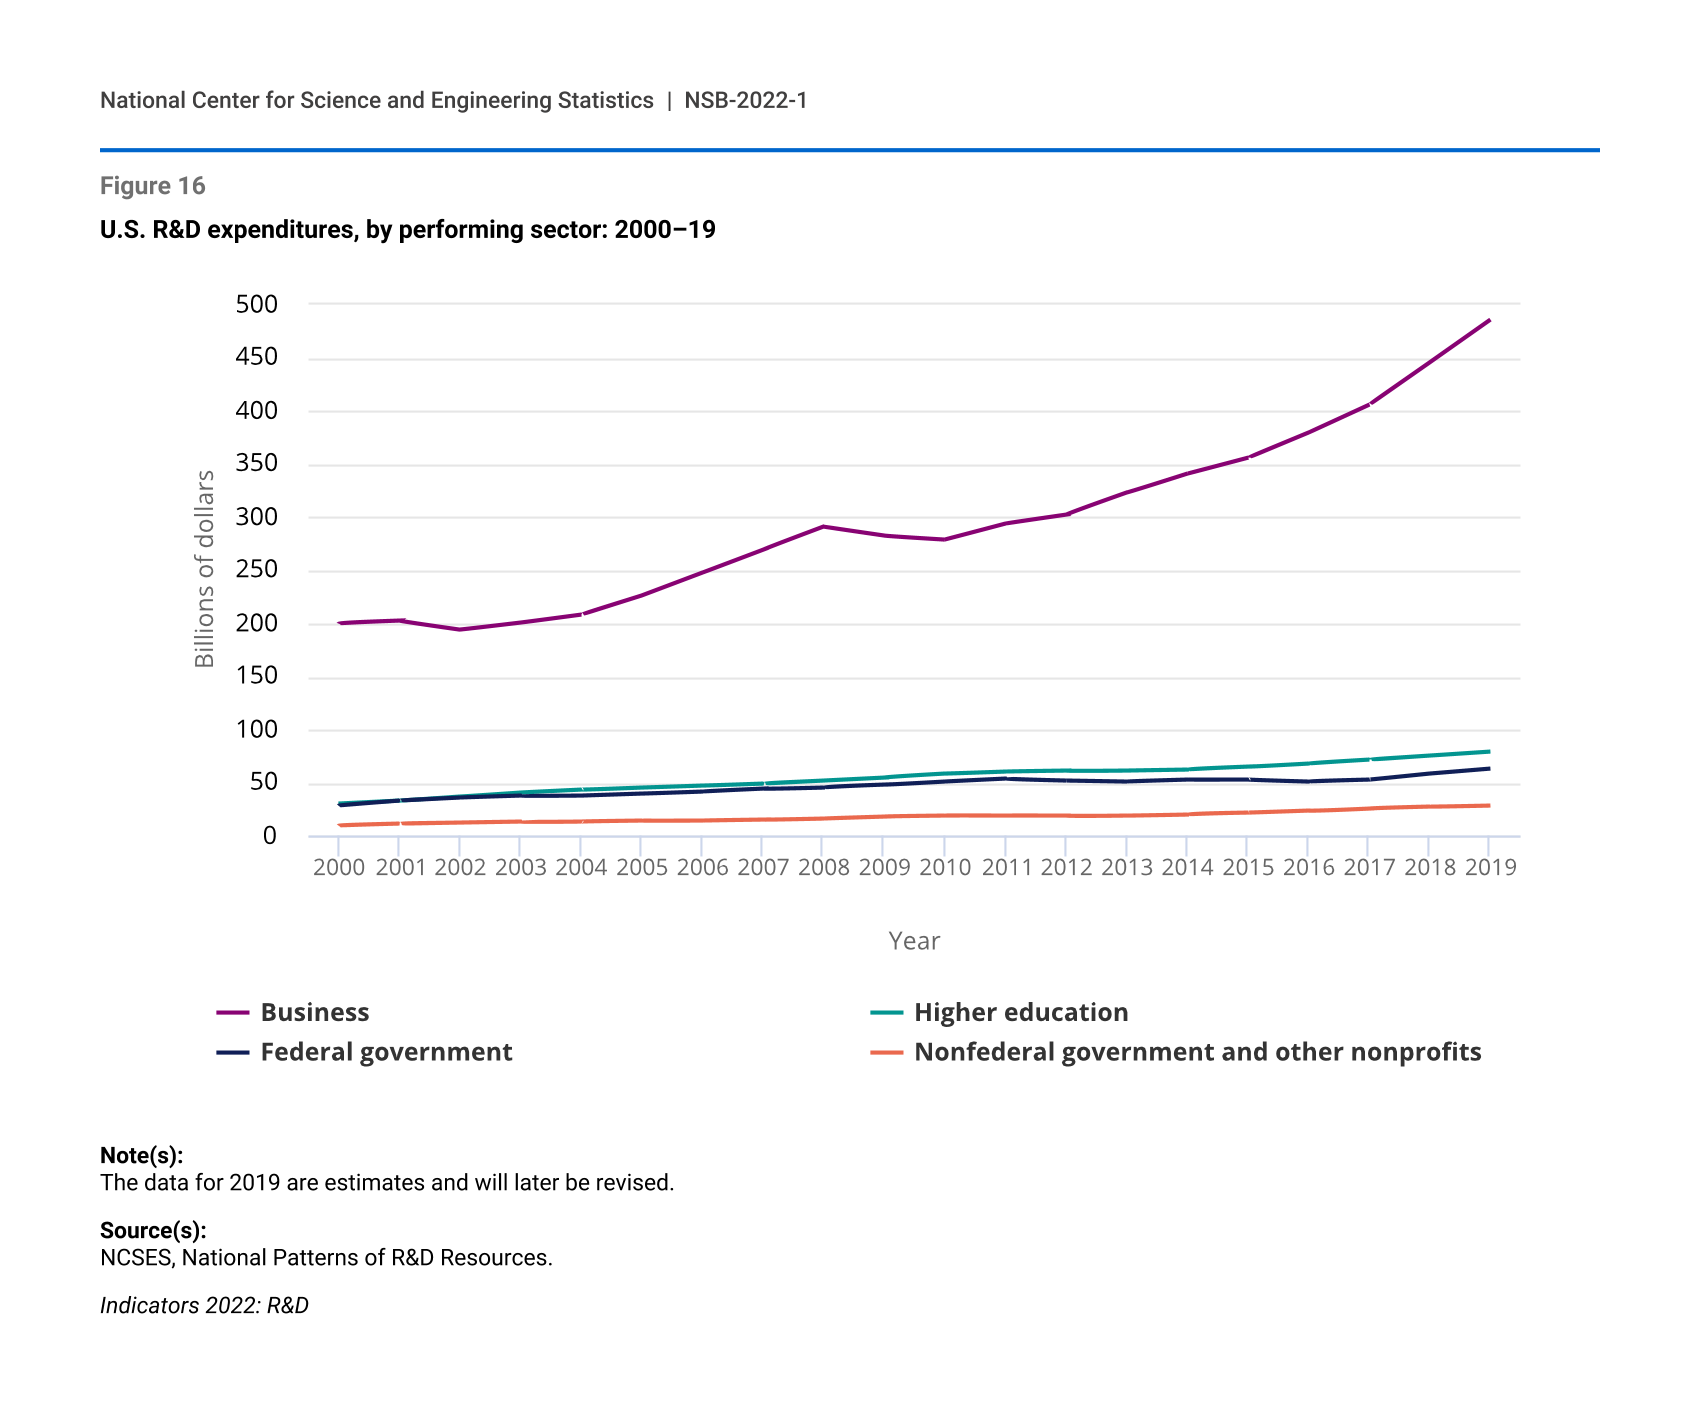
Although the U.S. business sector performs (or conducts) the most R&D, other sectors—including federal, state, and local governments; higher education institutions; and non-academic nonprofit organizations—also perform and fund domestic R&D. R&D performed in the United States totaled $606.1 billion in 2018, and according to preliminary estimates, $656 billion in 2019. The business sector was the main driver of R&D performance, accounting for about 83% of the growth in R&D from 2010 to 2019 (Figure 16).
Similarly, the U.S. business sector funds (or pays for) most R&D, and nearly all (98%) of the business sector's R&D funding supports R&D performance by businesses. In contrast, the federal government, the second-largest source of R&D funding (21%) (Figure 17), supports R&D performed by all sectors. Based on preliminary 2019 estimates, the federal government funded 50% of the R&D performed by the higher education sector, 31% by nonprofits, and 6% by businesses.
U.S. R&D expenditures, by performing sector: 2000–19
| Year | Business | Higher education | Federal government | Nonfederal government and other nonprofits |
|---|---|---|---|---|
| 2000 | 200.0 | 29.9 | 28.5 | 9.6 |
| 2001 | 202.0 | 32.7 | 32.8 | 11.0 |
| 2002 | 193.9 | 36.7 | 35.5 | 11.9 |
| 2003 | 200.7 | 40.6 | 37.2 | 12.8 |
| 2004 | 208.3 | 43.3 | 37.7 | 13.4 |
| 2005 | 226.2 | 45.5 | 39.6 | 14.1 |
| 2006 | 247.7 | 47.4 | 41.6 | 14.3 |
| 2007 | 269.3 | 49.4 | 44.1 | 15.1 |
| 2008 | 290.7 | 52.1 | 45.6 | 16.4 |
| 2009 | 282.4 | 54.9 | 47.6 | 18.1 |
| 2010 | 279.0 | 58.1 | 50.8 | 18.7 |
| 2011 | 294.1 | 60.1 | 53.5 | 18.5 |
| 2012 | 302.3 | 60.9 | 52.1 | 18.4 |
| 2013 | 322.5 | 61.5 | 51.1 | 19.1 |
| 2014 | 340.7 | 62.4 | 52.7 | 20.2 |
| 2015 | 355.8 | 64.6 | 52.8 | 21.2 |
| 2016 | 379.5 | 67.8 | 51.2 | 23.2 |
| 2017 | 405.8 | 71.1 | 52.6 | 25.8 |
| 2018 | 445.6 | 74.9 | 58.4 | 27.2 |
| 2019 | 485.8 | 78.7 | 63.1 | 28.4 |
Note(s):
The data for 2019 are estimates and will later be revised.
Source(s):
NCSES, National Patterns of R&D Resources.
Indicators 2022: R&D
U.S. R&D expenditures, by source of funds: 2000–19
| Year | Business | Higher education | Federal government | Nonfederal government and other nonprofits |
|---|---|---|---|---|
| 2000 | 186.0 | 6.3 | 67.2 | 8.5 |
| 2001 | 188.4 | 6.9 | 73.8 | 9.5 |
| 2002 | 180.7 | 7.7 | 78.9 | 10.7 |
| 2003 | 186.2 | 8.3 | 85.1 | 11.8 |
| 2004 | 191.3 | 8.6 | 90.8 | 12.0 |
| 2005 | 207.8 | 9.4 | 95.4 | 12.7 |
| 2006 | 227.2 | 10.2 | 99.9 | 13.6 |
| 2007 | 246.8 | 10.9 | 105.1 | 15.0 |
| 2008 | 258.0 | 11.7 | 117.6 | 17.4 |
| 2009 | 246.6 | 12.1 | 125.8 | 18.5 |
| 2010 | 248.1 | 12.3 | 126.6 | 19.6 |
| 2011 | 266.4 | 13.1 | 127.0 | 19.7 |
| 2012 | 275.7 | 14.3 | 123.8 | 19.9 |
| 2013 | 297.2 | 15.4 | 120.1 | 21.6 |
| 2014 | 318.4 | 16.2 | 118.4 | 23.0 |
| 2015 | 333.2 | 17.3 | 119.5 | 24.4 |
| 2016 | 360.0 | 18.4 | 116.9 | 26.4 |
| 2017 | 386.1 | 19.6 | 121.6 | 28.0 |
| 2018 | 426.0 | 20.7 | 129.6 | 29.8 |
| 2019 | 463.7 | 21.8 | 138.9 | 31.6 |
Note(s):
The data for 2019 are estimates and will later be revised.
Source(s):
NCSES, National Patterns of R&D Resources.
Indicators 2022: R&D
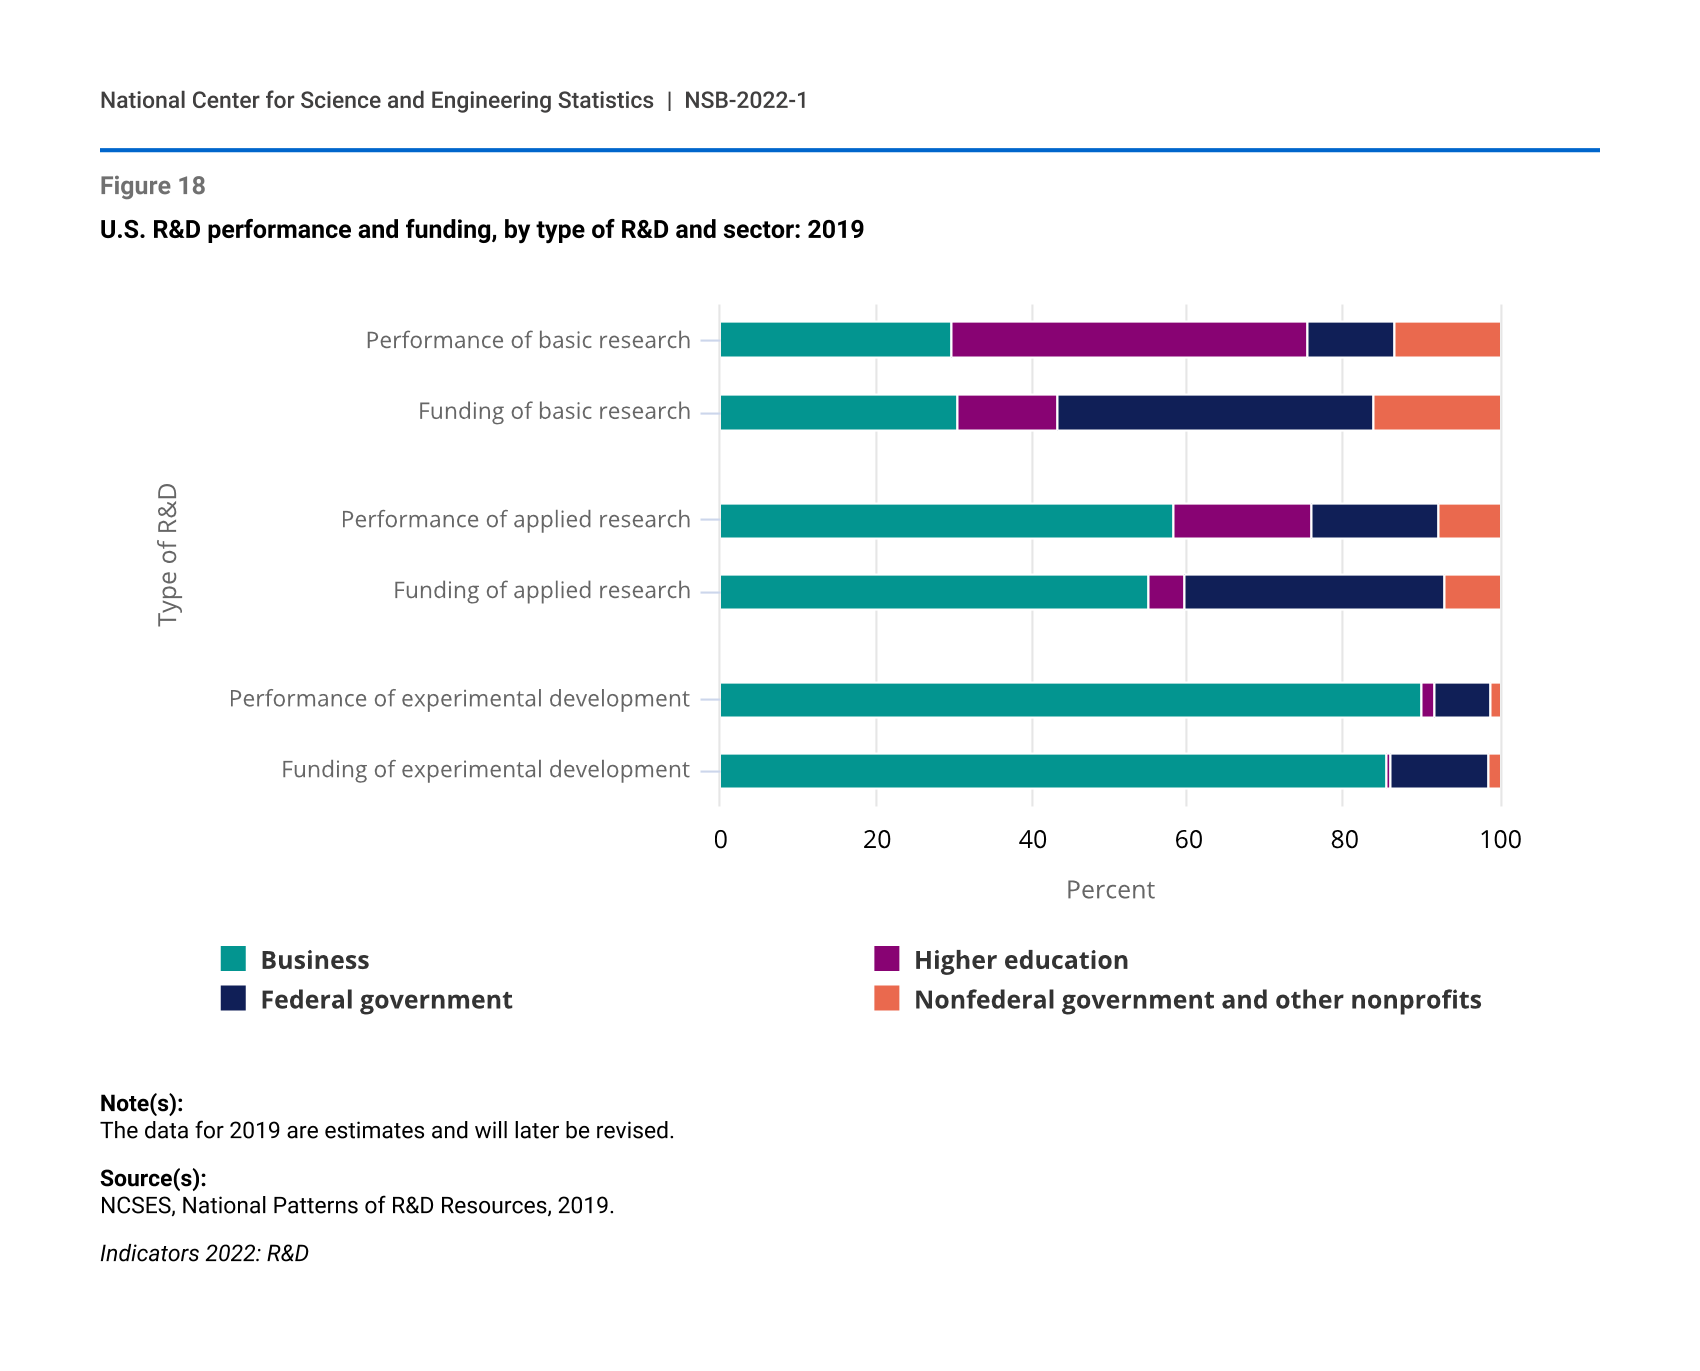
The majority of R&D performance is in experimental development (65%) and applied research (19%), and the business sector dominates in both. With its focus on new and improved goods, services, and processes, the business sector performs 90% of experimental development, and 58% of applied research (Figure 18). Higher education institutions perform the largest proportion of basic research (46%). However, the share of basic research performed by the business sector increased from 18% in 2012 to an estimated 30% in 2019. Since 2010, a few industries—notably chemical manufacturing (including pharmaceuticals and medicine); computer and electronic products; transportation equipment; professional, scientific, and technical services; and information services—account for most R&D performed by the business sector.
U.S. R&D performance and funding, by type of R&D and sector: 2019
| Type of R&D | Business | Higher education | Federal government | Nonfederal government and other nonprofits |
|---|---|---|---|---|
| Performance of basic research | 29.7 | 45.7 | 11.1 | 13.5 |
| Funding of basic research | 30.6 | 12.6 | 40.7 | 16.1 |
| Performance of applied research | 58.2 | 17.7 | 16.4 | 7.7 |
| Funding of applied research | 54.9 | 4.7 | 33.4 | 6.9 |
| Performance of experimental development | 90.0 | 1.7 | 7.2 | 1.0 |
| Funding of experimental development | 85.5 | 0.5 | 12.6 | 1.3 |
Note(s):
The data for 2019 are estimates and will later be revised.
Source(s):
NCSES, National Patterns of R&D Resources, 2019.
Indicators 2022: R&D
Similar to its role in conducting R&D, the business sector funds most of applied research (55%) and experimental development (86%). The share of basic research funded by the business sector increased from 23% in 2010 to 31% in 2019 (preliminary). However, the federal government continues to be the largest source of funding of basic research (41%).
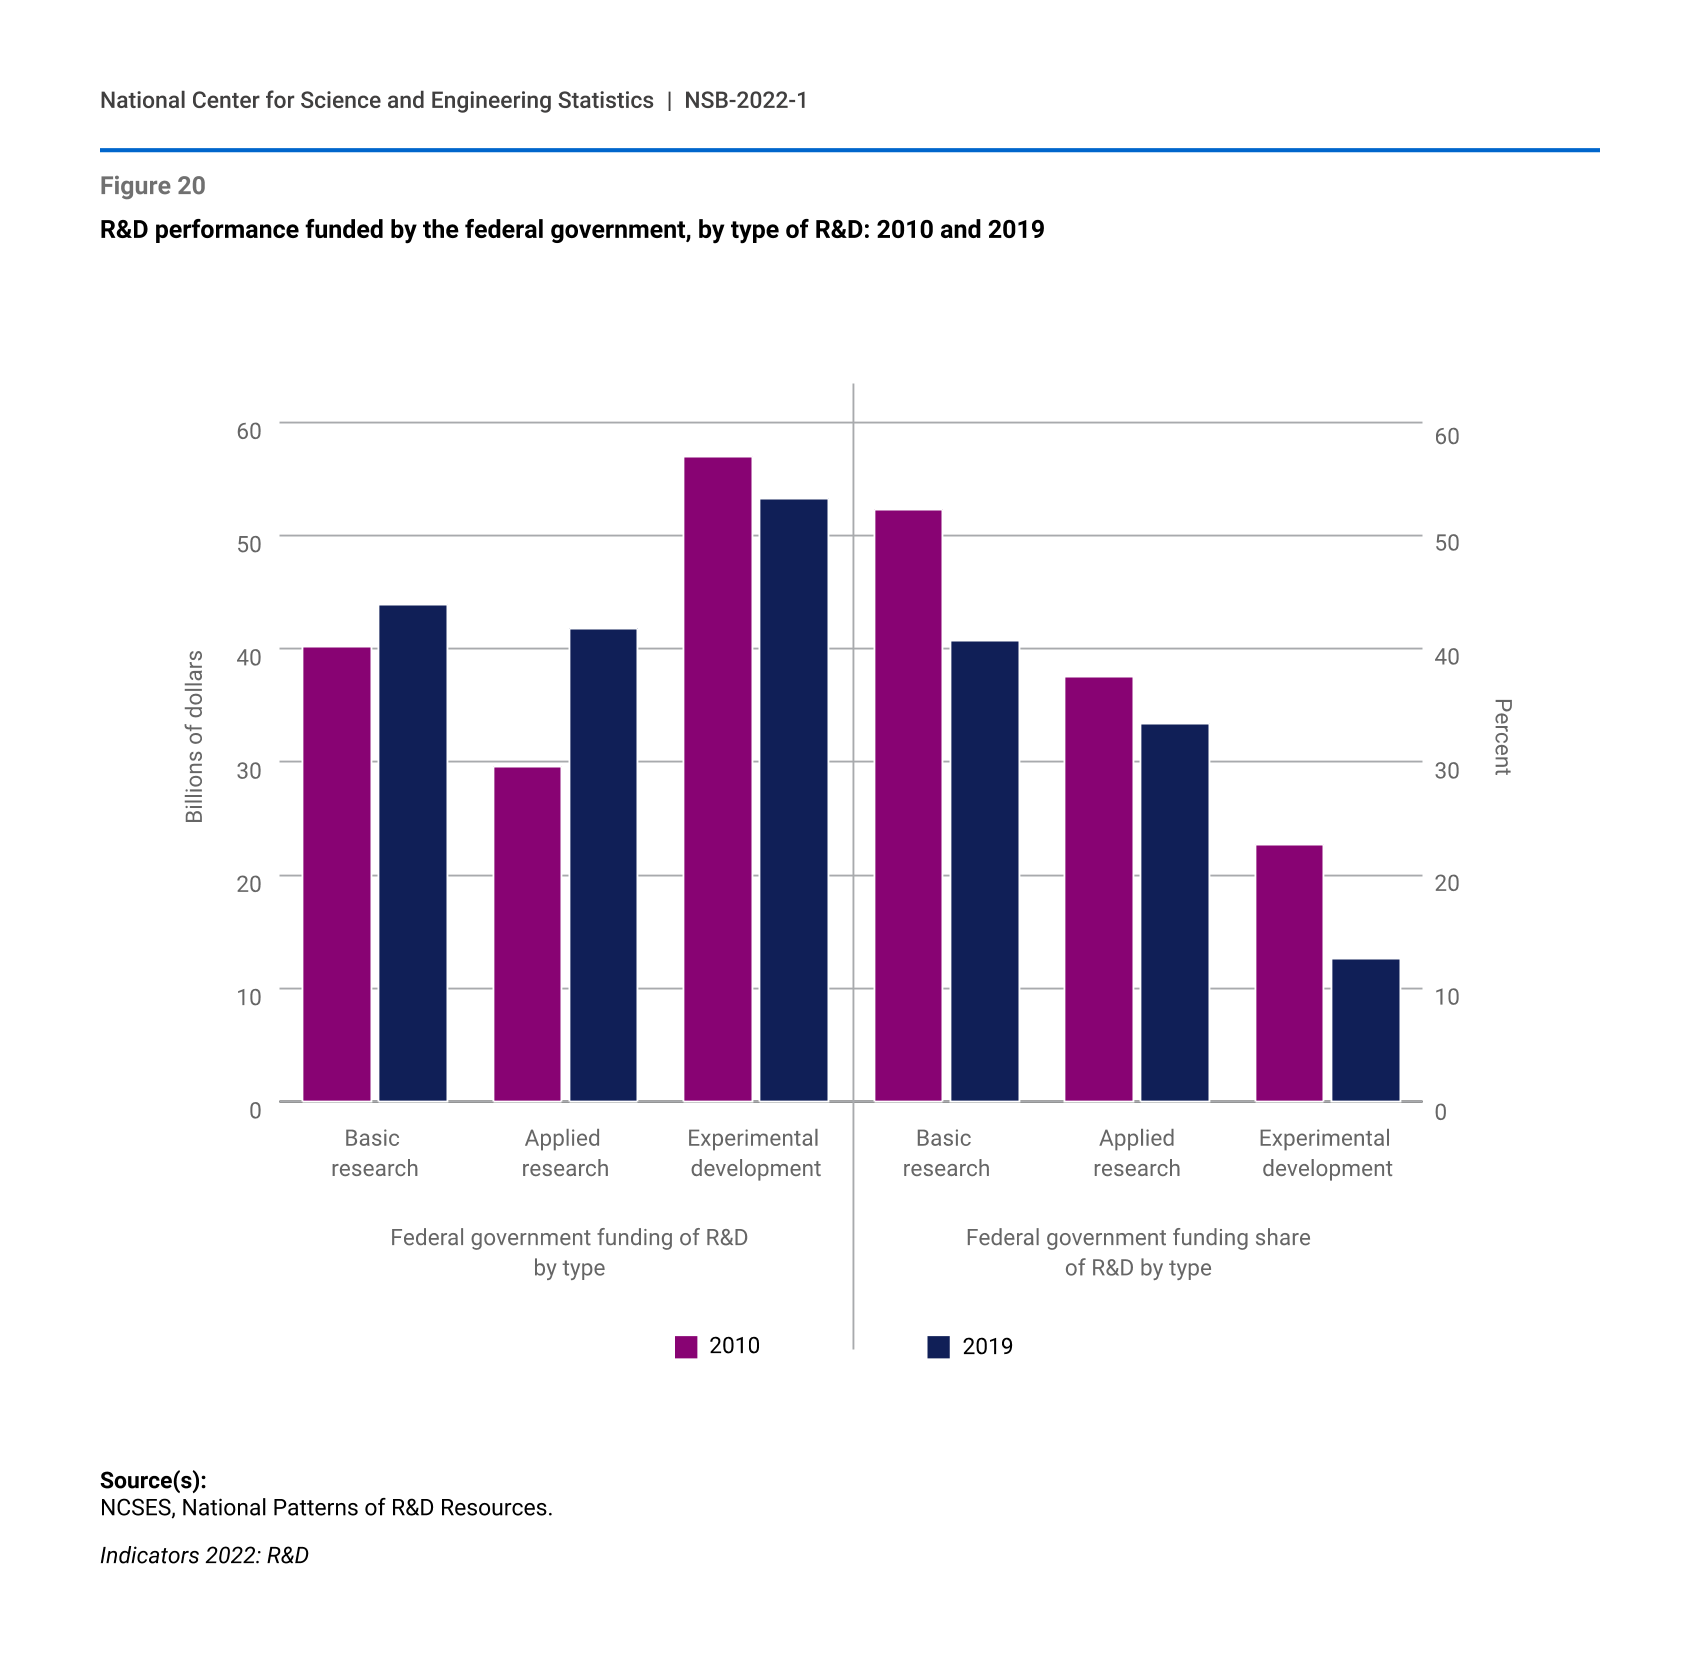
Although federal funding of R&D increased from $127 billion in 2010 to an estimated $139 billion in 2019, the share of total R&D funded by the federal government declined from 31% in 2010 to an estimated 21% in 2019. This decline occurred across all research types and sectors (Figure 19, Figure 20).
R&D performance funded by the federal government, by performing sector: 2010 and 2019
Source(s):
NCSES, National Patterns of R&D Resources.
Indicators 2022: R&D
R&D performance funded by the federal government, by type of R&D: 2010 and 2019
Source(s):
NCSES, National Patterns of R&D Resources.
Indicators 2022: R&D
The federal government supported 15% of full-time S&E graduate students (mostly doctoral students) in 2019, down from 19% in 2010. Numbers of full-time doctoral students varied across fields with the highest concentration of federally funded students in engineering and in biological and biomedical sciences (Figure 21). Although NSF supported substantial numbers of students across a range of fields, over 60% of those supported by the National Institutes of Health were in biological and biomedical sciences, 60% who were funded by the Department of Defense (DOD) studied engineering, and more than 90% who were funded by the Department of Energy (DOE) were in earth and physical sciences or engineering.
In 2019, the DOD received 40% of the federal R&D budget and directed the bulk of that budget toward experimental development. Most of the remaining 60% of the federal R&D budget went to the Department of Health and Human Services (HHS), DOE, National Aeronautics and Space Administration (NASA), NSF, and the Department of Agriculture (USDA). Consistent with the different missions of the departments and agencies, NASA distributes its budget evenly, with 60% going to basic and applied research and 40% to experimental development, whereas HHS, DOE, NSF, and USDA focus primarily on basic and applied research.
Full-time doctoral students in S&E, by field and primary source of support: 2019
| Field | Federal | Institutional | Nonfederal domestic | Foreign | Self-support |
|---|---|---|---|---|---|
| Engineering | 20,250 | 30,982 | 5,685 | 1,494 | 4,983 |
| Biological and biomedical sciences | 17,290 | 27,880 | 2,835 | 376 | 2,095 |
| Psychology and social sciences | 3,478 | 34,085 | 1,504 | 292 | 7,563 |
| Earth and physical sciences | 12,092 | 24,296 | 1,815 | 341 | 1,586 |
| Computer and information sciences | 4,063 | 7,777 | 961 | 238 | 1,546 |
| Mathematics and statistics | 1,306 | 9,911 | 243 | 102 | 760 |
| Agricultural sciences | 1,381 | 3,429 | 605 | 80 | 675 |
Source(s):
NCSES, GSS, 2019.