|
Figure 1
|
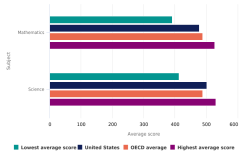
Average scores of 15-year-old students on the PISA mathematics and science literacy scales, by OECD education system: 2018 |
Organisation for Economic Co-operation and Development
|
Program for International Student Assessment
|
|
Figure 2
|
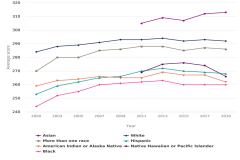
Average scores of U.S. students in grade 8 on the NAEP mathematics assessment, by race or ethnicity: 2000–19 |
National Center for Education Statistics
|
National Assessment of Educational Progress
|
|
Figure 3
|
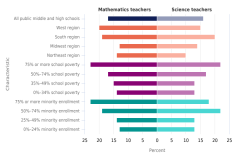
Public middle and high school mathematics and science teachers with 3 years or less of teaching experience, by selected school characteristics: 2017–18 |
National Center for Education Statistics
|
National Teacher and Principal Survey
|
|
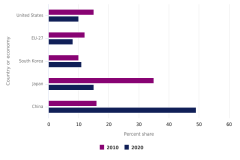
Figure 4
|
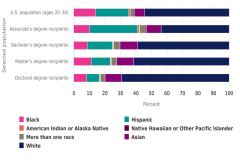
Representation of race or ethnicity in the U.S. population and among S&E degree recipients: 2019 |
National Center for Education Statistics
|
Integrated Postsecondary Education Data System (IPEDS), Completions Survey
|
|
Figure 4
|
Representation of race or ethnicity in the U.S. population and among S&E degree recipients: 2019
|
U.S. Census Bureau
|
Population Estimates Program
|
|
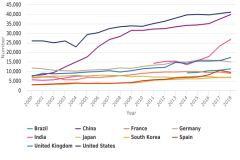
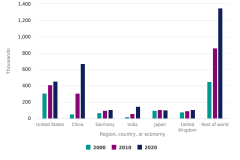
Figure 5
|
S&E doctoral degrees, by selected countries: 2000–18 |
Eurostat
|
Education and training database
|
|
Figure 5
|
S&E doctoral degrees, by selected countries: 2000–18
|
Government of India, Ministry of Education, Department of Higher Education
|
All India Survey on Higher Education
|
|
Figure 5
|
S&E doctoral degrees, by selected countries: 2000–18
|
Ministry of Education, Culture, Sports, Science and Technology (Japan)
|
Survey of Education
|
|
Figure 5
|
S&E doctoral degrees, by selected countries: 2000–18
|
Ministry of Education, People's Republic of China
|
Higher Education Data
|
|
Figure 5
|
S&E doctoral degrees, by selected countries: 2000–18
|
National Bureau of Statistics of China
|
China Statistical Yearbook
|
|
Figure 5
|
S&E doctoral degrees, by selected countries: 2000–18
|
Organisation for Economic Co-operation and Development
|
Education at a Glance
|
|
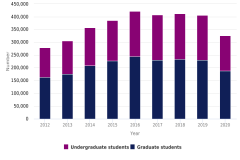
Figure 6
|
International students in S&E enrolled at U.S. higher education institutions, by academic level: 2012–20 |
U.S. Department of Homeland Security, U.S. Immigration and Customs Enforcement
|
Student and Exchange Visitor Information System (SEVIS)
|
|
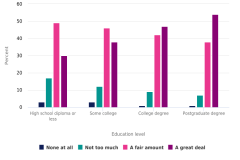
Figure 7
|
Confidence in scientists to act in the best interests of the public, by education level of respondents: 2020 |
Pew Research Center
|
American Trends Panel
|
|
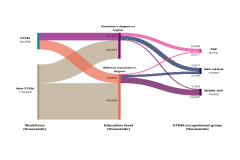
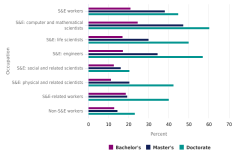
Figure 8
|
U.S. workforce, by STEM occupational group and education level: 2019 |
U.S. Census Bureau
|
American Community Survey
|
|
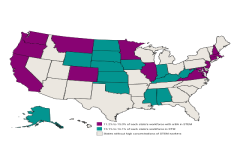
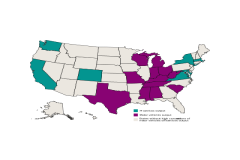
Figure 9
|
High concentration of STEM workers, by state: 2019 |
U.S. Census Bureau
|
American Community Survey
|
|
Figure 10
|
Demographic composition of the STEM workforce: 2010 and 2019 |
U.S. Census Bureau
|
American Community Survey
|
|
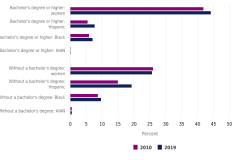
Figure 11
|
Foreign-born workers with a bachelor's degree or higher, by highest degree level and major occupation: 2019 |
National Center for Science and Engineering Statistics
|
National Survey of College Graduates
|
|
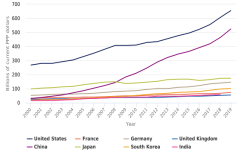
Figure 12
|
Gross domestic expenditures on R&D, by selected country: 2000–19 |
National Center for Science and Engineering Statistics
|
National Patterns of R&D Resources
|
|
Figure 12
|
Gross domestic expenditures on R&D, by selected country: 2000–19
|
Organisation for Economic Co-operation and Development
|
Main Science and Technology Indicators
|
|
Figure 12
|
Gross domestic expenditures on R&D, by selected country: 2000–19
|
UNESCO Institute for Statistics
|
UIS.Stat database
|
|
Figure 13
|
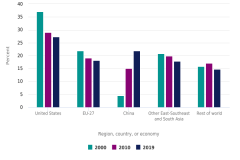
Contributions to growth of worldwide R&D expenditures, by selected region, country, or economy: 2000–19 |
National Center for Science and Engineering Statistics
|
National Patterns of R&D Resources
|
|
Figure 13
|
Contributions to growth of worldwide R&D expenditures, by selected region, country, or economy: 2000–19
|
Organisation for Economic Co-operation and Development
|
Main Science and Technology Indicators
|
|
Figure 13
|
Contributions to growth of worldwide R&D expenditures, by selected region, country, or economy: 2000–19
|
UNESCO Institute for Statistics
|
UIS.Stat database
|
|
Figure 14
|
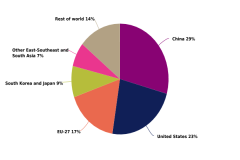
Shares of worldwide R&D expenditures, by selected region, country, or economy: 2000, 2010, and 2019 |
National Center for Science and Engineering Statistics
|
National Patterns of R&D Resources
|
|
Figure 14
|
Shares of worldwide R&D expenditures, by selected region, country, or economy: 2000, 2010, and 2019
|
Organisation for Economic Co-operation and Development
|
Main Science and Technology Indicators
|
|
Figure 14
|
Shares of worldwide R&D expenditures, by selected region, country, or economy: 2000, 2010, and 2019
|
UNESCO Institute for Statistics
|
UIS.Stat database
|
|
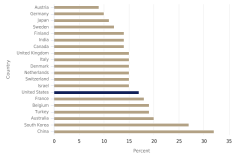
Figure 15
|
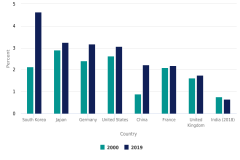
R&D intensity, by selected country: 2000 and 2019 |
National Center for Science and Engineering Statistics
|
National Patterns of R&D Resources
|
|
Figure 15
|
R&D intensity, by selected country: 2000 and 2019
|
Organisation for Economic Co-operation and Development
|
Main Science and Technology Indicators
|
|
Figure 15
|
R&D intensity, by selected country: 2000 and 2019
|
UNESCO Institute for Statistics
|
UIS.Stat database
|
|
Figure 16
|
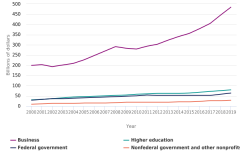
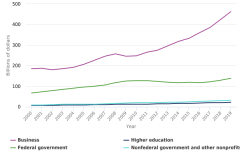
U.S. R&D expenditures, by performing sector: 2000–19 |
National Center for Science and Engineering Statistics
|
National Patterns of R&D Resources
|
|
Figure 17
|
U.S. R&D expenditures, by source of funds: 2000–19 |
National Center for Science and Engineering Statistics
|
National Patterns of R&D Resources
|
|
Figure 18
|
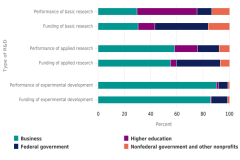
U.S. R&D performance and funding, by type of R&D and sector: 2019 |
National Center for Science and Engineering Statistics
|
National Patterns of R&D Resources
|
|
Figure 19
|
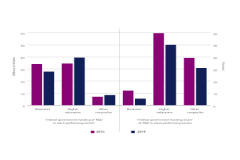
R&D performance funded by the federal government, by performing sector: 2010 and 2019 |
National Center for Science and Engineering Statistics
|
National Patterns of R&D Resources
|
|
Figure 20
|
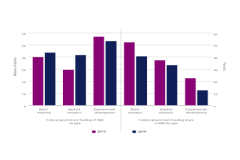
R&D performance funded by the federal government, by type of R&D: 2010 and 2019 |
National Center for Science and Engineering Statistics
|
National Patterns of R&D Resources
|
|
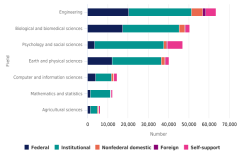
Figure 21
|
Full-time doctoral students in S&E, by field and primary source of support: 2019 |
National Center for Science and Engineering Statistics
|
Survey of Graduate Students and Postdoctorates in Science and Engineering
|
|
Figure 22
|
S&E articles, by selected region, country, or economy: 2000, 2010, and 2020 |
Elsevier
|
Scopus
|
|
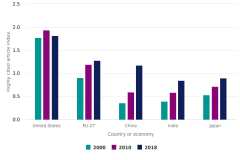
Figure 23
|
Highly cited article index, by selected country or economy: 2000, 2010, and 2018 |
Elsevier
|
Scopus
|
|
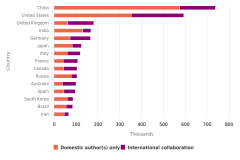
Figure 24
|
International collaboration on S&E articles for the 15 largest producers of S&E articles, by country: 2020 |
Elsevier
|
Scopus
|
|
Figure 25
|
Shares of international patents granted to inventors, by selected country or economy: 2010 and 2020 |
European Patent Office
|
PATSTAT
|
|
Figure 26
|
Share of Patent Cooperation Treaty applications with at least one woman listed as inventor, by country: 2019 |
World Intellectual Property Organization
|
Intellectual Property Statistics
|
|
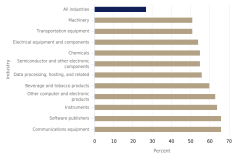
Figure 27
|
Share of U.S. companies reporting product or process innovation, by selected industry: 2015–17 |
National Center for Science and Engineering Statistics
|
Annual Business Survey
|
|
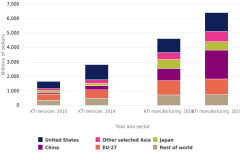
Figure 28
|
Output of KTI industries for selected region, country, or economy, by sector: 2010 and 2019 |
IHS Markit
|
Comparative Industry Service
|
|
Figure 29
|
High concentration of motor vehicle manufacturing and information technology (IT) services output, by state: 2020 |
U.S. Bureau of Economic Analysis
|
GDP by State
|
|
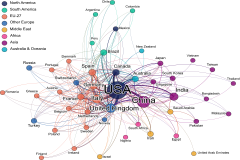
Figure A
|
Collaboration network on coronavirus-related articles, by country: 2020 |
Elsevier
|
Scopus
|
 An official website of the United States government