 An official website of the United States government
 Demographic Attributes of S&E Degree Recipients
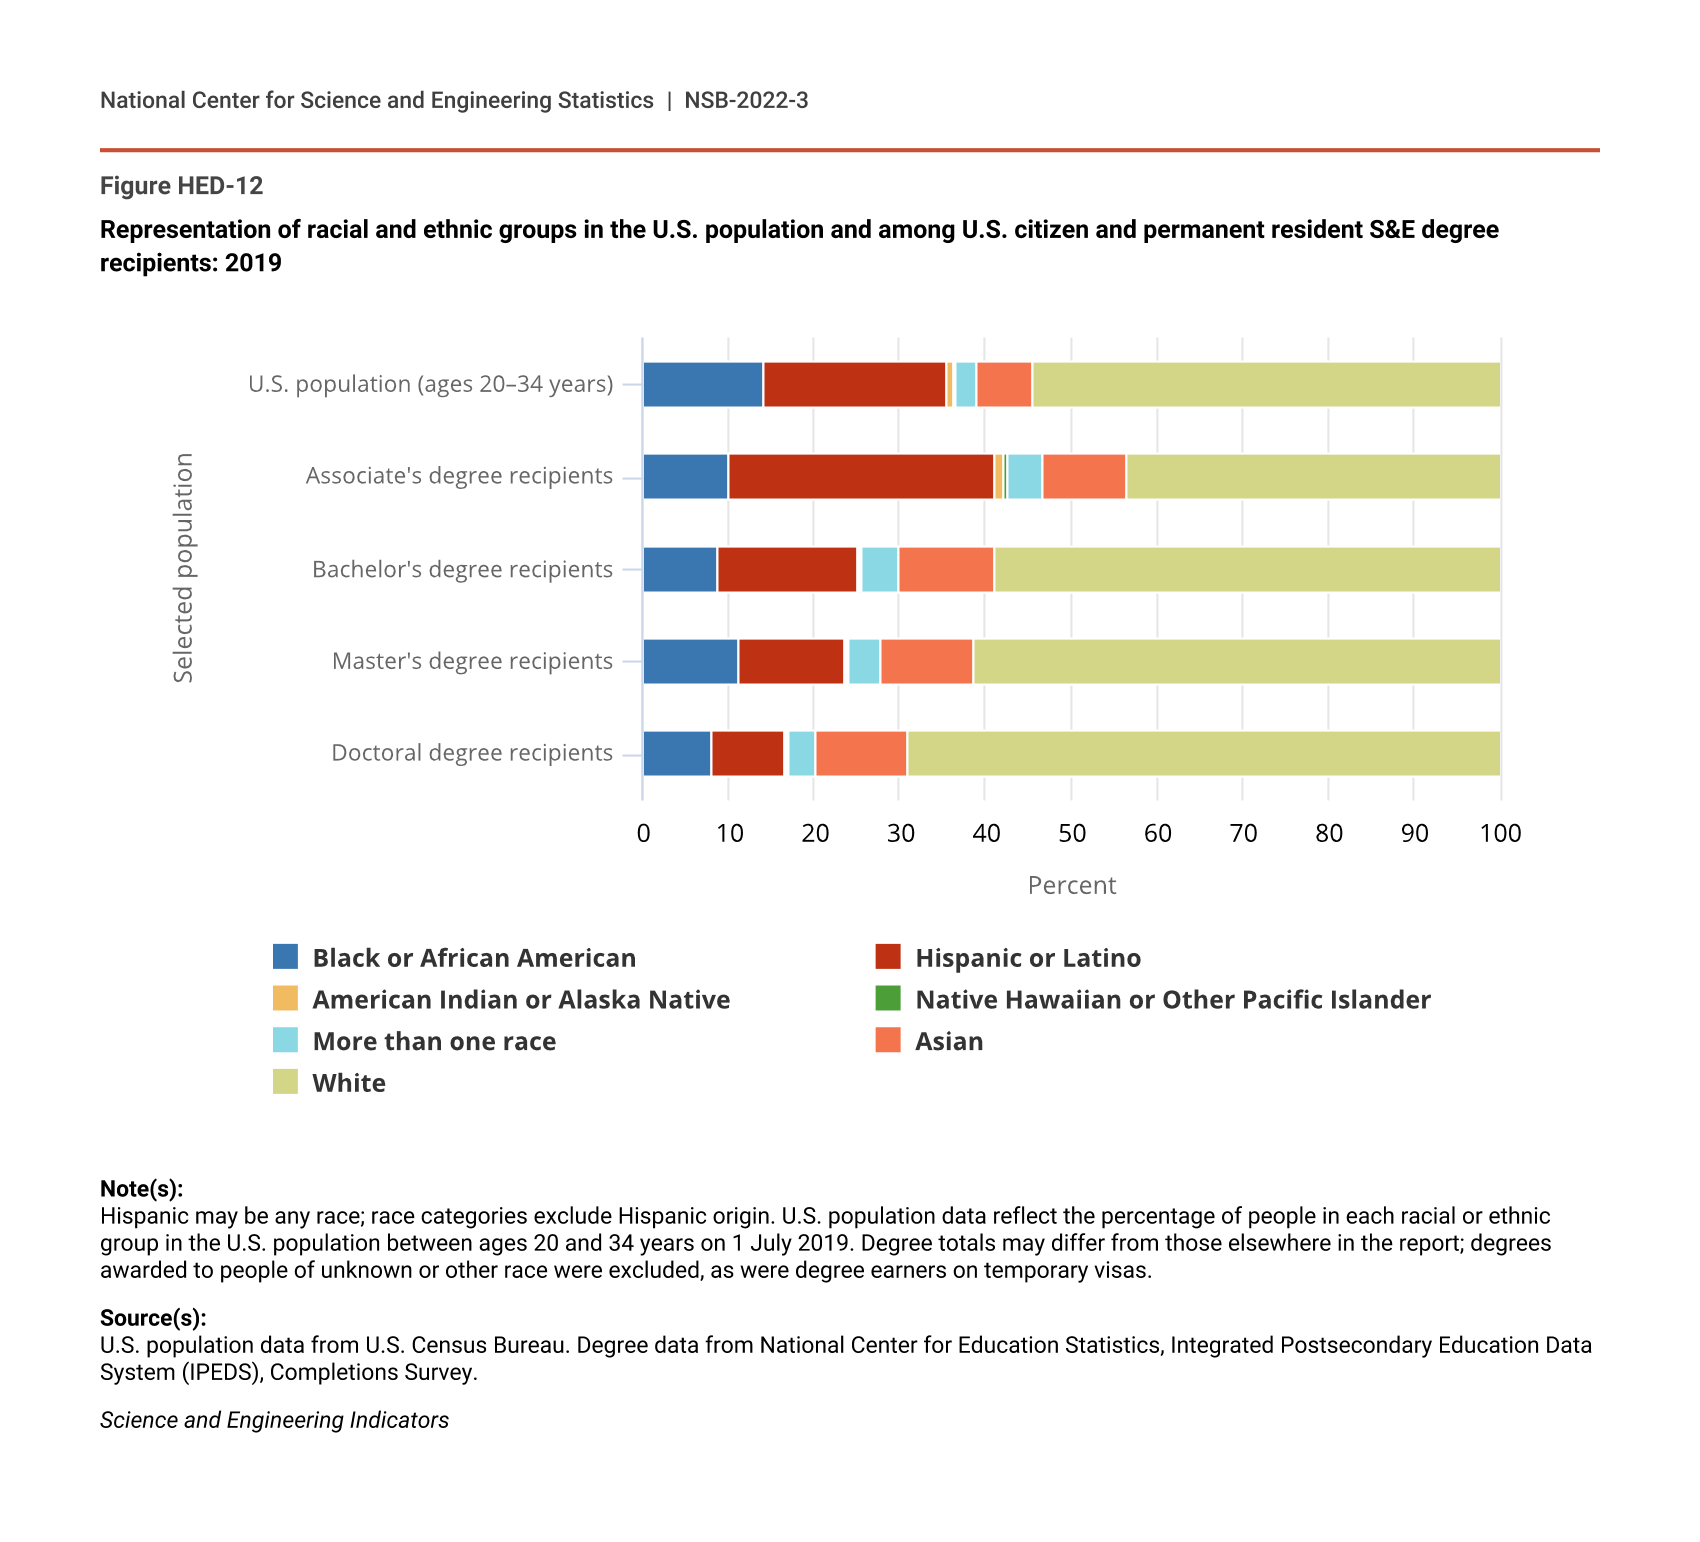
The presence of certain groups among S&E degree recipients differs from their overall representation in the U.S. population (Figure HED-12). Under- or overrepresentation by sex and racial or ethnic group varies by field of study and degree level (NCSES WMPD 2021). For the demographic trends presented in this section, unless otherwise noted, racial and ethnic group totals are compared with totals for U.S. citizens and permanent residents. For sex, the comparison is with totals across all citizenships.
Representation of racial and ethnic groups in the U.S. population and among U.S. citizen and permanent resident S&E degree recipients: 2019
| Selected population | Black or African American | Hispanic or Latino | American Indian or Alaska Native | Native Hawaiian or Other Pacific Islander | More than one race | Asian | White |
|---|---|---|---|---|---|---|---|
| U.S. population (ages 20–34 years) | 14.2 | 21.3 | 0.8 | 0.2 | 2.5 | 6.6 | 54.4 |
| Associate's degree recipients | 10.1 | 31.1 | 1.0 | 0.4 | 4.1 | 9.7 | 43.7 |
| Bachelor's degree recipients | 8.7 | 16.3 | 0.4 | 0.2 | 4.3 | 11.3 | 58.8 |
| Master's degree recipients | 11.3 | 12.2 | 0.4 | 0.2 | 3.6 | 11.1 | 61.2 |
| Doctoral degree recipients | 8.1 | 8.4 | 0.4 | 0.2 | 3.2 | 10.6 | 69.1 |
Note(s):
Hispanic may be any race; race categories exclude Hispanic origin. U.S. population data reflect the percentage of people in each racial or ethnic group in the U.S. population between ages 20 and 34 years on 1 July 2019. Degree totals may differ from those elsewhere in the report; degrees awarded to people of unknown or other race were excluded, as were degree earners on temporary visas.
Source(s):
U.S. population data from U.S. Census Bureau. Degree data from National Center for Education Statistics, Integrated Postsecondary Education Data System (IPEDS), Completions Survey.
Science and Engineering Indicators
S&E Degrees by Sex
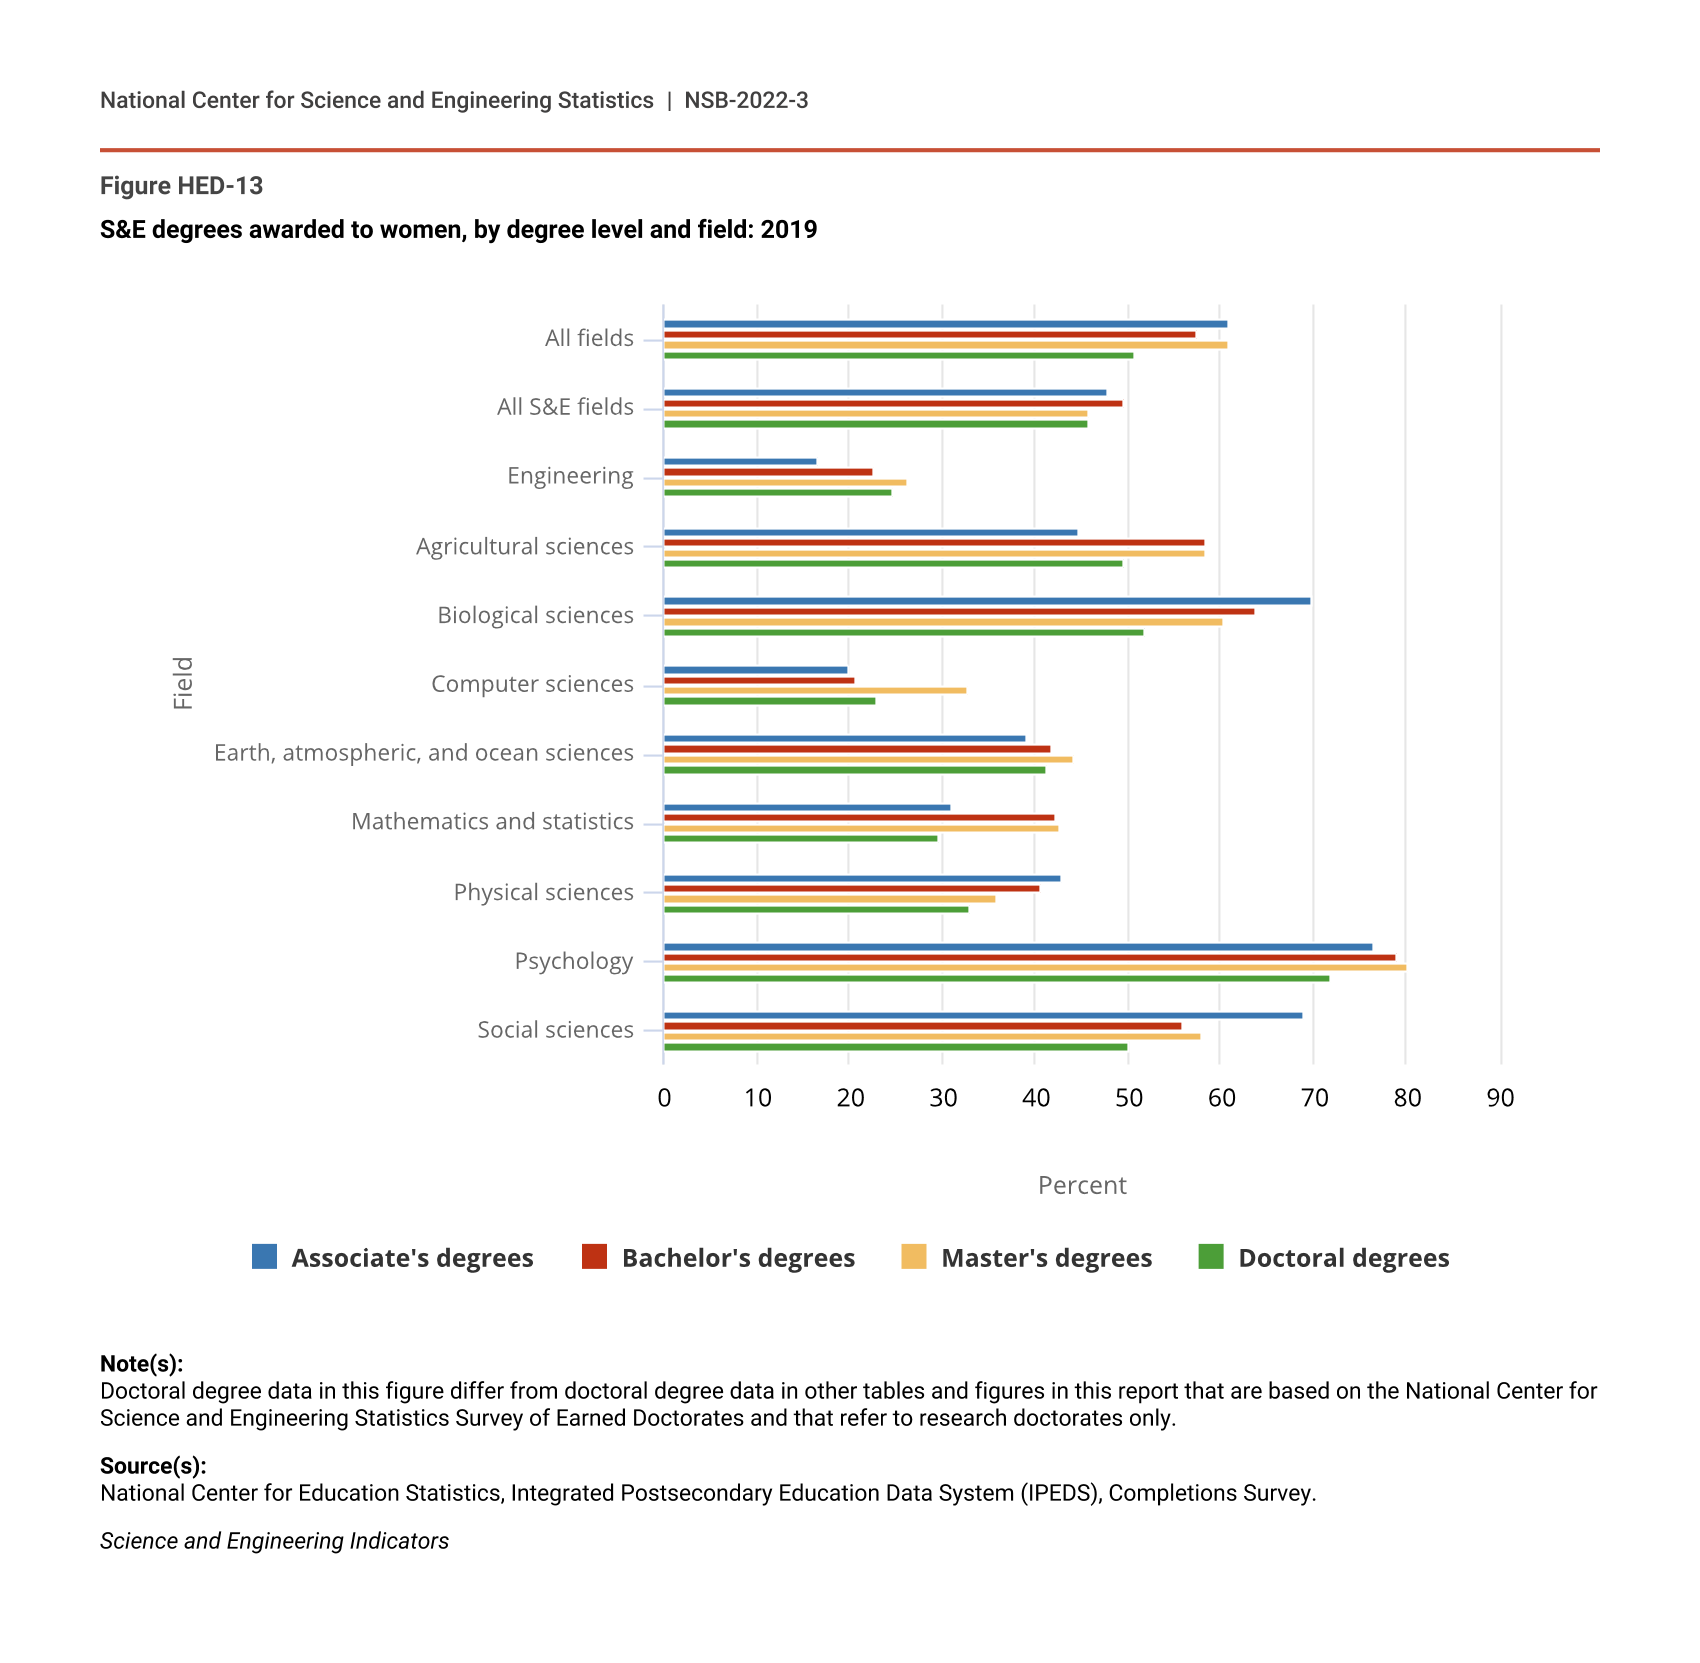
On average, women earn half or more of overall higher education degrees at each level. However, for S&E fields overall, their shares are lower (Figure HED-13). Long-standing differences between men and women have diminished or disappeared in some fields but persist in others.
S&E degrees awarded to women, by degree level and field: 2019
| Field | Associate's degrees | Bachelor's degrees | Master's degrees | Doctoral degrees |
|---|---|---|---|---|
| All fields | 60.8 | 57.4 | 60.9 | 50.8 |
| All S&E fields | 47.7 | 49.7 | 45.8 | 45.8 |
| Engineering | 16.5 | 22.7 | 26.3 | 24.6 |
| Agricultural sciences | 44.6 | 58.3 | 58.4 | 49.7 |
| Biological sciences | 69.8 | 63.7 | 60.3 | 51.9 |
| Computer sciences | 20.0 | 20.6 | 32.8 | 22.9 |
| Earth, atmospheric, and ocean sciences | 39.1 | 41.7 | 44.2 | 41.3 |
| Mathematics and statistics | 30.9 | 42.3 | 42.7 | 29.6 |
| Physical sciences | 42.9 | 40.6 | 35.8 | 32.9 |
| Psychology | 76.5 | 79.1 | 80.2 | 71.8 |
| Social sciences | 69.0 | 55.8 | 57.9 | 50.1 |
Note(s):
Doctoral degree data in this figure differ from doctoral degree data in other tables and figures in this report that are based on the National Center for Science and Engineering Statistics Survey of Earned Doctorates and that refer to research doctorates only.
Source(s):
National Center for Education Statistics, Integrated Postsecondary Education Data System (IPEDS), Completions Survey.
Science and Engineering Indicators
Historically high-participation S&E fields for women include psychology, biological sciences, and social sciences. In 2019, women earned 65% of degrees awarded across all degree levels in these fields. Historically lower-participation S&E fields include engineering; earth, atmospheric, and ocean sciences; mathematics and computer sciences; and physical sciences. In 2019, across all degree levels, women earned higher shares of degrees in earth, atmospheric, and ocean sciences (42%) and physical sciences (39%) than they did in engineering (24%) and mathematics and computer sciences (28%). They also earned 57% of the degrees awarded in agricultural sciences (Table SHED-3, Table SHED-5, Table SHED-6, Table SHED-7).
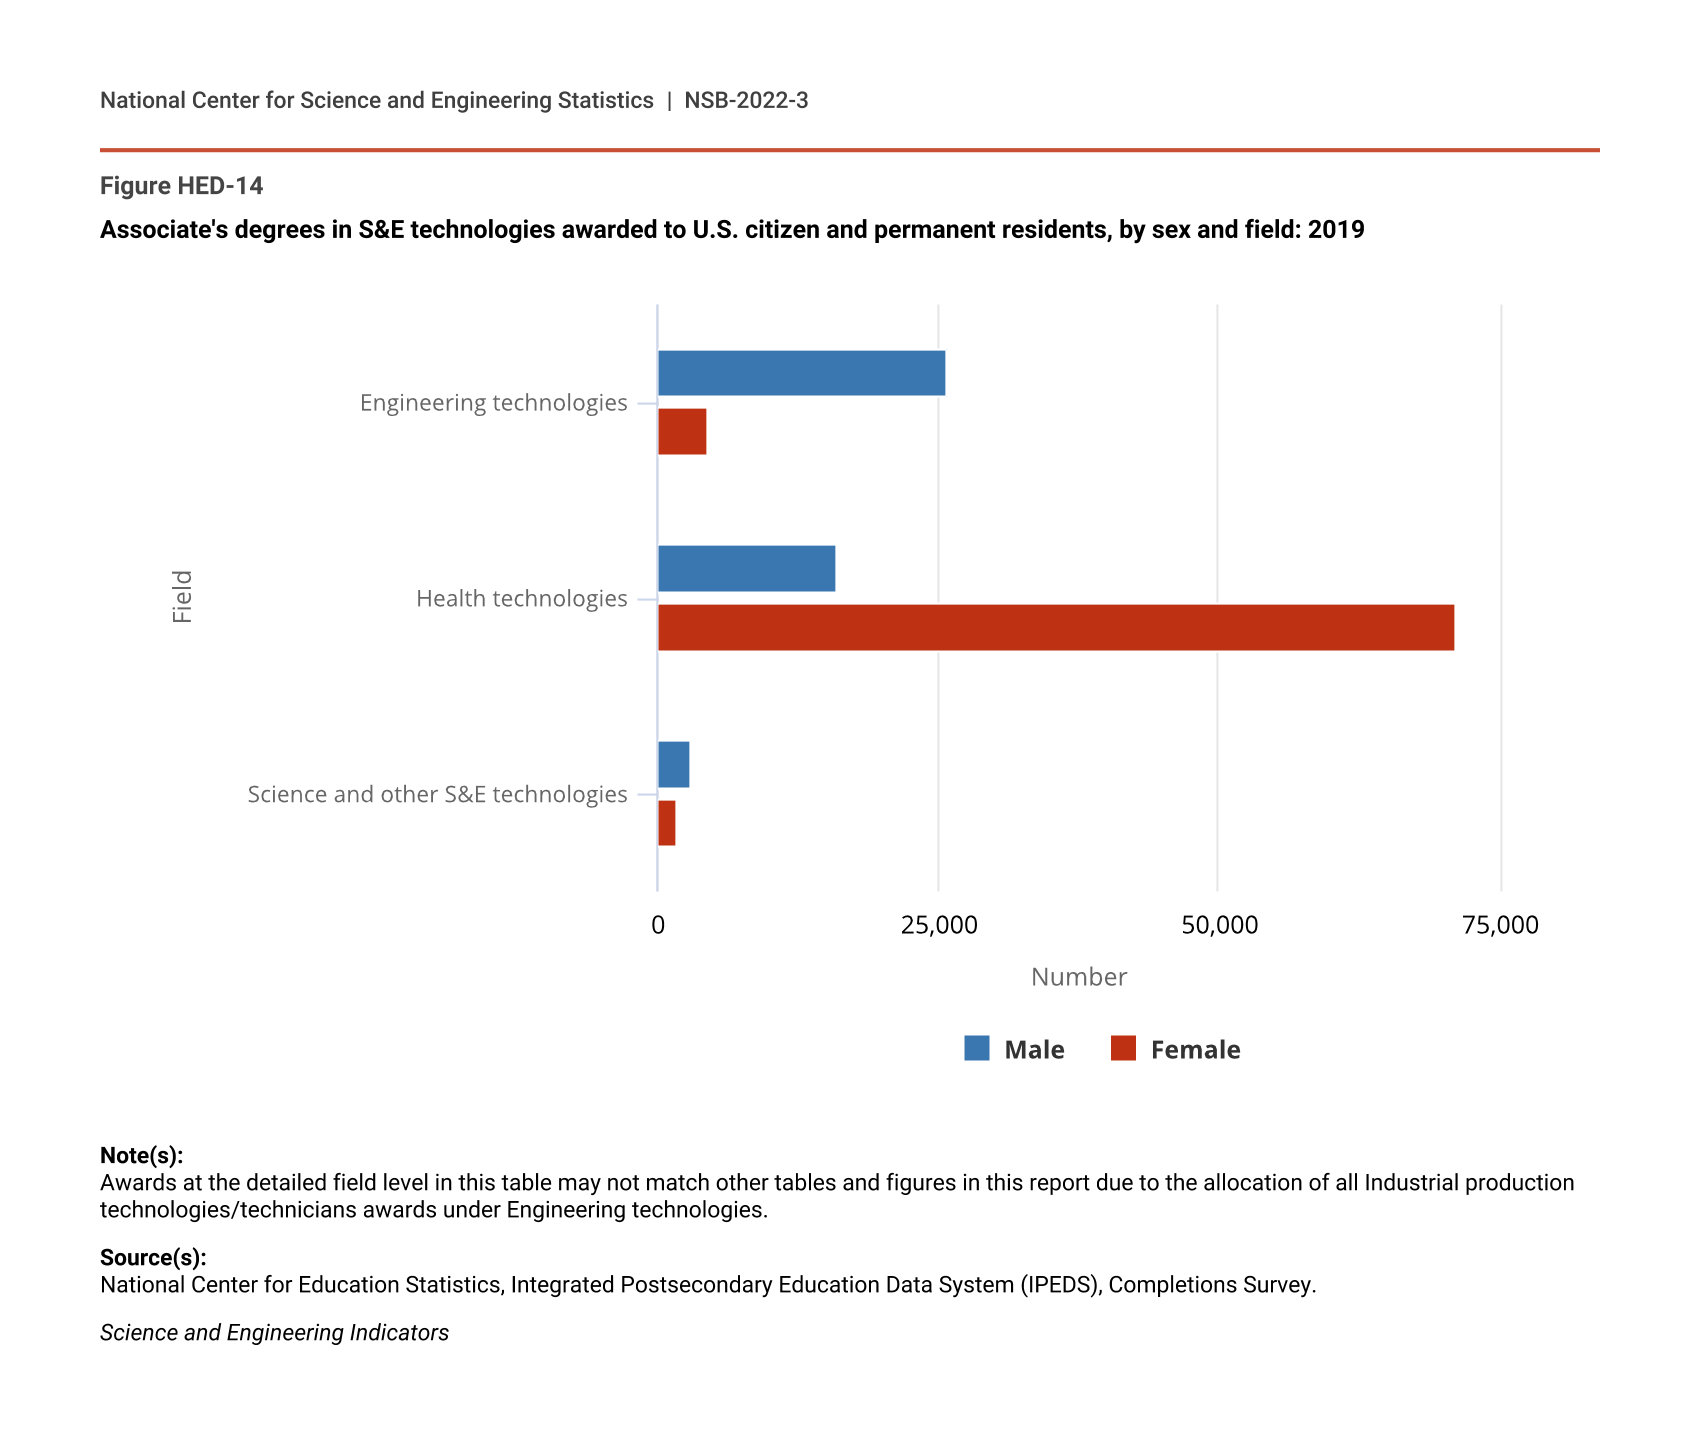
At the associate’s level, women’s share of S&E degrees increased from 43% to 48% from 2011 to 2019 (Table SHED-3). Women earned about three-fourths of the degrees in psychology, biological sciences, and social sciences but only about a fifth of the degrees in engineering and in mathematics and computer sciences. Women earned almost two-thirds of associate’s degrees in S&E technologies (63%), and sex differences by field followed the same pattern as in S&E degrees. In 2019, many more women (72,000) than men (16,000) earned associate’s degrees in health technologies, leading to careers such as nursing. By contrast, more men (26,000) than women (4,600) earned associate’s degrees in engineering technologies, leading to careers such as electronics maintenance and repair (Figure HED-14; Table SHED-8).
Associate's degrees in S&E technologies awarded to U.S. citizen and permanent residents, by sex and field: 2019
| Field | Male | Female |
|---|---|---|
| Engineering technologies | 25,800 | 4,506 |
| Health technologies | 15,894 | 71,154 |
| Science and other S&E technologies | 2,898 | 1,751 |
Note(s):
Awards at the detailed field level in this table may not match other tables and figures in this report due to the allocation of all Industrial production technologies/technicians awards under Engineering technologies.
Source(s):
National Center for Education Statistics, Integrated Postsecondary Education Data System (IPEDS), Completions Survey.
Science and Engineering Indicators
At the bachelor’s level, women’s share of S&E degrees remained stable at about half since 2011, although the trend over time varied across fields (Table SHED-5). For example, in agricultural sciences, degrees earned by both men and women increased; however, degrees earned by women grew faster, resulting in an overall increase in women’s share from 52% to 58%. In the rapidly growing but still male-dominated field of engineering, women’s share of total bachelor’s degrees increased from 19% to 23% from 2011 to 2019. In physical sciences, by contrast, the increase in bachelor’s degrees earned by women and men was almost identical, and women’s share of degrees earned remained stable at 41%.
Women earned about 45% of master’s degrees in S&E each year from 2011 to 2019 (Table SHED-6). In mathematics and computer sciences, degrees earned by both men and women increased rapidly. With faster growth, women’s share of degrees in these fields increased from 31% to 35%. Similarly, biological sciences experienced substantial growth in degrees earned, with women’s gain outpacing that of men and raising women’s share from 57% to 60%.
Trends in doctoral degrees broadly mirrored those at other degree levels; women increased their share of S&E degrees from 44% to 46% from 2011 to 2019 (Table SHED-7). Women earned more than half of doctorates in most social sciences fields and in biological and medical sciences. Women earned about a quarter of doctoral degrees in engineering in 2019, up from 22% in 2011. Women also earned relatively low shares of doctoral degrees in computer sciences (23%) and in mathematics and statistics (30%), although they increased their share of degrees in these fields by a couple of percentage points.
S&E Degrees by Race and Ethnicity
The racial and ethnic composition of degree recipients has changed over time, reflecting population shifts and increasing rates of higher education attainment by members of underrepresented minority groups. Racial and ethnic groups vary in S&E degree attainment levels, and while the gap in educational attainment has narrowed, it remains (Figure HED-12). These differences in educational attainment reflect lower rates of high school completion, college enrollment, and degree completion. (For information on immediate post–high school college enrollment rates, see the Indicators 2022 report “Elementary and Secondary STEM Education.”)
In 2019, Hispanics constituted 21% of the U.S. population ages 20–34 (a typical age range for higher education degree earners) but earned 16% of the S&E postsecondary degrees awarded that year across all degree levels. Blacks constituted 14% of the U.S. population ages 20–34 years but earned 9% of S&E degrees awarded. American Indians or Alaska Natives were 0.8% of the U.S. population and earned 0.4% of all S&E degrees awarded. These three groups are underrepresented in educational attainment. Asians constituted 7% of persons ages 20–34 and earned 11% of total S&E degrees conferred across all degree levels in 2019, while Whites constituted 54% of this age group and earned 58% of S&E degrees (Figure HED-12).
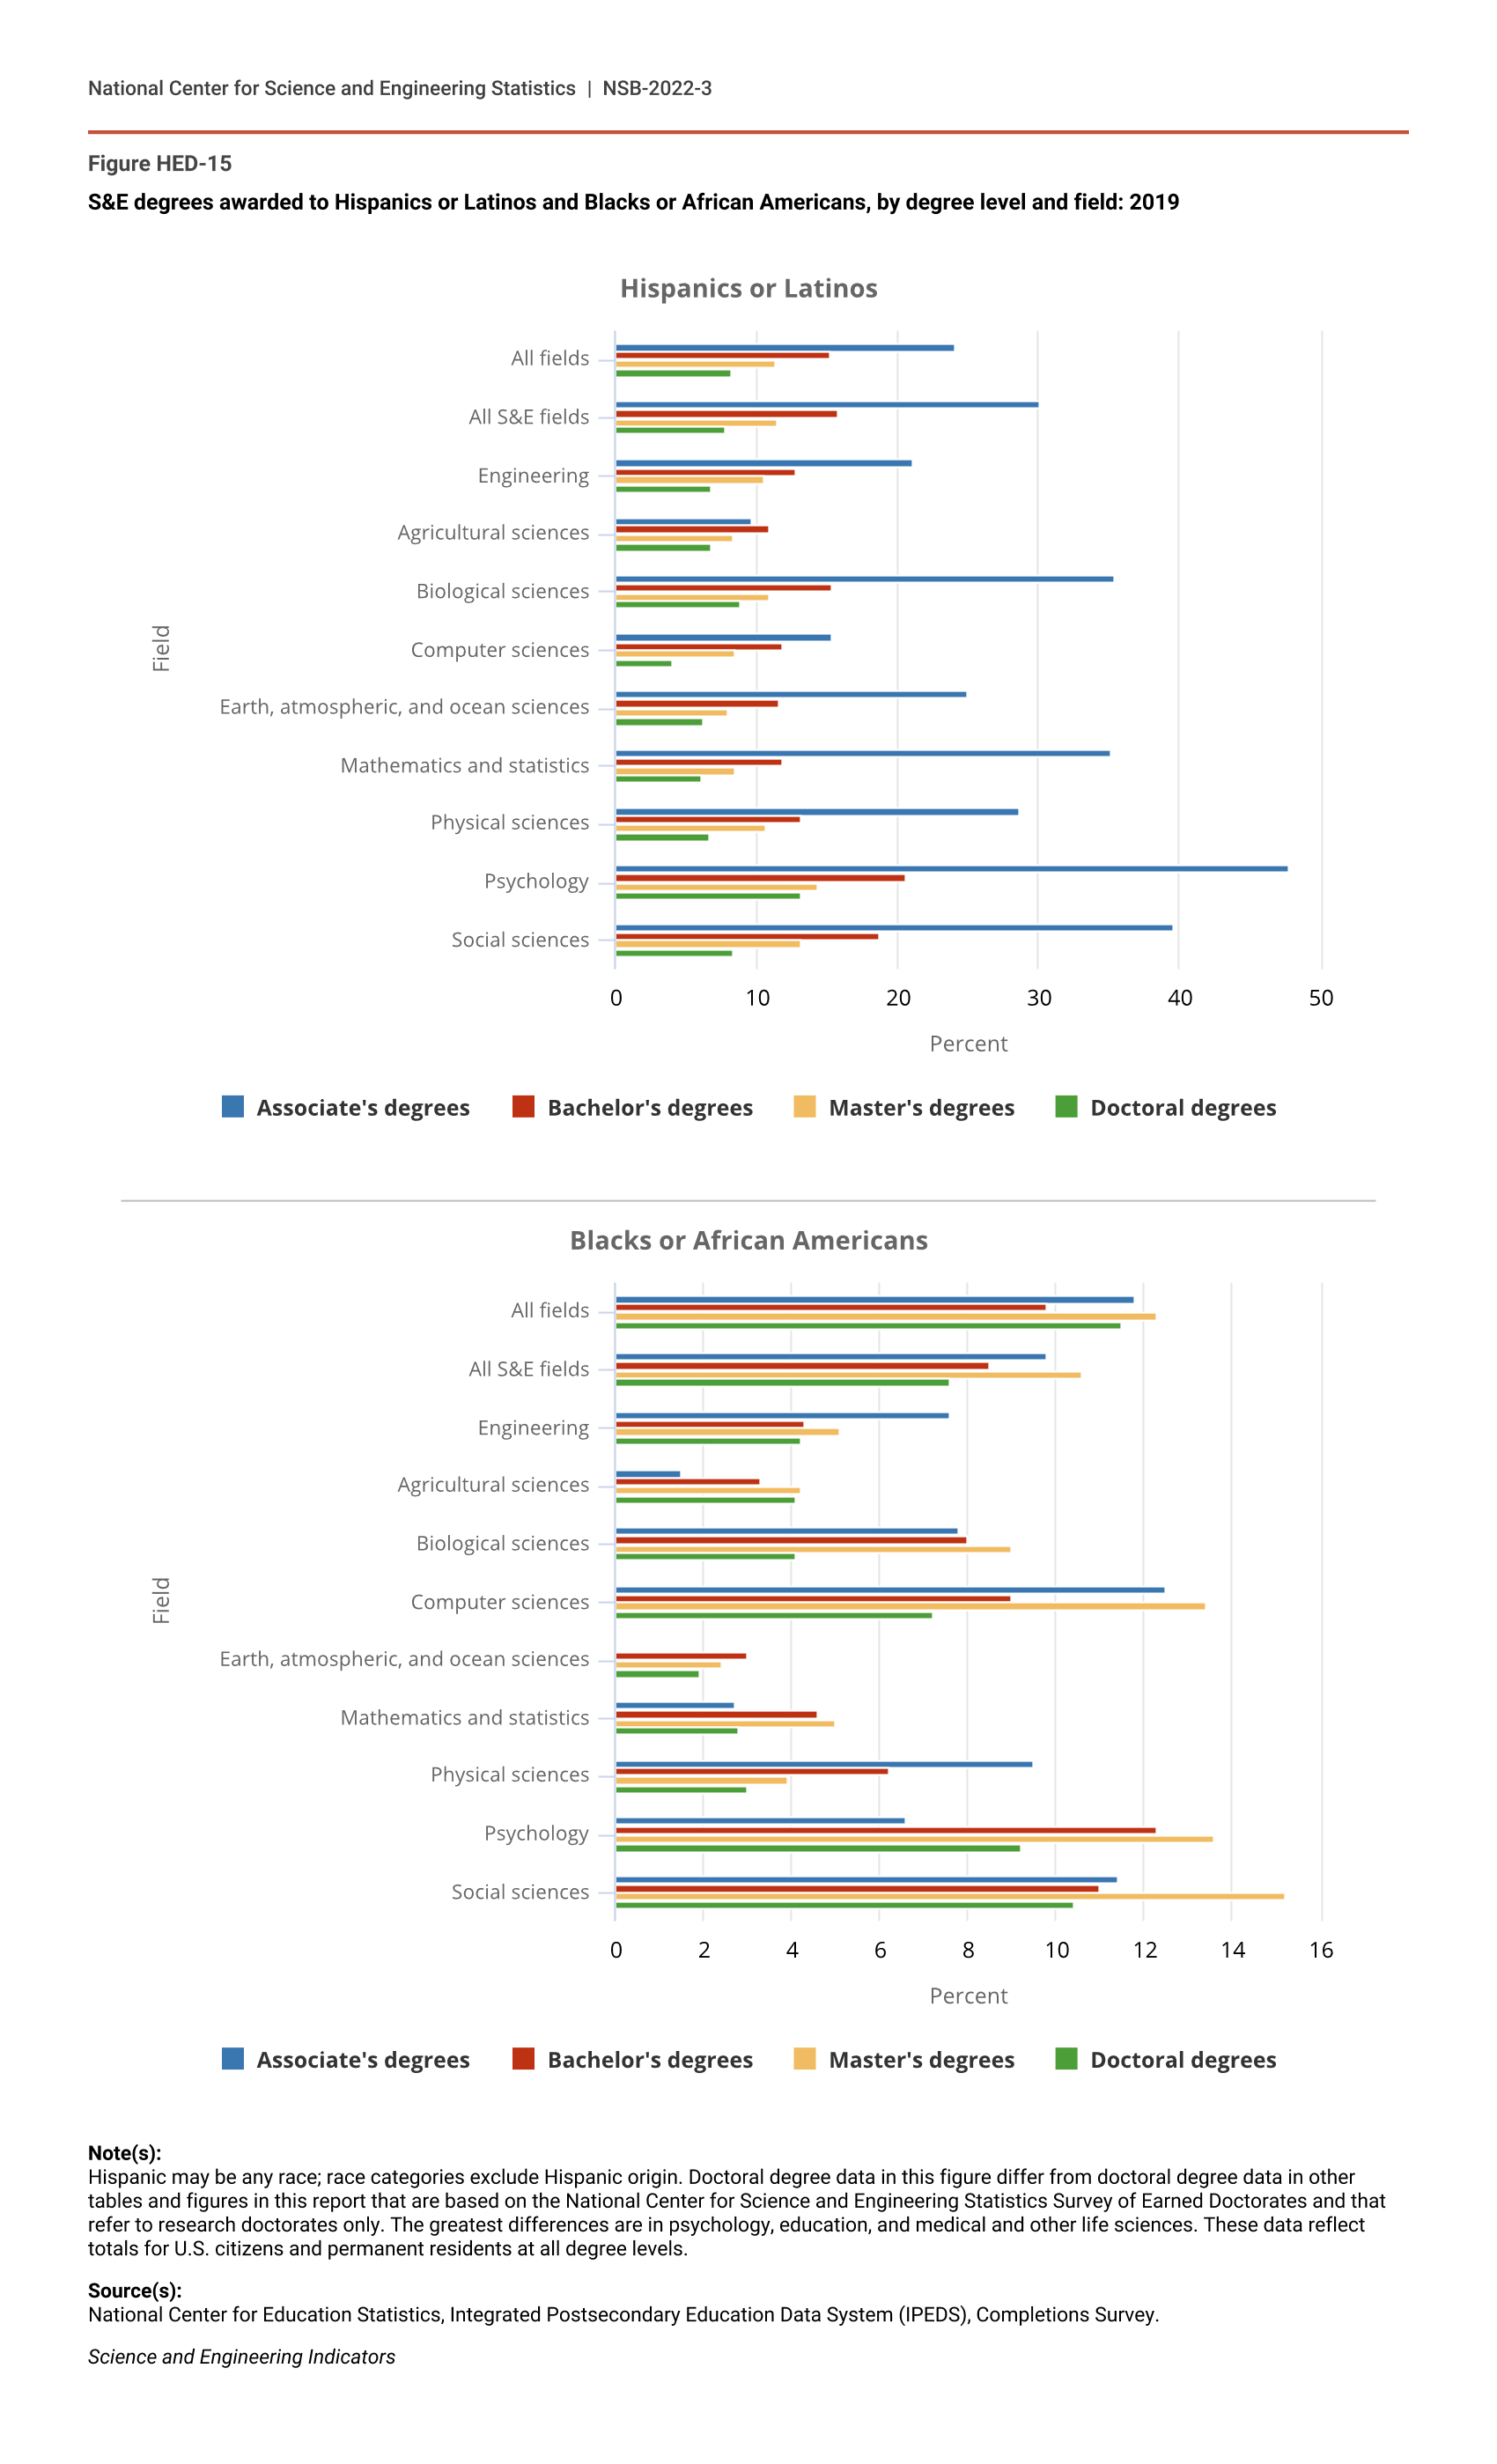
In most fields, Hispanics earn substantially larger proportions of S&E associate’s degrees than bachelor’s and higher degrees (Figure HED-15). S&E associate’s degrees earned by Hispanics tripled from 2011 to 2019 as they increased their share from 13% to 30%. Asians more than doubled their earned S&E associate’s degrees and increased their share from 5% to 9%. There was much slower growth for Blacks (3%) and Whites (3%), and both dropped in their shares of S&E associate’s degrees earned. American Indians or Alaska Natives earned fewer S&E associate’s degrees in 2019 than they did in 2011 (Table SHED-3).
S&E degrees awarded to Hispanics or Latinos and Blacks or African Americans, by degree level and field: 2019
| Field | Associate's degrees | Bachelor's degrees | Master's degrees | Doctoral degrees |
|---|---|---|---|---|
| All fields | 24.1 | 15.2 | 11.3 | 8.2 |
| All S&E fields | 30.1 | 15.7 | 11.4 | 7.8 |
| Engineering | 21.1 | 12.8 | 10.5 | 6.8 |
| Agricultural sciences | 9.7 | 10.9 | 8.3 | 6.8 |
| Biological sciences | 35.4 | 15.3 | 10.9 | 8.9 |
| Computer sciences | 15.3 | 11.9 | 8.5 | 4.0 |
| Earth, atmospheric, and ocean sciences | 25.0 | 11.6 | 8.0 | 6.2 |
| Mathematics and statistics | 35.1 | 11.8 | 8.5 | 6.1 |
| Physical sciences | 28.6 | 13.1 | 10.7 | 6.6 |
| Psychology | 47.8 | 20.6 | 14.3 | 13.1 |
| Social sciences | 39.6 | 18.8 | 13.1 | 8.3 |
| Field | Associate's degrees | Bachelor's degrees | Master's degrees | Doctoral degrees |
|---|---|---|---|---|
| All fields | 11.8 | 9.8 | 12.3 | 11.5 |
| All S&E fields | 9.8 | 8.5 | 10.6 | 7.6 |
| Engineering | 7.6 | 4.3 | 5.1 | 4.2 |
| Agricultural sciences | 1.5 | 3.3 | 4.2 | 4.1 |
| Biological sciences | 7.8 | 8.0 | 9.0 | 4.1 |
| Computer sciences | 12.5 | 9.0 | 13.4 | 7.2 |
| Earth, atmospheric, and ocean sciences | 0.0 | 3.0 | 2.4 | 1.9 |
| Mathematics and statistics | 2.7 | 4.6 | 5.0 | 2.8 |
| Physical sciences | 9.5 | 6.2 | 3.9 | 3.0 |
| Psychology | 6.6 | 12.3 | 13.6 | 9.2 |
| Social sciences | 11.4 | 11.0 | 15.2 | 10.4 |
Note(s):
Hispanic may be any race; race categories exclude Hispanic origin. Doctoral degree data in this figure differ from doctoral degree data in other tables and figures in this report that are based on the National Center for Science and Engineering Statistics Survey of Earned Doctorates and that refer to research doctorates only. The greatest differences are in psychology, education, and medical and other life sciences. These data reflect totals for U.S. citizens and permanent residents at all degree levels.
Source(s):
National Center for Education Statistics, Integrated Postsecondary Education Data System (IPEDS), Completions Survey.
Science and Engineering Indicators
Whites, Blacks, American Indians or Alaska Natives, and Native Hawaiian or Other Pacific Islanders all earned fewer associate’s degrees in S&E technologies in 2019 than they did in 2011, while Hispanics and Asians increased their numbers (Table SHED-3). Of degrees awarded in practical nursing in 2019, 45% went to Hispanics; almost 30% of degrees in mental and social health services went to Blacks (Table SHED-8).
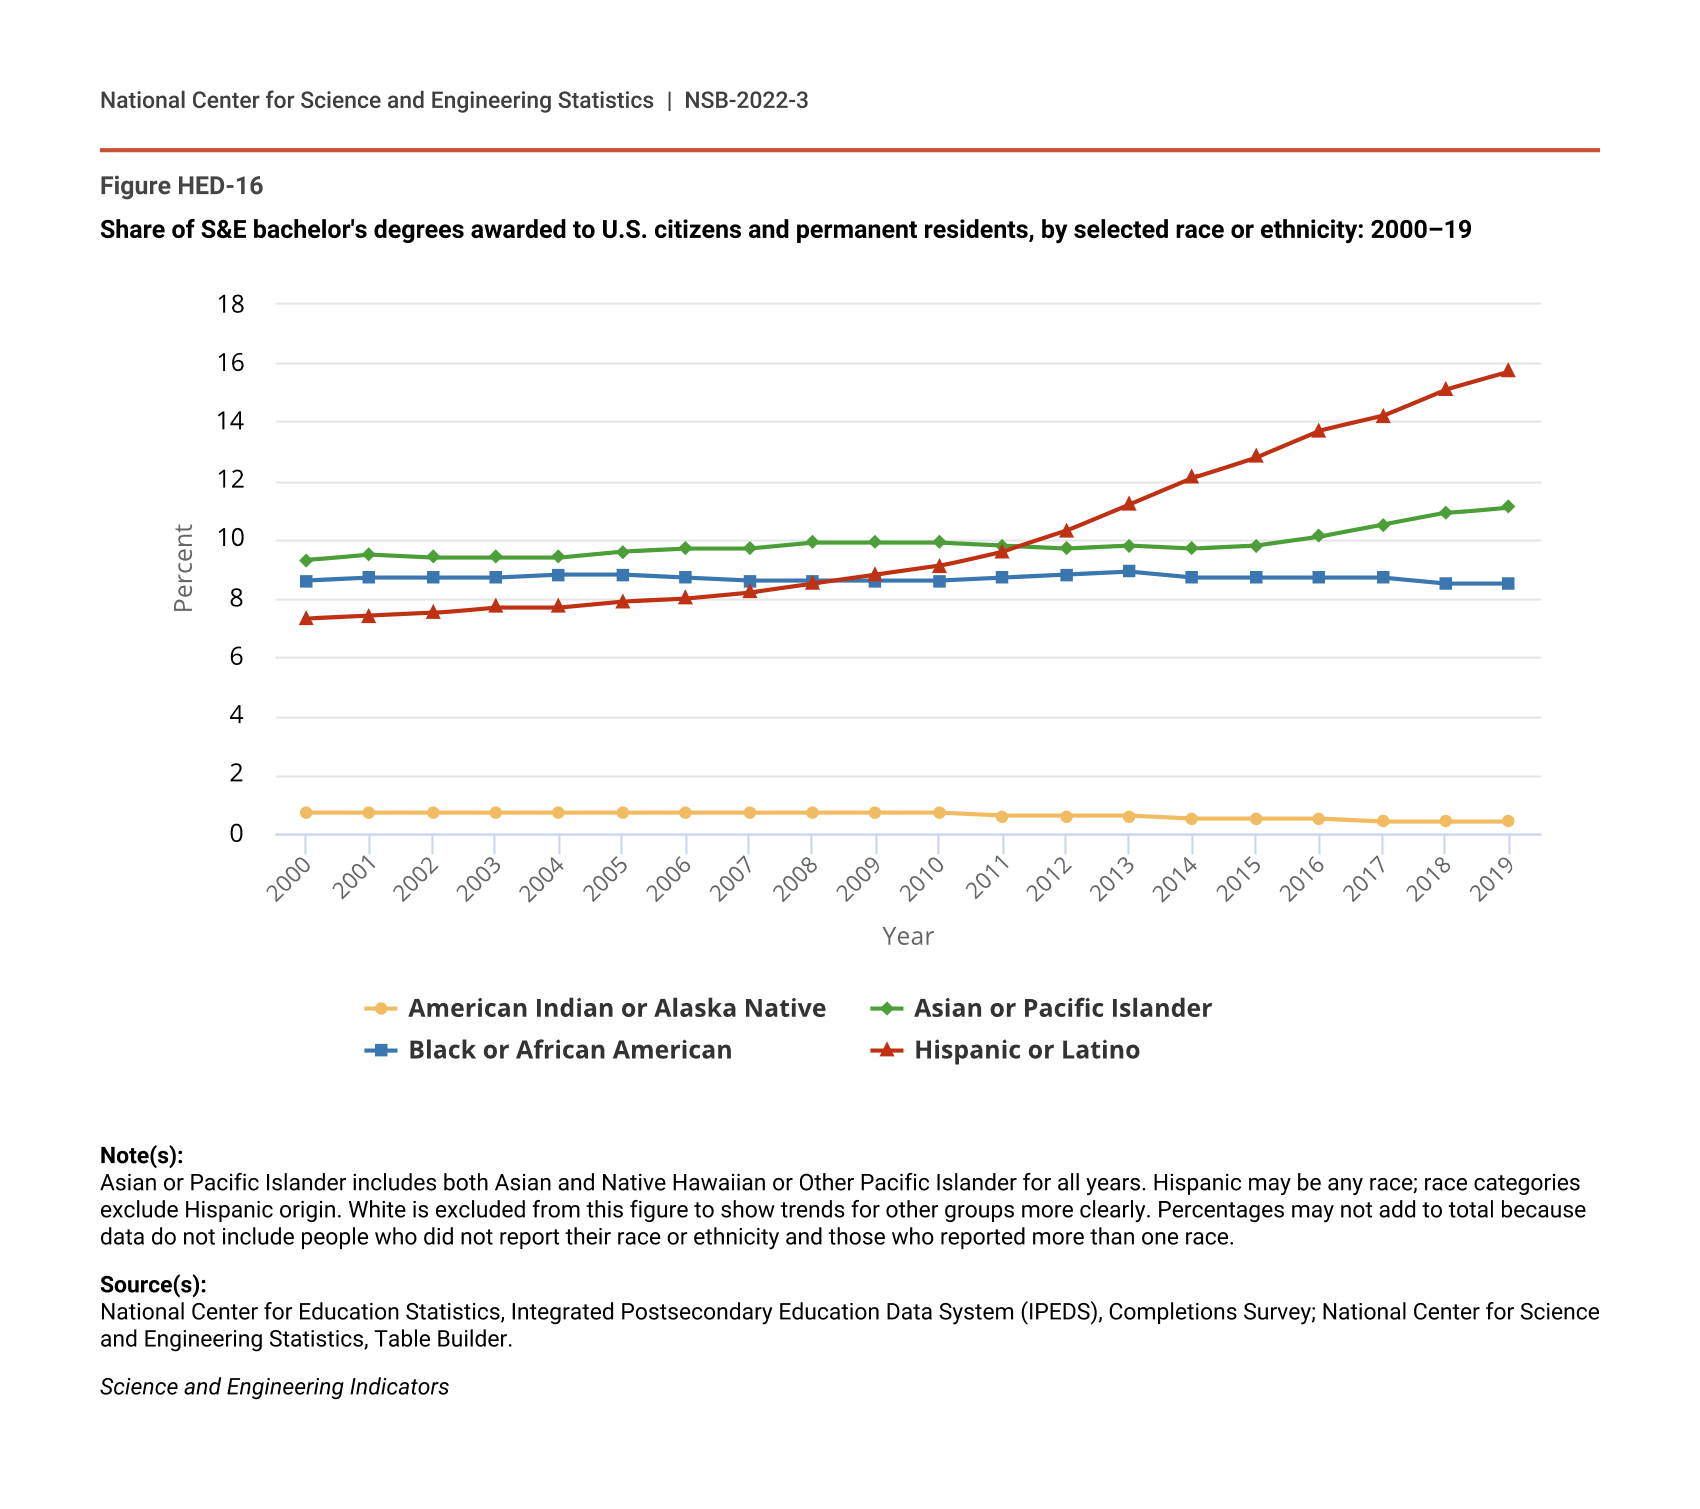
Since 2011, the share of S&E bachelor’s degrees awarded annually to Hispanic students rose from 10% to 16%, while the share awarded to Black students declined slightly. The share awarded to Asians increased, and the share awarded to American Indians or Alaska Natives dropped (Figure HED-16). While the number of S&E bachelor’s degrees earned by White students increased from 2011 to 2019, their overall share declined.
Share of S&E bachelor's degrees awarded to U.S. citizens and permanent residents, by selected race or ethnicity: 2000–19
| Year | American Indian or Alaska Native | Asian or Pacific Islander | Black or African American | Hispanic or Latino |
|---|---|---|---|---|
| 2000 | 0.7 | 9.3 | 8.6 | 7.3 |
| 2001 | 0.7 | 9.5 | 8.7 | 7.4 |
| 2002 | 0.7 | 9.4 | 8.7 | 7.5 |
| 2003 | 0.7 | 9.4 | 8.7 | 7.7 |
| 2004 | 0.7 | 9.4 | 8.8 | 7.7 |
| 2005 | 0.7 | 9.6 | 8.8 | 7.9 |
| 2006 | 0.7 | 9.7 | 8.7 | 8.0 |
| 2007 | 0.7 | 9.7 | 8.6 | 8.2 |
| 2008 | 0.7 | 9.9 | 8.6 | 8.5 |
| 2009 | 0.7 | 9.9 | 8.6 | 8.8 |
| 2010 | 0.7 | 9.9 | 8.6 | 9.1 |
| 2011 | 0.6 | 9.8 | 8.7 | 9.6 |
| 2012 | 0.6 | 9.7 | 8.8 | 10.3 |
| 2013 | 0.6 | 9.8 | 8.9 | 11.2 |
| 2014 | 0.5 | 9.7 | 8.7 | 12.1 |
| 2015 | 0.5 | 9.8 | 8.7 | 12.8 |
| 2016 | 0.5 | 10.1 | 8.7 | 13.7 |
| 2017 | 0.4 | 10.5 | 8.7 | 14.2 |
| 2018 | 0.4 | 10.9 | 8.5 | 15.1 |
| 2019 | 0.4 | 11.1 | 8.5 | 15.7 |
Note(s):
Asian or Pacific Islander includes both Asian and Native Hawaiian or Other Pacific Islander for all years. Hispanic may be any race; race categories exclude Hispanic origin. White is excluded from this figure to show trends for other groups more clearly. Percentages may not add to total because data do not include people who did not report their race or ethnicity and those who reported more than one race.
Source(s):
National Center for Education Statistics, Integrated Postsecondary Education Data System (IPEDS), Completions Survey; National Center for Science and Engineering Statistics, Table Builder.
Science and Engineering Indicators
At the master’s level, most racial or ethnic groups earned more S&E degrees in 2019 than in 2011 (Table SHED-6). The number of S&E master’s degrees earned by Hispanics increased the most, and the Hispanic share of total S&E master’s degrees increased from 8% to 11%. Asians increased their share of S&E master’s degrees from 9% to 10%. Blacks earned 30% more S&E master’s degrees in 2019 than in 2011 and increased their share from 10% to 11%. By contrast, American Indians or Alaska Natives earned numerically fewer master’s degrees in S&E in 2019 than in 2011. Social sciences and psychology were the top two master’s fields for all race or ethnicity groups except Asians, who more frequently earned master’s degrees in computer sciences and biology. Engineering master’s degrees as a percentage of all S&E degrees earned by each racial or ethnic group were highest for Asians (28%), followed by Whites (21%), Hispanics (18%), American Indians or Alaska Natives (12%), and Blacks (9%).
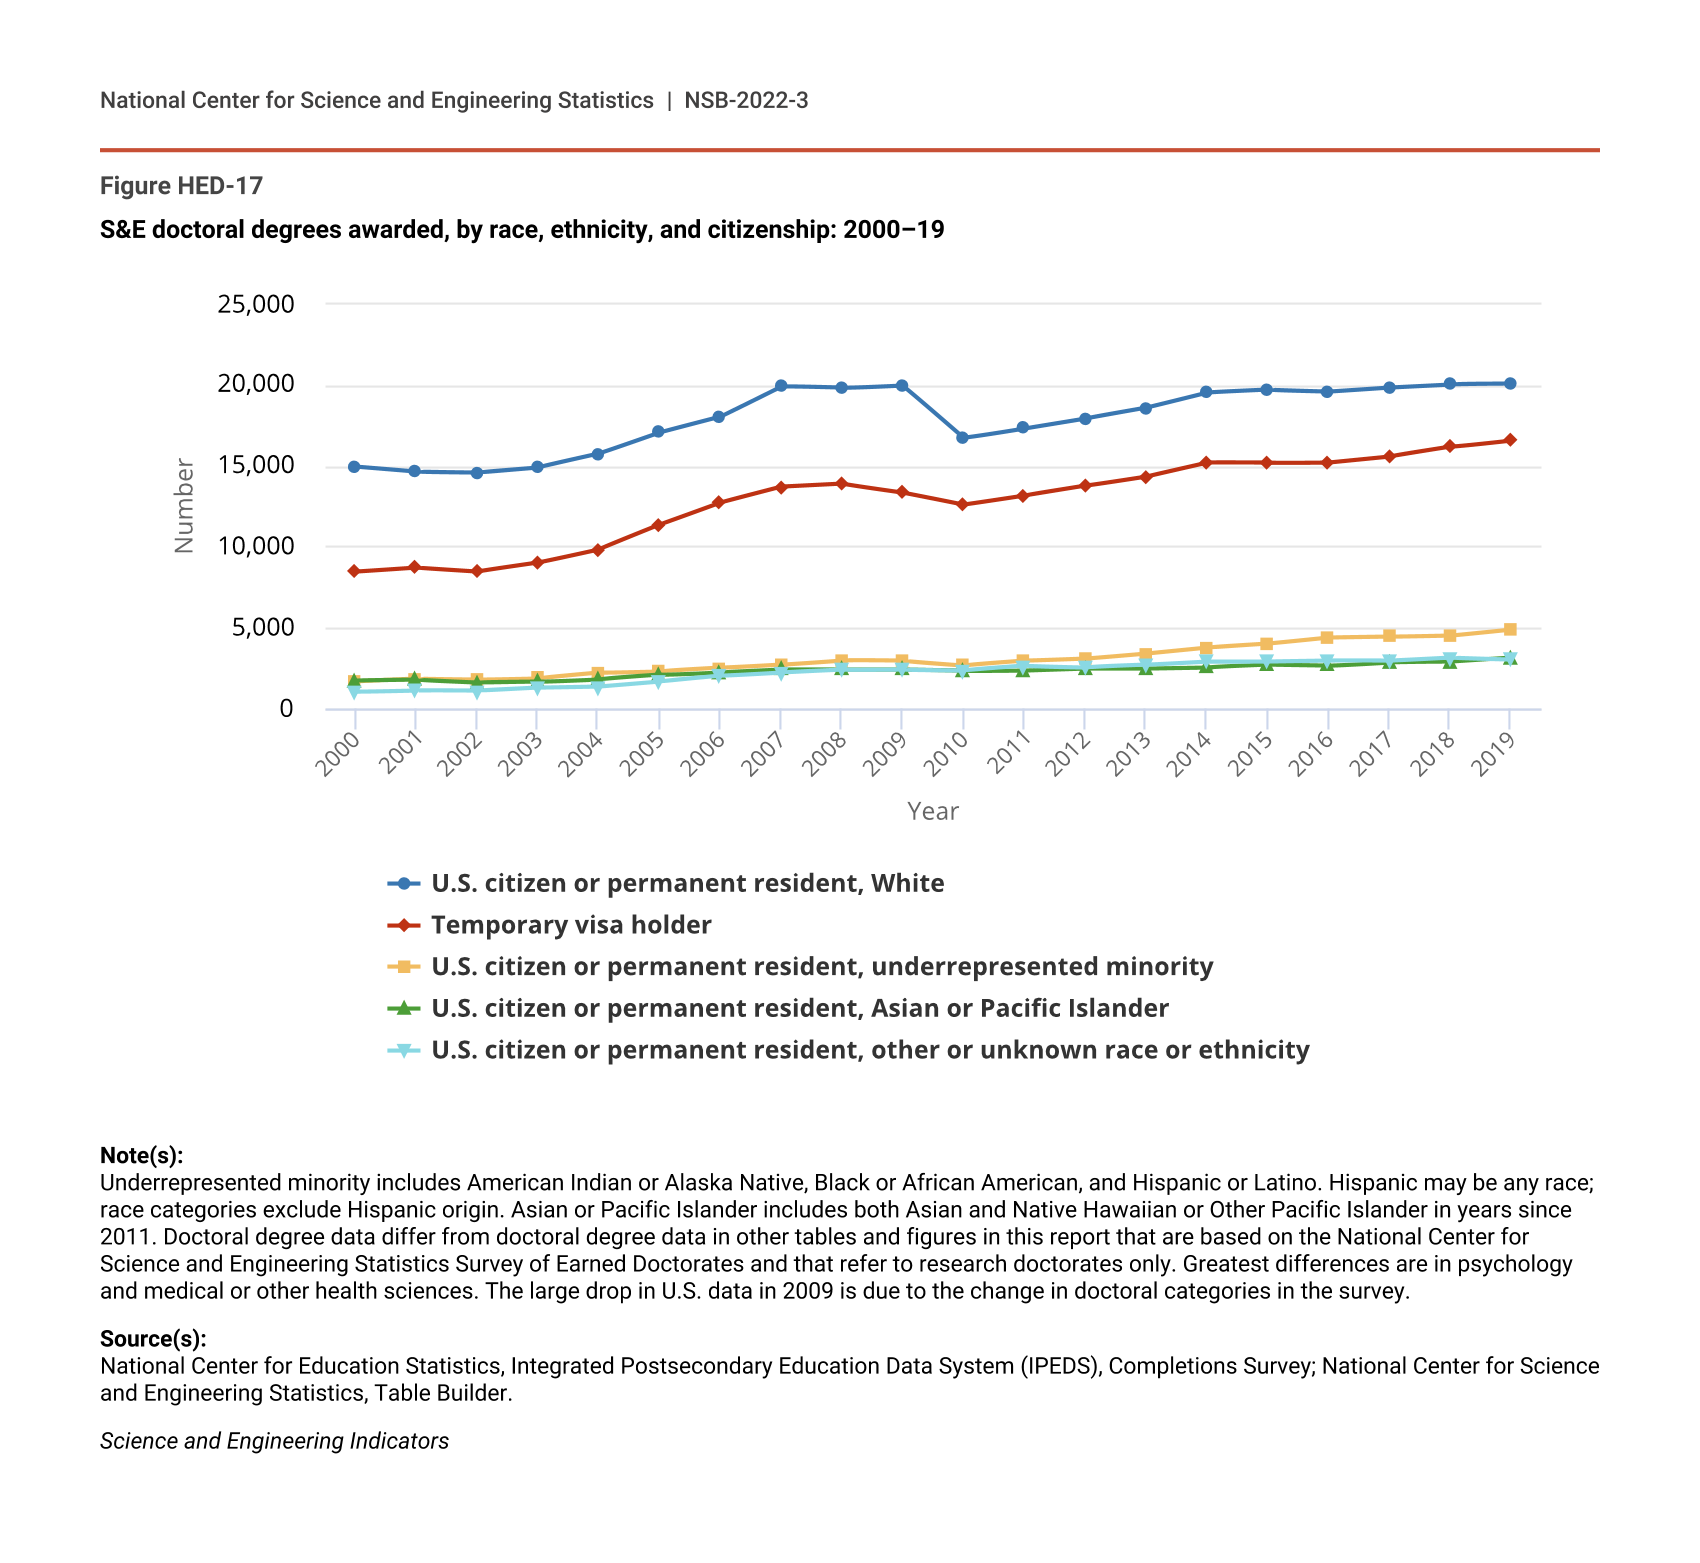
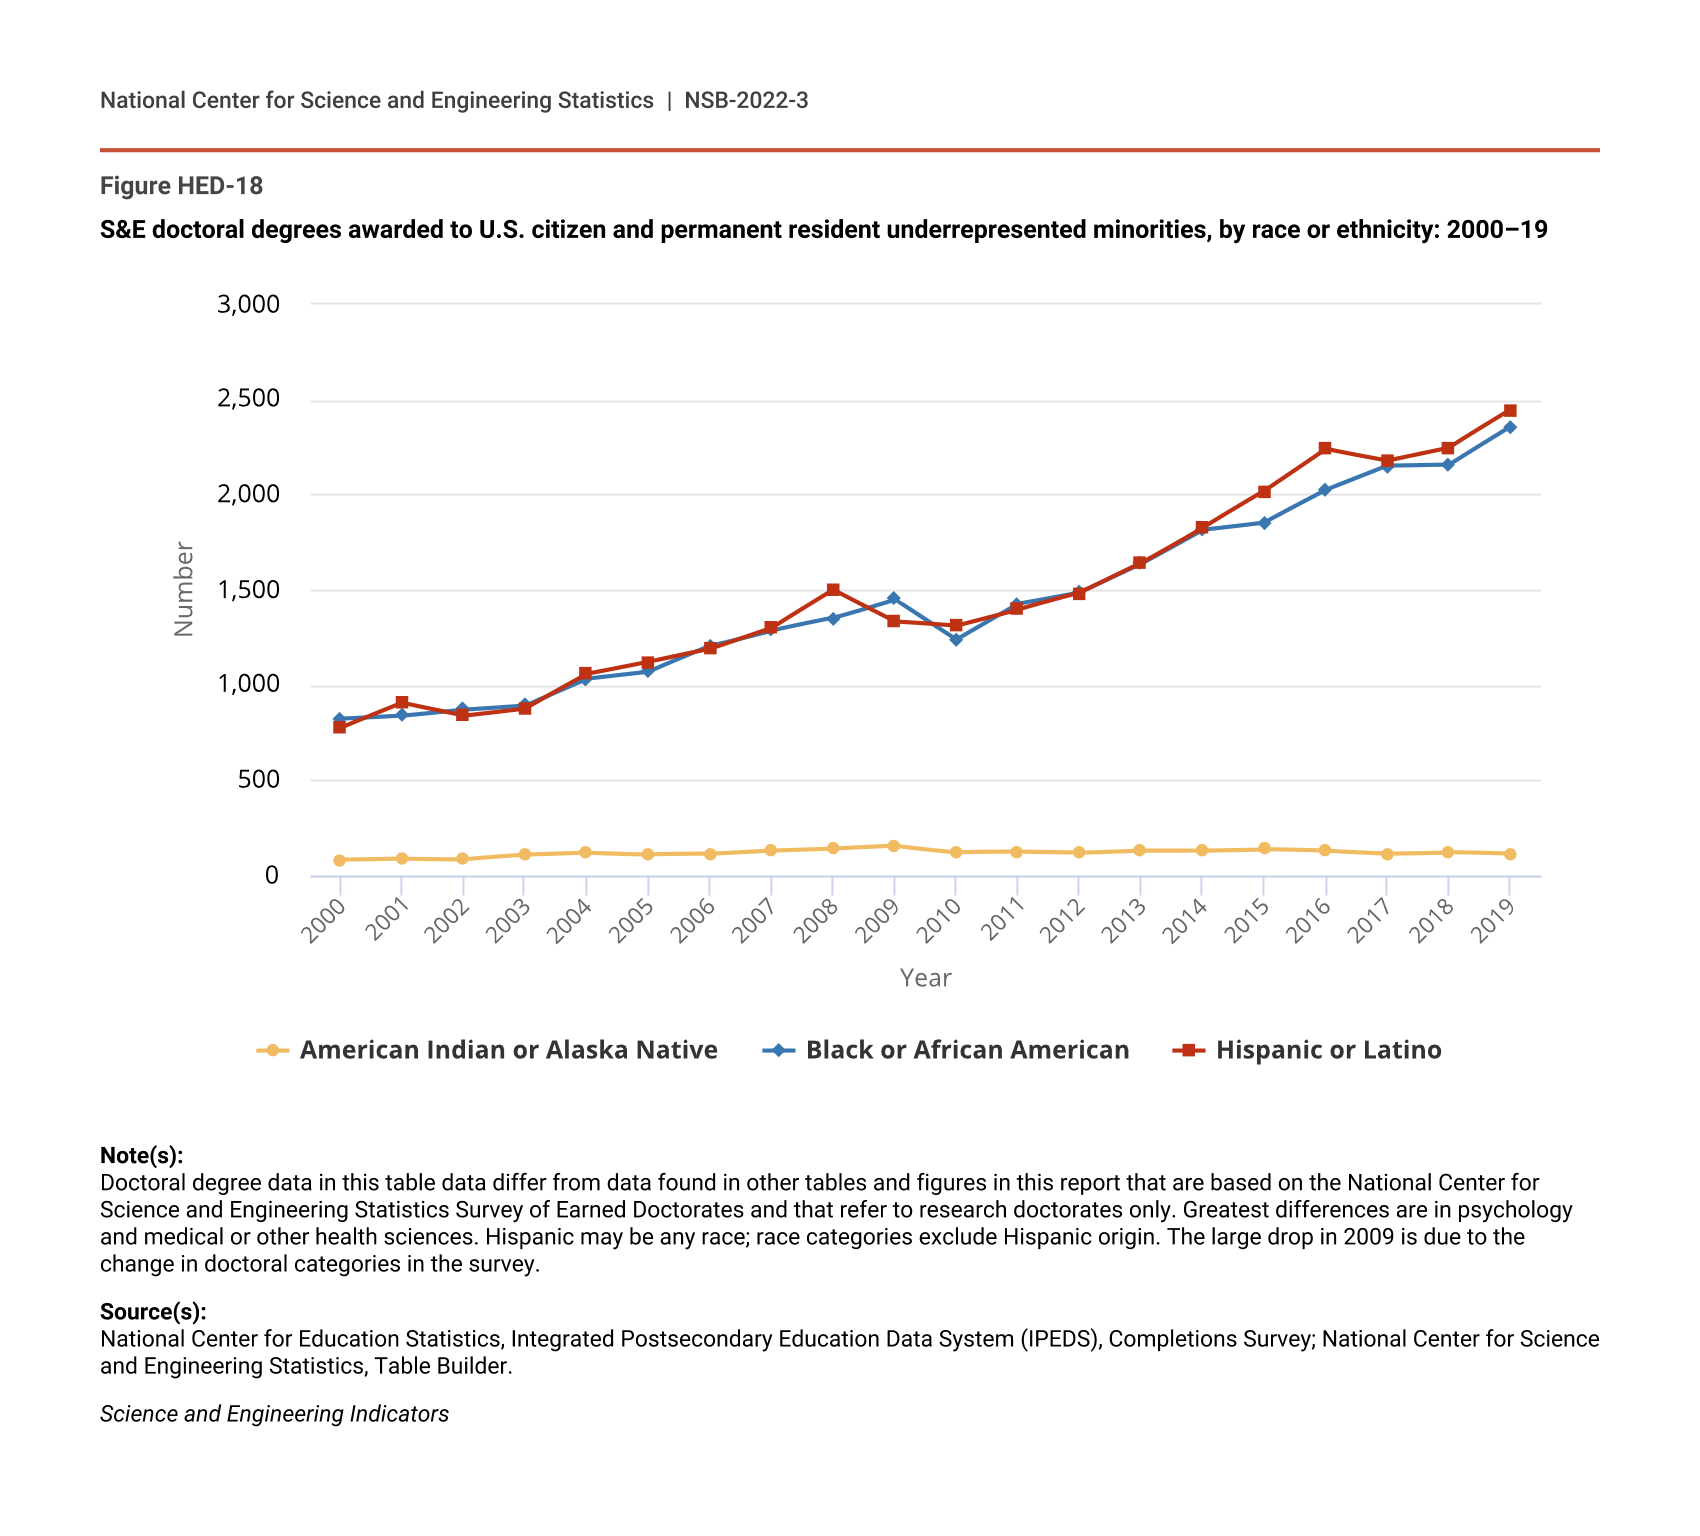
Many of these trends are similar for doctoral degree awards. Underrepresented minorities as a group—Blacks, Hispanics, and American Indians or Alaska Natives—earned more S&E doctorates in 2019 compared with 2011 (Figure HED-17 and Figure HED-18; Table SHED-7). In 2019, underrepresented minorities collectively earned 16% of S&E doctorates (up from 12% in 2011). In comparison, Asians earned about 10% of S&E doctorates in 2019, up slightly from 9% in 2011, while Whites earned 64%, down from 69% in 2011. S&E doctorates as a percentage of total doctorates earned by each racial or ethnic group varied from a low of 38% for Blacks to a high of 76% for Asians.
S&E doctoral degrees awarded, by race, ethnicity, and citizenship: 2000–19
| Year | U.S. citizen or permanent resident, White | Temporary visa holder | U.S. citizen or permanent resident, underrepresented minority | U.S. citizen or permanent resident, Asian or Pacific Islander | U.S. citizen or permanent resident, other or unknown race or ethnicity |
|---|---|---|---|---|---|
| 2000 | 14,975 | 8,461 | 1,678 | 1,714 | 1,034 |
| 2001 | 14,663 | 8,714 | 1,831 | 1,767 | 1,121 |
| 2002 | 14,620 | 8,478 | 1,795 | 1,606 | 1,089 |
| 2003 | 14,926 | 9,015 | 1,877 | 1,651 | 1,277 |
| 2004 | 15,765 | 9,843 | 2,208 | 1,816 | 1,347 |
| 2005 | 17,082 | 11,355 | 2,301 | 2,071 | 1,659 |
| 2006 | 18,057 | 12,725 | 2,505 | 2,249 | 2,005 |
| 2007 | 19,929 | 13,697 | 2,716 | 2,414 | 2,224 |
| 2008 | 19,824 | 13,886 | 2,990 | 2,393 | 2,387 |
| 2009 | 20,004 | 13,358 | 2,940 | 2,394 | 2,415 |
| 2010 | 16,736 | 12,605 | 2,672 | 2,325 | 2,373 |
| 2011 | 17,346 | 13,174 | 2,945 | 2,370 | 2,635 |
| 2012 | 17,958 | 13,771 | 3,086 | 2,491 | 2,558 |
| 2013 | 18,615 | 14,354 | 3,408 | 2,494 | 2,692 |
| 2014 | 19,552 | 15,210 | 3,775 | 2,557 | 2,901 |
| 2015 | 19,714 | 15,183 | 4,011 | 2,703 | 2,910 |
| 2016 | 19,620 | 15,223 | 4,391 | 2,644 | 2,967 |
| 2017 | 19,875 | 15,592 | 4,446 | 2,869 | 2,947 |
| 2018 | 20,061 | 16,181 | 4,527 | 2,884 | 3,145 |
| 2019 | 20,074 | 16,599 | 4,912 | 3,127 | 3,041 |
Note(s):
Underrepresented minority includes American Indian or Alaska Native, Black or African American, and Hispanic or Latino. Hispanic may be any race; race categories exclude Hispanic origin. Asian or Pacific Islander includes both Asian and Native Hawaiian or Other Pacific Islander in years since 2011. Doctoral degree data differ from doctoral degree data in other tables and figures in this report that are based on the National Center for Science and Engineering Statistics Survey of Earned Doctorates and that refer to research doctorates only. Greatest differences are in psychology and medical or other health sciences. The large drop in U.S. data in 2009 is due to the change in doctoral categories in the survey.
Source(s):
National Center for Education Statistics, Integrated Postsecondary Education Data System (IPEDS), Completions Survey; National Center for Science and Engineering Statistics, Table Builder.
Science and Engineering Indicators
S&E doctoral degrees awarded to U.S. citizen and permanent resident underrepresented minorities, by race or ethnicity: 2000–19
| Year | American Indian or Alaska Native | Black or African American | Hispanic or Latino |
|---|---|---|---|
| 2000 | 82 | 821 | 775 |
| 2001 | 88 | 838 | 905 |
| 2002 | 84 | 871 | 840 |
| 2003 | 106 | 893 | 878 |
| 2004 | 117 | 1,034 | 1,057 |
| 2005 | 109 | 1,071 | 1,121 |
| 2006 | 111 | 1,204 | 1,190 |
| 2007 | 128 | 1,287 | 1,301 |
| 2008 | 139 | 1,352 | 1,499 |
| 2009 | 154 | 1,451 | 1,335 |
| 2010 | 121 | 1,239 | 1,312 |
| 2011 | 122 | 1,426 | 1,397 |
| 2012 | 117 | 1,486 | 1,483 |
| 2013 | 130 | 1,637 | 1,641 |
| 2014 | 131 | 1,816 | 1,828 |
| 2015 | 137 | 1,855 | 2,019 |
| 2016 | 127 | 2,024 | 2,240 |
| 2017 | 114 | 2,151 | 2,181 |
| 2018 | 121 | 2,157 | 2,249 |
| 2019 | 111 | 2,356 | 2,445 |
Note(s):
Doctoral degree data in this table data differ from data found in other tables and figures in this report that are based on the National Center for Science and Engineering Statistics Survey of Earned Doctorates and that refer to research doctorates only. Greatest differences are in psychology and medical or other health sciences. Hispanic may be any race; race categories exclude Hispanic origin. The large drop in 2009 is due to the change in doctoral categories in the survey.
Source(s):
National Center for Education Statistics, Integrated Postsecondary Education Data System (IPEDS), Completions Survey; National Center for Science and Engineering Statistics, Table Builder.
Science and Engineering Indicators
Racial and ethnic groups also vary in their fields of doctoral degree (Figure HED-19; Table SHED-7). In 2019, the top field for Black recipients was medical and other health sciences (40% of S&E doctorates awarded to Blacks), followed by psychology (16%), biological sciences (10%), and engineering and political science and public administration (each at 8%). Biological sciences and psychology were the top fields for Hispanics (each at 22%), followed by medical and other health sciences (15%), and engineering (13%). For Asians, the top fields were engineering (24%) and biological sciences (23%), followed by medical and other health sciences (17%) and physical sciences (10%).
S&E doctoral degrees earned, by field, citizenship, and selected race or ethnicity: 2019
| Race, ethnicity, or citizenship | Engineering | Biological sciences | Medical and other health sciences | Physical sciences | Social sciences | Psychology | Computer sciences | Mathematics and statistics | Agricultural sciences | Earth, atmospheric, and ocean sciences |
|---|---|---|---|---|---|---|---|---|---|---|
| American Indian or Alaska Native | 14.4 | 18.9 | 20.7 | 4.5 | 12.6 | 15.3 | 1.8 | 0.9 | 7.2 | 3.6 |
| Black or African American | 8.4 | 10.3 | 39.7 | 4.0 | 15.8 | 15.8 | 2.7 | 1.2 | 1.6 | 0.5 |
| Hispanic or Latino | 13.1 | 21.5 | 15.1 | 8.5 | 12.1 | 21.6 | 1.5 | 2.5 | 2.5 | 1.6 |
| White | 15.0 | 19.3 | 19.1 | 11.4 | 11.2 | 12.2 | 2.7 | 3.4 | 3.3 | 2.5 |
| Asian | 24.1 | 23.2 | 17.1 | 10.0 | 7.8 | 7.7 | 4.5 | 3.4 | 1.4 | 0.8 |
| Temporary visa holders | 39.8 | 11.6 | 4.8 | 12.8 | 10.2 | 1.6 | 7.7 | 6.2 | 3.3 | 2.0 |
Note(s):
Hispanic may be of any race; race categories exclude Hispanic origin. Not all race or ethnicity data are reported in this figure; race or ethnicity categories apply only to U.S. citizens and permanent residents.
Source(s):
National Center for Education Statistics, Integrated Postsecondary Education Data System (IPEDS), Completions Survey.
Science and Engineering Indicators
S&E Degrees by Race, Ethnicity, and Sex
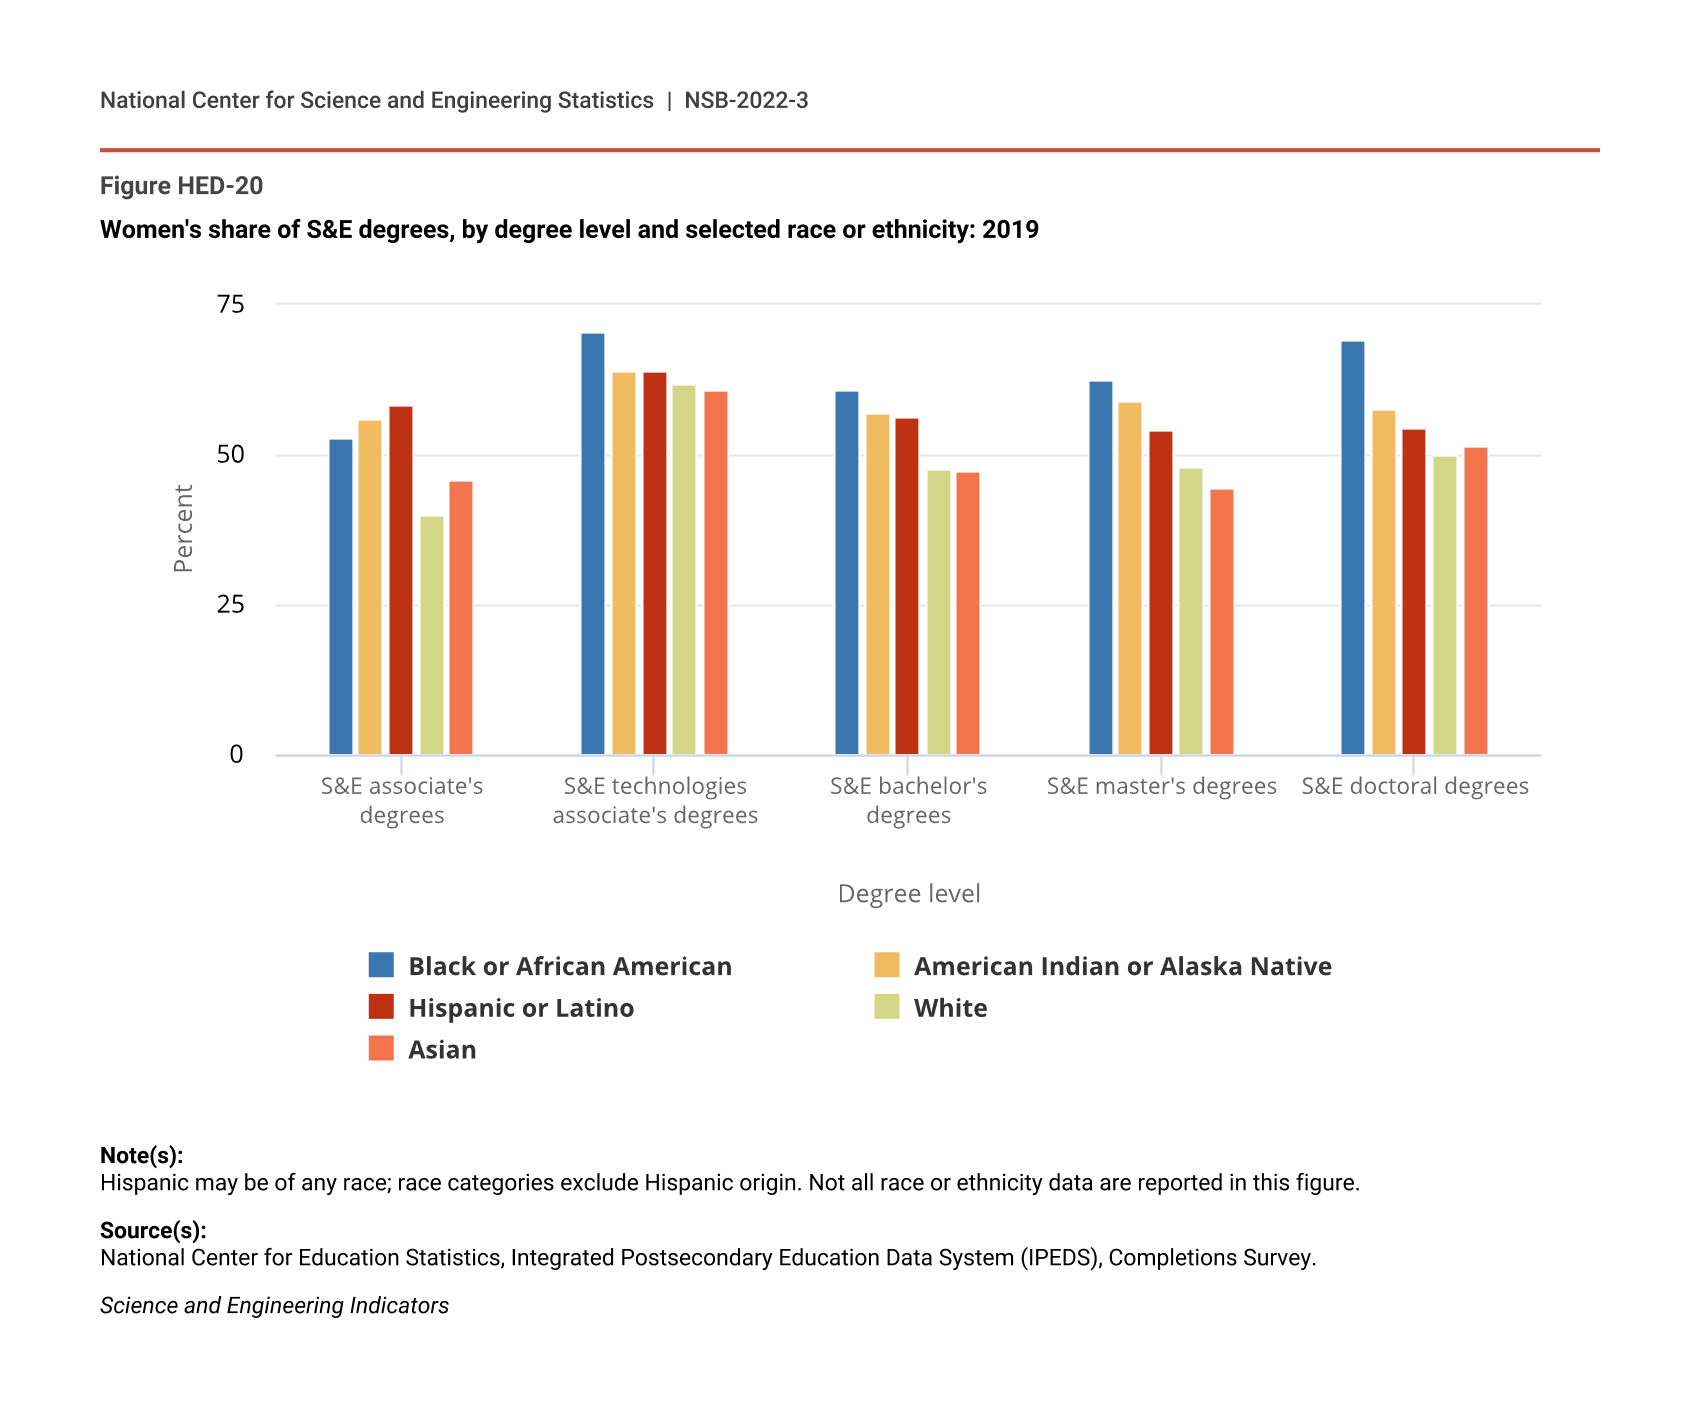
While women overall earn just under half of S&E degrees, there is variation in female shares among racial and ethnic groups. In 2019, underrepresented minority females earned higher shares of S&E degrees at all degree levels than their male counterparts. By contrast, White and Asian women earned more than half of associate’s degrees in S&E technologies, around half of S&E doctoral degrees, and fewer than half of S&E degrees at other levels (Figure HED-20; percentages are derived from Table SHED-3, Table SHED-5, Table SHED-6, and Table SHED-7).
Women's share of S&E degrees, by degree level and selected race or ethnicity: 2019
| Degree level | Black or African American | American Indian or Alaska Native | Hispanic or Latino | White | Asian |
|---|---|---|---|---|---|
| S&E associate's degrees | 52.8 | 56.0 | 58.2 | 40.0 | 45.7 |
| S&E technologies associate's degrees | 70.4 | 63.9 | 63.9 | 61.9 | 60.7 |
| S&E bachelor's degrees | 60.9 | 56.9 | 56.1 | 47.7 | 47.2 |
| S&E master's degrees | 62.5 | 59.0 | 54.0 | 47.9 | 44.3 |
| S&E doctoral degrees | 69.1 | 57.7 | 54.6 | 50.1 | 51.3 |
Note(s):
Hispanic may be of any race; race categories exclude Hispanic origin. Not all race or ethnicity data are reported in this figure.
Source(s):
National Center for Education Statistics, Integrated Postsecondary Education Data System (IPEDS), Completions Survey.
Science and Engineering Indicators
Women in each of the five racial and ethnic groups shown in Figure HED-20 increased their shares of S&E associate’s degrees from 2011 to 2019 (Table SHED-3). This increase was most pronounced for Hispanics or Latinos, with women increasing their share from 49% in 2011 to 58% in 2019.
Overall, both men and women earned numerically fewer associate’s degrees in S&E technologies in 2019 than they did in 2011. Hispanics or Latinos and Asians, however, increased their numbers during this time, and women in these groups also increased their share. Across all five racial and ethnic groups shown in Figure HED-20, women earned 60% or more of these degrees in 2019, mainly in health technologies.
At the bachelor’s level, women’s shares across racial and ethnic groups changed little from 2011 to 2019. Over this period, Hispanic women and men each more than doubled the number of S&E degrees they earned. Among Blacks, growth rates in S&E degrees earned by Black men (33%) outpaced those of women (18%). Among American Indians and Alaska Natives, a decrease in degrees earned from 2011 to 2019 was greater for men (down 25%) than for women (down 18%).
The most notable change at the master’s level was the increase in the share of S&E degrees earned by female American Indians or Alaska Natives: 59% (326) of degrees in 2019, up from 52% in 2011 (306). However, this increase occurred against the backdrop of small totals and declining numbers of American Indians or Alaska Natives earning S&E master’s degrees (553 total for men and women in 2019, compared with 584 in 2011) (Table SHED-6).
At the doctoral level, the women of each race or ethnicity increased their share of S&E degrees earned; they also increased the number of S&E degrees earned in all cases except that of American Indian or Alaska Native women. Hispanic women earned about 80% more degrees in 2019 than in 2011 and increased their share of doctorates earned by Hispanics from 53% to 55%. Black women earned 76% more doctorates in 2019 than in 2011 and increased their share of degrees earned by Blacks from 65% to 69%. Both American Indian or Alaska Native women and men earned fewer S&E doctorates in 2019 than in 2011 (Table SHED-7).
Within S&E fields, differences between men and women are persistent across racial or ethnic groups and degree levels. For example, women in all racial and ethnic groups earned over 60% of bachelor’s degrees awarded in biological sciences in 2019 and over 50% of degrees in social sciences but under 30% of bachelor’s degrees in engineering and mathematics and computer sciences (Table HED-3). There were some variations: Black women earned a higher proportion of bachelor’s degrees in biological sciences (72%) and physical sciences (57%), and Asian women earned a higher proportion of degrees in earth, atmospheric, and ocean sciences (55%) than other women. Generally, however, the high- and low-participation fields for women hold across degree levels and across race and ethnicity.
Women's share of S&E bachelor's degrees in selected fields for U.S. citizens and permanent residents, by race and ethnicity: 2019
Note(s):
Hispanic may be any race; race categories exclude Hispanic origin. For each demographic group, the cells shaded in green indicate that women’s share of S&E bachelor’s degrees earned is 50% or higher. The shading becomes darker as shares rise. Cells shaded in yellow or orange indicate that women’s share of S&E bachelor’s degrees earned is less than 50% and the shading becomes darker as shares fall.
Source(s):
National Center for Education Statistics, Integrated Postsecondary Education Data System (IPEDS), Completions Survey.
Science and Engineering Indicators