 An official website of the United States government
 Technical Appendix
The Science and Engineering Indicators 2024 report “Publications Output: U.S. Trends and International Comparisons” (PBS) uses a large database of publication records as a source of bibliometric data. Bibliometric data include each article’s title, author(s), authors’ institution(s), references, journal title, unique article-identifying information (journal volume, issue, and page numbers or digital object identifier), and year or date of publication. The PBS report uses Scopus, a bibliometric database owned by Elsevier and containing scientific literature with English titles and abstracts, to examine national and global scientific publication–related activity. This appendix discusses the Scopus data and data limitations. More detailed documentation of the Scopus data and computation of bibliometric indicators is available in the report Bibliometric Indicators for the Science and Engineering Indicators 2024. Technical Documentation (Science-Metrix 2023).
Data
The counts, coauthorships, and citations presented in the PBS report are derived from information about research articles and conference papers (hereafter referred to collectively as articles) published in conference proceedings and peer-reviewed scientific and technical journals. All journals and conference proceedings must pass the standards for inclusion in Scopus, which includes reaching criteria for relevance and peer review. The articles exclude editorials, commentaries, errata, letters, and other material that do not present or discuss scientific data, theories, methods, apparatuses, or experiments. The articles also exclude working papers, which are not generally peer reviewed. The bibliometric data undergo review and processing to create the data presented in the PBS report (Science-Metrix 2023).
Beginning in the Indicators 2016 report, the PBS report’s analysis shifted from using Web of Science by Clarivate (previously Thompson-Reuters) to the Scopus database by Elsevier. In 2016, an examination of the two databases found expanded data coverage in Scopus of internationally recognized peer-reviewed scientific journals (NSB Indicators 2016: New Data Source for Indicators Expands Global Coverage). Since 2016, both databases have continued to expand coverage. A recent study comparing the databases found 27 million documents in Scopus and 23 million in Web of Science, with an overlap of 18 million (Visser, van Eck, and Waltman 2020). The Indicators 2024 PBS report uses the Scopus database to ensure the broadest coverage of a curated database.
This section of the Technical Appendix continues with a brief overview of the database composition, followed by an explanation of potential biases in the data, such as exclusion of non-peer-reviewed articles, English-language bias, and the reasoning behind removing conference papers from the highly cited article (HCA) ratio.
Database Composition
Journal selection. Elsevier selects journals for the Scopus database based on evaluation by an international group of subject-matter experts who examine a candidate journal’s editorial policy, content quality, peer-review policies, peer-review process and capacity, citations by other publications, editor standing, regularity of publication, and content availability.
Conference selection. Elsevier selects conference materials for the Scopus database by subject field based on quality and relevancy, including the reputations of the sponsoring organization and the publisher of the proceedings.
Database Filtering
The National Center for Science and Engineering Statistics (NCSES) undertakes additional filtering of the Scopus data to ensure that the statistics presented in Indicators measure original and high-quality research publications (Science-Metrix 2023). Around 2011, librarians and bibliometric experts began to note an increase in articles in the database from electronic journals and conference proceedings lacking substantive peer review. To exclude these publications from the bibliometric data used in this report, NCSES removed journals and conference papers flagged by the Directory of Open Access Journals (DOAJ) for failing to adhere to its list of best practices or being suspected of editorial misconduct. Titles removed by Elsevier from the Scopus database beginning in 2014 were removed retroactively from the Indicators database for all publication years (Science-Metrix 2023).
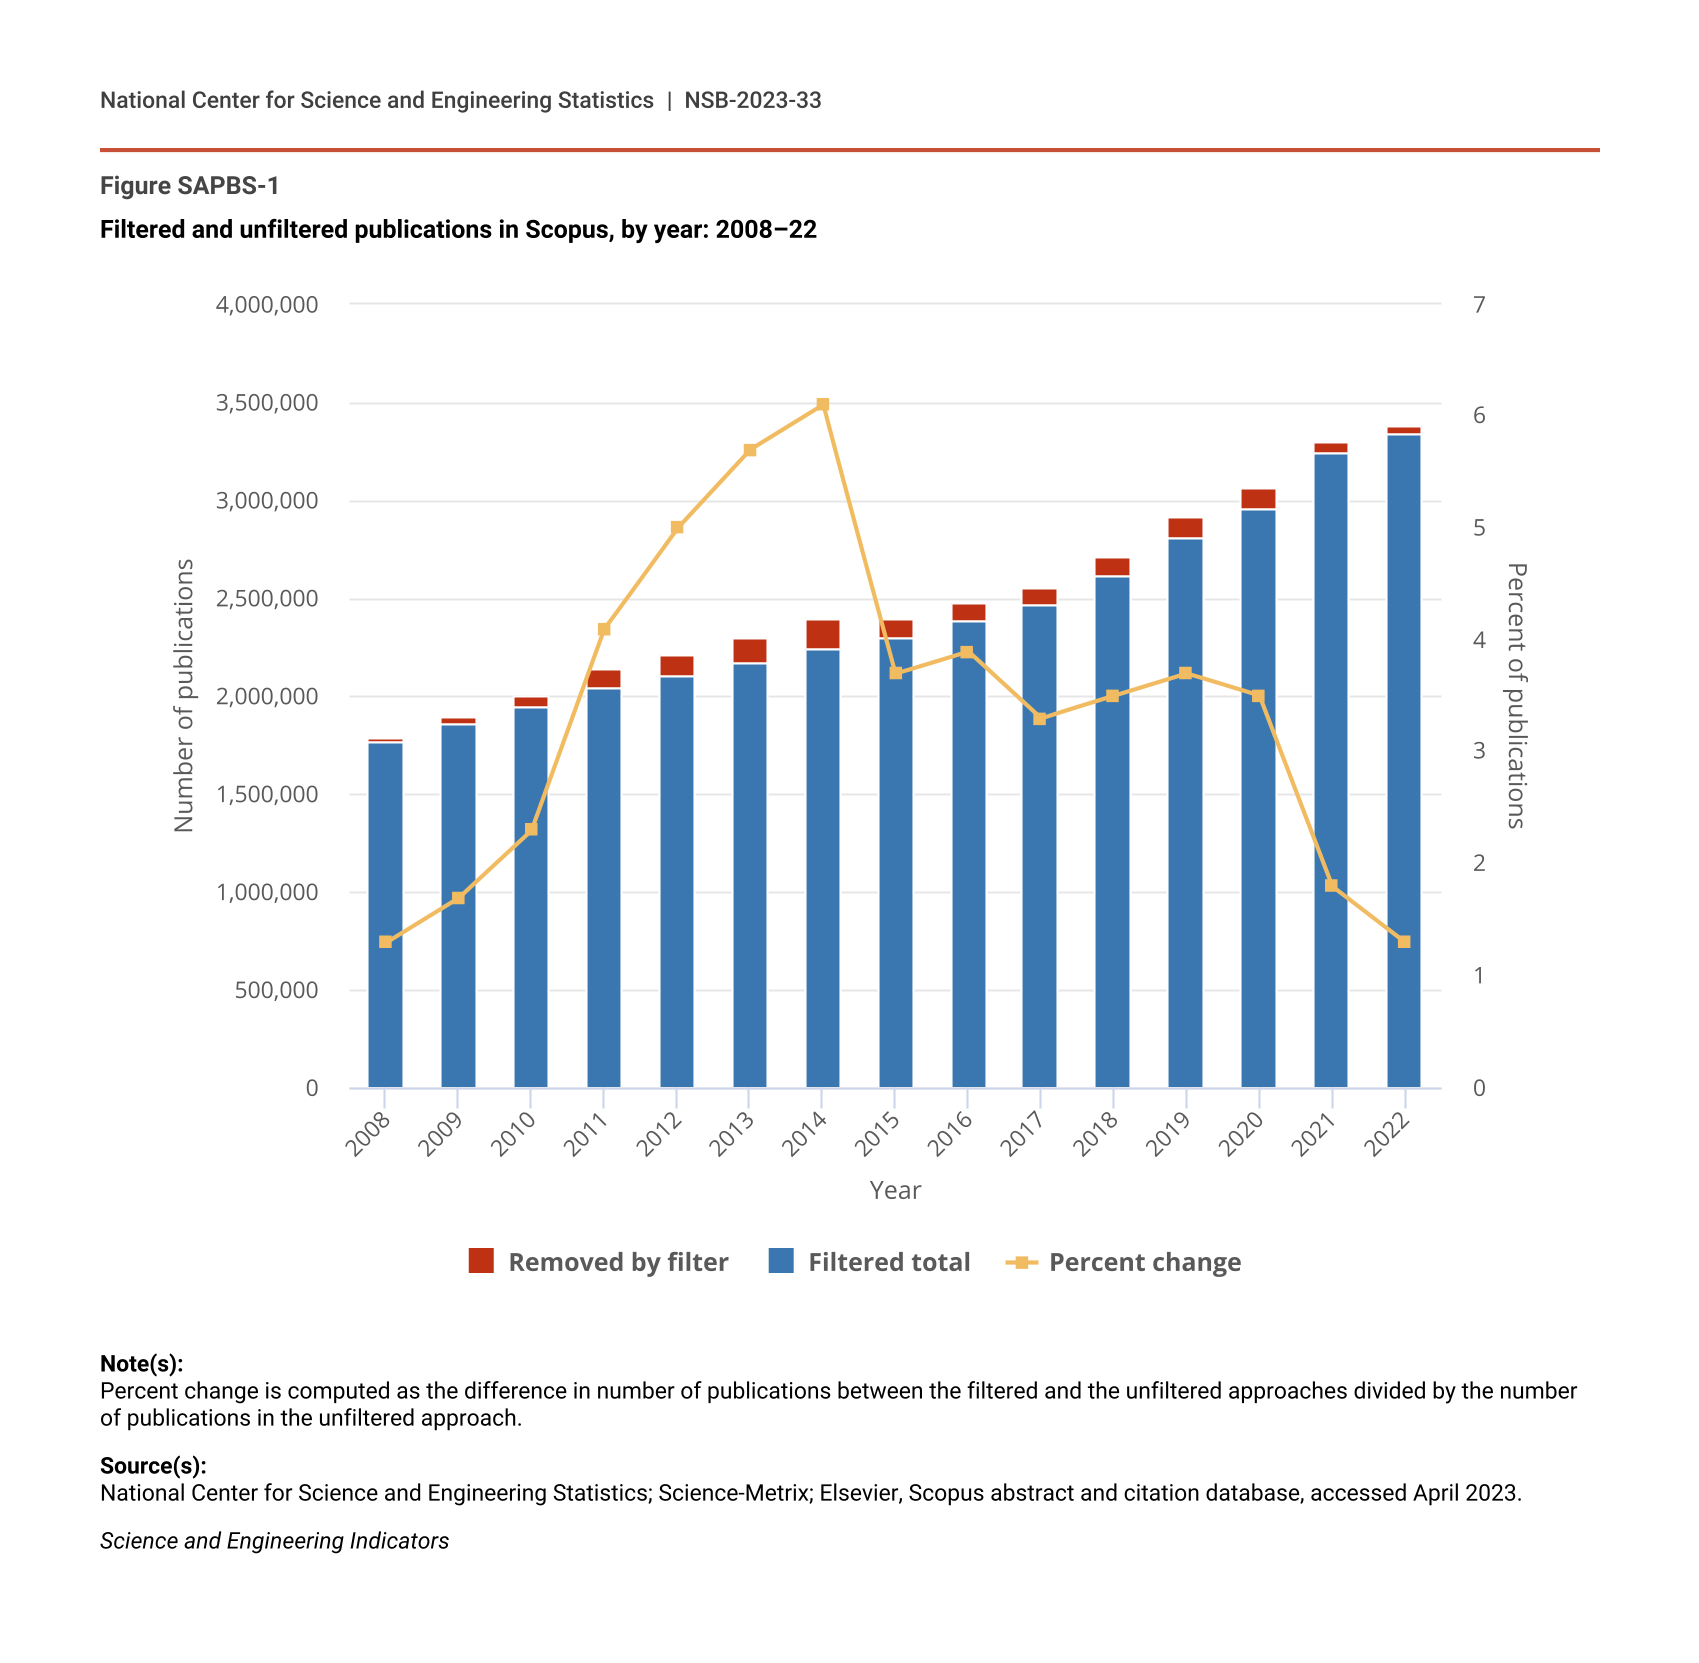
As a result, NCSES removed 2% or fewer articles from the Scopus database prior to 2011, followed by about 4% (more than 88,000 articles) in 2011, then peaked with 5% to 6% (about 111,000 to 145,000 articles) each year from 2012 to 2014 (Figure SAPBS-1). Since then, the removal rate has declined.
Filtered and unfiltered publications in Scopus, by year: 2008–22
| Year | Percent change | Filtered total | Removed by filter |
|---|---|---|---|
| 2008 | 1.3 | 1,762,986 | 23,068 |
| 2009 | 1.7 | 1,862,709 | 32,704 |
| 2010 | 2.3 | 1,950,178 | 44,907 |
| 2011 | 4.1 | 2,045,351 | 88,126 |
| 2012 | 5.0 | 2,105,157 | 111,208 |
| 2013 | 5.7 | 2,168,061 | 131,989 |
| 2014 | 6.1 | 2,245,240 | 145,174 |
| 2015 | 3.7 | 2,302,230 | 88,399 |
| 2016 | 3.9 | 2,386,418 | 95,908 |
| 2017 | 3.3 | 2,467,960 | 85,340 |
| 2018 | 3.5 | 2,613,116 | 96,025 |
| 2019 | 3.7 | 2,811,110 | 106,998 |
| 2020 | 3.5 | 2,955,562 | 107,014 |
| 2021 | 1.8 | 3,240,279 | 58,692 |
| 2022 | 1.3 | 3,344,037 | 42,608 |
Note(s):
Percent change is computed as the difference in number of publications between the filtered and the unfiltered approaches divided by the number of publications in the unfiltered approach.
Source(s):
National Center for Science and Engineering Statistics; Science-Metrix; Elsevier, Scopus abstract and citation database, accessed April 2023.
Science and Engineering Indicators
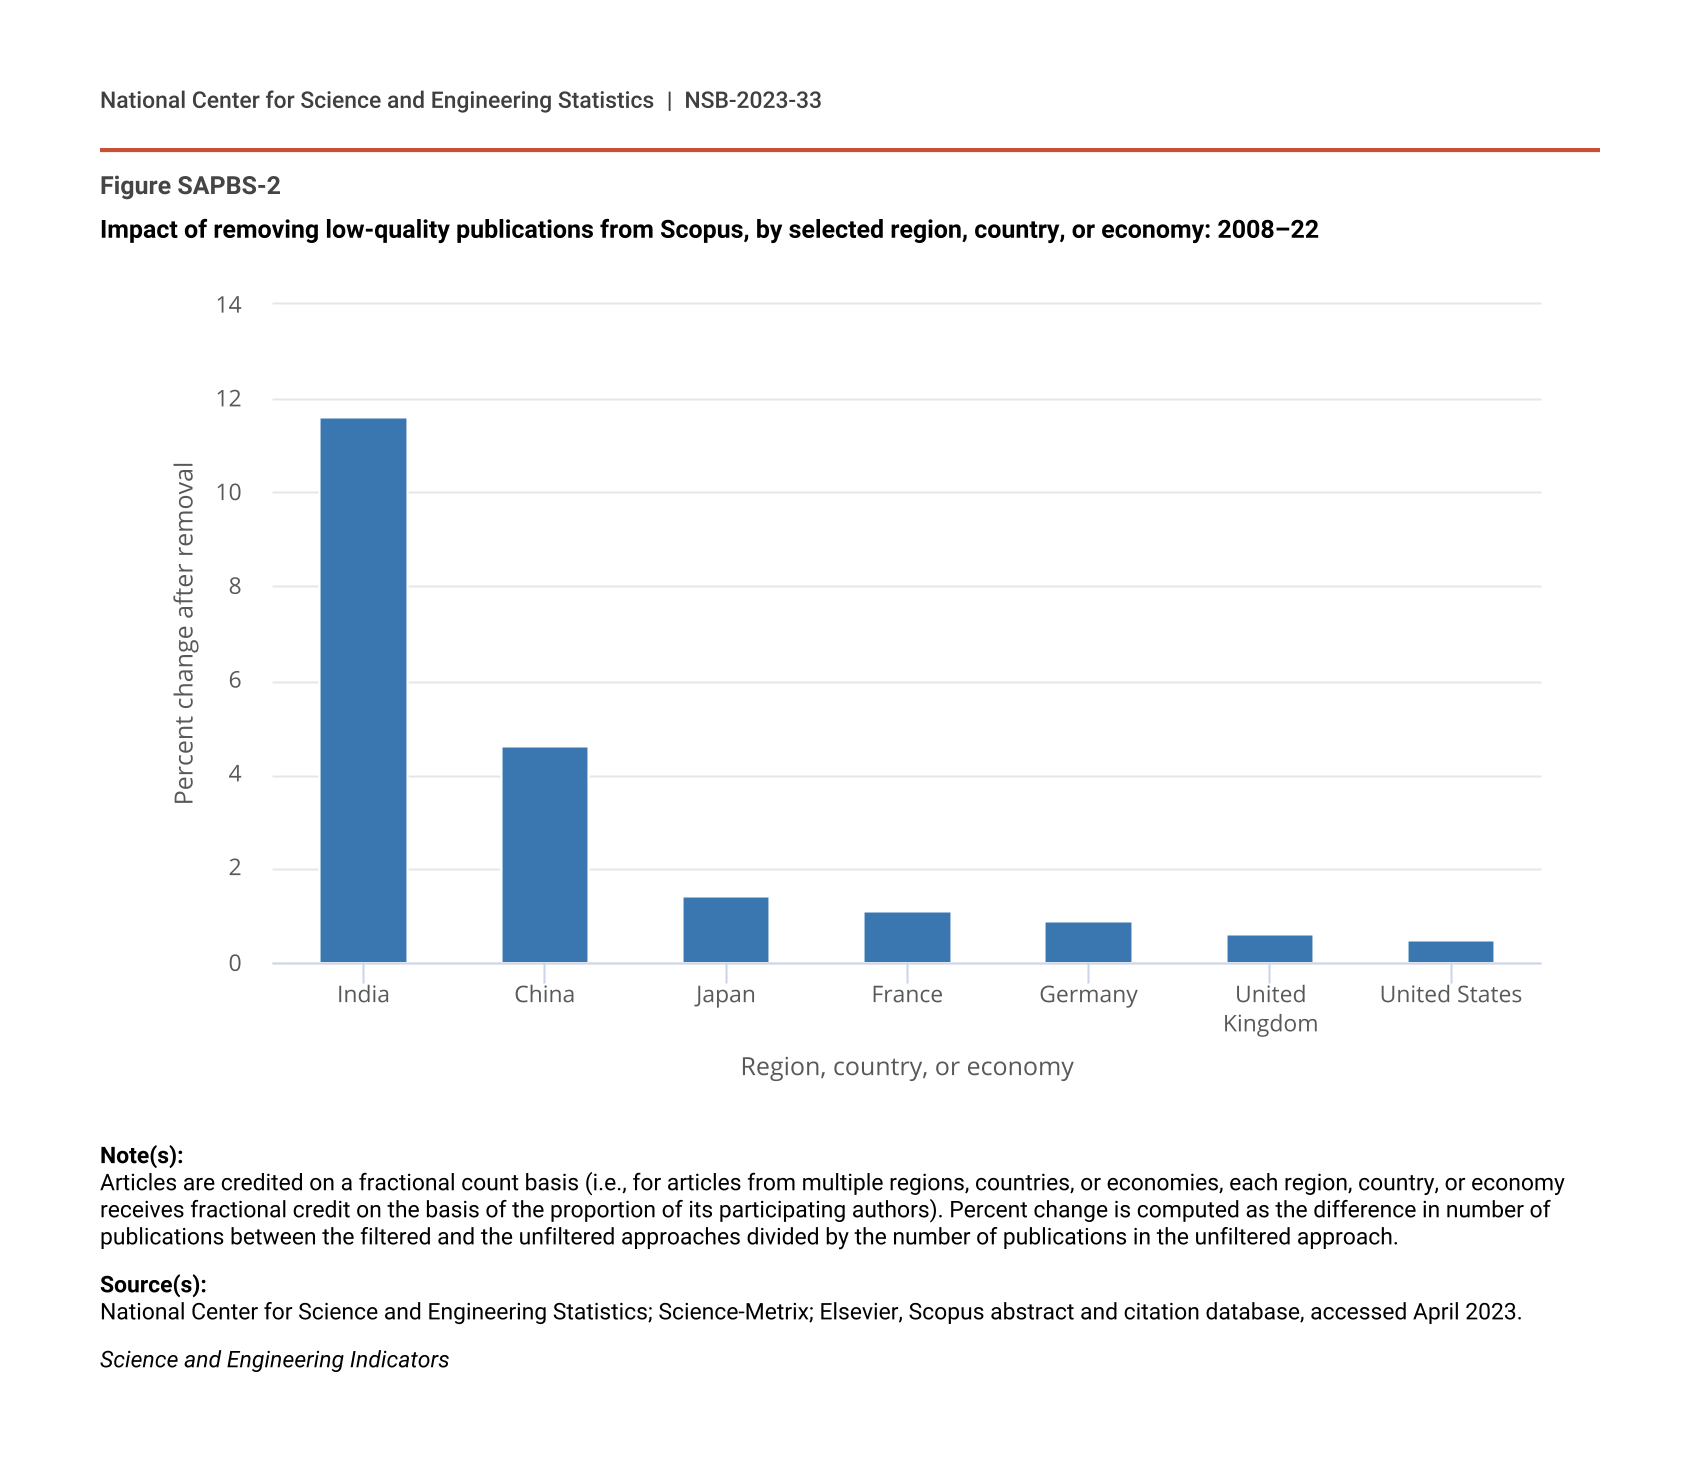
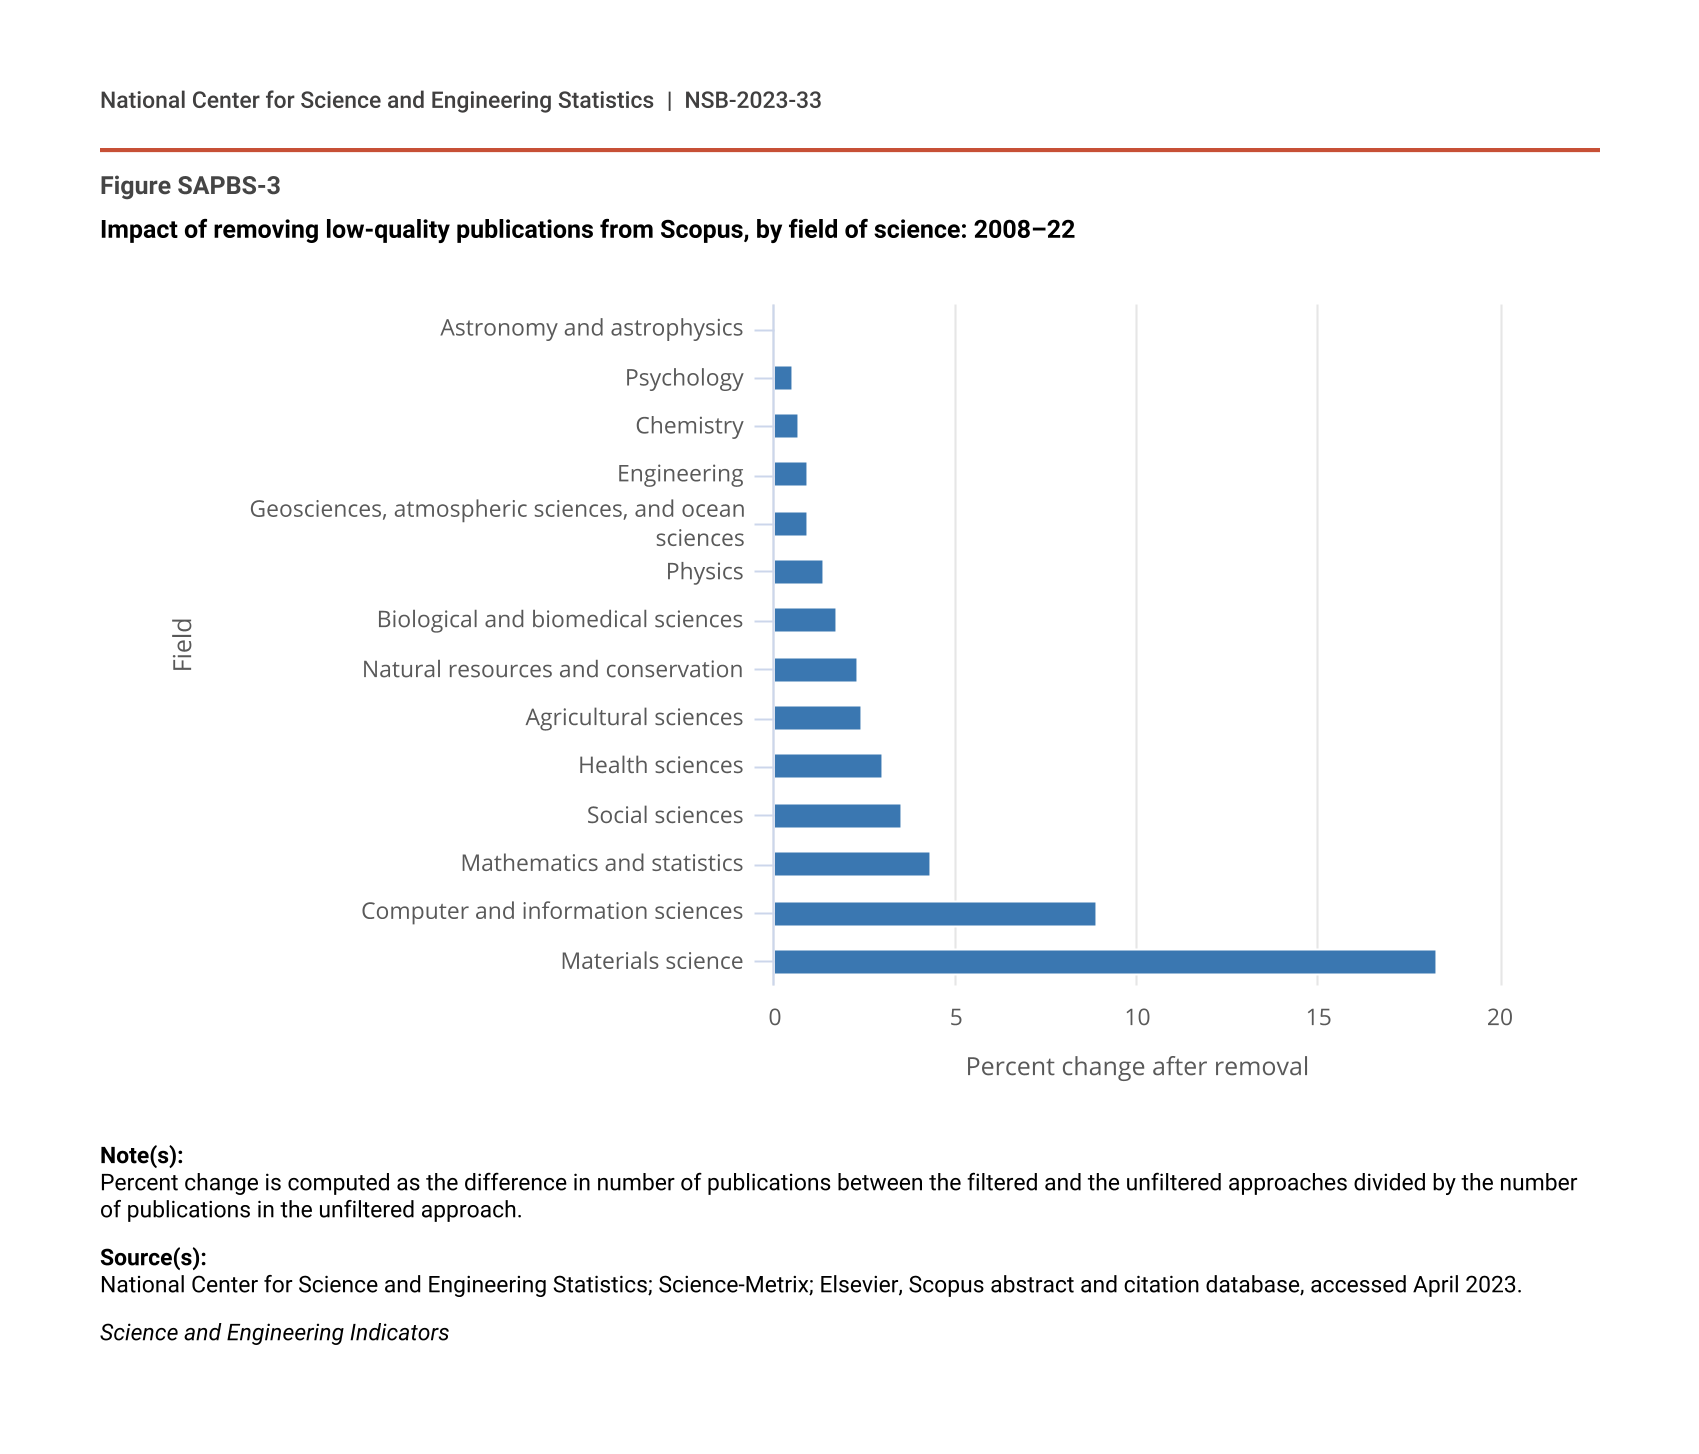
The filtering has different impacts by region, country, or economy and field of science. NCSES has examined the effect of this filtering to better understand any potential bias. Figure SAPBS-2 shows the numerical impact of the filters by region, country, or economy. From 2008 to 2022, India had the largest percentage of articles removed (approximately 12% of India’s total unfiltered article count), followed by China (5%) (Figure SAPBS-2). By subject field, materials science (18% of articles filtered out) and computer and information sciences (9%) were the fields with the most filtered articles (Figure SAPBS-3).
Impact of removing low-quality publications from Scopus, by selected region, country, or economy: 2008–22
| Region, country, or economy | Percent change after removal |
|---|---|
| India | 11.6 |
| China | 4.6 |
| Japan | 1.4 |
| France | 1.1 |
| Germany | 0.9 |
| United Kingdom | 0.6 |
| United States | 0.5 |
Note(s):
Articles are credited on a fractional count basis (i.e., for articles from multiple regions, countries, or economies, each region, country, or economy receives fractional credit on the basis of the proportion of its participating authors). Percent change is computed as the difference in number of publications between the filtered and the unfiltered approaches divided by the number of publications in the unfiltered approach.
Source(s):
National Center for Science and Engineering Statistics; Science-Metrix; Elsevier, Scopus abstract and citation database, accessed April 2023.
Science and Engineering Indicators
Impact of removing low-quality publications from Scopus, by field of science: 2008–22
| Field | Percent change after removal |
|---|---|
| Astronomy and astrophysics | 0.0 |
| Psychology | 0.5 |
| Chemistry | 0.7 |
| Engineering | 0.9 |
| Geosciences, atmospheric sciences, and ocean sciences | 0.9 |
| Physics | 1.4 |
| Biological and biomedical sciences | 1.7 |
| Natural resources and conservation | 2.3 |
| Agricultural sciences | 2.4 |
| Health sciences | 3.0 |
| Social sciences | 3.5 |
| Mathematics and statistics | 4.3 |
| Computer and information sciences | 8.9 |
| Materials science | 18.3 |
Note(s):
Percent change is computed as the difference in number of publications between the filtered and the unfiltered approaches divided by the number of publications in the unfiltered approach.
Source(s):
National Center for Science and Engineering Statistics; Science-Metrix; Elsevier, Scopus abstract and citation database, accessed April 2023.
Science and Engineering Indicators
English-Language Bias
The Scopus database is constructed from articles and conference proceedings with an English-language title and abstract; therefore, the database contains an unmeasurable bias because not all science and engineering (S&E) articles and conference proceedings meet the English language requirement (Elsevier 2020). Scopus uses English because of its widespread acceptance as the assumed global language of science, and research shows that a representative plurality of researchers publish in English (Amano, González-Varo, and Sutherland 2016). Most notably, this restriction may undercount contributions from non-English-speaking regions, countries, or economies, but multiple factors influence global researchers’ decisions to publish in English that may also affect the prominence of non-English-speaking regions, countries, or economies in Scopus.
Publication output data for non-English-speaking regions, countries, or economies also underestimate the S&E research output for China, Japan, and others (Amano, González-Varo, and Sutherland 2016; Xie and Freeman 2019). Therefore, when comparing English-speaking and non-English-speaking regions, countries, or economies (e.g., Figure PBS-3; Table PBS-1), there is a bias such that the non-English-speaking ones will be undercounted in the numbers of publications and citations. The bias varies by scientific field. Bibliometric researchers have found a native-language preference in citations (Liang, Rousseau, and Zhong 2012), and the social sciences exhibit more substantial linguistic bias than physical sciences, engineering, and mathematics (Mongeon and Paul-Hus 2015). One solution undertaken by Elsevier is to increase publications from non-English-speaking regions, countries, or economies.
Conference Papers Removed from the Highly Cited Article Ratio
Conference papers are included in the data analyzed in the report for output but not for HCA computation. Conference papers may bias HCA because of uneven inclusion in Scopus and widely different citation patterns compared with those of journal articles.
Generally, conference papers are cited less frequently than journal articles. Thus, a greater proportion of conference papers in the total article count for a region, country, or economy would tend to reduce impact based on HCA computation. Depending on the normalization approach, the score of regions, countries, or economies could be heavily impacted compared with others because conference papers represent a larger proportion of their output. The issue is demonstrated in a simplified two-country example. Both countries publish 1,000 journal articles, but one publishes 10 conference papers, and the other publishes 200 conference papers. Assume that, based on the 1,000 journal articles, both countries have the same impact. If scores are lower for conference papers, adding conference papers into the computation will reduce the combined HCA score of the country with 200 conference papers. Therefore, in this case, two countries with similar impact in research published in journals may have a different overall impact because of the propensity of one to also send people to conferences.
In other cases, conference papers can increase the HCA for a region, country, or economy. Some fields of science publish and cite conference proceedings at different rates. A field with a low average number of citations for each article can have an increase in HCA by including conference papers, even those with relatively few citations. For example, if the country’s average number of citations is one and a conference paper receives two citations, the normalized impact of the conference paper will be 2.0, which is quite high. Adding these high-impact conference papers could boost the score of a country that specializes in a field with a below-average number of article citations and whose researchers participate in an above-average number of conferences.
The Indicators 2024 PBS report removes conference proceedings from the HCA but keeps conference proceedings in the total output and collaboration analysis because conference proceedings for some fields and regions, countries, or economies are an important component of their output. The exception to this rule is for computer and information sciences. The HCAs for computer and information sciences for journal articles alone and for journal articles plus conference proceedings show similar HCA trends for the United States and China (Table SPBS-69). For both countries, including conference proceedings boosts the HCA from 2014 through 2018. Computer and information sciences was selected for this comparison because conference proceedings are close to 20% of the references in that field (Lisée, Larivière, and Archambault 2008).
Field Categorization
Articles were categorized by S&E fields corresponding to the 14 fields of science in the NCSES Taxonomy of Disciplines (TOD) (Science-Metrix 2023). This categorization first assigns the journal to one of the 176 subfields in the Science-Metrix classification, then to the TOD. This approach works well for most journals and fields—all of dentistry is assigned to health sciences, for example. Challenges arise for subfields that are more general, such as energy, and for multidisciplinary journals, such as Science or Nature. For these fields and journals, classification occurs at the article level based on an algorithm that uses author affiliations, the names of journals referenced in the bibliography, the titles of the references, the publication’s abstract, the publication’s author-defined keywords, the publication’s title, and the scientific field of references.
Fractional and Whole Counting
Collaboration, including international collaboration, is increasingly common in scientific research, resulting in papers that are co-written by two or more coauthors. Co-written articles can pose challenges for appropriately allocating paper credit, by individual authors and by region, country, or economy, in the case of international collaboration. Articles with authors working in multiple regions, countries, or economies were accounted for in determining publication output by region, country, or economy and international collaborations, but different strategies were required for allocating credit. First, each article’s affiliated region, country, or economy was determined by the institutional address of each author as listed in the article. Fractional counting was employed to determine country output, because each country received a fractional contribution to each paper based on the number of coauthors from that country. Country output aims to measure each country’s contribution to worldwide publication, and fractional counting prevents double-counting collaborative papers and helps normalize the output of highly collaborative countries. Full counting was employed in measures of international collaboration because each region, country, or economy represented by one or more authors was counted once. The international collaboration analyses positioned each paper as an instance of international collaboration, such that whole counting was appropriate. Because whole counting was used for international collaboration and fractional counting for publication output, those values were not directly comparable. Finally, it should be noted that although the listed affiliation is generally reflective of the locations where research was conducted, authors may have honorary affiliations, have moved, or have experienced other circumstances preventing their affiliations from being an exact corollary to the research environment.
Network Analysis of Artificial Intelligence Papers
The sidebar Artificial Intelligence Publication Output and International Collaboration uses a network graph to show the interrelatedness of the international research effort. Visualization of the network uses a structure of nodes (representing regions, countries, or economies) and edges (representing connections between the regions, countries, or economies). A force-directed layout algorithm defines optimal bidimensional positions for the graph’s nodes. The force-directed layout algorithms used are nondeterministic, such that even from identical starting positions and layout parameters, the final network layout may be slightly different. However, groups of nodes that are strongly linked together (clusters) will tend to be visually close to each other. As such, the position of a single node carries no meaning on its own; it must be compared with that of the others to obtain insights into the collaboration ecosystem. The table below provides terminology and definitions for an in-depth understanding of the network analysis (Figure PBS-B and Figure PBS-C; Table SPBS-91).
Indicator | Description |
Degree | The degree of a node is the number of edges connected to the node. In the context of an international collaboration network, this corresponds to the number of other regions, countries, or economies with which the region, country, or economy has collaborated. In this case, the maximum value of this indicator is the number of nodes in the network minus one because the node that has its degree computed cannot have collaborated with itself. |
Node strength | The node strength is the sum of the weights of edges connected to the node. For international collaboration, a single paper can generate multiple collaboration links. For example, if one author from the United States cowrote an article with two authors from France and one author from Canada, this article generates three collaboration links: United States–France, United States–Canada, and Canada-France, each with a weight of one, regardless of the number of authors. |
Betweenness centrality | Betweenness centrality measures how often a given node in a network lies along the shortest paths between two other nodes that are not directly connected to one another. For example, this indicator would highlight entities that play an important brokering role, acting as a connecting link between entities that do not co-publish with one another directly. Nodes with a high betweenness centrality score are the bridges that connect relatively isolated islands of research communities within the overall topography. These entities play an important role in the interconnection of subgroups within the network as a whole. |
Closeness centrality | Closeness centrality assesses the degrees of separation between one node and other nodes within a network. That is, it assesses the length of the chains that connect a given node to the rest of its community. Although, for example, betweenness centrality highlights entities that play an interconnecting role for their community, closeness centrality measures the level of access that a given entity has to its surrounding community. It highlights those that can tap into a large section of a network without passing through many degrees of separation or through distant and mediated connections. |
Weighted eigenvector centrality | Weighted eigenvector centrality is a measure of the level of integration of a node in a collaboration network. The level of integration of nodes within a collaboration network is reflected by the number of nodes to which they are connected and the quality of their collaborations (i.e., the strength of the ties measured by the number of coauthored publications and the importance of the nodes to which they are connected in the network). The mathematical definition of eigenvector centrality is such that the centrality score of a node in a network is proportional to the sum of the centrality scores of all nodes connected to it. Thus, this indicator offers a good appreciation of the number and quality of an entity’s collaborations because connections to high-scoring nodes contribute more to the score of that entity than equal connections to low-scoring nodes. A node scoring high for this indicator operates closer to the core of the network than a low-scoring node. High-scoring nodes are central and highly important to the network’s structure. Eigenvector centrality provides a good appreciation of the integration of individual entities within a network; that is, the higher the score, the more integrated the entity. The weighted version of the indicator accounts for the size of the tie between nodes. Centrality scores are typically normalized between 1 (most central node) and 0 (least central node). |
Weighted PageRank | PageRank, made famous through its use by the Google search engine, is a variant of eigenvector centrality. It can be thought of as the result of a random walk, meaning that the PageRank score of a given node corresponds to the probability that someone starting on a random node of the network and randomly following edges will end the walk on a particular node. The weighted version of the algorithm makes stronger links more likely to be followed than weaker links. PageRanks are shown as percentages to clearly indicate the share of random walks in which the end point was the given node. All scores sum to 100%. In undirected networks, weighted PageRank yields results very similar to node strength. |
Key to Acronyms and Abbreviations
DOAJ: Directory of Open Access Journals
HCA: highly cited article
NCSES: National Center for Science and Engineering Statistics
PBS: Publications Output: U.S. Trends and International Comparisons
S&E: science and engineering
TOD: Taxonomy of Disciplines
References
Amano T, González-Varo JP, Sutherland WJ. 2016. Languages Are Still a Major Barrier to Global Science. PLOS Biology 14(12):e2000933. Available at http://journals.plos.org/plosbiology/article?id=10.1371%2Fjournal.pbio.2000933. Accessed 26 August 2023.
Beall J. 2012. Predatory Publishers Are Corrupting Open Access. Nature 489(179). Available at https://www.nature.com/articles/489179a. Accessed 26 August 2023.
Bohannon J. 2013. Who’s Afraid of Peer Review? Science 342(6154):60–65. Available at https://www.science.org/doi/10.1126/science.342.6154.60. Accessed 26 August 2023.
Carey K. 2016. A Peek Inside the Strange World of Fake Academia. New York Times December 29:3. Available at https://www.nytimes.com/2016/12/29/upshot/fake-academe-looking-much-like-the-real-thing.html?_r=0. Accessed 26 August 2023.
Elsevier. 2020. Scopus Content Coverage Guide. Available at https://www.elsevier.com/?a=69451. Accessed 26 August 2023.
Kolata G. 2013. Scientific Articles Accepted (Personal Checks, Too). New York Times April 8:1. Available at https://www.nytimes.com/2013/04/08/health/for-scientists-an-exploding-world-of-pseudo-academia.html. Accessed 26 August 2023.
Liang L, Rousseau R, Zhong Z. 2012. Non-English Journals and Papers in Physics: Bias in Citations? Scientometrics 95(1):333–50. Available at https://www.issi-society.org/proceedings/issi_2011/ISSI_2011_Proceedings_Vol1_49.pdf. Accessed 26 August 2023.
Lisée C, Larivière V, Archambault É. 2008. Conference Proceedings as a Source of Scientific Information: A Bibliometric Analysis. Journal of the American Society for Information Science and Technology 59:1776–84. Available at https://doi.org/10.1002/asi.20888. Accessed 26 August 2023.
Mongeon P, Paul-Hus A. 2015. The Journal Coverage of Web of Science and Scopus: A Comparative Analysis. Scientometrics 106:213–28. Available at https://doi.org/10.1007/s11192-015-1765-5. Accessed 26 August 2023.
National Science Board (NSB), National Science Foundation. 2016. New Data Source for Indicators Expands Global Coverage. Science and Engineering Indicators 2016 (Indicators 2016). NSB-2016-2. Alexandria, VA. Available at https://www.nsf.gov/statistics/2016/nsb20161/#/sidebar/chapter-5/new-data-source-for-indicators-expands-global-coverage.
Schneider JW, van Leeuwen T, Visser M, Aagaard K. 2019. Examining National Citation Impact by Comparing Developments in a Fixed and Dynamic Journal Set. Scientometrics 119(2):973–85. Available at https://doi.org/10.1007/s11192-019-03082-3. Accessed 26 August 2023.
Science-Metrix. 2023. Bibliometric Indicators for the Science and Engineering Indicators 2024. Technical Documentation. Available at https://science-metrix.com/bibliometrics-indicators-for-the-science-and-engineering-indicators-2024-technical-documentation/. Accessed 26 August 2023.
Visser M, van Eck NJ, Waltman L. 2020. Large-Scale Comparison of Bibliographic Data Sources: Scopus, Web of Science, Dimensions, Crossref, and Microsoft Academic. Available at https://arxiv.org/abs/2005.10732. Accessed 26 August 2023.
Xie Q, Freeman RB. 2019. Bigger Than You Thought: China’s Contribution to Scientific Publications and Its Impact on the Global Economy. China & World Economy 27:1–27. Available at https://doi.org/10.1111/cwe.12265. Accessed 26 August 2023.