Data
Tables
Select "VIEW" to see the table. PDF and Excel are available for download.
Figures
Data Sources
DOWNLOAD DATA SOURCES| Item | Title | Provider | Product |
|---|---|---|---|
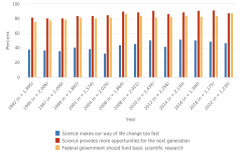
| Figure PPS-1 | U.S. adults who agree that science makes our way of life change too fast, that science provides more opportunities for the next generation, and that the federal government should fund basic scientific research: Selected years, 1992–2022 | National Center for Science and Engineering Statistics | Survey of Public Attitudes Toward and Understanding of Science and Technology |
| Figure PPS-1 | U.S. adults who agree that science makes our way of life change too fast, that science provides more opportunities for the next generation, and that the federal government should fund basic scientific research: Selected years, 1992–2022 | NORC at the University of Chicago | General Social Survey |
| Figure PPS-1 | U.S. adults who agree that science makes our way of life change too fast, that science provides more opportunities for the next generation, and that the federal government should fund basic scientific research: Selected years, 1992–2022 | University of Michigan Institute for Social Research | Surveys of Consumers Attitudes |
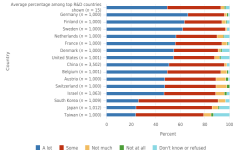
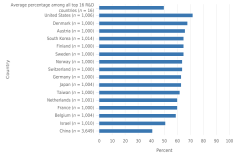
| Figure PPS-2 | Trust in science, by country: 2020 | Wellcome Trust | Wellcome Global Monitor |
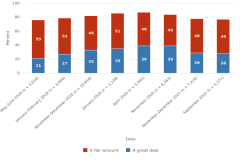
| Figure PPS-3 | Confidence in scientists to act in the best interests of the public, by survey date: 2016–22 | Pew Research Center | American Trends Panel |
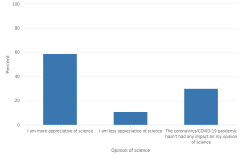
| Figure PPS-4 | Impact of the coronavirus or COVID-19 pandemic on U.S. adults' opinion of science: 2021 | 3M | State of Science Index Survey |
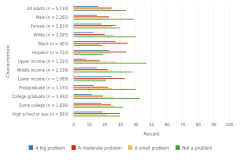
| Figure PPS-5 | Opinions on safety of drinking water, by demographic characteristics: 2022 | Pew Research Center | American Trends Panel |
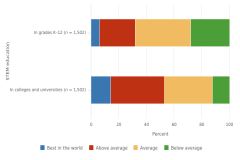
| Figure PPS-6 | Perceptions of U.S. STEM education compared with other nations at K–12 and university levels: 2019 | Pew Research Center | American Trends Panel |
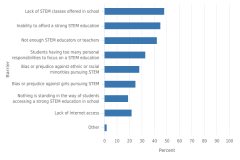
| Figure PPS-7 | U.S. adults' belief on top three barriers to students accessing strong STEM education in the United States: 2021 | 3M | State of Science Index Survey |
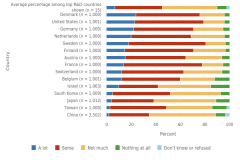
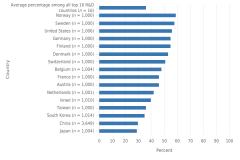
| Figure PPS-8 | Perceived knowledge about science, by country: 2020 | Wellcome Trust | Wellcome Global Monitor |
| Figure PPS-9 | Tried to get information about science in the past 30 days, by country: 2018 | Wellcome Trust | Wellcome Global Monitor |
| Figure PPS-10 | Tried to get information about medicine, disease, or health in the past 30 days, by country: 2018 | Wellcome Trust | Wellcome Global Monitor |
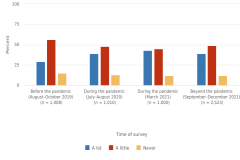
| Figure PPS-11 | How often U.S. adults thought about the impact of science on their everyday lives: 2019–21 | 3M | State of Science Index Survey |
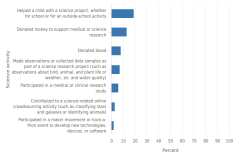
| Figure PPS-12 | Participation in science activities in the past 12 months: 2020 | Pew Research Center | American Trends Panel |
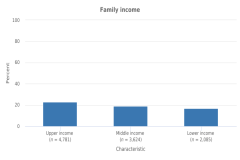
| Figure PPS-13 | Helped a child with a science project in the past 12 months, by family income and education level: 2020 | Pew Research Center | American Trends Panel |
| Table PPS-1 | Confidence in scientists to act in the best interests of the public, by demographic characteristics: 2022 | Pew Research Center | American Trends Panel |
| Table PPS-2 | Responses to proposed uses of computer chip implants in the brain: 2021 | Pew Research Center | American Trends Panel |
| Table PPS-3 | Confidence in scientists to act in the best interests of the public, by indicator of scientific method understanding: 2020 | Pew Research Center | American Trends Panel |
| Table PPS-4 | Confidence in medical scientists to act in the best interests of the public, by indicator of scientific method understanding: 2020 | Pew Research Center | American Trends Panel |
| Table PPS-5 | Participation in science activities in the past 12 months, by family income and education: 2020 | Pew Research Center | American Trends Panel |
| Table SPPS-1 | Public assessment of whether science makes life change too fast: Selected years, 1992–2022 | National Center for Science and Engineering Statistics | Survey of Public Attitudes Toward and Understanding of Science and Technology |
| Table SPPS-1 | Public assessment of whether science makes life change too fast: Selected years, 1992–2022 | NORC at the University of Chicago | General Social Survey |
| Table SPPS-1 | Public assessment of whether science makes life change too fast: Selected years, 1992–2022 | University of Michigan Institute for Social Research | Surveys of Consumers Attitudes |
| Table SPPS-2 | Public assessment of whether science and technology result in more opportunities for the next generation: Selected years, 1992–2022 | National Center for Science and Engineering Statistics | Survey of Public Attitudes Toward and Understanding of Science and Technology |
| Table SPPS-2 | Public assessment of whether science and technology result in more opportunities for the next generation: Selected years, 1992–2022 | NORC at the University of Chicago | General Social Survey |
| Table SPPS-2 | Public assessment of whether science and technology result in more opportunities for the next generation: Selected years, 1992–2022 | University of Michigan Institute for Social Research | Surveys of Consumers Attitudes |
| Table SPPS-3 | Public opinion on whether the federal government should fund basic scientific research: Selected years, 1992–2022 | National Center for Science and Engineering Statistics | Survey of Public Attitudes Toward and Understanding of Science and Technology |
| Table SPPS-3 | Public opinion on whether the federal government should fund basic scientific research: Selected years, 1992–2022 | NORC at the University of Chicago | General Social Survey |
| Table SPPS-3 | Public opinion on whether the federal government should fund basic scientific research: Selected years, 1992–2022 | University of Michigan Institute for Social Research | Surveys of Consumers Attitudes |
| Table SPPS-4 | Trust in science, by country: 2020 | Wellcome Trust | Wellcome Global Monitor |
| Table SPPS-5 | Impact of the coronavirus or COVID-19 pandemic on U.S. adults' opinion of science: 2021 | 3M | State of Science Index Survey |
| Table SPPS-6 | Confidence in scientists to act in the best interests of the public, by survey date: 2016–22 | Pew Research Center | American Trends Panel |
| Table SPPS-7 | Confidence in scientists to act in the best interests of the public, by demographic characteristics: 2022 | Pew Research Center | American Trends Panel |
| Table SPPS-8 | Responses to proposed uses of computer chip implants in the brain: 2021 | Pew Research Center | American Trends Panel |
| Table SPPS-9 | Opinions on safety of drinking water, by demographic characteristics: 2022 | Pew Research Center | American Trends Panel |
| Table SPPS-10 | Perceptions of U.S. STEM education compared with other nations at K–12 and university levels: 2019 | Pew Research Center | American Trends Panel |
| Table SPPS-11 | U.S. adults' belief on top three barriers to students accessing strong STEM education in the United States: 2021 | 3M | State of Science Index Survey |
| Table SPPS-12 | Perceived knowledge about science, by country: 2020 | Wellcome Trust | Wellcome Global Monitor |
| Table SPPS-13 | Confidence in scientists to act in the best interests of the public, by indicator of scientific method understanding: 2020 | Pew Research Center | American Trends Panel |
| Table SPPS-14 | Confidence in medical scientists to act in the best interests of the public, by indicator of scientific method understanding: 2020 | Pew Research Center | American Trends Panel |
| Table SPPS-15 | Interest in science, by country: 2018 | Wellcome Trust | Wellcome Global Monitor |
| Table SPPS-16 | How often U.S. adults thought about the impact of science in their everyday life, before, during, and beyond the COVID-19 pandemic: 2019–21 | 3M | State of Science Index Survey |
| Table SPPS-17 | Participation in science activities in the past 12 months, by demographic characteristic: 2020 | Pew Research Center | American Trends Panel |
 An official website of the United States government

