 An official website of the United States government
 U.S. Business R&D
U.S. business R&D expenditures are measured as current costs, which include labor costs; materials and supplies; expensed equipment (not capitalized); leased facilities and equipment; and expenses for depreciation and amortization on property, plant, and equipment. These expenditures are dominated by labor costs, in comparison with current costs associated with facilities or equipment such as rental expenses or expensed equipment (Moris and Shackelford 2023b).
Of the $608.6 billion of U.S. business R&D performed in 2021, $602.5 billion was performed by companies with 10 or more domestic employees, and $6.1 billion was performed by businesses with 9 or fewer domestic employees (or microbusinesses) (Kindlon 2023; Britt 2023). Statistics are from NCSES’s Annual Business Survey (ABS) for microbusinesses and the Business Enterprise Research and Development (BERD) Survey for the larger companies.
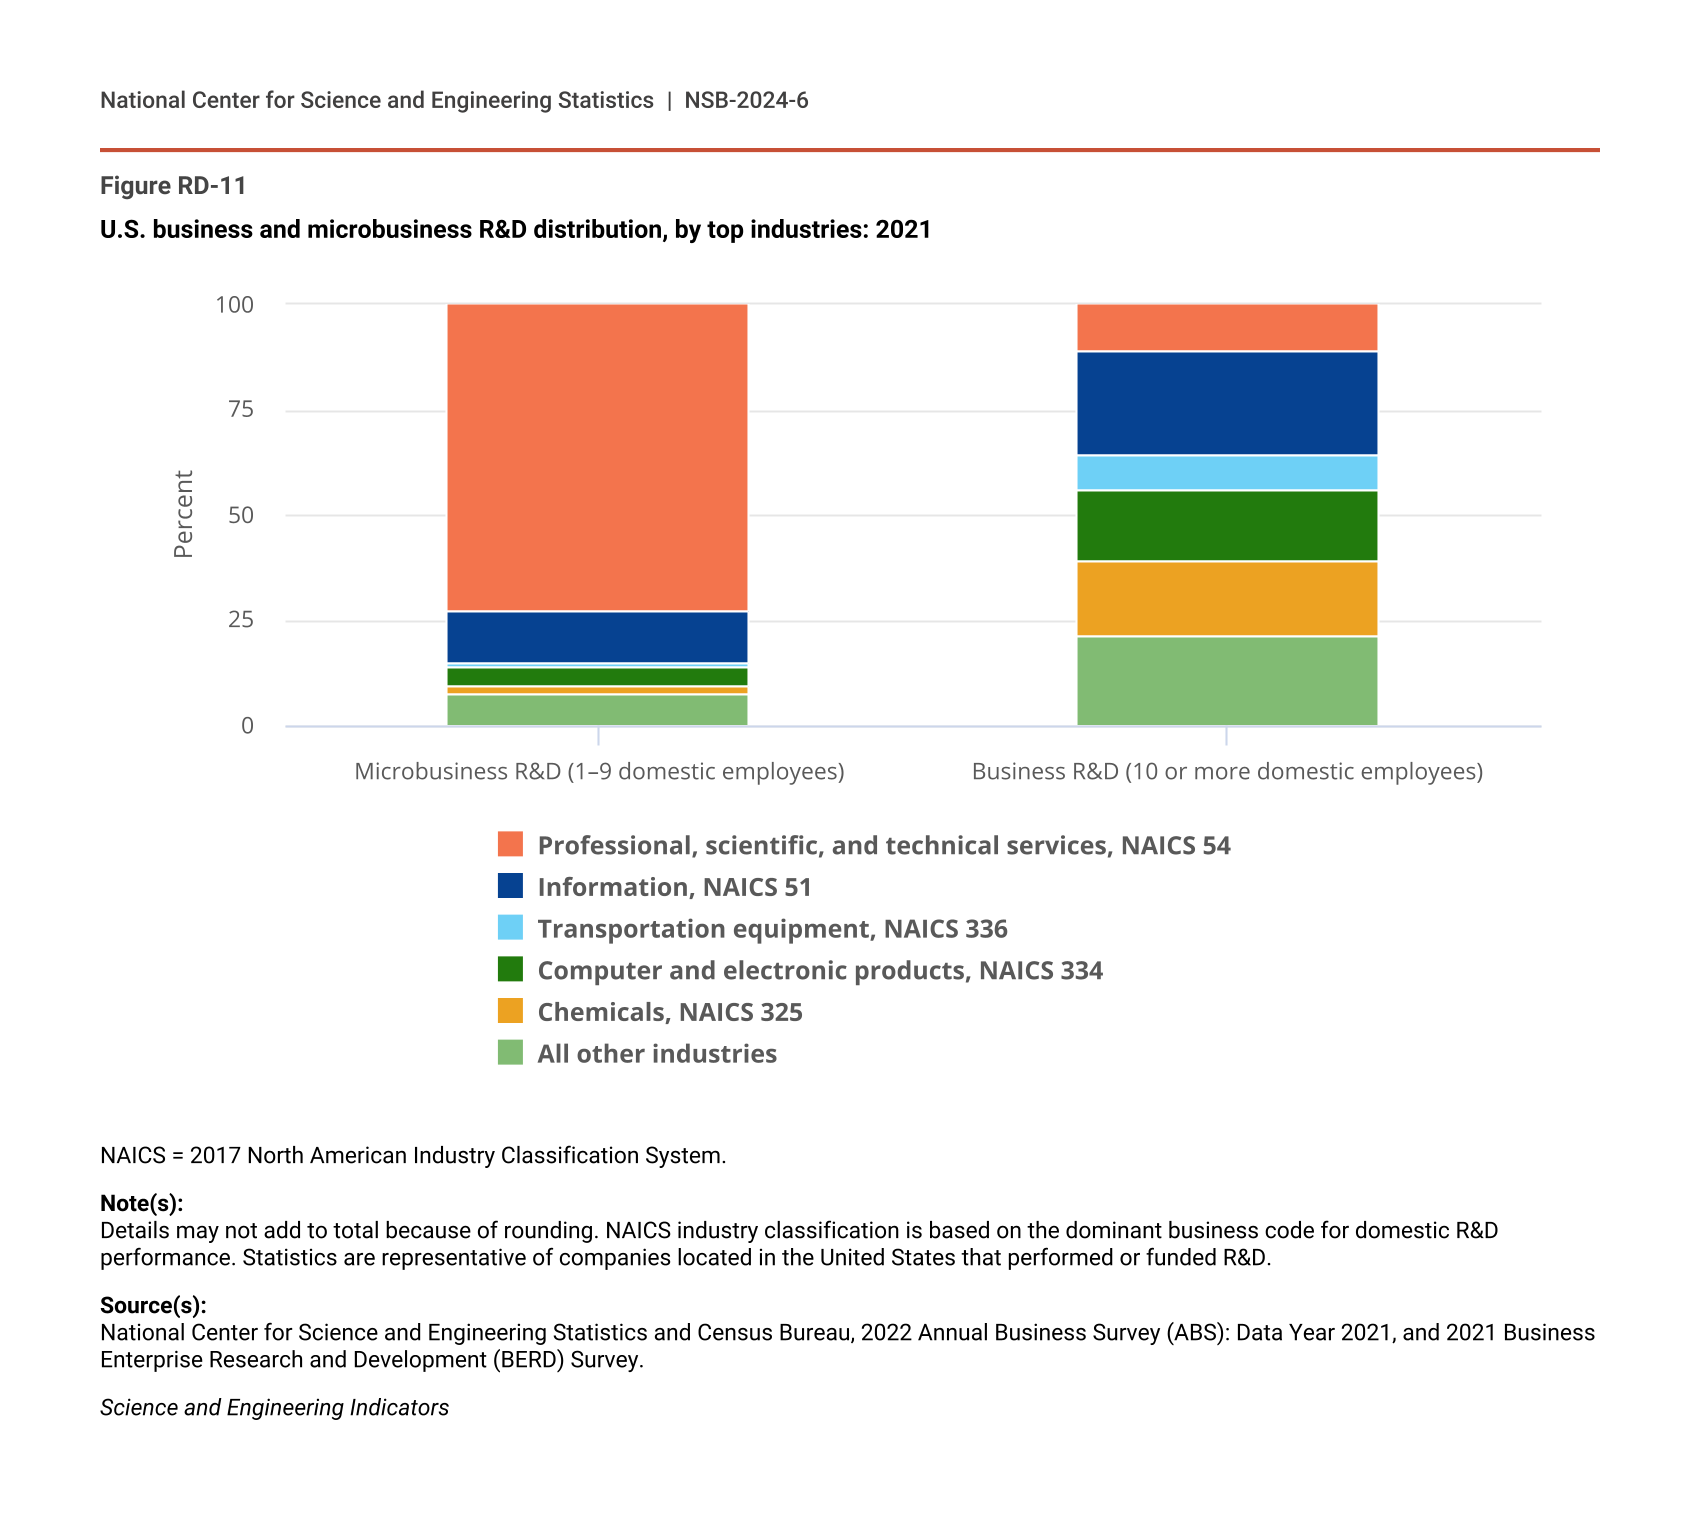
The largest proportion of R&D by businesses with 10 or more domestic employees is performed by the manufacturing sector (54% in 2021) (Table RD-6), whereas 88% of microbusiness R&D is performed by the nonmanufacturing sector (Kindlon 2023, Table 4). Figure RD-11 shows the distribution of domestic R&D for the top 5 R&D-performing industries (based on North American Industry Classification System [NAICS] codes) for these two broad size categories. The dominance of nonmanufacturing for microbusinesses is largely driven by the 73% share of R&D by firms classified in professional, scientific, and R&D services (NAICS 54), whereas the share of information (NAICS 51) was 12% for microbusinesses compared with 25% for larger companies. (See Table SRD-3 and Table SRD-4 for detailed company size R&D distribution from these sources.)
Domestic net sales, R&D, and R&D-to-sales ratio for companies that performed or funded U.S. business R&D, by selected industry: 2021
i = more than 50% of the estimate is a combination of imputation and reweighting to account for nonresponse.
NAICS = 2017 North American Industry Classification System.
a Dollar values are for goods sold or services rendered by R&D-performing or R&D-funding companies located in the United States to customers outside of the company, including the U.S. federal government, foreign customers, and the company's foreign subsidiaries. Included are revenues from a company’s foreign operations and subsidiaries and from discontinued operations. If a respondent company is owned by a foreign parent company, sales to the parent company and to affiliates not owned by the respondent company are included. Excluded are intracompany transfers; returns; allowances; freight charges; and excise, sales, and other revenue-based taxes.
b Domestic R&D is the cost of R&D paid for and performed by the respondent company and paid for by others outside of the company and performed by the respondent company.
Note(s):
Data are for companies with 10 or more domestic employees. Detail may not add to total because of rounding. Industry classification was based on the dominant business code for domestic R&D performance, where available. For companies that did not report business codes, the classification used for sampling was assigned.
Source(s):
National Center for Science and Engineering Statistics and Census Bureau, Business Enterprise Research and Development (BERD) Survey, 2021.
Science and Engineering Indicators
U.S. business and microbusiness R&D distribution, by top industries: 2021
| Company size | All other industries | Chemicals, NAICS 325 | Computer and electronic products, NAICS 334 | Transportation equipment, NAICS 336 | Information, NAICS 51 | Professional, scientific, and technical services, NAICS 54 |
|---|---|---|---|---|---|---|
| Microbusiness R&D (1–9 domestic employees) | 7.3 | 2.2 | 4.6 | 0.6 | 12.4 | 73.1 |
| Business R&D (10 or more domestic employees) | 21.1 | 18.2 | 16.8 | 8.4 | 24.5 | 11.0 |
NAICS = 2017 North American Industry Classification System.
Note(s):
Details may not add to total because of rounding. NAICS industry classification is based on the dominant business code for domestic R&D performance. Statistics are representative of companies located in the United States that performed or funded R&D.
Source(s):
National Center for Science and Engineering Statistics and Census Bureau, 2022 Annual Business Survey (ABS): Data Year 2021, and 2021 Business Enterprise Research and Development (BERD) Survey.
Science and Engineering Indicators
Industries That Perform the Most U.S. Business R&D
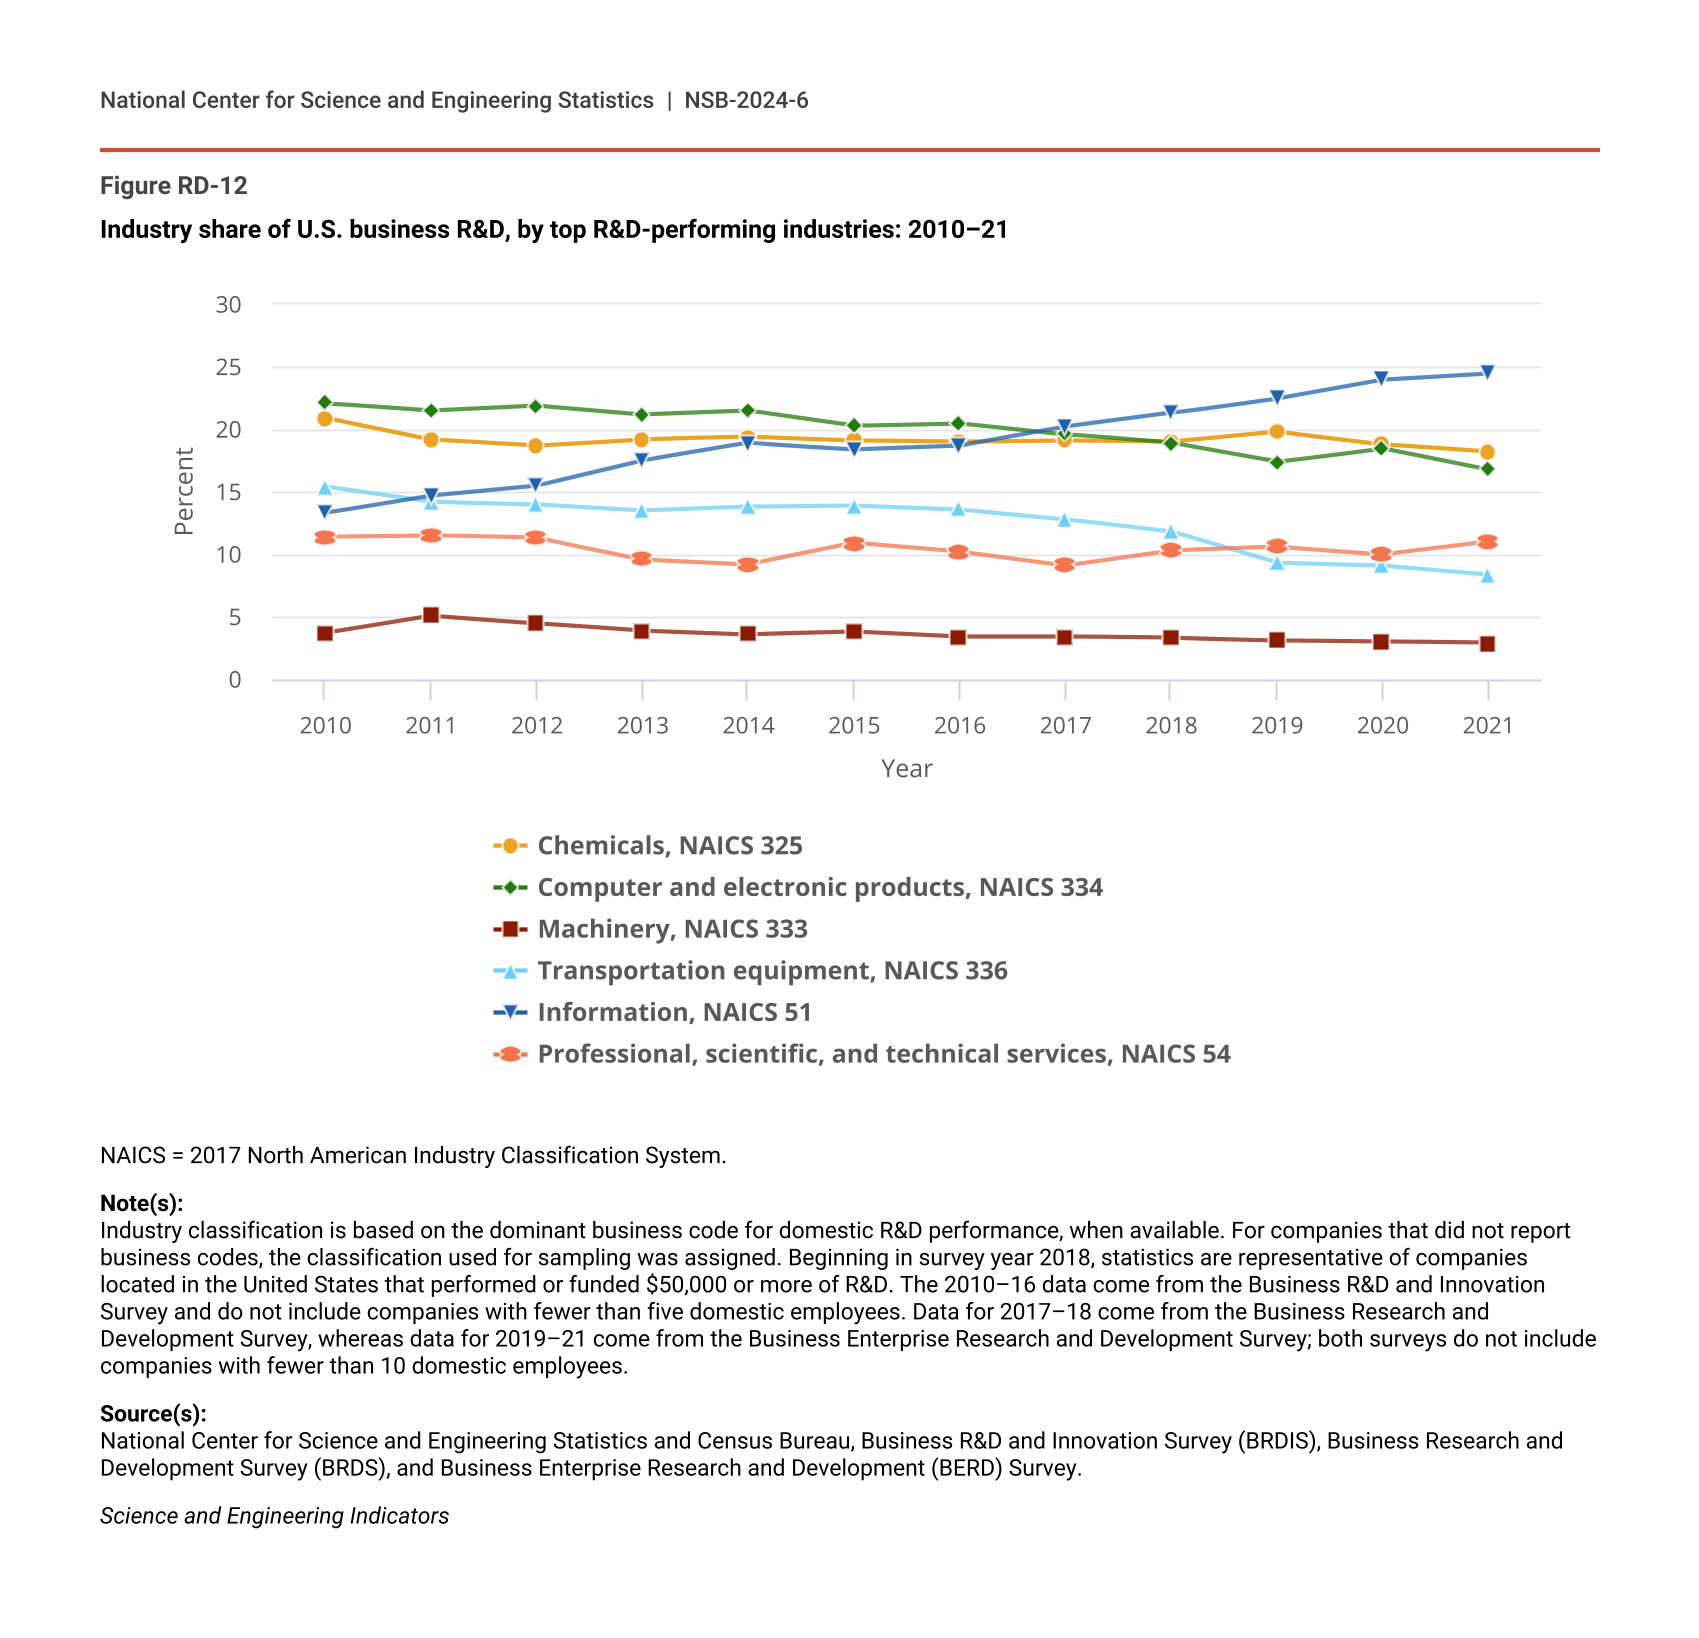
The rest of this section focuses on R&D activities by businesses with 10 or more domestic employees from the NCSES BERD Survey. Five industries accounted for 79% of the $602.5 billion of U.S. business R&D performed by these companies in 2021: information (including software publishing) at 25%; chemicals manufacturing (including pharmaceuticals and medicines) at 18%; computer and electronic products manufacturing (including semiconductors) at 17%; professional, scientific, and technical services (including R&D services) at 11%; and transportation equipment manufacturing (including motor vehicles and aerospace products and parts) at 8% (Figure RD-12; Table RD-6). Machinery manufacturing companies performed another 3%. The latter six NAICS industries are major R&D-intensive or knowledge- and technology-intensive industries covered in the Indicators 2024 report “Production and Trade of Knowledge- and Technology-Intensive Industries” with analysis of output, trade, and GVCs. Indeed, these six industries are among the largest R&D intensive as measured by domestic R&D-to-sales ratio (Table RD-6). At the four-digit NAICS level, the industries with the largest R&D intensities were scientific R&D services (41%), semiconductor and other electronic components manufacturing (20%), pharmaceuticals and medicines manufacturing (16%), and software publishers (13%).
Industry share of U.S. business R&D, by top R&D-performing industries: 2010–21
| Year | Chemicals, NAICS 325 | Computer and electronic products, NAICS 334 | Machinery, NAICS 333 | Transportation equipment, NAICS 336 | Information, NAICS 51 | Professional, scientific, and technical services, NAICS 54 |
|---|---|---|---|---|---|---|
| 2010 | 20.9 | 22.1 | 3.7 | 15.4 | 13.3 | 11.4 |
| 2011 | 19.2 | 21.5 | 5.1 | 14.2 | 14.7 | 11.5 |
| 2012 | 18.7 | 21.9 | 4.5 | 14.0 | 15.5 | 11.3 |
| 2013 | 19.2 | 21.2 | 3.9 | 13.5 | 17.5 | 9.6 |
| 2014 | 19.4 | 21.5 | 3.6 | 13.8 | 18.9 | 9.2 |
| 2015 | 19.1 | 20.3 | 3.8 | 13.9 | 18.4 | 10.9 |
| 2016 | 19.0 | 20.5 | 3.4 | 13.6 | 18.7 | 10.2 |
| 2017 | 19.1 | 19.6 | 3.4 | 12.8 | 20.2 | 9.1 |
| 2018 | 19.0 | 18.9 | 3.3 | 11.8 | 21.3 | 10.3 |
| 2019 | 19.8 | 17.4 | 3.1 | 9.3 | 22.5 | 10.6 |
| 2020 | 18.8 | 18.5 | 3.0 | 9.1 | 24.0 | 10.0 |
| 2021 | 18.2 | 16.8 | 2.9 | 8.4 | 24.5 | 11.0 |
NAICS = 2017 North American Industry Classification System.
Note(s):
Industry classification is based on the dominant business code for domestic R&D performance, when available. For companies that did not report business codes, the classification used for sampling was assigned. Beginning in survey year 2018, statistics are representative of companies located in the United States that performed or funded $50,000 or more of R&D. The 2010–16 data come from the Business R&D and Innovation Survey and do not include companies with fewer than five domestic employees. Data for 2017–18 come from the Business Research and Development Survey, whereas data for 2019–21 come from the Business Enterprise Research and Development Survey; both surveys do not include companies with fewer than 10 domestic employees.
Source(s):
National Center for Science and Engineering Statistics and Census Bureau, Business R&D and Innovation Survey (BRDIS), Business Research and Development Survey (BRDS), and Business Enterprise Research and Development (BERD) Survey.
Science and Engineering Indicators
Across industries, close to 90% of U.S. business R&D is funded by the performing company. In the information industry, this share is 99% (Table RD-7). At the other extreme, only 18% of R&D performed by the scientific R&D services industry is funded internally, reflecting contract R&D for other companies, domestic and foreign, and on behalf of the federal government. Domestic company customers funded 54% of the U.S. R&D of this industry, and the federal government funded another 12%. In the manufacturing sector, aerospace products and parts had one of the lowest shares of R&D funded internally (46%). For this industry, the federal government funded 49% of its domestic R&D.
U.S. business R&D performance, by source of funds: 2021
i = more than 50% of the estimate or its component(s) is a combination of imputation and reweighting to account for nonresponse.
NAICS = 2017 North American Industry Classification System; nec = not elsewhere classified.
a All R&D is the cost of R&D paid for and performed by the respondent company and paid for by others outside of the company and performed by the respondent company.
Note(s):
Data are for companies with 10 or more domestic employees. Detail may not add to total because of rounding. Beginning in survey year 2018, companies that performed or funded less than $50,000 of R&D were excluded from tabulation. These companies in aggregate represented a very small share of total R&D expenditures in prior years. Had the companies under this threshold been included in the 2018 estimates, they would have contributed approximately $90 million to overall R&D expenditures. Industry classification was based on the dominant business code for domestic R&D performance, where available. For companies that did not report business codes, the classification used for sampling was assigned. Excludes data for federally funded research and development centers.
Source(s):
National Center for Science and Engineering Statistics and Census Bureau, Business Enterprise Research and Development (BERD) Survey, 2021.
Science and Engineering Indicators
Geographical locations of the performance of U.S. business R&D are not evenly distributed among the states. Of the $602.5 billion of business R&D performed by businesses with 10 or more domestic employees in 2021, California accounted for $211.6 billion, or 35%, in 2021 (Table SRD-5). The next-largest shares in 2021 were for Washington (8%); Massachusetts (7%); Texas (5%); and New York, New Jersey, and Michigan (4% each).
U.S. Business R&D in Selected Critical and Emerging Technologies
R&D in critical and emerging technologies, such as semiconductors, artificial intelligence (AI), synthetic biology, biomanufacturing, and other advanced manufacturing processes, contribute to economic competitiveness and national security (DOD/DSB 2022; NSTC 2022). This section covers U.S. business R&D by the semiconductor manufacturing industry, followed by analysis of software, AI, nanotechnology, and biotechnology R&D across industries. (Federal R&D funding initiatives in some of these areas are covered in the next section.)
Semiconductors or computer chips are critical components for applications in AI, quantum computing, autonomous or electric vehicles, and 5G communications (CRS 2020b, 2023c). Semiconductor production occurs along GVCs comprising R&D, engineering, and design; fabrication; and assembly, testing, and packing stages (CRS 2023c). Modular production and cost advantages in Asia facilitated the separation of design and production starting in the late 1970s and early 1980s with the emergence of chip foundries in Taiwan and other Southeast Asian locations performing contract manufacturing for design-only or fabless companies in the United States and other countries (Kuan and West 2023).
In the United States, semiconductor and other electronic components manufacturing is one of the most R&D-intensive industries, as highlighted earlier. In 2021, semiconductor business R&D increased 9.8% in current U.S. dollars to $47.4 billion after increasing 22.8% in 2020 (Table RD-8). The share of semiconductor manufacturing within overall U.S. computer manufacturing R&D was 47% in 2021 after fluctuating around 40% since 2008.
U.S. R&D performed, by semiconductor manufacturing and other selected industries: 2008–21
NAICS = 2017 North American Industry Classification System.
Note(s):
Data are for companies with 10 or more domestic employees. Detail may not add to total because of rounding. Industry classification is based on the dominant business code for domestic R&D performance, where available. For companies that did not report business codes, the classification used for sampling was assigned. Statistics are representative of companies located in the United States that performed or funded $50,000 or more of R&D and are not comparable with estimates published for years prior to 2018. For survey year 2008, industry classification was based on the 2002 NAICS. For survey years 2009–13, industry classification was based on the 2007 NAICS. For survey years 2014–19, industry classification was based on the 2012 NAICS. For survey years beginning in 2020, classification was based on the 2017 NAICS. Most statistics for years prior to 2020 have been revised since original publication. Revised statistics include adjustments based on information obtained after the original statistics were prepared. An estimate range may be displayed in place of a single estimate to avoid disclosing operations of individual companies.
Source(s):
National Center for Science and Engineering Statistics and Census Bureau, Business Enterprise Research and Development (BERD) Survey.
Science and Engineering Indicators
U.S. business R&D performance focuses on key areas of interest across a wide variety of industries (Table RD-9; Table SRD-6). Software R&D, over half of which is performed in the information services industry, is an increasingly large technology area of U.S. business R&D expenditures. In 2021, software R&D accounted for $257.0 billion, or 43% of $602.5 billion. In 2021, a separate 5% ($28.9 billion) was classified by businesses as R&D specifically devoted to AI applications. The professional, scientific, and technical services industry, which includes scientific R&D services, performed 19% of U.S. business R&D in AI in 2021. Biotechnology R&D accounted for 17% of total U.S. business R&D in 2021. Within R&D performed by pharmaceuticals and medicine manufacturing, 79% was classified as biotechnology. For its part, nanotechnology R&D accounted for 5% of total U.S. business R&D. Within semiconductor manufacturing R&D and semiconductor machinery manufacturing R&D, however, nanotechnology focus accounted for 50% and 43%, respectively.
U.S. business R&D performed, by industry and select technology focus: 2021
i = more than 50% of the estimate is a combination of imputation and reweighting to account for nonresponse.
NAICS = 2017 North American Industry Classification System.
Note(s):
Data are for companies with 10 or more domestic employees. Detail may not add to total because of rounding. Industry classification is based on the dominant business code for domestic R&D performance, where available. For companies that did not report business codes, the classification used for sampling was assigned. Companies could report R&D in one, more than one, or no application area.
Source(s):
National Center for Science and Engineering Statistics and Census Bureau, Business Enterprise Research and Development (BERD) Survey, 2021.
Science and Engineering Indicators