 An official website of the United States government
 Academic R&D: International Comparisons
This section provides information on international comparisons of funding for higher education R&D expenditures. The forthcoming Indicators 2022 report “Research and Development: U.S. Trends and International Comparisons” provides international comparisons of overall R&D.
For a concise summary of trends in global R&D expenditures across all sectors, see Sargent (2020). For comparative detail on R&D performance across sectors, see UNESCO (2020).
International comparisons of academic R&D funding are available from OECD (2020). In terms of overall higher education expenditure on R&D, the United States is still by far the highest, at $74.7 billion in 2018. China is second, at $34.7 billion, followed by Germany ($24.8 billion), Japan ($19.8 billion), and France ($14 billion).
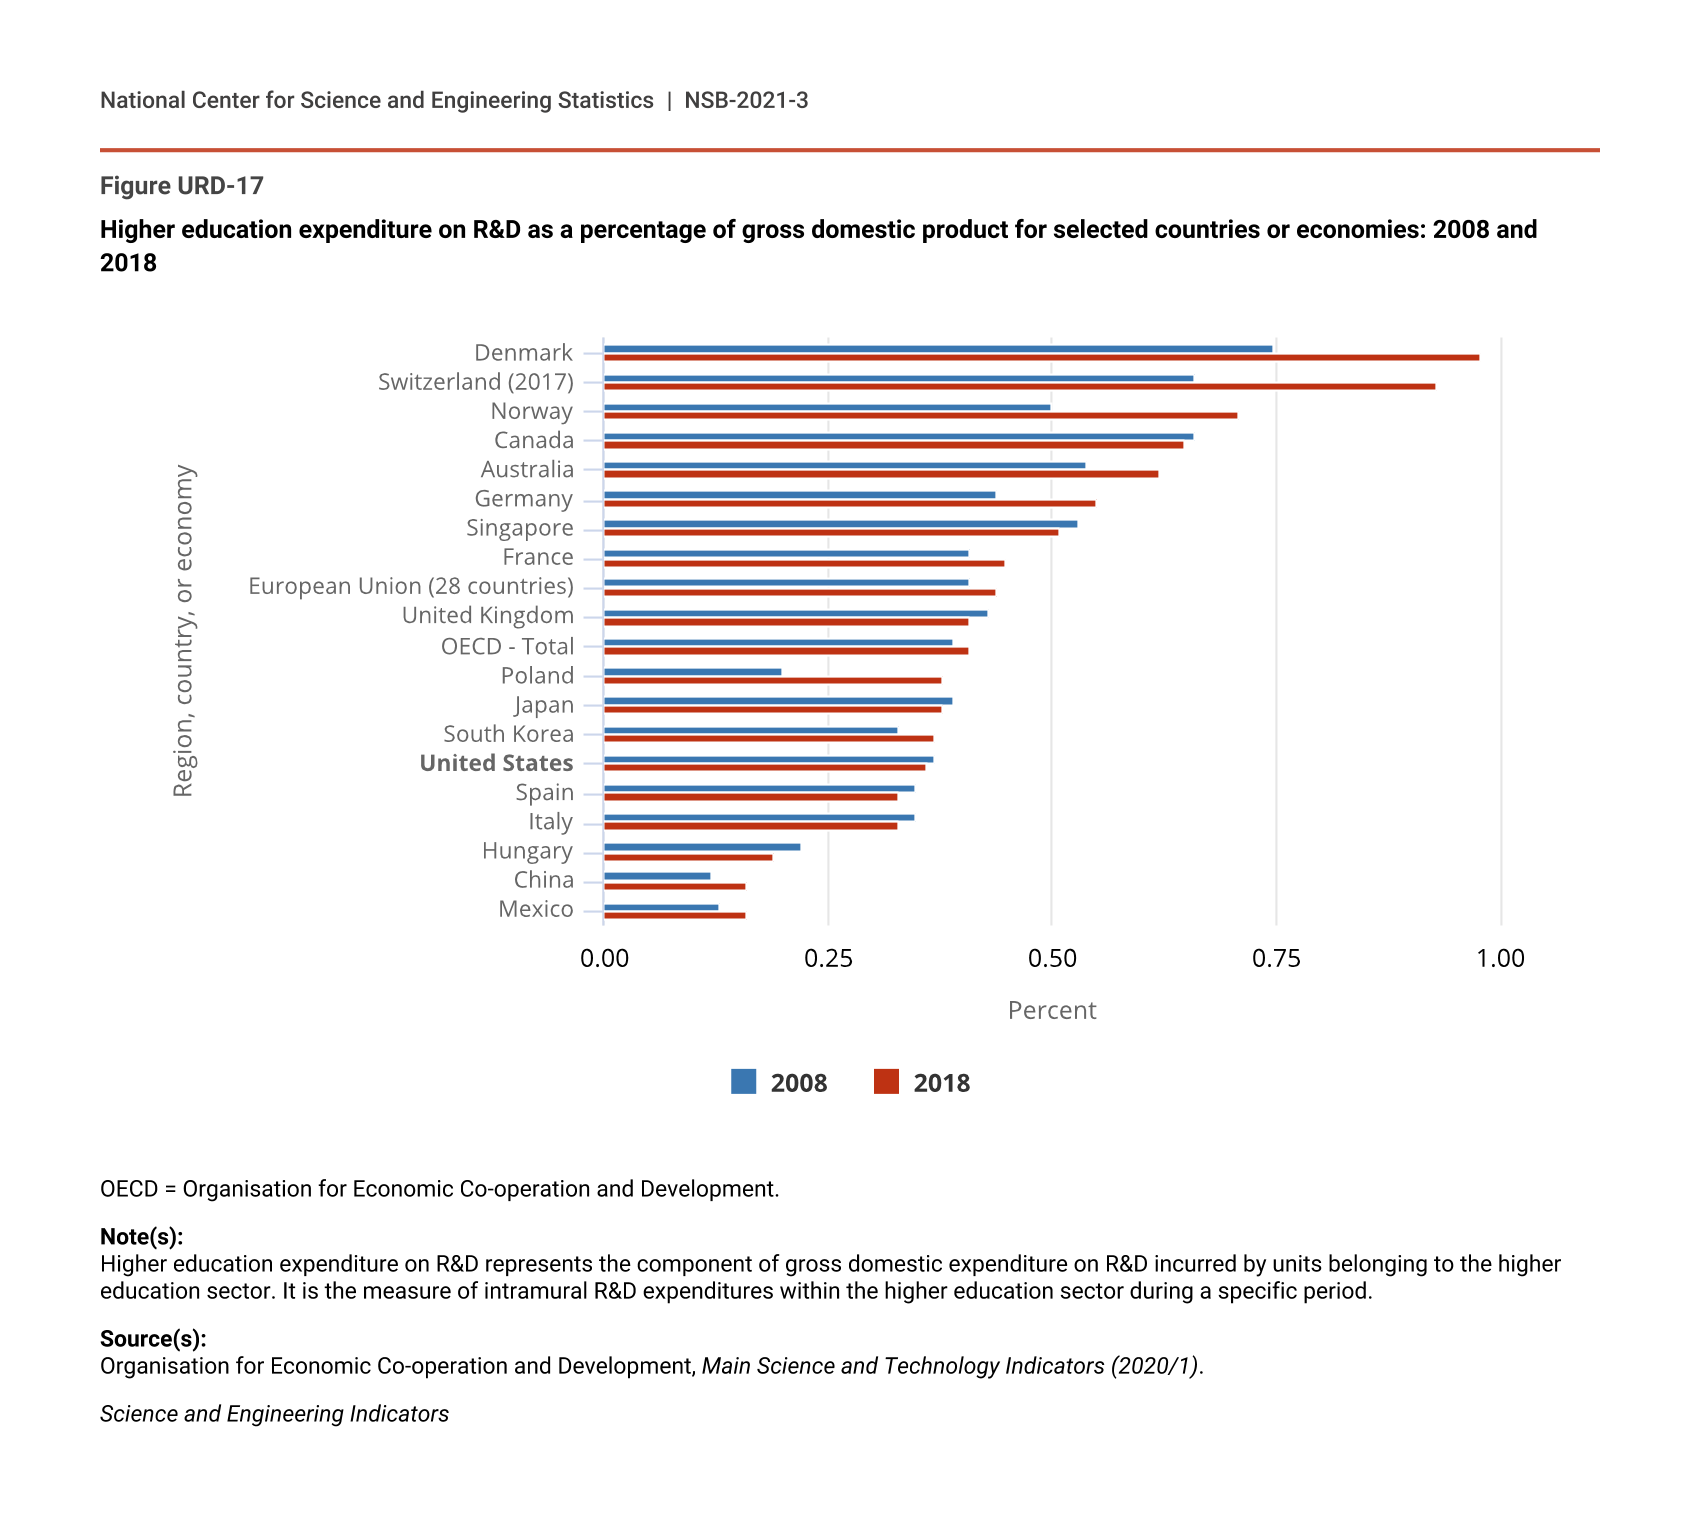
In terms of higher education expenditure on R&D as a percentage of GDP, in 2018 the United States ranked 23rd out of 44 countries or economies for which data were available (Figure URD-17 shows data for selected countries or economies). The U.S. percentage was below the average for the European Union and OECD nations, although higher than several other nations, including China. From 2008 to 2018, the U.S. percentage remained roughly the same, as did its rank.
Higher education expenditure on R&D as a percentage of gross domestic product for selected countries or economies: 2008 and 2018
| Region, country, or economy | 2008 | 2018 |
|---|---|---|
| Denmark | 0.75 | 0.98 |
| Switzerland (2017) | 0.66 | 0.93 |
| Norway | 0.50 | 0.71 |
| Canada | 0.66 | 0.65 |
| Australia | 0.54 | 0.62 |
| Germany | 0.44 | 0.55 |
| Singapore | 0.53 | 0.51 |
| France | 0.41 | 0.45 |
| European Union (28 countries) | 0.41 | 0.44 |
| United Kingdom | 0.43 | 0.41 |
| OECD - Total | 0.39 | 0.41 |
| Poland | 0.20 | 0.38 |
| Japan | 0.39 | 0.38 |
| South Korea | 0.33 | 0.37 |
| United States | 0.37 | 0.36 |
| Spain | 0.35 | 0.33 |
| Italy | 0.35 | 0.33 |
| Hungary | 0.22 | 0.19 |
| China | 0.12 | 0.16 |
| Mexico | 0.13 | 0.16 |
OECD = Organisation for Economic Co-operation and Development.
Note(s):
Higher education expenditure on R&D represents the component of gross domestic expenditure on R&D incurred by units belonging to the higher education sector. It is the measure of intramural R&D expenditures within the higher education sector during a specific period.
Source(s):
Organisation for Economic Co-operation and Development, Main Science and Technology Indicators (2020/1).
Science and Engineering Indicators
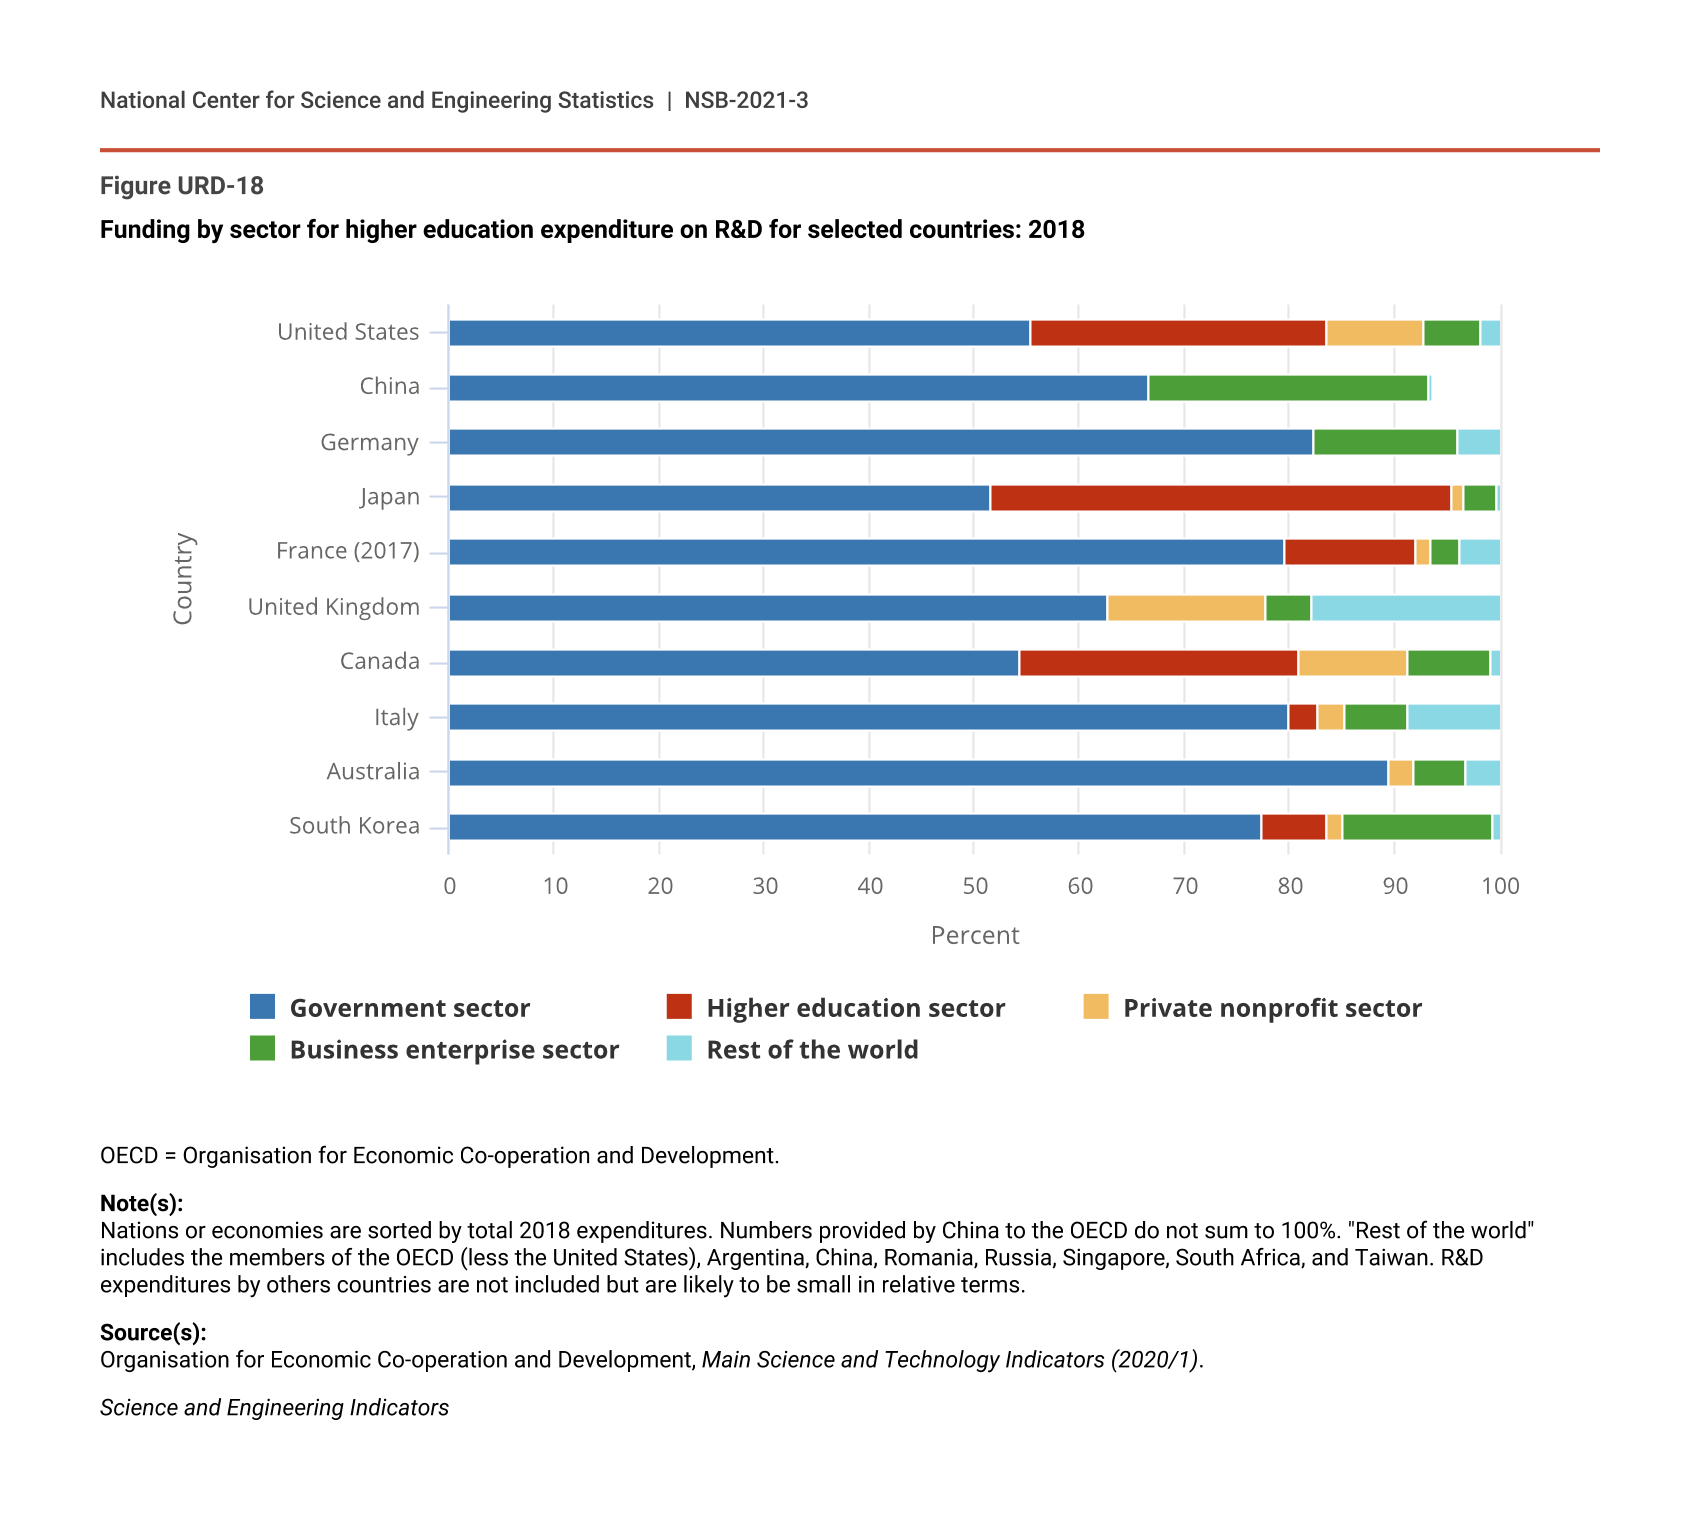
The OECD also provides data on sources of funding for higher education R&D (Figure URD-18 shows data for the 10 countries or economies with the largest higher education expenditures on R&D). The relative contributions of different sectors to higher education R&D differ greatly among nations. In its distribution of funding across sources, the United States most resembles Canada in the proportions provided by funders across sectors, whereas nations such as China and Germany are more similar to one another in relying almost entirely on government and business funding.
Funding by sector for higher education expenditure on R&D for selected countries: 2018
| Country | Government sector | Higher education sector | Private nonprofit sector | Business enterprise sector | Rest of the world |
|---|---|---|---|---|---|
| United States | 55.35 | 28.26 | 9.28 | 5.42 | 1.68 |
| China | 66.69 | 0.00 | 0.00 | 26.56 | 0.40 |
| Germany | 82.44 | 0.00 | 0.00 | 13.50 | 4.06 |
| Japan | 51.65 | 43.86 | 1.13 | 3.25 | 0.11 |
| France (2017) | 79.60 | 12.49 | 1.35 | 2.71 | 3.85 |
| United Kingdom | 62.61 | 0.00 | 15.08 | 4.45 | 17.87 |
| Canada | 54.38 | 26.51 | 10.42 | 7.85 | 0.83 |
| Italy | 79.95 | 2.79 | 2.57 | 6.02 | 8.67 |
| Australia | 89.42 | 0.00 | 2.47 | 4.90 | 3.21 |
| South Korea | 77.29 | 6.24 | 1.58 | 14.25 | 0.64 |
OECD = Organisation for Economic Co-operation and Development.
Note(s):
Nations or economies are sorted by total 2018 expenditures. Numbers provided by China to the OECD do not sum to 100%. "Rest of the world" includes the members of the OECD (less the United States), Argentina, China, Romania, Russia, Singapore, South Africa, and Taiwan. R&D expenditures by others countries are not included but are likely to be small in relative terms.
Source(s):
Organisation for Economic Co-operation and Development, Main Science and Technology Indicators (2020/1).
Science and Engineering Indicators
Although government sources provide more than half of U.S. higher education R&D funding, this is a smaller percentage than 8 of the top 10 nations. The U.S. higher education sector provides more than one-quarter of the funding, higher than any other nation in the top 10 except Japan.
In some nations, government funds come from both direct government funding and general university funds. These funds are defined as “coming from the general grant universities receive from the central government (federal) ministry of education or the corresponding provincial (state) or local (municipal) authorities in support of their overall research/teaching activities” (OECD 2015).
Six of the 10 nations shown in Figure URD-18 reported separate expenditures from general university funds (Australia, Canada, France, Italy, Japan, and the United Kingdom), and four did not separately report these expenditures (China, Germany, South Korea, and the United States). The proportion of total government funding from general university funds does not have a straightforward relationship with either total amount of government funding or the percentage of higher education R&D financed by governments.