 An official website of the United States government
 Financial Resources for Academic R&D
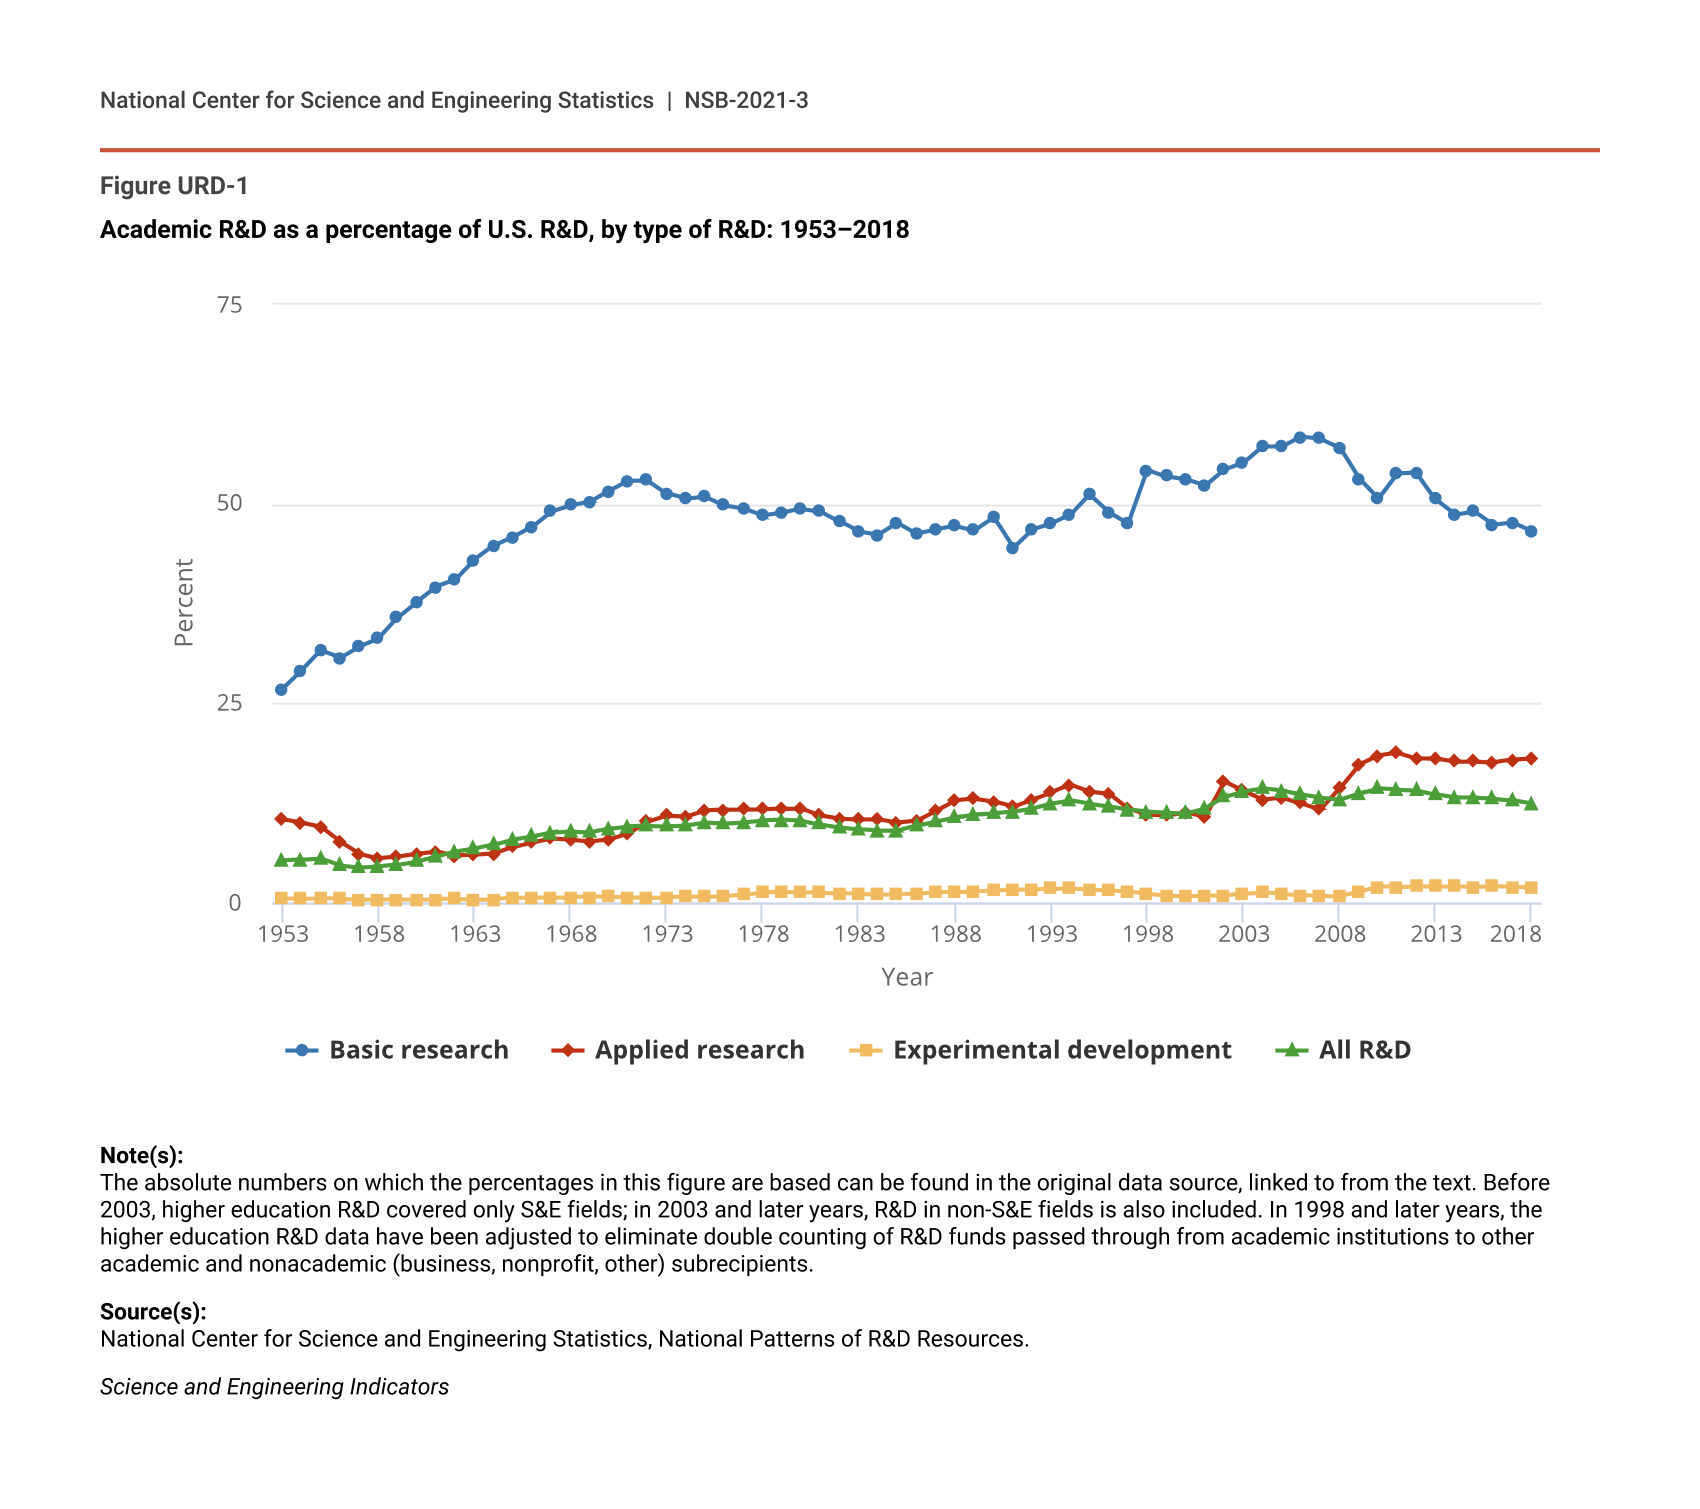
R&D conducted by higher education institutions is a key component of the overall U.S. R&D system. In 2018, the higher education sector performed 12% ($74.9 billion) of the overall $606 billion in U.S. R&D, a proportion that has fluctuated within a narrow range for several decades (Figure URD-1; NCSES NP 2019: Table 2; for more detail on research performance by other sectors, see the forthcoming Indicators 2022 report “Research and Development: U.S. Trends and International Comparisons”). Although universities perform all types of R&D, they have long been the nation’s largest performers of basic research (for definitions of basic research, applied research, and experimental development, see the Glossary section). In 2018, they performed $47 billion in basic research, or 46% of the national total. After a period of increase beginning in the early 1990s, the proportion of U.S. basic research performed by the higher education sector declined over the last 10 years of available data. Higher education institutions also performed about 18% ($20.9 billion) of all U.S. applied research and less than 2% ($7 billion) of all U.S. experimental development in 2018; these percentages have increased over the last 10 years.
Academic R&D as a percentage of U.S. R&D, by type of R&D: 1953–2018
| Year | Basic research | Applied research | Experimental development | All R&D |
|---|---|---|---|---|
| 1953 | 26.74 | 10.40 | 0.47 | 5.29 |
| 1954 | 29.08 | 9.94 | 0.46 | 5.35 |
| 1955 | 31.58 | 9.45 | 0.51 | 5.53 |
| 1956 | 30.64 | 7.57 | 0.43 | 4.60 |
| 1957 | 32.10 | 6.09 | 0.39 | 4.37 |
| 1958 | 33.09 | 5.51 | 0.39 | 4.50 |
| 1959 | 35.69 | 5.68 | 0.37 | 4.69 |
| 1960 | 37.71 | 6.07 | 0.37 | 5.14 |
| 1961 | 39.58 | 6.37 | 0.37 | 5.73 |
| 1962 | 40.41 | 5.84 | 0.40 | 6.35 |
| 1963 | 42.98 | 5.95 | 0.35 | 6.72 |
| 1964 | 44.70 | 6.09 | 0.39 | 7.20 |
| 1965 | 45.83 | 6.95 | 0.54 | 7.88 |
| 1966 | 47.10 | 7.54 | 0.60 | 8.24 |
| 1967 | 49.05 | 8.02 | 0.61 | 8.72 |
| 1968 | 49.79 | 7.88 | 0.63 | 8.87 |
| 1969 | 50.24 | 7.65 | 0.65 | 8.77 |
| 1970 | 51.61 | 7.84 | 0.66 | 9.20 |
| 1971 | 52.90 | 8.55 | 0.56 | 9.52 |
| 1972 | 52.94 | 10.07 | 0.54 | 9.59 |
| 1973 | 51.31 | 10.89 | 0.62 | 9.54 |
| 1974 | 50.59 | 10.81 | 0.66 | 9.64 |
| 1975 | 50.87 | 11.54 | 0.69 | 10.01 |
| 1976 | 49.79 | 11.61 | 0.73 | 9.89 |
| 1977 | 49.38 | 11.65 | 0.92 | 10.03 |
| 1978 | 48.51 | 11.65 | 1.20 | 10.25 |
| 1979 | 48.85 | 11.72 | 1.32 | 10.32 |
| 1980 | 49.33 | 11.81 | 1.27 | 10.21 |
| 1981 | 49.05 | 10.91 | 1.23 | 9.80 |
| 1982 | 47.80 | 10.51 | 1.15 | 9.42 |
| 1983 | 46.45 | 10.42 | 1.07 | 9.17 |
| 1984 | 46.09 | 10.39 | 1.02 | 8.95 |
| 1985 | 47.63 | 9.95 | 1.01 | 8.99 |
| 1986 | 46.30 | 10.21 | 1.08 | 9.60 |
| 1987 | 46.77 | 11.52 | 1.18 | 10.14 |
| 1988 | 47.22 | 12.80 | 1.30 | 10.62 |
| 1989 | 46.68 | 12.98 | 1.40 | 11.02 |
| 1990 | 48.31 | 12.63 | 1.50 | 11.14 |
| 1991 | 44.44 | 11.94 | 1.61 | 11.32 |
| 1992 | 46.77 | 12.87 | 1.60 | 11.73 |
| 1993 | 47.48 | 13.81 | 1.71 | 12.37 |
| 1994 | 48.57 | 14.72 | 1.76 | 12.77 |
| 1995 | 51.15 | 13.82 | 1.60 | 12.32 |
| 1996 | 48.91 | 13.63 | 1.48 | 12.02 |
| 1997 | 47.52 | 11.79 | 1.32 | 11.62 |
| 1998 | 54.22 | 11.05 | 1.09 | 11.33 |
| 1999 | 53.45 | 10.90 | 0.88 | 11.24 |
| 2000 | 53.03 | 11.26 | 0.75 | 11.16 |
| 2001 | 52.21 | 10.77 | 0.84 | 11.76 |
| 2002 | 54.23 | 15.18 | 0.83 | 13.20 |
| 2003 | 55.12 | 14.02 | 1.03 | 13.93 |
| 2004 | 57.20 | 12.89 | 1.21 | 14.30 |
| 2005 | 57.17 | 13.13 | 1.07 | 13.98 |
| 2006 | 58.38 | 12.43 | 0.89 | 13.50 |
| 2007 | 58.15 | 11.66 | 0.84 | 13.08 |
| 2008 | 57.08 | 14.30 | 0.76 | 12.86 |
| 2009 | 53.15 | 17.32 | 1.30 | 13.63 |
| 2010 | 50.59 | 18.41 | 1.95 | 14.29 |
| 2011 | 53.79 | 18.76 | 1.91 | 14.10 |
| 2012 | 53.89 | 18.05 | 2.00 | 14.04 |
| 2013 | 50.57 | 18.02 | 1.97 | 13.55 |
| 2014 | 48.65 | 17.64 | 1.96 | 13.10 |
| 2015 | 49.05 | 17.68 | 1.95 | 13.07 |
| 2016 | 47.37 | 17.56 | 1.97 | 12.99 |
| 2017 | 47.63 | 17.86 | 1.93 | 12.81 |
| 2018 | 46.46 | 17.97 | 1.81 | 12.36 |
Note(s):
The absolute numbers on which the percentages in this figure are based can be found in the original data source, linked to from the text. Before 2003, higher education R&D covered only S&E fields; in 2003 and later years, R&D in non-S&E fields is also included. In 1998 and later years, the higher education R&D data have been adjusted to eliminate double counting of R&D funds passed through from academic institutions to other academic and nonacademic (business, nonprofit, other) subrecipients.
Source(s):
National Center for Science and Engineering Statistics, National Patterns of R&D Resources.
Science and Engineering Indicators
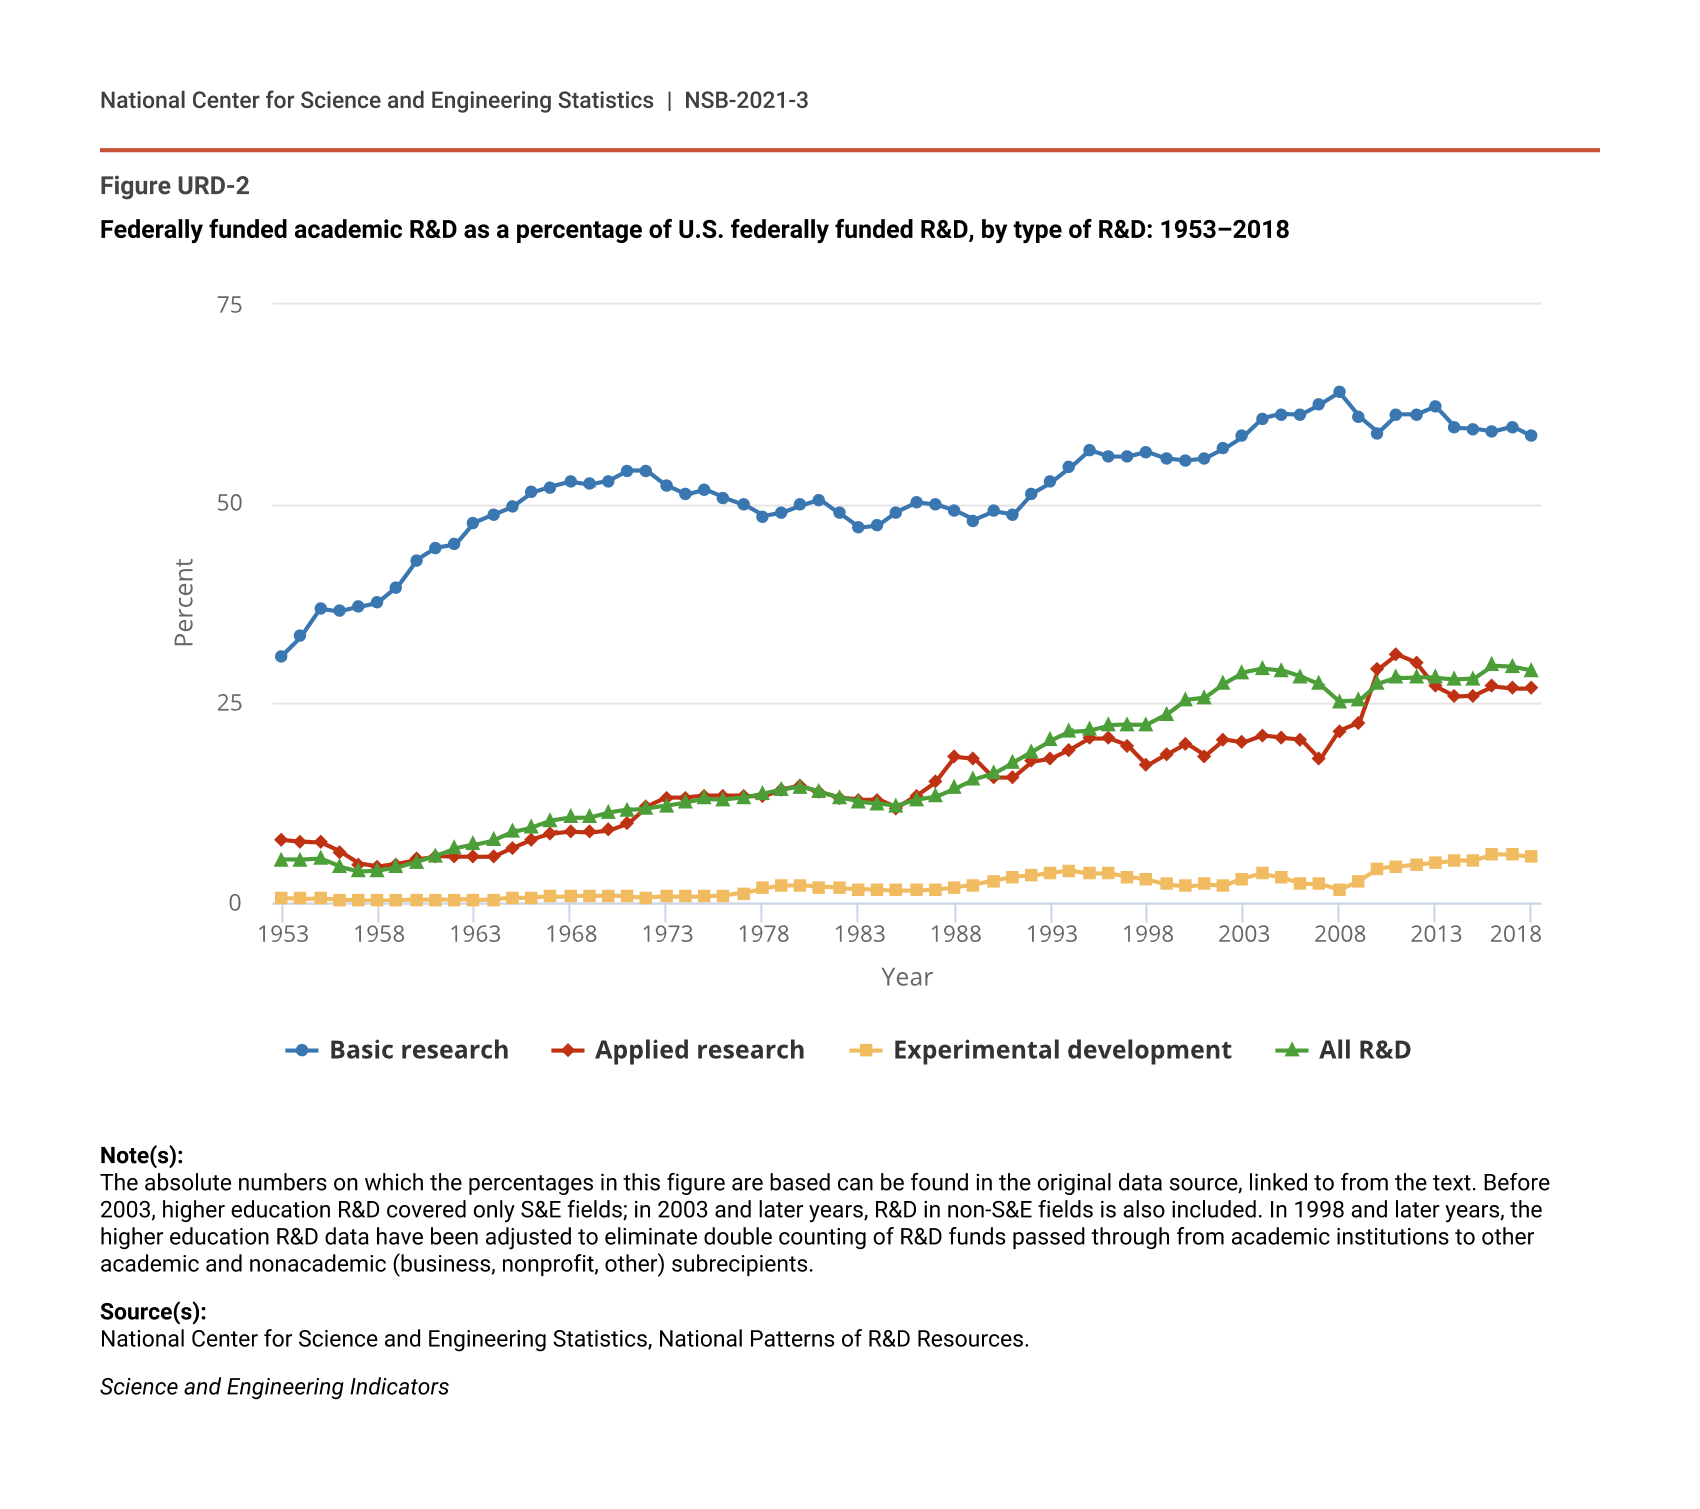
The federal government provided more R&D funding to higher education than to any other sector, including federal intramural R&D (NCSES NP 2019: Table 6). In 2018, the higher education sector performed around 29% ($37.7 billion) of all federally funded R&D, a proportion that has generally increased over time (Figure URD-2; NCSES NP 2019: Table 6). Academic institutions performed around 58% ($24.3 billion) of federally funded basic research, 27% ($10.7 billion) of federally funded applied research, and 6% ($2.8 billion) of federally funded experimental development. The share of federally funded basic research performed by universities has remained relatively flat for the last 10 years, while the shares of applied research and of experimental development have increased.
Federally funded academic R&D as a percentage of U.S. federally funded R&D, by type of R&D: 1953–2018
| Year | Basic research | Applied research | Experimental development | All R&D |
|---|---|---|---|---|
| 1953 | 30.94 | 7.80 | 0.51 | 5.35 |
| 1954 | 33.33 | 7.64 | 0.44 | 5.32 |
| 1955 | 36.79 | 7.52 | 0.51 | 5.45 |
| 1956 | 36.48 | 6.34 | 0.39 | 4.44 |
| 1957 | 37.03 | 4.83 | 0.27 | 3.88 |
| 1958 | 37.62 | 4.41 | 0.26 | 4.01 |
| 1959 | 39.55 | 4.79 | 0.27 | 4.36 |
| 1960 | 42.95 | 5.37 | 0.30 | 5.08 |
| 1961 | 44.44 | 5.74 | 0.33 | 5.87 |
| 1962 | 44.83 | 5.67 | 0.34 | 6.78 |
| 1963 | 47.65 | 5.70 | 0.28 | 7.20 |
| 1964 | 48.67 | 5.77 | 0.35 | 7.79 |
| 1965 | 49.68 | 6.89 | 0.55 | 8.84 |
| 1966 | 51.37 | 7.92 | 0.64 | 9.42 |
| 1967 | 52.11 | 8.61 | 0.69 | 10.24 |
| 1968 | 52.73 | 8.89 | 0.74 | 10.60 |
| 1969 | 52.42 | 8.79 | 0.81 | 10.66 |
| 1970 | 52.90 | 9.03 | 0.90 | 11.25 |
| 1971 | 54.12 | 9.90 | 0.72 | 11.57 |
| 1972 | 54.10 | 12.06 | 0.62 | 11.78 |
| 1973 | 52.30 | 13.12 | 0.69 | 12.11 |
| 1974 | 51.14 | 13.13 | 0.71 | 12.49 |
| 1975 | 51.77 | 13.33 | 0.76 | 12.95 |
| 1976 | 50.73 | 13.35 | 0.83 | 12.91 |
| 1977 | 49.92 | 13.37 | 1.16 | 13.11 |
| 1978 | 48.46 | 13.31 | 1.77 | 13.64 |
| 1979 | 48.92 | 14.16 | 2.09 | 14.13 |
| 1980 | 49.80 | 14.59 | 2.06 | 14.46 |
| 1981 | 50.54 | 13.80 | 1.91 | 13.84 |
| 1982 | 48.80 | 13.10 | 1.78 | 13.14 |
| 1983 | 46.98 | 12.84 | 1.61 | 12.57 |
| 1984 | 47.24 | 12.91 | 1.54 | 12.37 |
| 1985 | 48.96 | 11.86 | 1.50 | 12.14 |
| 1986 | 50.12 | 13.38 | 1.51 | 12.87 |
| 1987 | 49.84 | 15.17 | 1.63 | 13.25 |
| 1988 | 49.08 | 18.22 | 1.87 | 14.29 |
| 1989 | 47.95 | 18.05 | 2.19 | 15.41 |
| 1990 | 49.01 | 15.63 | 2.69 | 16.13 |
| 1991 | 48.57 | 15.63 | 3.24 | 17.55 |
| 1992 | 51.29 | 17.64 | 3.35 | 18.92 |
| 1993 | 52.67 | 18.06 | 3.75 | 20.33 |
| 1994 | 54.50 | 19.16 | 4.02 | 21.38 |
| 1995 | 56.70 | 20.52 | 3.64 | 21.59 |
| 1996 | 55.87 | 20.52 | 3.60 | 22.22 |
| 1997 | 55.87 | 19.59 | 3.23 | 22.24 |
| 1998 | 56.50 | 17.17 | 2.89 | 22.30 |
| 1999 | 55.70 | 18.54 | 2.24 | 23.52 |
| 2000 | 55.44 | 19.94 | 1.98 | 25.42 |
| 2001 | 55.66 | 18.34 | 2.27 | 25.72 |
| 2002 | 56.86 | 20.42 | 2.15 | 27.46 |
| 2003 | 58.44 | 20.01 | 2.99 | 28.86 |
| 2004 | 60.72 | 20.89 | 3.54 | 29.32 |
| 2005 | 61.26 | 20.62 | 3.14 | 29.08 |
| 2006 | 61.22 | 20.43 | 2.40 | 28.29 |
| 2007 | 62.46 | 17.95 | 2.26 | 27.32 |
| 2008 | 63.91 | 21.52 | 1.54 | 25.20 |
| 2009 | 60.93 | 22.49 | 2.73 | 25.24 |
| 2010 | 58.92 | 29.22 | 4.26 | 27.39 |
| 2011 | 61.23 | 31.06 | 4.43 | 28.14 |
| 2012 | 61.15 | 30.04 | 4.69 | 28.24 |
| 2013 | 62.16 | 27.10 | 4.99 | 28.17 |
| 2014 | 59.49 | 25.82 | 5.29 | 27.98 |
| 2015 | 59.44 | 25.96 | 5.27 | 28.07 |
| 2016 | 59.07 | 27.06 | 5.97 | 29.67 |
| 2017 | 59.70 | 26.79 | 5.94 | 29.59 |
| 2018 | 58.44 | 26.81 | 5.78 | 29.12 |
Note(s):
The absolute numbers on which the percentages in this figure are based can be found in the original data source, linked to from the text. Before 2003, higher education R&D covered only S&E fields; in 2003 and later years, R&D in non-S&E fields is also included. In 1998 and later years, the higher education R&D data have been adjusted to eliminate double counting of R&D funds passed through from academic institutions to other academic and nonacademic (business, nonprofit, other) subrecipients.
Source(s):
National Center for Science and Engineering Statistics, National Patterns of R&D Resources.
Science and Engineering Indicators
Type of R&D Performed by Academic Institutions
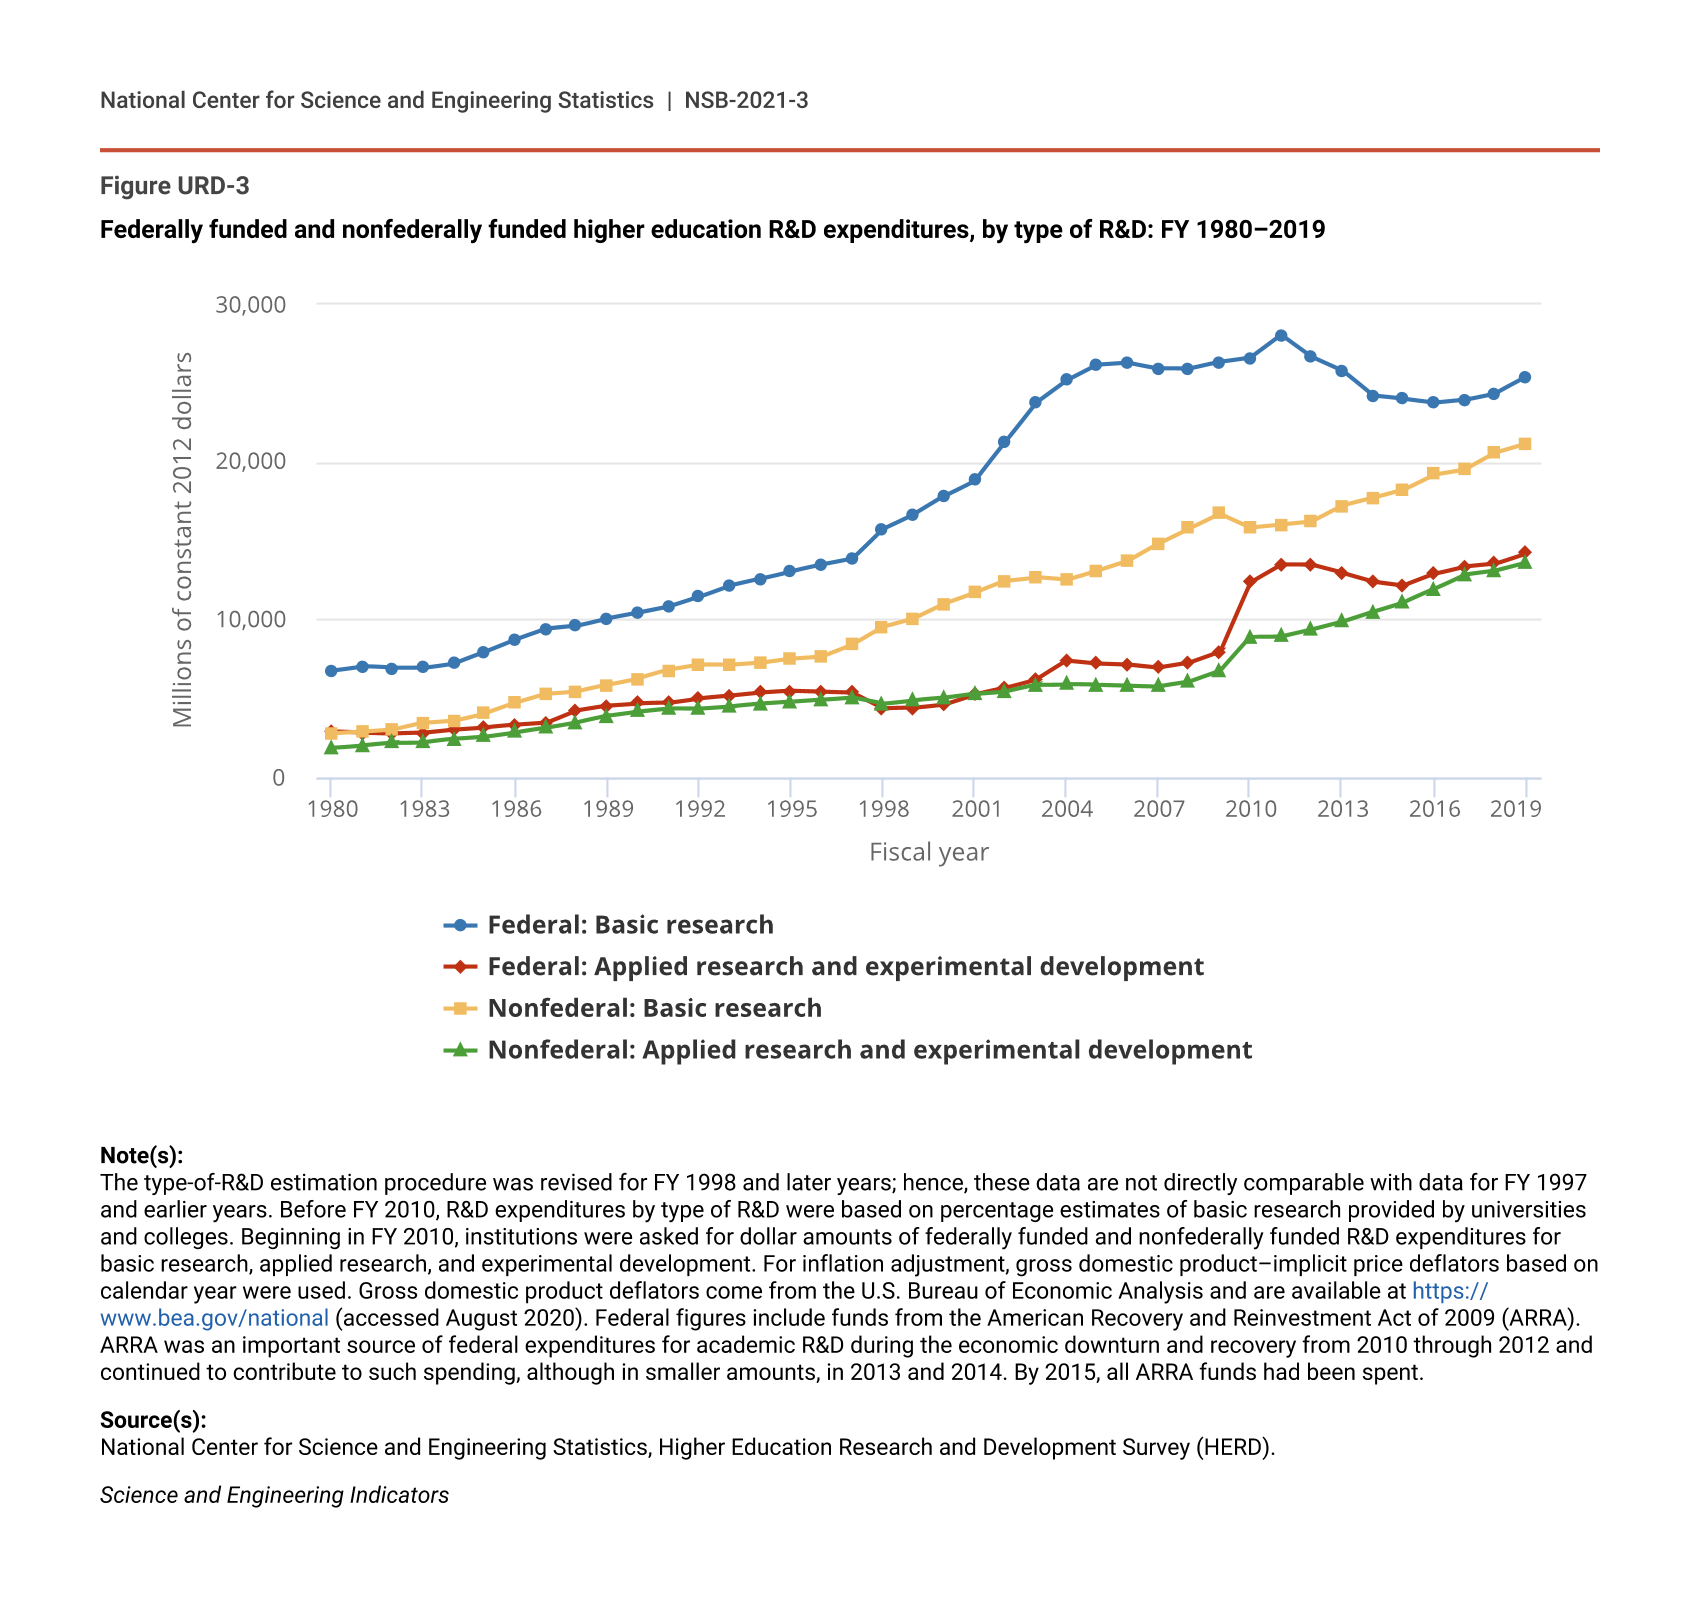
In 2019, academic institutions performed $83.7 billion in R&D (NCSES HERD 2019: Table 1). Nearly two-thirds (63% in 2019, or around $52 billion) of the R&D performed by academic institutions was basic research, a percentage that has declined slightly in recent years (NCSES HERD 2019: Table 7). After a long period of increase from the 1980s through 2011, federal support for basic research at academic institutions declined over the last decade, although it has made up some of the loss since 2016 (Figure URD-3; note that the federal amounts in this figure from 2010 to 2014 include funds from the American Recovery and Reinvestment Act of 2009). Basic research support from nonfederal sources has increased steadily over time.
Federally funded and nonfederally funded higher education R&D expenditures, by type of R&D: FY 1980–2019
| Fiscal year | Federal: Basic research | Federal: Applied research and experimental development | Nonfederal: Basic research | Nonfederal: Applied research and experimental development |
|---|---|---|---|---|
| 1980 | 6,768.39 | 2,926.43 | 2,779.75 | 1,866.57 |
| 1981 | 7,045.60 | 2,833.37 | 2,883.08 | 2,035.88 |
| 1982 | 6,924.49 | 2,782.41 | 3,006.31 | 2,194.18 |
| 1983 | 6,946.73 | 2,824.13 | 3,439.09 | 2,226.79 |
| 1984 | 7,240.08 | 3,026.47 | 3,597.35 | 2,431.00 |
| 1985 | 7,958.59 | 3,155.58 | 4,055.34 | 2,582.00 |
| 1986 | 8,744.39 | 3,312.38 | 4,713.49 | 2,857.91 |
| 1987 | 9,421.56 | 3,449.61 | 5,290.10 | 3,141.10 |
| 1988 | 9,613.95 | 4,258.38 | 5,445.31 | 3,477.82 |
| 1989 | 10,094.51 | 4,557.60 | 5,862.80 | 3,892.78 |
| 1990 | 10,442.91 | 4,697.66 | 6,276.11 | 4,168.37 |
| 1991 | 10,829.54 | 4,725.01 | 6,804.92 | 4,363.42 |
| 1992 | 11,464.65 | 5,016.34 | 7,127.15 | 4,349.38 |
| 1993 | 12,185.14 | 5,168.31 | 7,116.95 | 4,482.01 |
| 1994 | 12,612.59 | 5,362.98 | 7,260.97 | 4,646.97 |
| 1995 | 13,077.78 | 5,479.34 | 7,531.65 | 4,771.11 |
| 1996 | 13,484.56 | 5,435.91 | 7,670.13 | 4,913.91 |
| 1997 | 13,856.28 | 5,380.79 | 8,443.25 | 5,066.49 |
| 1998 | 15,757.17 | 4,380.98 | 9,558.98 | 4,665.25 |
| 1999 | 16,689.80 | 4,406.18 | 10,087.73 | 4,882.81 |
| 2000 | 17,848.36 | 4,624.74 | 11,028.43 | 5,028.18 |
| 2001 | 18,846.97 | 5,248.78 | 11,723.27 | 5,290.14 |
| 2002 | 21,297.96 | 5,666.87 | 12,462.68 | 5,460.83 |
| 2003 | 23,773.01 | 6,208.82 | 12,691.38 | 5,870.88 |
| 2004 | 25,186.36 | 7,400.33 | 12,507.67 | 5,905.87 |
| 2005 | 26,178.22 | 7,208.88 | 13,118.28 | 5,855.64 |
| 2006 | 26,309.54 | 7,143.33 | 13,750.42 | 5,821.03 |
| 2007 | 25,949.83 | 6,951.02 | 14,839.44 | 5,773.60 |
| 2008 | 25,912.18 | 7,257.11 | 15,795.50 | 6,054.31 |
| 2009 | 26,342.11 | 7,948.42 | 16,724.21 | 6,735.79 |
| 2010 | 26,619.50 | 12,375.40 | 15,866.19 | 8,905.42 |
| 2011 | 28,061.56 | 13,487.57 | 16,047.70 | 8,927.84 |
| 2012 | 26,674.00 | 13,469.00 | 16,223.00 | 9,363.00 |
| 2013 | 25,804.83 | 12,958.92 | 17,226.81 | 9,863.40 |
| 2014 | 24,202.05 | 12,426.67 | 17,710.34 | 10,500.77 |
| 2015 | 23,997.32 | 12,177.40 | 18,244.12 | 11,104.00 |
| 2016 | 23,762.77 | 12,911.46 | 19,230.99 | 11,949.49 |
| 2017 | 23,955.99 | 13,387.80 | 19,545.07 | 12,866.96 |
| 2018 | 24,368.99 | 13,561.20 | 20,596.55 | 13,108.79 |
| 2019 | 25,387.49 | 14,212.54 | 21,166.93 | 13,610.37 |
Note(s):
The type-of-R&D estimation procedure was revised for FY 1998 and later years; hence, these data are not directly comparable with data for FY 1997 and earlier years. Before FY 2010, R&D expenditures by type of R&D were based on percentage estimates of basic research provided by universities and colleges. Beginning in FY 2010, institutions were asked for dollar amounts of federally funded and nonfederally funded R&D expenditures for basic research, applied research, and experimental development. For inflation adjustment, gross domestic product–implicit price deflators based on calendar year were used. Gross domestic product deflators come from the U.S. Bureau of Economic Analysis and are available at https://www.bea.gov/national (accessed August 2020). Federal figures include funds from the American Recovery and Reinvestment Act of 2009 (ARRA). ARRA was an important source of federal expenditures for academic R&D during the economic downturn and recovery from 2010 through 2012 and continued to contribute to such spending, although in smaller amounts, in 2013 and 2014. By 2015, all ARRA funds had been spent.
Source(s):
National Center for Science and Engineering Statistics, Higher Education Research and Development Survey (HERD).
Science and Engineering Indicators
Around a quarter of university R&D ($23.5 billion) was applied research and around a tenth ($7.7 billion) was experimental development (NCSES HERD 2019: Table 8). As percentages of overall academic R&D, applied research and experimental development have increased slightly since 2010. Both federal and nonfederal support for applied research and experimental development increased overall since 2010 (Figure URD-3).
Support for Academic R&D
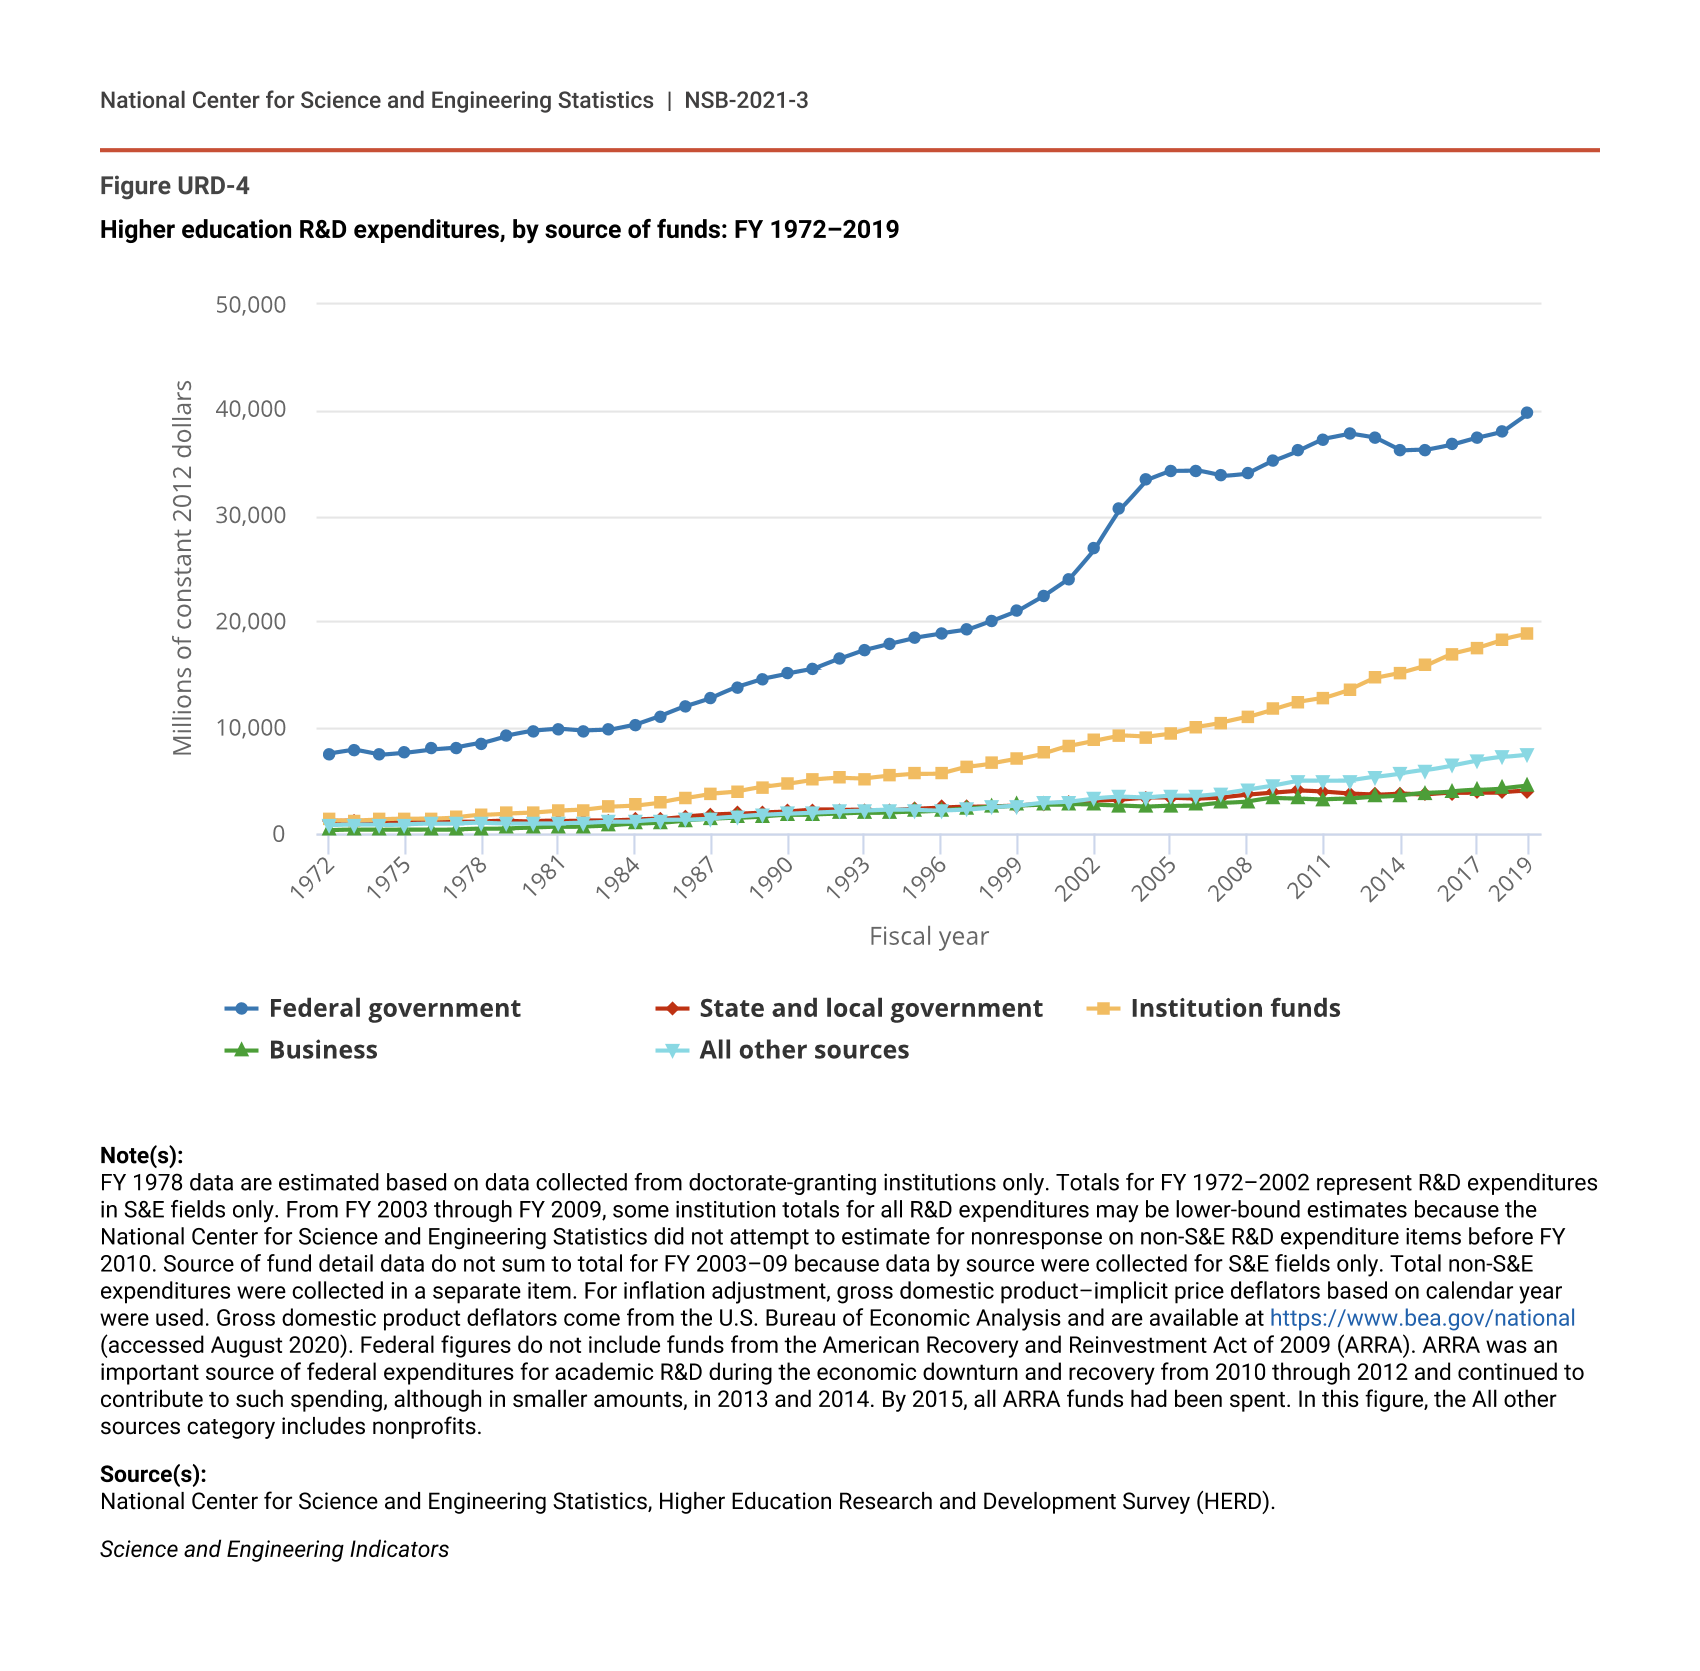
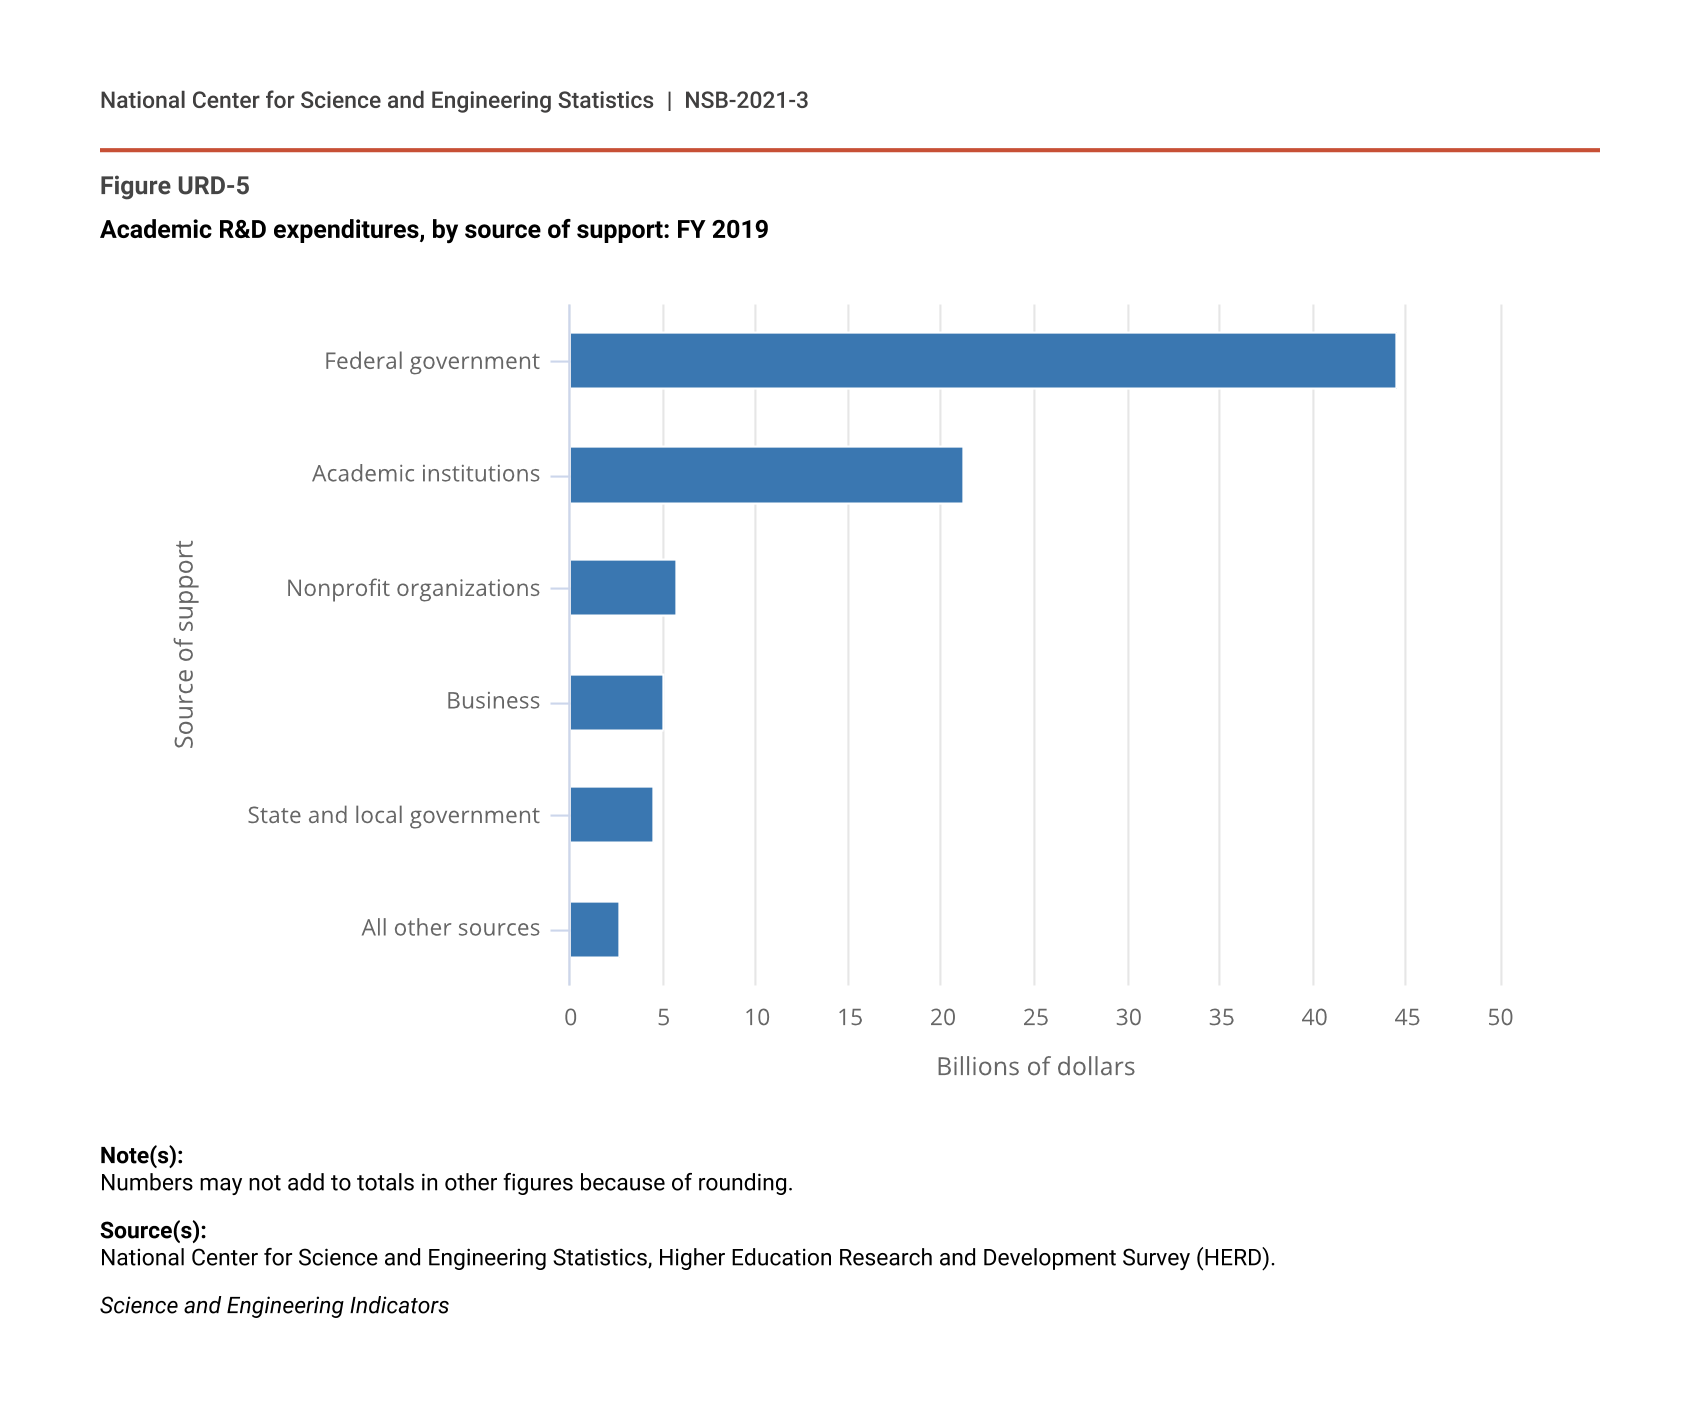
Most academic R&D is funded by a few sources (Figure URD-4 and Figure URD-5). The federal government is by far the largest funder of academic R&D, although its share of total academic R&D has declined over time. Academic institutions themselves are the second-largest funder, and their share of total academic R&D has grown. Nonprofit organizations and businesses contribute small but slowly growing shares, while the share from state and local governments has declined.
Higher education R&D expenditures, by source of funds: FY 1972–2019
| Fiscal year | Federal government | State and local government | Institution funds | Business | All other sources |
|---|---|---|---|---|---|
| 1972 | 7,554.71 | 1,136.36 | 1,283.67 | 311.45 | 787.04 |
| 1973 | 7,920.99 | 1,177.17 | 1,268.95 | 335.20 | 806.07 |
| 1974 | 7,437.77 | 1,123.72 | 1,354.32 | 351.39 | 797.95 |
| 1975 | 7,664.99 | 1,112.23 | 1,396.98 | 378.56 | 867.67 |
| 1976 | 7,977.14 | 1,155.92 | 1,416.32 | 390.60 | 905.05 |
| 1977 | 8,149.48 | 1,118.09 | 1,536.62 | 415.55 | 938.71 |
| 1978 | 8,544.69 | 1,156.42 | 1,740.22 | 474.86 | 1,002.79 |
| 1979 | 9,280.37 | 1,217.44 | 1,895.80 | 497.81 | 949.19 |
| 1980 | 9,694.82 | 1,161.58 | 1,975.40 | 558.32 | 953.39 |
| 1981 | 9,878.97 | 1,180.03 | 2,169.87 | 628.92 | 940.13 |
| 1982 | 9,704.86 | 1,253.82 | 2,261.35 | 685.94 | 999.39 |
| 1983 | 9,770.86 | 1,226.01 | 2,549.94 | 761.85 | 1,128.08 |
| 1984 | 10,266.54 | 1,304.35 | 2,667.30 | 897.92 | 1,158.79 |
| 1985 | 11,112.33 | 1,378.05 | 2,963.17 | 1,026.20 | 1,271.76 |
| 1986 | 12,056.76 | 1,643.61 | 3,357.28 | 1,257.41 | 1,314.89 |
| 1987 | 12,871.17 | 1,793.16 | 3,800.18 | 1,384.75 | 1,451.36 |
| 1988 | 13,872.33 | 1,872.67 | 3,989.16 | 1,476.46 | 1,583.14 |
| 1989 | 14,653.74 | 1,994.46 | 4,396.28 | 1,619.68 | 1,745.15 |
| 1990 | 15,140.57 | 2,079.47 | 4,721.22 | 1,770.06 | 1,870.58 |
| 1991 | 15,554.54 | 2,239.44 | 5,115.47 | 1,829.23 | 1,985.72 |
| 1992 | 16,480.99 | 2,214.80 | 5,270.35 | 1,899.88 | 2,092.99 |
| 1993 | 17,353.45 | 2,262.04 | 5,207.49 | 1,973.30 | 2,156.12 |
| 1994 | 17,976.99 | 2,209.12 | 5,438.27 | 2,021.59 | 2,237.53 |
| 1995 | 18,557.12 | 2,351.47 | 5,632.39 | 2,071.80 | 2,245.72 |
| 1996 | 18,921.84 | 2,476.09 | 5,701.01 | 2,194.59 | 2,212.35 |
| 1997 | 19,235.73 | 2,565.48 | 6,311.62 | 2,333.11 | 2,299.53 |
| 1998 | 20,136.82 | 2,583.69 | 6,647.18 | 2,509.30 | 2,485.39 |
| 1999 | 21,097.29 | 2,647.64 | 7,047.27 | 2,662.04 | 2,612.28 |
| 2000 | 22,474.39 | 2,817.62 | 7,588.37 | 2,761.27 | 2,888.06 |
| 2001 | 24,097.00 | 2,907.63 | 8,289.26 | 2,779.80 | 3,035.47 |
| 2002 | 26,966.07 | 3,089.45 | 8,800.74 | 2,703.27 | 3,328.81 |
| 2003 | 30,652.86 | 3,203.73 | 9,281.73 | 2,617.49 | 3,459.30 |
| 2004 | 33,385.23 | 3,395.85 | 9,143.67 | 2,511.21 | 3,362.82 |
| 2005 | 34,267.90 | 3,363.07 | 9,454.36 | 2,620.68 | 3,536.95 |
| 2006 | 34,316.64 | 3,292.99 | 10,061.06 | 2,665.70 | 3,550.57 |
| 2007 | 33,777.71 | 3,406.85 | 10,507.08 | 2,892.20 | 3,806.90 |
| 2008 | 34,048.58 | 3,646.58 | 11,007.64 | 3,043.06 | 4,153.59 |
| 2009 | 35,203.16 | 3,838.95 | 11,734.74 | 3,365.26 | 4,520.00 |
| 2010 | 36,202.14 | 4,044.32 | 12,426.39 | 3,331.60 | 4,970.35 |
| 2011 | 37,295.72 | 3,924.79 | 12,821.04 | 3,243.99 | 4,985.73 |
| 2012 | 37,781.26 | 3,744.00 | 13,625.00 | 3,279.00 | 5,007.00 |
| 2013 | 37,383.50 | 3,641.90 | 14,715.02 | 3,454.21 | 5,345.91 |
| 2014 | 36,174.65 | 3,778.46 | 15,226.75 | 3,602.86 | 5,682.17 |
| 2015 | 36,236.86 | 3,693.37 | 15,903.27 | 3,831.96 | 5,995.99 |
| 2016 | 36,738.55 | 3,821.42 | 16,976.92 | 3,988.84 | 6,464.25 |
| 2017 | 37,410.64 | 3,875.22 | 17,561.97 | 4,114.75 | 6,926.01 |
| 2018 | 37,996.37 | 3,908.43 | 18,362.65 | 4,280.15 | 7,224.84 |
| 2019 | 39,670.41 | 4,013.01 | 18,843.76 | 4,505.61 | 7,485.30 |
Note(s):
FY 1978 data are estimated based on data collected from doctorate-granting institutions only. Totals for FY 1972–2002 represent R&D expenditures in S&E fields only. From FY 2003 through FY 2009, some institution totals for all R&D expenditures may be lower-bound estimates because the National Center for Science and Engineering Statistics did not attempt to estimate for nonresponse on non-S&E R&D expenditure items before FY 2010. Source of fund detail data do not sum to total for FY 2003–09 because data by source were collected for S&E fields only. Total non-S&E expenditures were collected in a separate item. For inflation adjustment, gross domestic product–implicit price deflators based on calendar year were used. Gross domestic product deflators come from the U.S. Bureau of Economic Analysis and are available at https://www.bea.gov/national (accessed August 2020). Federal figures do not include funds from the American Recovery and Reinvestment Act of 2009 (ARRA). ARRA was an important source of federal expenditures for academic R&D during the economic downturn and recovery from 2010 through 2012 and continued to contribute to such spending, although in smaller amounts, in 2013 and 2014. By 2015, all ARRA funds had been spent. In this figure, the All other sources category includes nonprofits.
Source(s):
National Center for Science and Engineering Statistics, Higher Education Research and Development Survey (HERD).
Science and Engineering Indicators
Academic R&D expenditures, by source of support: FY 2019
Figure data not available.
Note(s):
Numbers may not add to totals in other figures because of rounding.
Source(s):
National Center for Science and Engineering Statistics, Higher Education Research and Development Survey (HERD).
Science and Engineering Indicators
Federal Support
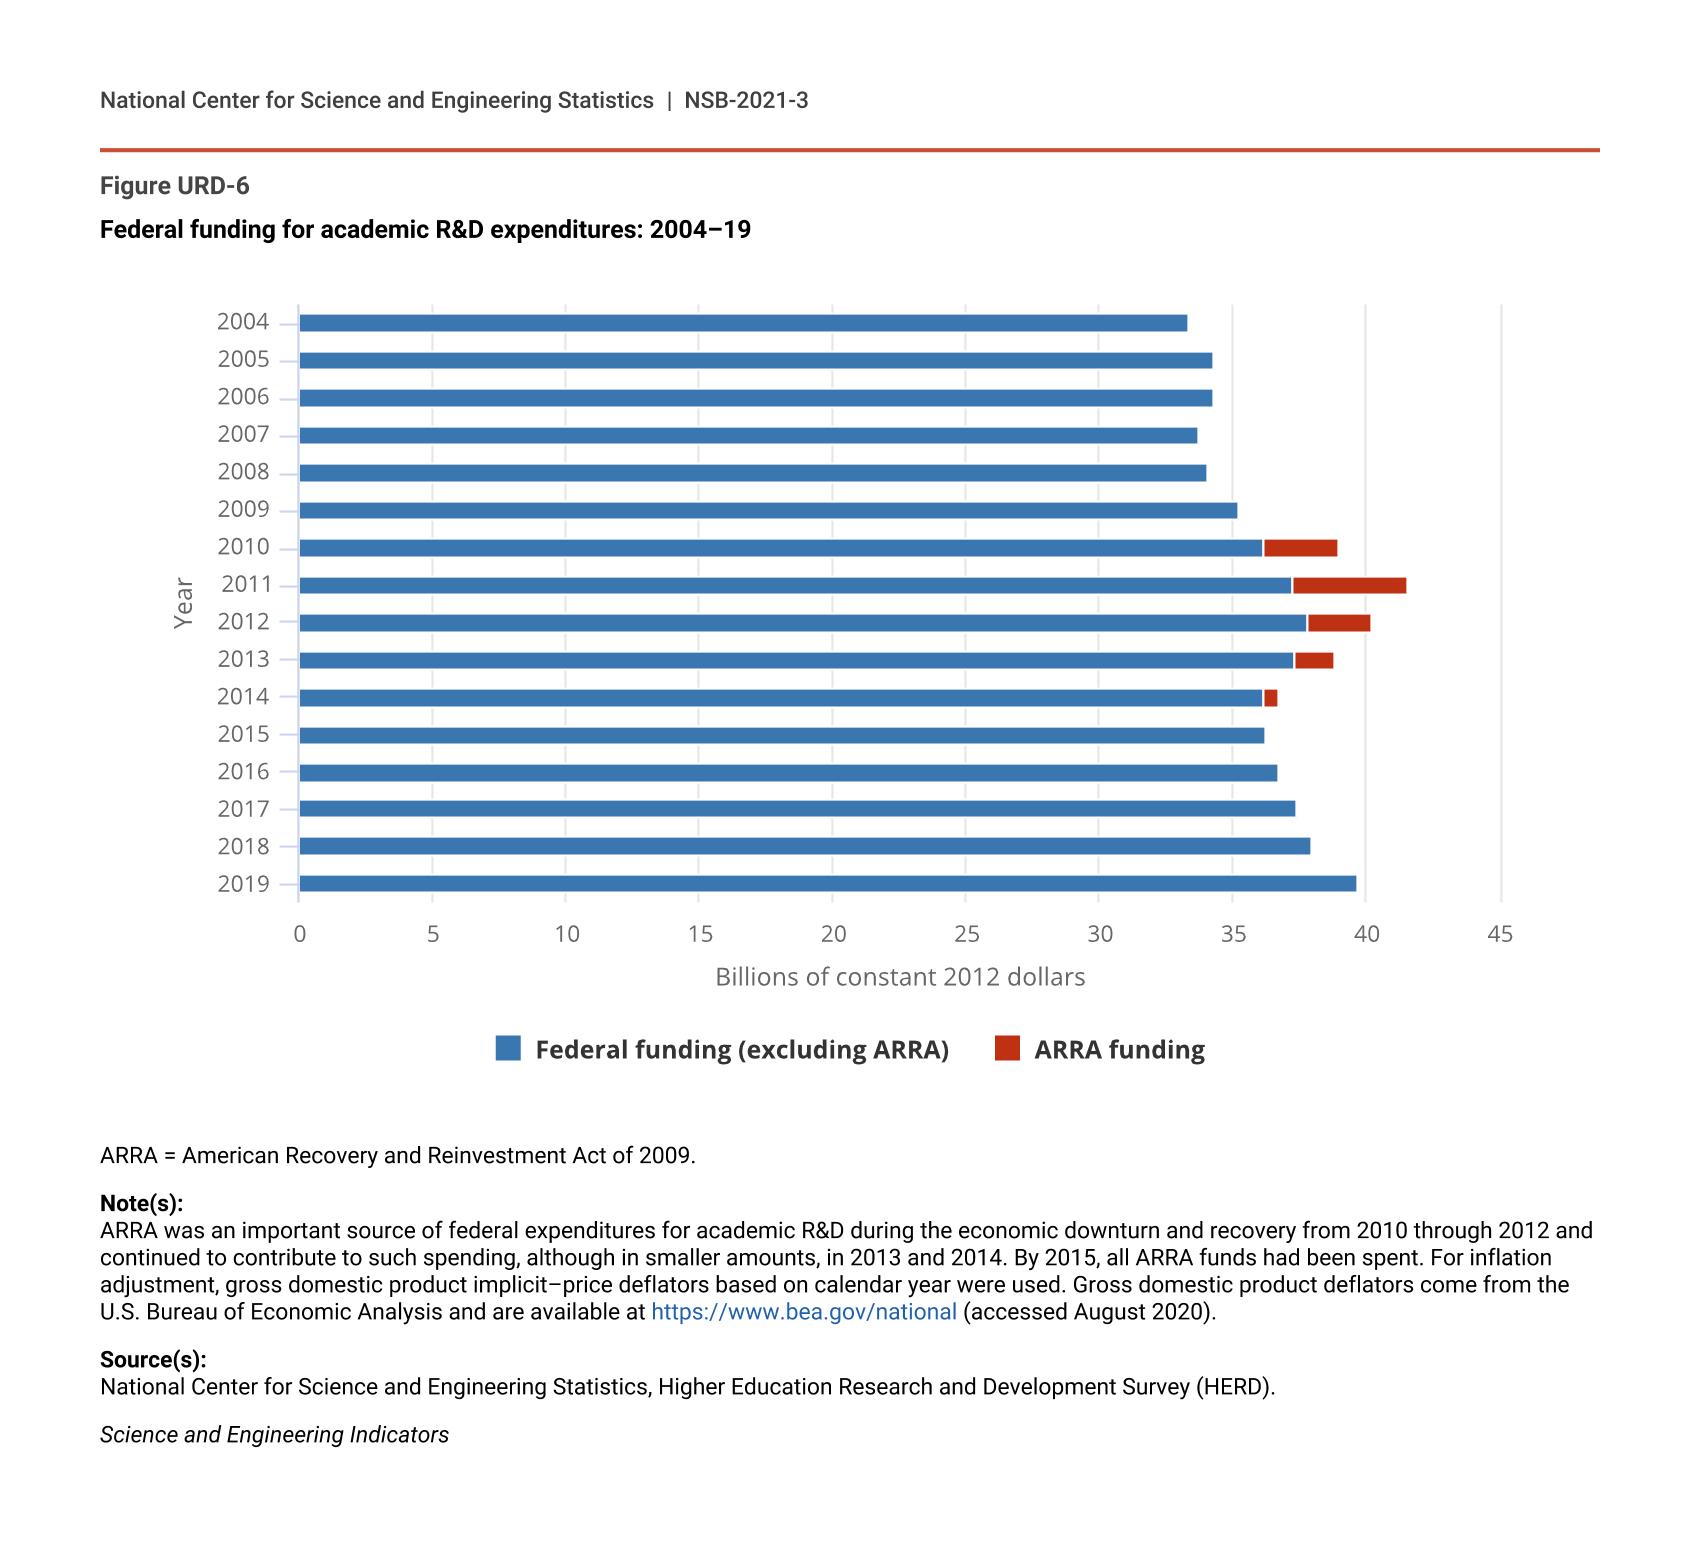
The federal government is the largest funder of academic R&D and provided more than half (53%, or around $45 billion) of total funds in 2019 (Figure URD-5). When adjusted for inflation, federal funding for higher education R&D increased by 4.4% between 2018 and 2019 (Figure URD-6; NCSES HERD 2019: Table 1). After several years of declining funding levels during a period of global recession, federal funding for academic R&D increased by 9.5% between 2015 and 2019.
Federal funding for academic R&D expenditures: 2004–19
| Year | Federal funding (excluding ARRA) | ARRA funding |
|---|---|---|
| 2004 | 33.39 | NA |
| 2005 | 34.27 | NA |
| 2006 | 34.32 | NA |
| 2007 | 33.78 | NA |
| 2008 | 34.05 | NA |
| 2009 | 35.20 | NA |
| 2010 | 36.20 | 2.79 |
| 2011 | 37.30 | 4.25 |
| 2012 | 37.78 | 2.44 |
| 2013 | 37.38 | 1.44 |
| 2014 | 36.17 | 0.52 |
| 2015 | 36.24 | NA |
| 2016 | 36.74 | NA |
| 2017 | 37.41 | NA |
| 2018 | 38.00 | NA |
| 2019 | 39.67 | NA |
ARRA = American Recovery and Reinvestment Act of 2009.
Note(s):
ARRA was an important source of federal expenditures for academic R&D during the economic downturn and recovery from 2010 through 2012 and continued to contribute to such spending, although in smaller amounts, in 2013 and 2014. By 2015, all ARRA funds had been spent. For inflation adjustment, gross domestic product implicit–price deflators based on calendar year were used. Gross domestic product deflators come from the U.S. Bureau of Economic Analysis and are available at https://www.bea.gov/national (accessed August 2020).
Source(s):
National Center for Science and Engineering Statistics, Higher Education Research and Development Survey (HERD).
Science and Engineering Indicators
In the federal government, six agencies provided more than 90% of support for academic R&D (Figure URD-7; NCSES HERD 2019: Table 13). The Department of Health and Human Services (HHS), largely through the National Institutes of Health (NIH), is by far the largest, providing more than half (55%, or $24.4 billion) of federal support in 2019. The Department of Defense (DOD) (15%, or $6.7 billion) and the National Science Foundation (NSF) (12%, or $5.3 billion) are next, followed by the Department of Energy (DOE) (4%, or $1.9 billion), the National Aeronautics and Space Administration (NASA) (4%, or $1.6 billion), and the Department of Agriculture (USDA) (3%, or $1.2 billion). The percentage of total federal academic R&D funding provided by each of these agencies has changed little over the last 10 years.
Federally financed academic R&D expenditures, by agency: FY 2019
| Agency | Academic R&D expenditures |
|---|---|
| HHS | 24.4 |
| DOD | 6.7 |
| NSF | 5.3 |
| DOE | 1.9 |
| NASA | 1.6 |
| USDA | 1.2 |
| Other agencies | 3.3 |
DOD = Department of Defense; DOE = Department of Energy; HHS = Department of Health and Human Services; NASA = National Aeronautics and Space Administration; NSF = National Science Foundation; USDA = Department of Agriculture.
Source(s):
National Center for Science and Engineering Statistics, Higher Education Research and Development Survey (HERD).
Science and Engineering Indicators
Institutional Support
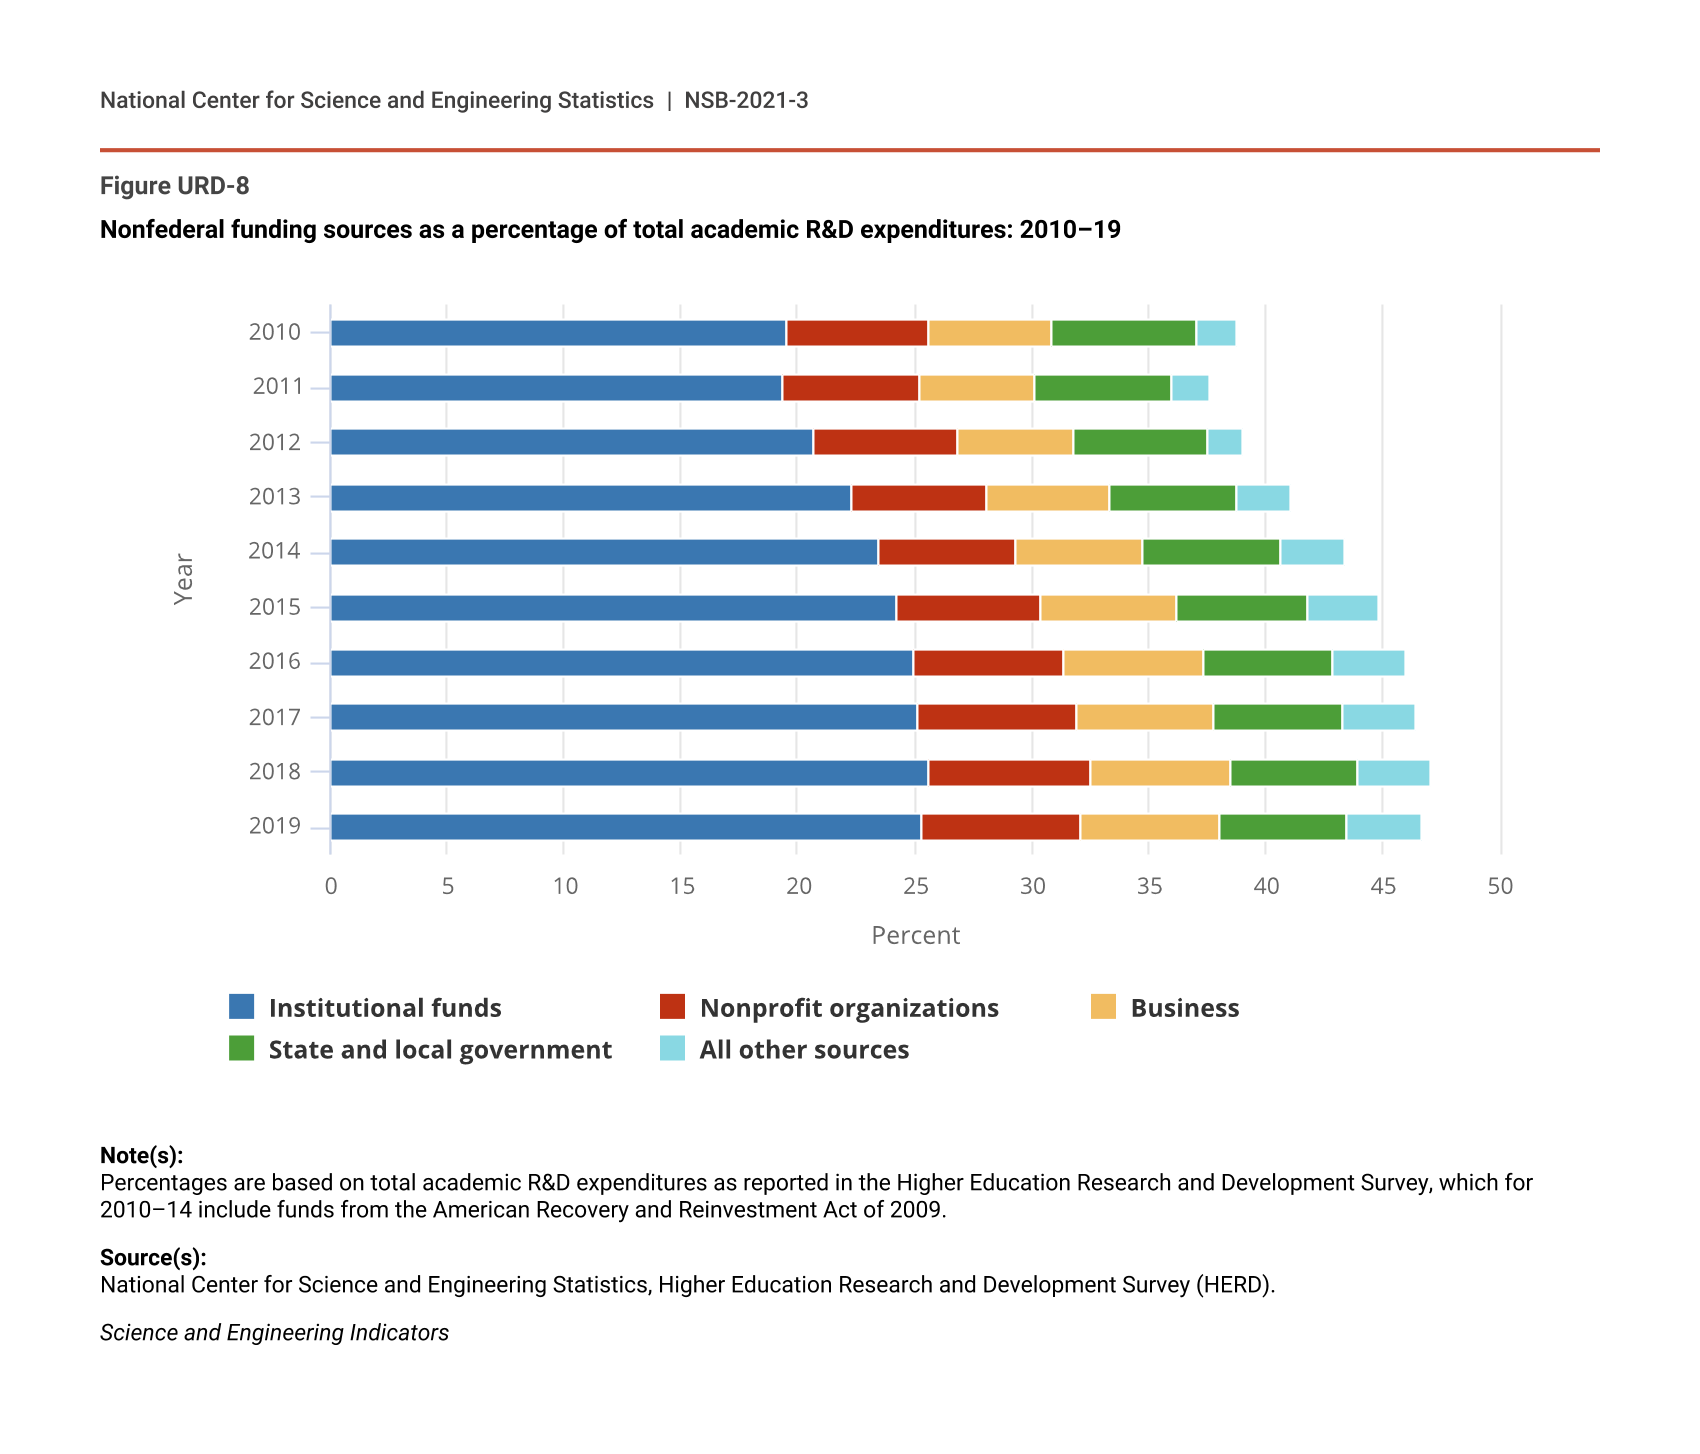
Institutional support, which is funding provided by academic institutions themselves, has represented an increasingly larger share of total academic R&D over time, although its share has changed little since 2016 (Figure URD-8: see NCSES HERD 2019: Table 2). Institutions provided more than $21 billion of academic R&D funding in 2019 (Figure URD-5), and institutional funds constituted a quarter of university R&D, up from a fifth in 2010. When adjusted for inflation, institutional funding for higher education R&D increased by more than 50% between 2010 and 2019. The increase over this period, while faster than in the past, continues a longer-term trend of a rising share of institutional funding; for comparison, institutions contributed 11%–12% of academic R&D funds in the early to mid-1970s. Precise accounting of institutionally financed R&D is difficult, and the trends described here represent increased institutional contributions to R&D as well as improved measurement of those contributions over time.
Nonfederal funding sources as a percentage of total academic R&D expenditures: 2010–19
| Year | Institutional funds | Nonprofit organizations | Business | State and local government | All other sources |
|---|---|---|---|---|---|
| 2010 | 19.5 | 6.1 | 5.2 | 6.3 | 1.7 |
| 2011 | 19.3 | 5.9 | 4.9 | 5.9 | 1.6 |
| 2012 | 20.7 | 6.1 | 5.0 | 5.7 | 1.5 |
| 2013 | 22.3 | 5.8 | 5.2 | 5.5 | 2.3 |
| 2014 | 23.4 | 5.9 | 5.5 | 5.8 | 2.8 |
| 2015 | 24.2 | 6.2 | 5.8 | 5.6 | 3.0 |
| 2016 | 25.0 | 6.4 | 5.9 | 5.6 | 3.1 |
| 2017 | 25.1 | 6.8 | 5.9 | 5.5 | 3.1 |
| 2018 | 25.6 | 6.9 | 6.0 | 5.4 | 3.2 |
| 2019 | 25.3 | 6.8 | 6.0 | 5.4 | 3.2 |
Note(s):
Percentages are based on total academic R&D expenditures as reported in the Higher Education Research and Development Survey, which for 2010–14 include funds from the American Recovery and Reinvestment Act of 2009.
Source(s):
National Center for Science and Engineering Statistics, Higher Education Research and Development Survey (HERD).
Science and Engineering Indicators
Institutionally funded R&D expenditures include three main components: direct funding for R&D, cost sharing, and unrecovered indirect costs. Each has increased consistently since 2011, with the largest increase in direct funding for R&D (NCSES HERD 2019: Table 2; also see Gibbons 2019: Figure 2 for details of this trend). These institutional investments may cover many types of costs, including, for example, startup packages for new faculty (see AAMC 2015).
Institutionally financed research includes organized research projects fully supported with internal funding and all other separately accounted-for institutional funds for research. It does not include funds spent on research that are not separately accounted for, such as estimates of faculty time budgeted for instruction that is spent on research. Funds for institutionally financed R&D may derive from sources including general-purpose state or local government appropriations; general-purpose awards from industry, foundations, or other outside sources; endowment income; and gifts. Universities may also use income from patents and licenses or revenue from patient care to support R&D. For more on the topic of institutional funding sources, see Council on Governmental Relations (2019).
Other Sources of Support
Nonprofit Organizations
Nonprofit organizations provided $5.7 billion (about 7%) of academic R&D funding in 2019 (Figure URD-5). When adjusted for inflation, nonprofit funding for higher education R&D increased by about 31% between 2010 and 2019, representing a big rise from a small base (NCSES HERD 2019: Table 2).
Businesses (Industry)
Businesses provided $5.1 billion (around 6%) of academic R&D funding in 2019 (Figure URD-5). When adjusted for inflation, business funding for higher education R&D increased by about 35% between 2010 and 2019.
State and Local Governments
State and local governments provided $4.5 billion (around 5%) of academic R&D funding in 2019 (Figure URD-5). When adjusted for inflation, state and local government funding for higher education R&D in 2019 was within 1% of its level in 2010.
Other Sources
In 2019, all other sources of support—such as foreign businesses, other universities, or gifts designated for research—collectively accounted for $2.7 billion (3%) of academic R&D funding (Figure URD-5). About half ($1.3 billion) of these funds come from foreign sources. More detail on funding from foreign sources is available in NCSES HERD 2019: Table 14.
Performance of Academic R&D
Most academic R&D is performed by a small percentage of U.S. higher education institutions. Out of approximately 4,400 postsecondary degree-granting institutions in the United States (as reported in the forthcoming Indicators 2022 report "Higher Education in Science and Engineering"), fewer than 1,000 reported R&D expenditures in 2019. An even smaller number of universities, the doctoral universities with very high research activity, performed over three-quarters of all academic R&D. Public and private institutions showed different patterns of support, as did institutions with medical schools. When universities perform R&D and spend research dollars, that spending has an immediate economic impact. Aggregated data from a subset of universities show that research dollars support a wide range of businesses, including minority- or woman-owned and small businesses, in different states and industries (IRIS 2021).
Academic R&D at Research Universities
Academic R&D and doctoral training often occur at the same higher education institutions. The 131 doctoral universities with very high research activity, based on the Carnegie classification, performed 78% ($65.6 billion) of all U.S. academic R&D in 2019. These institutions also awarded around three-quarters of U.S. S&E doctoral degrees in 2019 (NCSES SED 2019: Table 11: see also the forthcoming Indicators 2022 report "Higher Education in Science and Engineering") and enrolled more than 80% of S&E doctoral students (NCSES GSS 2019: Table 5-3).
Even within this group of research-intensive universities, R&D activity was concentrated in relatively few institutions: the top 25 R&D performers among the very high research activity doctoral universities were responsible for nearly half ($30.3 billion, or 46%) of total R&D performed by this group of institutions and more than one-third of total academic R&D. The concentration of most R&D activity in a small number of institutions is a long-standing trend (see Indicators 2018: Figure 5-5 for illustration).
Academic R&D at Public and Private Institutions
Although only about a third of doctoral-granting institutions are public universities (Indicators 2020: Table 2-1), they performed two-thirds ($54.6 billion) of academic R&D in 2019 (NCSES HERD 2019: Table 69). Additionally, more public universities than private universities reported R&D expenditures. The top 25 public universities performed $25.1 billion in R&D, around 46% of the public university total (NCSES HERD 2019: Table 36). The concentration of R&D performance in a few institutions was greater in private universities: the top 25 performed $22.3 billion in R&D, more than three-quarters of the total performed by private universities (NCSES HERD 2019: Table 37).
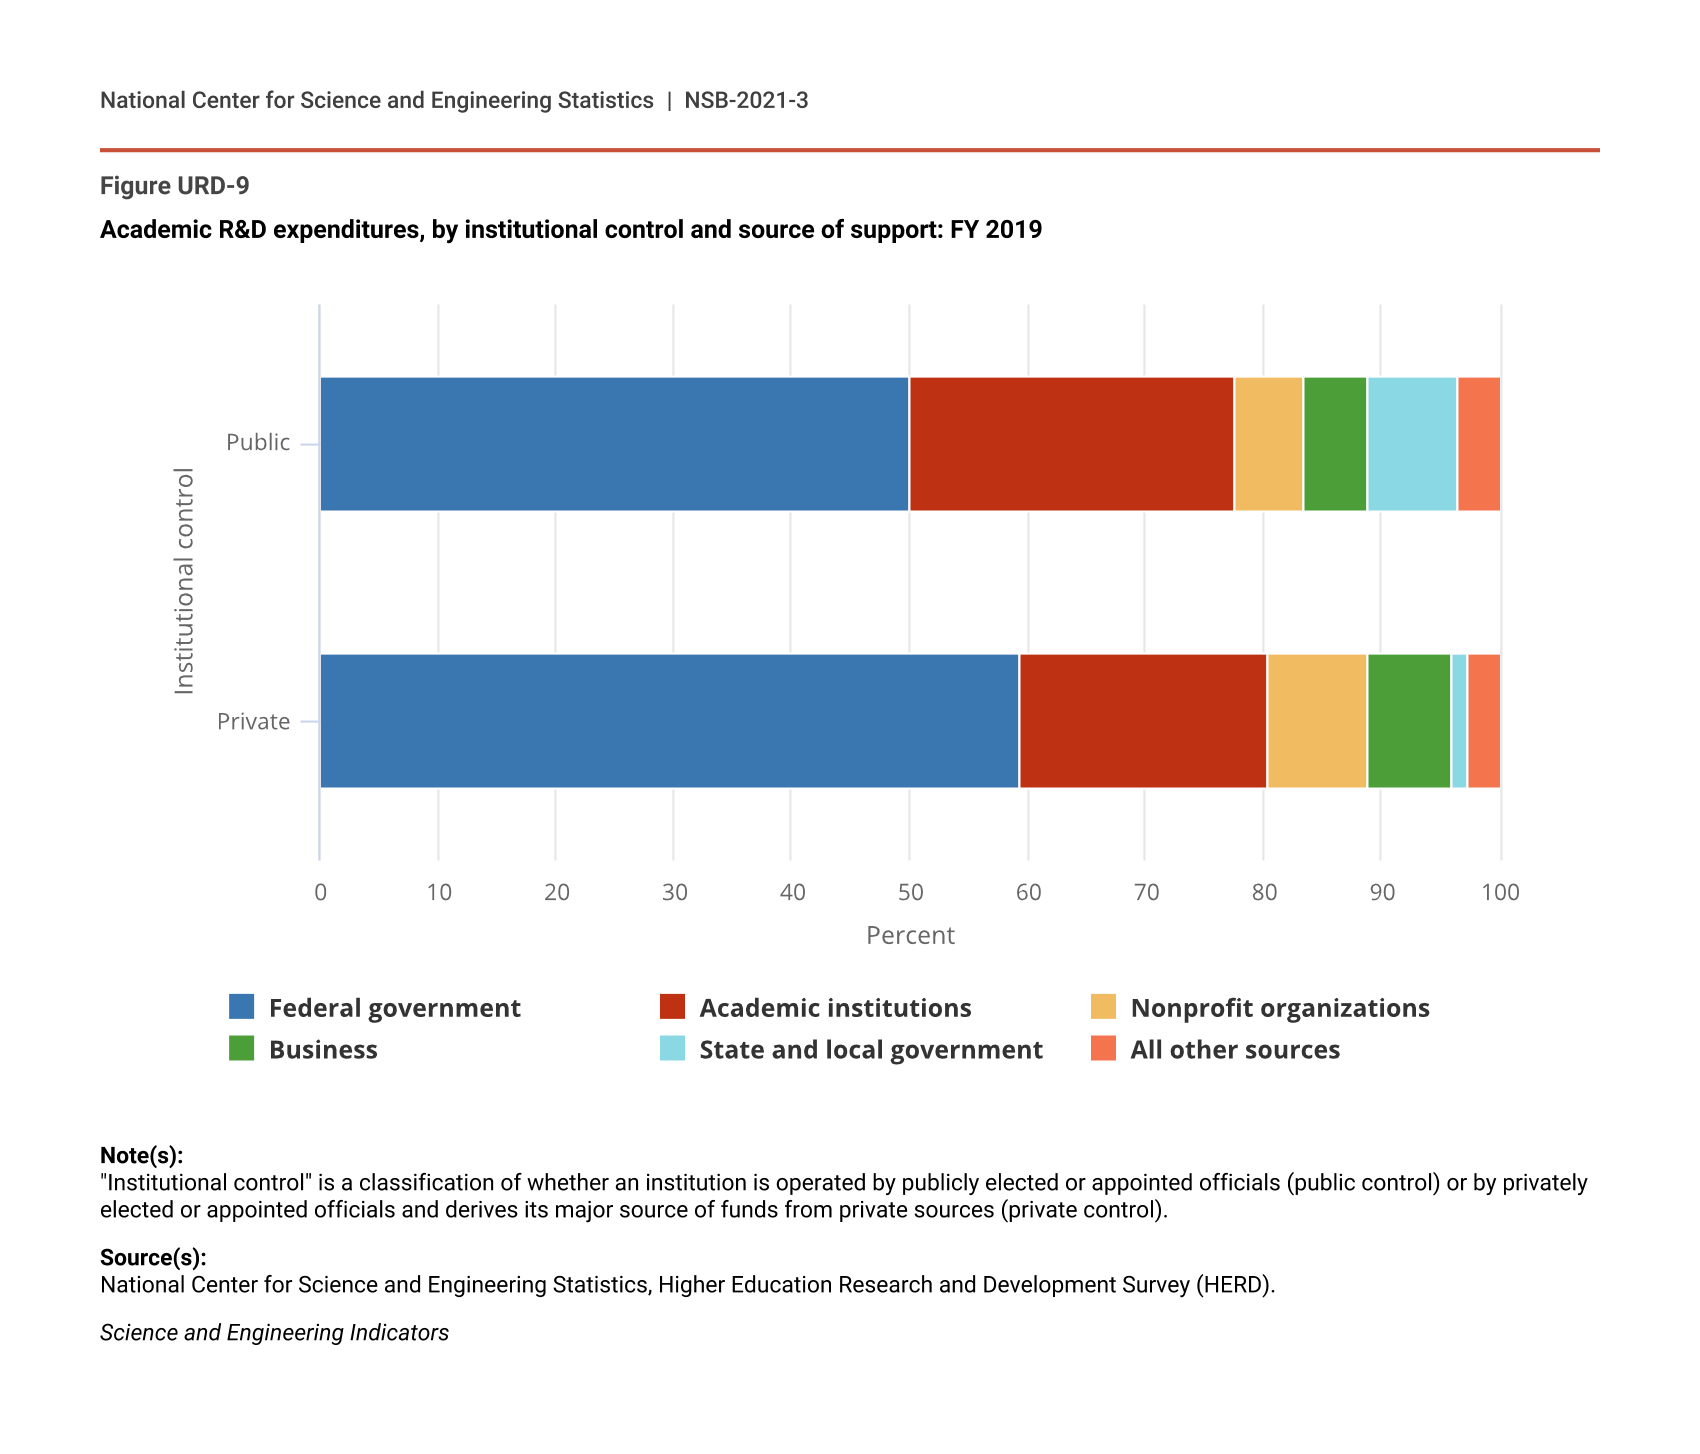
The relative shares of funding sources differed between public and private institutions (Figure URD-9: see also NCSES HERD 2019: Table 69). Private universities received a higher proportion of their academic R&D funding from the federal government (nearly 60%) compared with public universities (50%). Public universities derived a higher percentage from their own institutional funds and from state and local governments.
Academic R&D expenditures, by institutional control and source of support: FY 2019
| Institutional control | Federal government | Academic institutions | Nonprofit organizations | Business | State and local government | All other sources |
|---|---|---|---|---|---|---|
| Public | 50.0 | 27.5 | 5.9 | 5.5 | 7.5 | 3.6 |
| Private | 59.3 | 21.1 | 8.5 | 7.1 | 1.4 | 2.6 |
Note(s):
"Institutional control" is a classification of whether an institution is operated by publicly elected or appointed officials (public control) or by privately elected or appointed officials and derives its major source of funds from private sources (private control).
Source(s):
National Center for Science and Engineering Statistics, Higher Education Research and Development Survey (HERD).
Science and Engineering Indicators
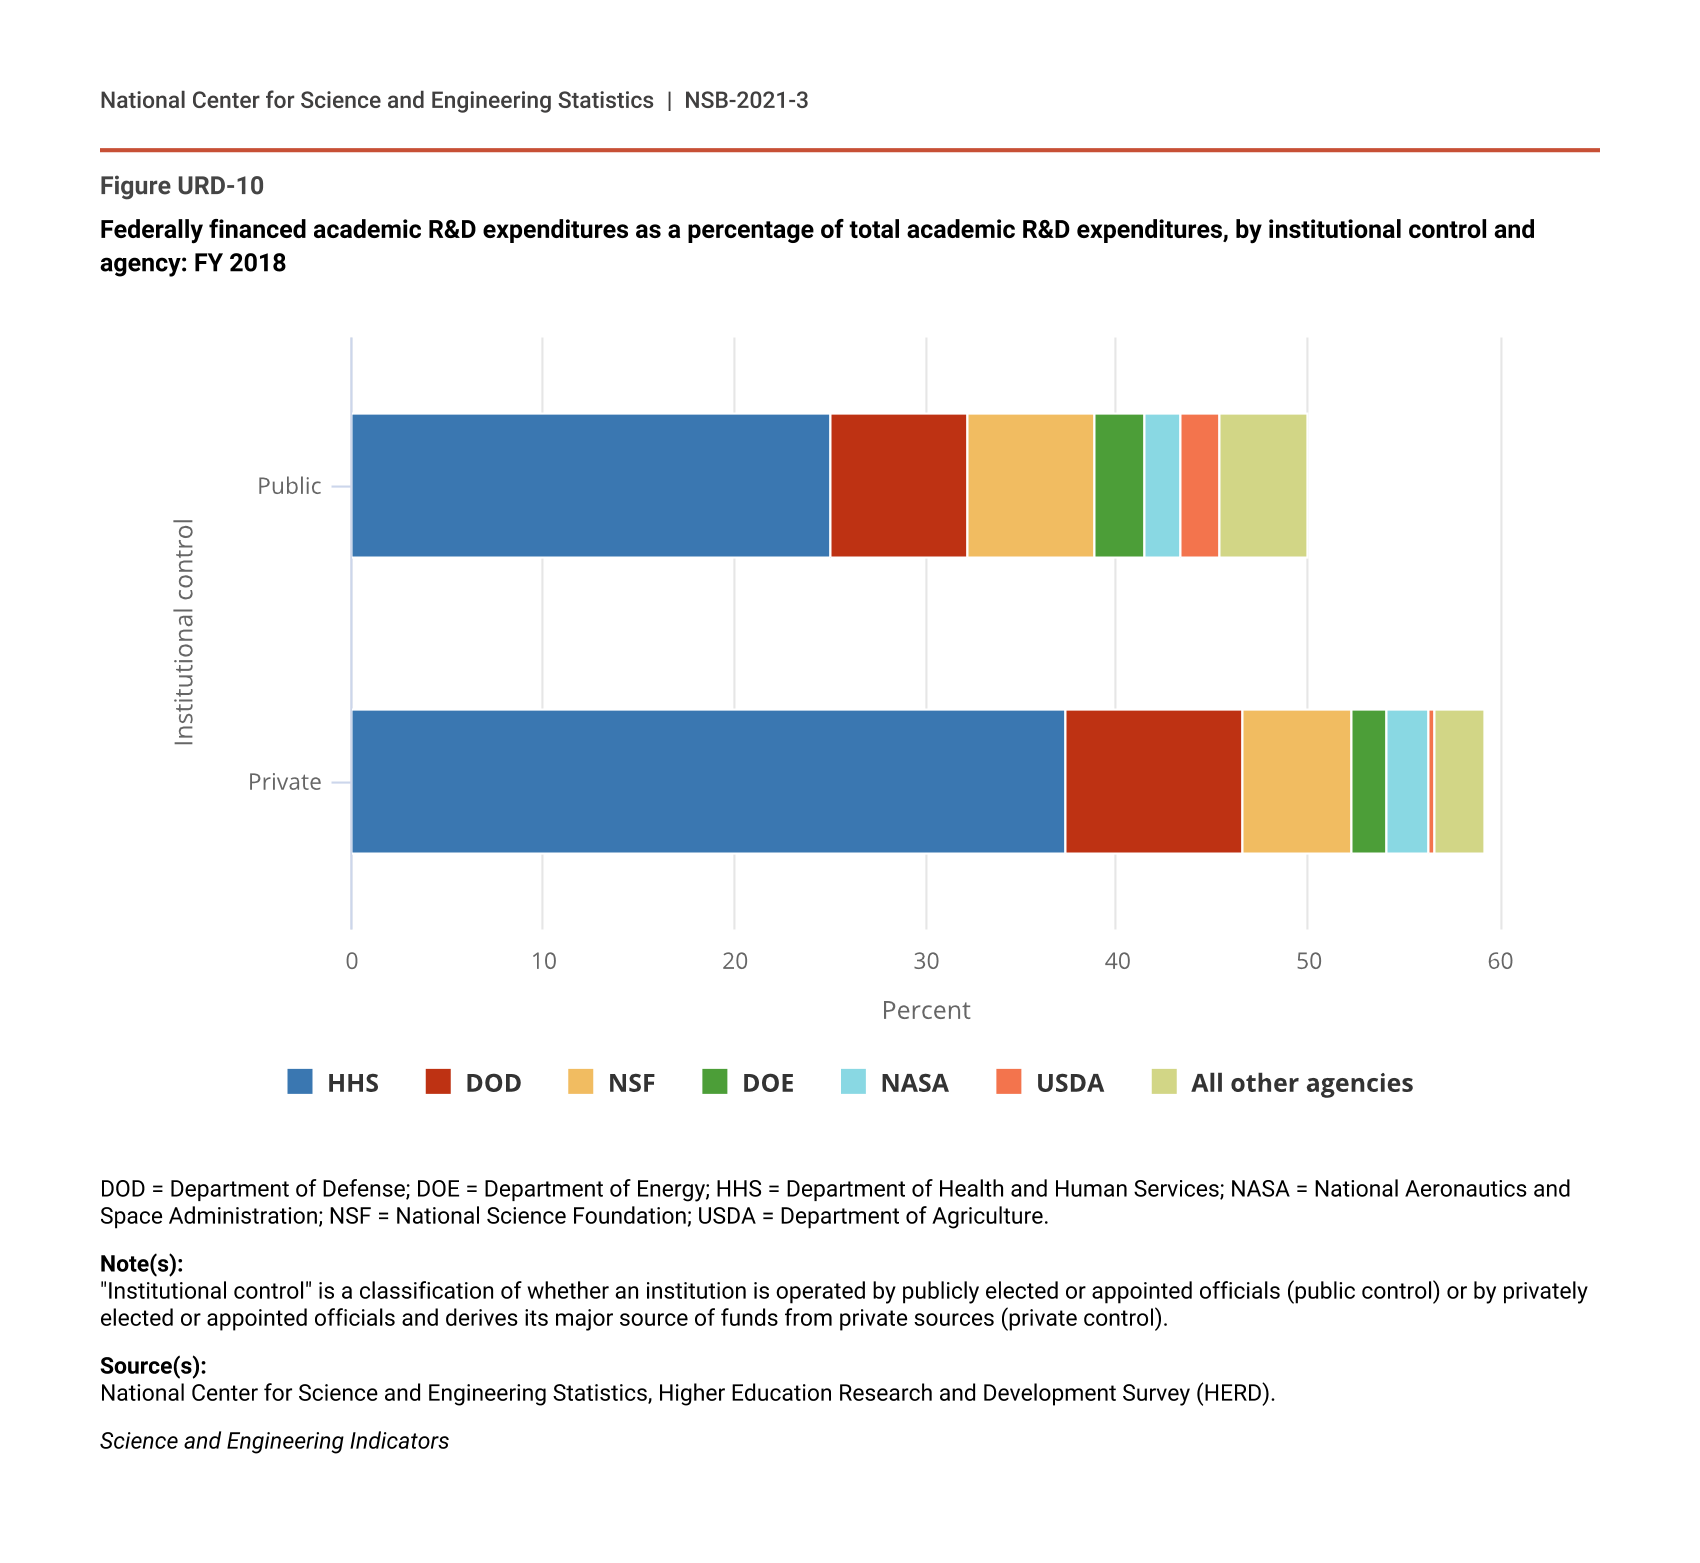
Public and private institutions also differed in the relative importance of particular federal agencies as funding sources (Figure URD-10: see also NCSES HERD 2019: Table 25). For example, private universities derived more than a third of their R&D funding from HHS, compared with about a quarter for public universities. Although USDA provided a relatively small amount of academic R&D funding, public universities, primarily land-grant universities, derived a much higher proportion of funds from this agency.
Federally financed academic R&D expenditures as a percentage of total academic R&D expenditures, by institutional control and agency: FY 2018
| Institutional control | HHS | DOD | NSF | DOE | NASA | USDA | All other agencies |
|---|---|---|---|---|---|---|---|
| Public | 25.0 | 7.2 | 6.7 | 2.6 | 1.8 | 2.1 | 4.6 |
| Private | 37.3 | 9.3 | 5.7 | 1.8 | 2.2 | 0.3 | 2.6 |
DOD = Department of Defense; DOE = Department of Energy; HHS = Department of Health and Human Services; NASA = National Aeronautics and Space Administration; NSF = National Science Foundation; USDA = Department of Agriculture.
Note(s):
"Institutional control" is a classification of whether an institution is operated by publicly elected or appointed officials (public control) or by privately elected or appointed officials and derives its major source of funds from private sources (private control).
Source(s):
National Center for Science and Engineering Statistics, Higher Education Research and Development Survey (HERD).
Science and Engineering Indicators
Academic R&D at Institutions with Medical Schools
In 2019, 159 institutions with medical schools reported R&D expenditures (NCSES HERD 2019: Table 18 and Table 71). These institutions performed $60.6 billion of academic R&D, or 72% of total academic R&D. Roughly half of these expenditures ($30 billion) were associated with the medical schools themselves, whereas the other half were associated with other parts of these same institutions.
Institutions with medical schools received nearly $33.5 billion from the federal government (three-quarters of all federal funding for academic R&D), including $21.6 billion from HHS, or about 88% of the HHS total. The remainder of R&D funding for these institutions came from nonfederal sources and constituted more than two-thirds of nonfederal funding for academic R&D. Institutions with medical schools received more than half the funding from each federal agency except USDA and from each main type of nonfederal funding source (Figure URD-11).
Academic R&D expenditures at institutions with and without medical schools, by source of funding: FY 2019
| Source | Institutions with medical schools | Institutions without medical schools |
|---|---|---|
| HHS | 21.57 | 2.84 |
| Academic institutions | 14.86 | 6.25 |
| Nonprofit organizations | 4.45 | 1.23 |
| DOD | 4.31 | 2.34 |
| Business | 3.55 | 1.50 |
| NSF | 3.05 | 2.28 |
| State and local government | 2.28 | 2.21 |
| DOE | 1.19 | 0.75 |
| NASA | 0.93 | 0.71 |
| USDA | 0.60 | 0.62 |
DOD = Department of Defense; DOE = Department of Energy; HHS = Department of Health and Human Services; NASA = National Aeronautics and Space Administration; NSF = National Science Foundation; USDA = Department of Agriculture.
Note(s):
In FY 2019, HERD included 488 institutions without medical schools and 159 institutions with medical schools with expenditures over $1 million. This figure excludes other federal and nonfederal sources of funding.
Source(s):
National Center for Science and Engineering Statistics, Higher Education Research and Development Survey (HERD).
Science and Engineering Indicators
Academic R&D at Minority-Serving Institutions
As discussed in the forthcoming Indicators 2022 report "Higher Education in Science and Engineering," minority-serving institutions (MSIs) include a diverse assemblage of more than 700 federally designated institutions of seven types (see also NASEM 2019). Historically Black colleges and universities (HBCUs) are one type of MSI defined by legislation. In 2019, the 49 HBCUs reporting expenditures in the NCSES Higher Education Research and Development (HERD) survey performed a total of around $500 million in academic R&D (NCSES HERD 2019: Table 31). The federal government provided around $370 million (about three-quarters) of this funding, a higher percentage than across institutions overall. The relative amounts of academic R&D performed across fields at HBCUs was very similar to that for all institutions (NCSES HERD 2019: Table 12 compared to Table 32).
High-Hispanic-enrollment institutions (HHE) are defined by the percentage of enrolled Hispanic or Latino students. In 2019, the 78 HHEs reporting expenditures in the HERD survey performed a total of around $6.4 billion in academic R&D (NCSES HERD 2019: Table 33). The federal government provided around $1.8 billion (about 40%) of this funding, a lower percentage than across institutions overall. The relative amounts of academic R&D performed across fields at HHEs was also similar to that for all institutions (NCSES HERD 2019: Table 12 compared to Table 34).
Academic R&D, by Field
The relative amount of resources provided to different fields has changed little since 2010 (NCSES HERD 2019: Table 9). The life sciences—primarily biological and biomedical sciences and health sciences—have long accounted for the bulk of academic R&D: $48.2 billion in 2019, more than half the total (58%). Life sciences plus engineering ($13.2 billion, or 16%) together constituted nearly three-quarters (74%) of academic R&D, with other fields each making up smaller shares of 7% or less. Consistent with the overall pattern, academic R&D funding across broad S&E fields (with the exception of the social sciences) came primarily from the federal government, with academic institutions themselves as the second-largest source (NCSES HERD 2019: Table 12). In the federal government, each federal agency funded a portfolio across fields that is consistent with its mission.
Federal Support for Academic R&D, by Field
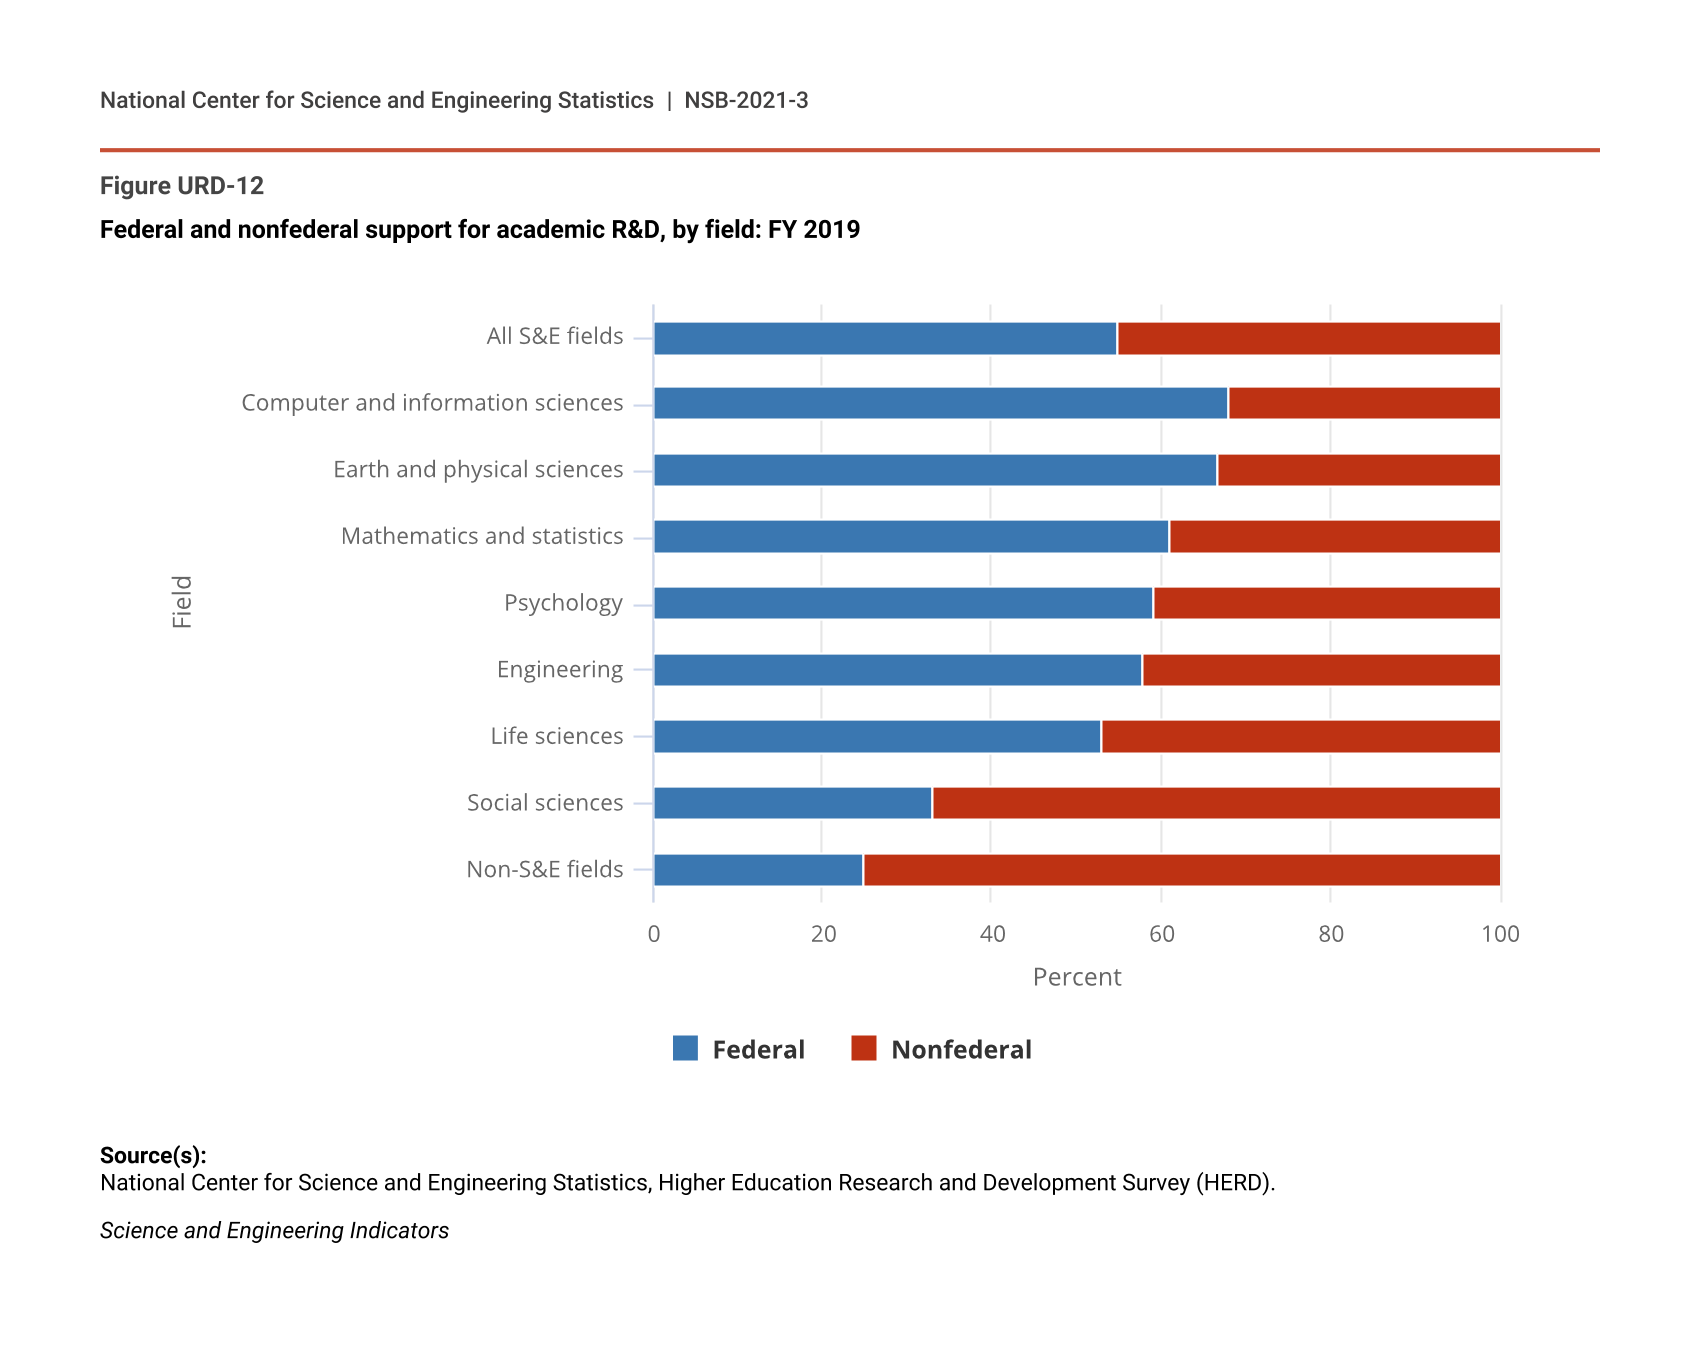
The percentage of total academic R&D funding provided by the federal government varied across broad S&E fields, from around a third for social sciences (33%) to nearly 70% for computer and information sciences in 2019 (Figure URD-12: see also NCSES HERD 2019: Table 12). Although life sciences received the most resources, funding for academic R&D in this field was split nearly evenly between federal government and nonfederal sources.
Federal and nonfederal support for academic R&D, by field: FY 2019
| Field | Federal | Nonfederal |
|---|---|---|
| All S&E fields | 55 | 45 |
| Computer and information sciences | 68 | 32 |
| Earth and physical sciences | 66 | 33 |
| Mathematics and statistics | 61 | 39 |
| Psychology | 59 | 41 |
| Engineering | 58 | 42 |
| Life sciences | 53 | 47 |
| Social sciences | 33 | 67 |
| Non-S&E fields | 25 | 75 |
Source(s):
National Center for Science and Engineering Statistics, Higher Education Research and Development Survey (HERD).
Science and Engineering Indicators
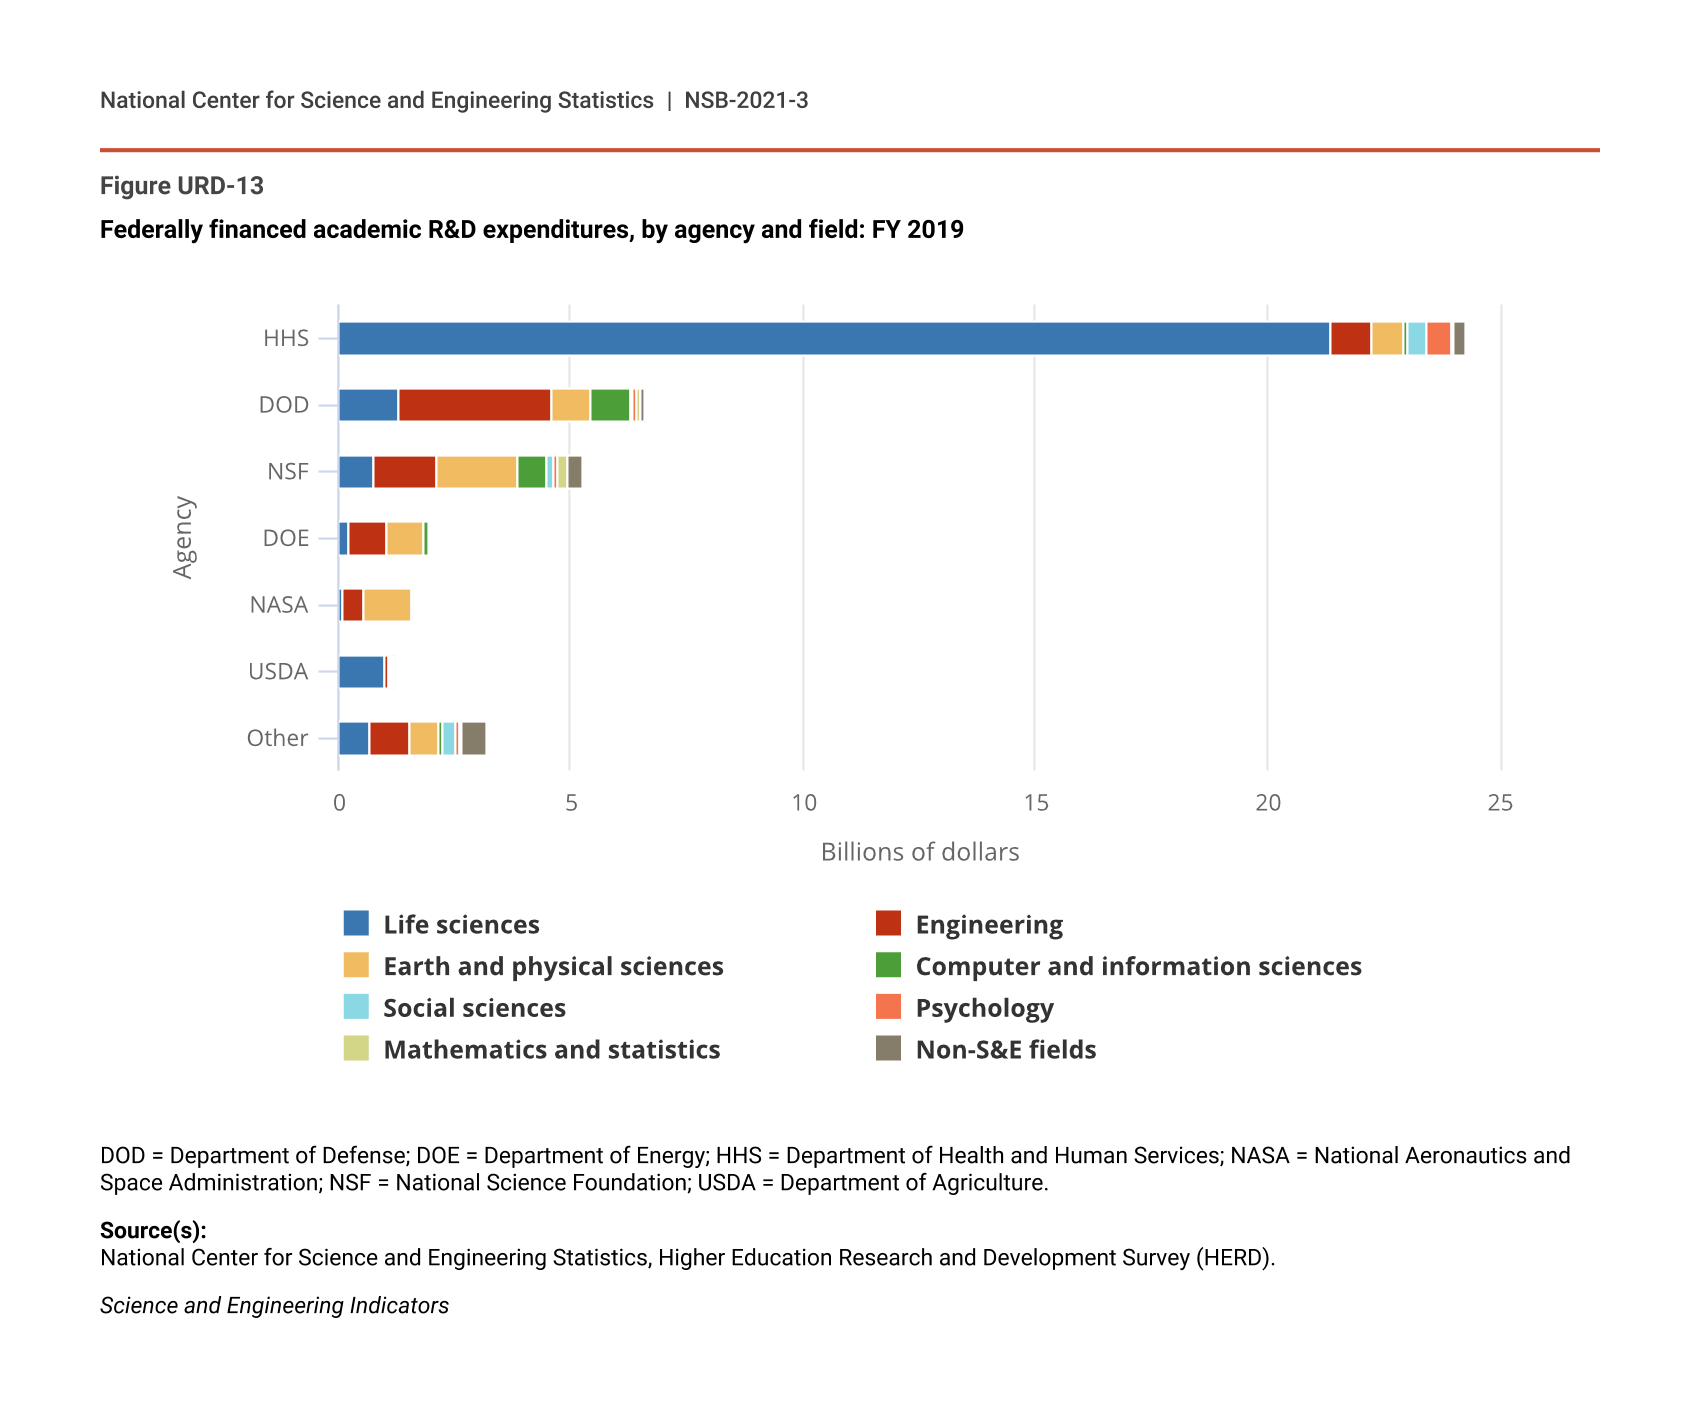
Each of the six primary federal agencies that sponsor academic R&D funded a portfolio across fields consistent with its mission (Figure URD-13; NCSES HERD 2019: Table 13). For example, the vast majority ($21 billion, or nearly 90%) of the academic R&D funded by HHS was in life sciences. Around 85% ($1.6 billion) of DOE’s academic R&D funding was in earth and physical sciences and engineering. NSF supported substantial amounts of academic R&D across a range of S&E fields. Unsurprisingly, agencies’ academic R&D support patterns across S&E fields bear many similarities to their support patterns for graduate students and postdocs (see the section Education, Training, and Academic R&D).
Federally financed academic R&D expenditures, by agency and field: FY 2019
Figure data not available.
DOD = Department of Defense; DOE = Department of Energy; HHS = Department of Health and Human Services; NASA = National Aeronautics and Space Administration; NSF = National Science Foundation; USDA = Department of Agriculture.
Source(s):
National Center for Science and Engineering Statistics, Higher Education Research and Development Survey (HERD).
Science and Engineering Indicators
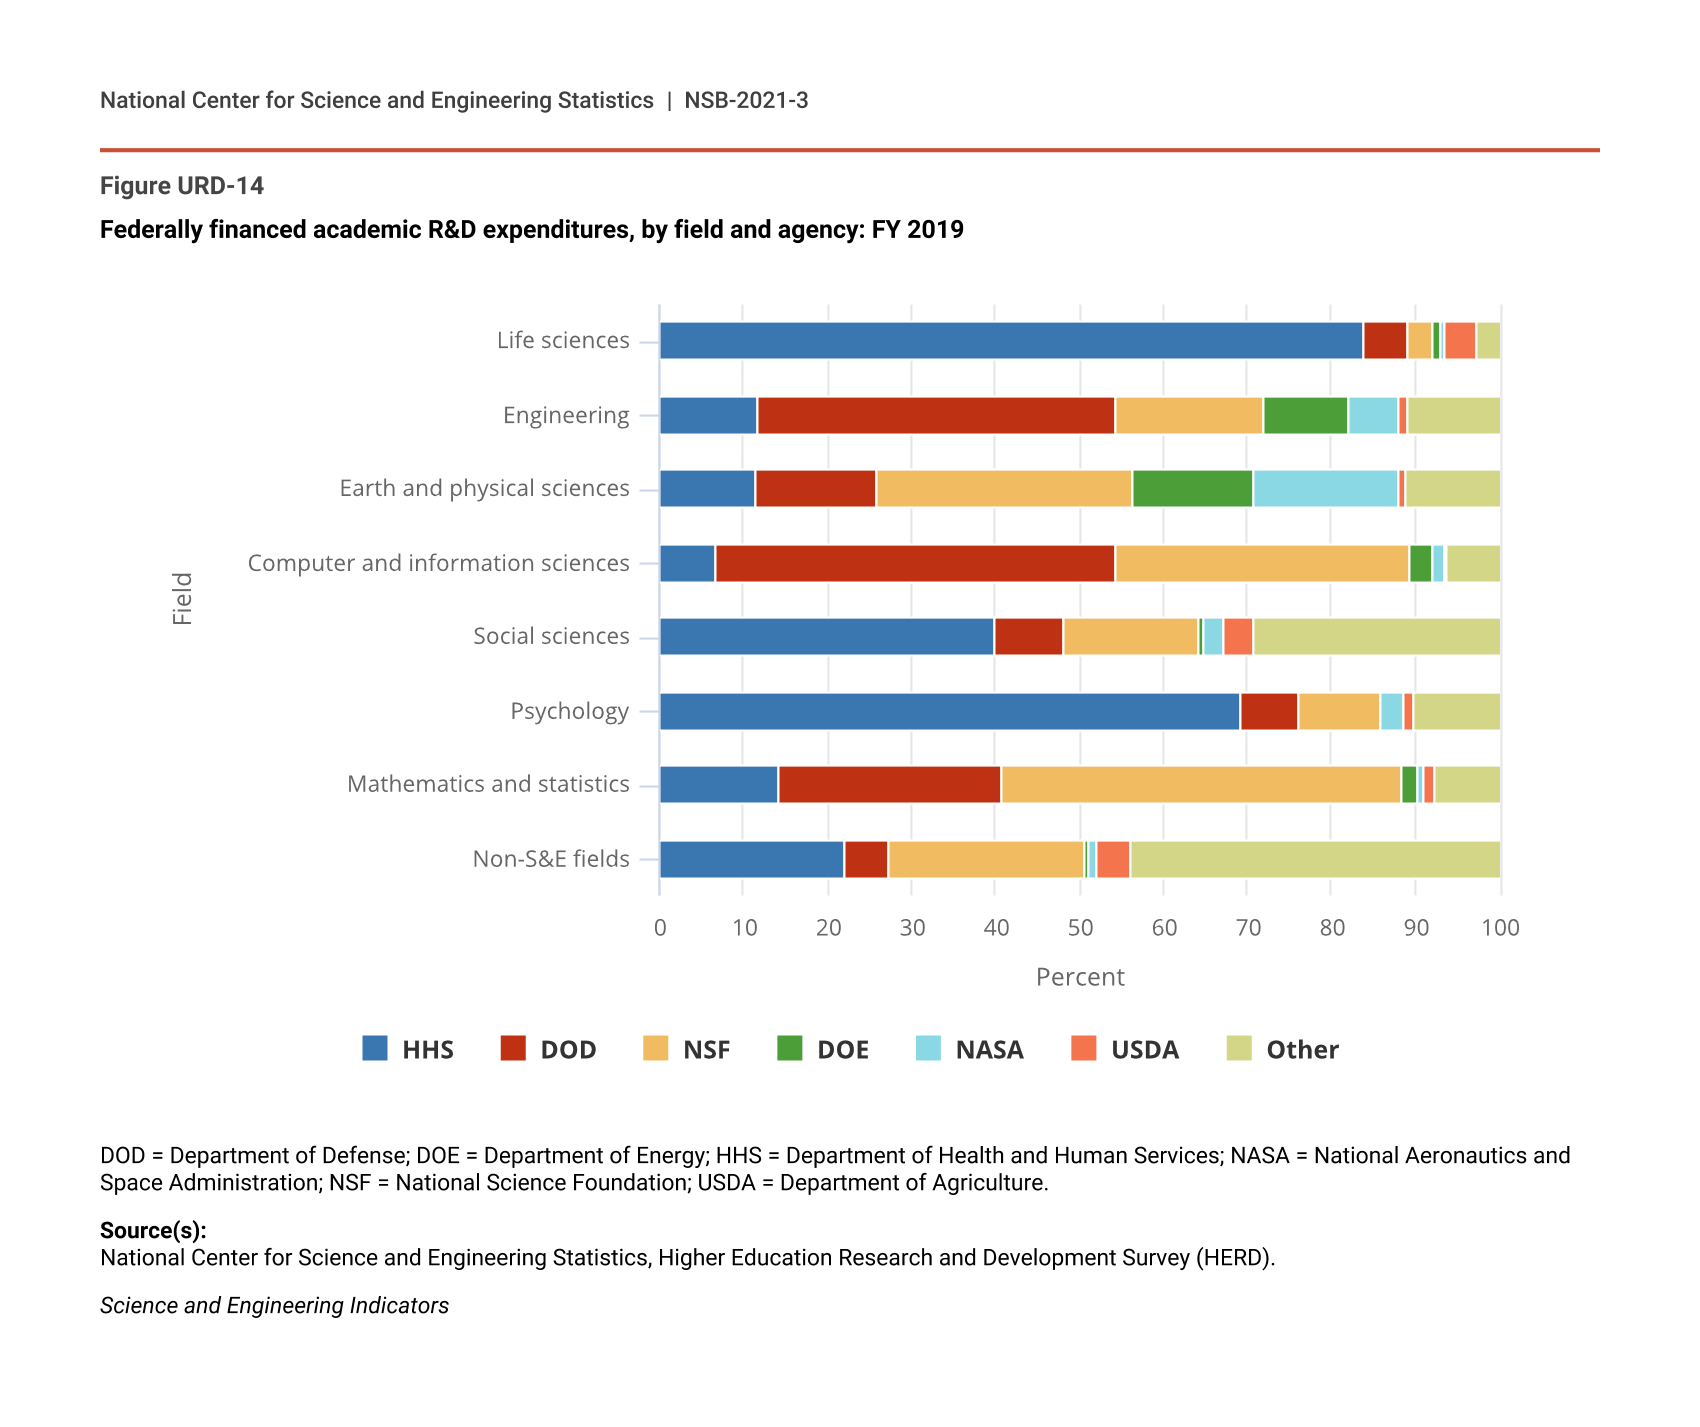
In each S&E field, the portion of R&D supported by specific agencies differed (Figure URD-14). For example, HHS provided 84% of total federal support for academic R&D in life sciences and about 70% of such support for psychology. NSF contributed just under half of the total federal academic R&D funding for mathematics and statistics, as well as significant portions of the totals for several other fields. Agencies sometimes targeted funds narrowly to specialized fields (NCSES HERD 2019: Table 13). USDA, for example, provided around two-thirds of federal support for academic R&D in agricultural sciences (most of this support was allocated to public land-grant universities). NASA provided around 70% of federal support for academic R&D in astronomy and astrophysics, and NSF provided nearly 45% of federal support for academic R&D in anthropology.
Federally financed academic R&D expenditures, by field and agency: FY 2019
| Field | HHS | DOD | NSF | DOE | NASA | USDA | Other |
|---|---|---|---|---|---|---|---|
| Life sciences | 84.00 | 5.20 | 2.98 | 0.89 | 0.38 | 3.88 | 2.68 |
| Engineering | 11.62 | 42.63 | 17.63 | 10.31 | 6.01 | 1.00 | 10.81 |
| Earth and physical sciences | 11.50 | 14.38 | 30.33 | 14.55 | 17.32 | 0.80 | 11.12 |
| Computer and information sciences | 6.68 | 47.59 | 35.10 | 2.79 | 1.27 | 0.35 | 6.21 |
| Social sciences | 39.92 | 8.30 | 15.96 | 0.53 | 2.65 | 3.38 | 29.26 |
| Psychology | 69.34 | 6.92 | 9.56 | 0.05 | 2.69 | 1.39 | 10.05 |
| Mathematics and statistics | 14.18 | 26.41 | 47.83 | 1.77 | 0.94 | 1.11 | 7.75 |
| Non-S&E fields | 21.99 | 5.26 | 23.48 | 0.43 | 0.85 | 4.06 | 43.92 |
DOD = Department of Defense; DOE = Department of Energy; HHS = Department of Health and Human Services; NASA = National Aeronautics and Space Administration; NSF = National Science Foundation; USDA = Department of Agriculture.
Source(s):
National Center for Science and Engineering Statistics, Higher Education Research and Development Survey (HERD).
Science and Engineering Indicators
Nonfederal Support for Academic R&D, by Field
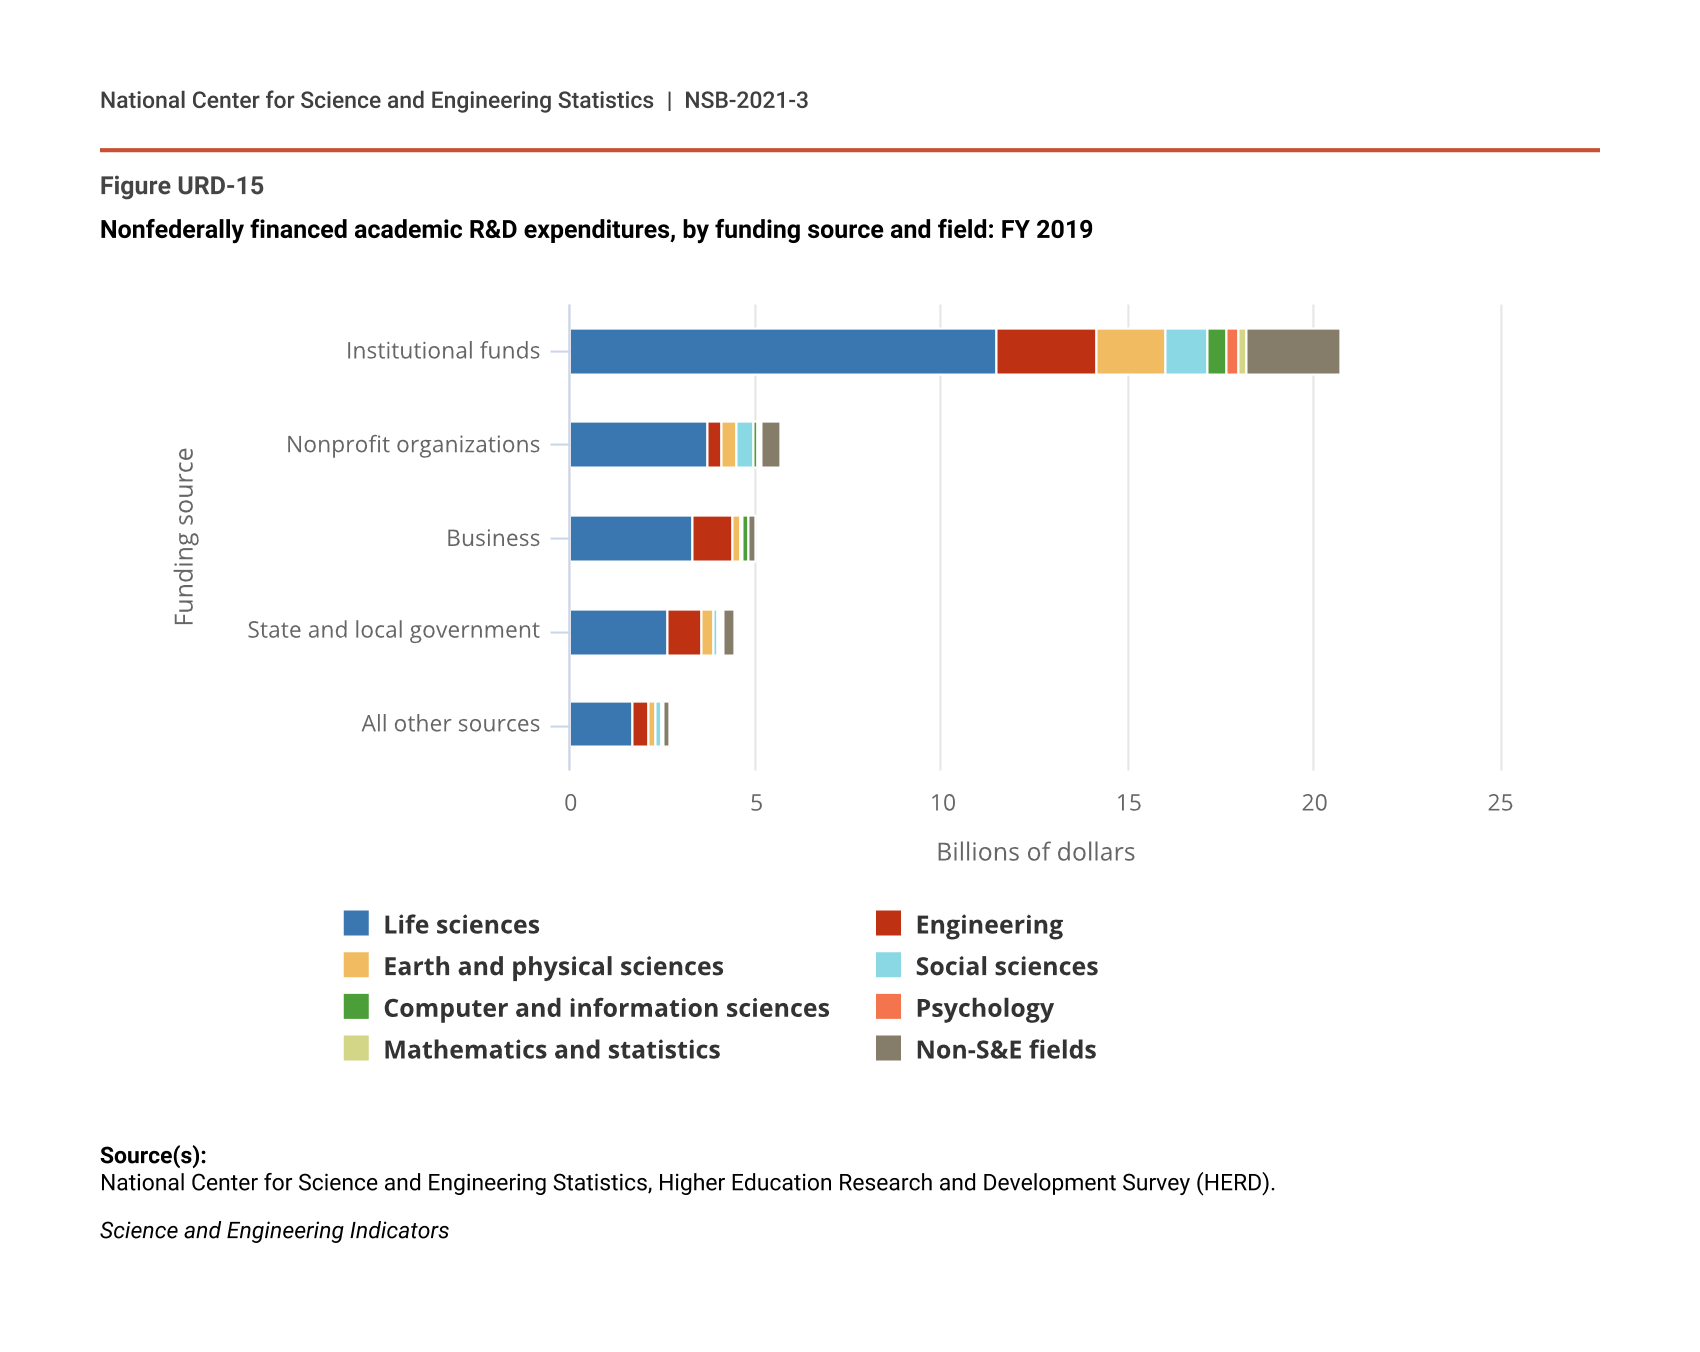
Unlike federal agencies, nonfederal academic R&D sources represent aggregations of funders, each of which may have its own funding priorities. However, in 2019, more than half of the total funding from each type of nonfederal academic R&D source—academic institutions themselves, nonprofit organizations, businesses, and state and local governments—was allocated to life sciences (Figure URD-15; NCSES HERD 2019: Table 12). Engineering was the second-largest recipient for all but nonprofit funding. Underlying this pattern were smaller-scale differences in how these types of sources allocated funds. Businesses, for example, devoted more than 20% of their total academic R&D funding to engineering and around 1% to social sciences. Nonprofit organizations, by contrast, devoted slightly more funds to social sciences (8%) than engineering (7%).
Nonfederally financed academic R&D expenditures, by funding source and field: FY 2019
Figure data not available.
Source(s):
National Center for Science and Engineering Statistics, Higher Education Research and Development Survey (HERD).
Science and Engineering Indicators
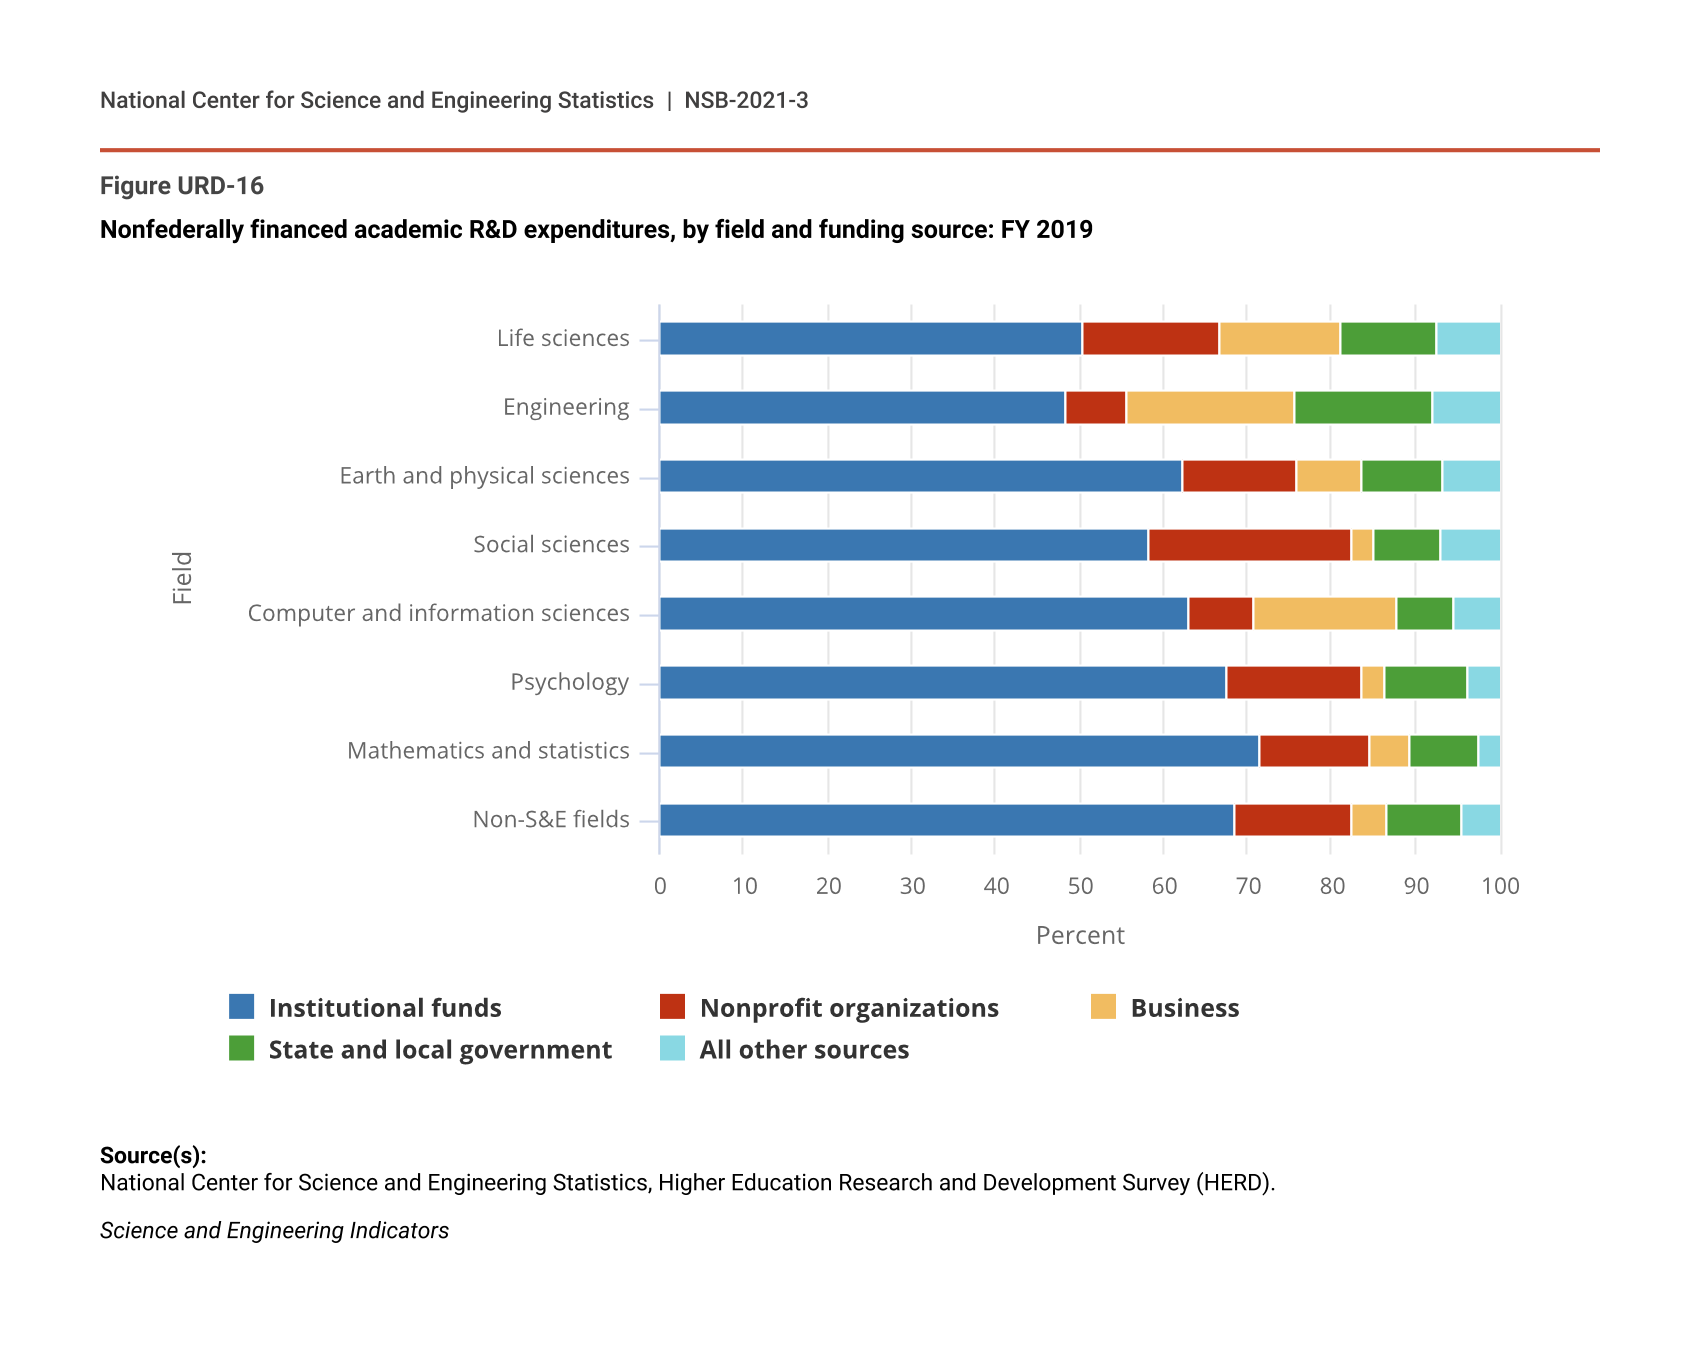
Academic institutions contributed half or more of nonfederal academic R&D funding for all broad fields except engineering, to which they contributed just under half (48%) (Figure URD-16; NCSES HERD 2019: Table 12). Nonprofit organizations contributed nearly a quarter of total nonfederal academic R&D funding for social sciences. Businesses contributed around a fifth of nonfederal academic R&D funding for engineering and nearly that much (17%) for computer and information sciences. State and local governments contributed smaller percentages more uniformly divided among a range of fields.
Nonfederally financed academic R&D expenditures, by field and funding source: FY 2019
| Field | Institutional funds | Nonprofit organizations | Business | State and local government | All other sources |
|---|---|---|---|---|---|
| Life sciences | 50.45 | 16.28 | 14.41 | 11.53 | 7.34 |
| Engineering | 48.37 | 7.12 | 20.07 | 16.59 | 7.85 |
| Earth and physical sciences | 62.38 | 13.49 | 7.85 | 9.61 | 6.67 |
| Social sciences | 58.42 | 23.90 | 2.87 | 7.89 | 6.92 |
| Computer and information sciences | 63.07 | 7.60 | 17.06 | 6.92 | 5.35 |
| Psychology | 67.38 | 16.29 | 2.75 | 9.86 | 3.73 |
| Mathematics and statistics | 71.54 | 13.10 | 4.61 | 8.31 | 2.45 |
| Non-S&E fields | 68.61 | 13.70 | 4.24 | 8.88 | 4.57 |
Source(s):
National Center for Science and Engineering Statistics, Higher Education Research and Development Survey (HERD).
Science and Engineering Indicators
Cost Components of Academic R&D
Academic R&D expenditures are composed of direct and indirect costs (NCSES HERD 2019: Table 16; see also COGR 2019). According to a report from the National Research Council, direct costs of research are those components that can be attributed to a specific project, such as researcher salaries, travel, and the costs of laboratory materials. Indirect costs include outlays for facilities and administration, such as library costs and other elements that support multiple projects or an institution’s entire research program (NRC 2012). A key distinction between these types of costs is that while funders, including the federal government, pay the direct costs of R&D, they may also reimburse institutions for all or part of the indirect costs associated with that R&D. When funders do not reimburse all of the associated indirect costs, institutions must rely on other sources to cover these costs.
In 2019, direct costs were around three-quarters ($64.3 billion) of total academic R&D spending (NCSES HERD 2019: Table 16). The largest direct cost component was the salaries, wages, and fringe benefits of those who conduct the R&D; in 2019, this was $36.6 billion, or around 44% of total academic R&D spending. Other direct cost components included software and equipment purchases, as well as funds passed to subrecipients.
Indirect costs included those recovered by institutions and unrecovered costs for which institutions were not reimbursed. Unrecovered indirect costs, like all data from the HERD survey, were self-reported by institutions. The survey’s technical notes explain: “the survey requests that the total amount of indirect costs associated with a research grant or contract be calculated and reported, including costs that were not reimbursed by the external funding source. The unrecovered indirect cost is calculated by multiplying the institution’s negotiated indirect cost rate by the corresponding base and then subtracting the actual indirect cost recovery, preferably on a project-by-project basis.” More detail on this topic is available in the HERD technical notes.
The relationship between levels of federal funding and levels of institutional funding, including the unrecovered indirect cost component, is complex. As mentioned earlier, precise accounting of institutionally financed R&D is difficult, and funds may be derived from many sources (for more, see Council on Governmental Relations 2019; Droegemeier 2017). While the total amount of unrecovered indirect costs increased slightly in inflation-adjusted dollars between 2012 and 2019 (from around $4.6 billion to $4.9 billion), institutional direct funding for research increased much faster (from $7.7 billion to $12.5 billion). As a result, during this time, unrecovered indirect costs as a percentage of total institutionally funded R&D expenditures decreased from around a third to around a quarter.
As a percentage of total indirect costs, unrecovered indirect costs are higher for public institutions (around 33%) than for private institutions (around 23%) (NCSES HERD 2019: Table 16). However, when compared with total institutional spending on R&D, the proportions are about the same (NCSES HERD 2019: Table 69).