 An official website of the United States government
 International Collaboration and Citations
S&E research has steadily become more global over the past decade; this trend can be measured by examining cross-national coauthorships and citations (Luukkonen et al. 1993; Glänzel and Schubert 2005; Royal Society 2011). Researchers gather scientific expertise beyond their country’s borders through collaboration, both direct (working to coauthor articles) and indirect (through referencing articles from other countries). Measured at the country level, international collaboration and citation are strongly influenced by the size of the country as well as the policies of the country. For example, some countries provide preferential funding for research within a region through programs such as the European Commission’s Horizon 2020.
Researchers collaborate for a number of reasons, including to develop a scientific relationship with another researcher, to gain access to costly or shared equipment, or to meet conditions attached to research funding that require international collaboration (Wagner 2018). The benefits of international collaboration include achieving outcomes that no one nation could achieve; training a robust S&E workforce, including researchers from developing countries; advancing domestic science excellence; increasing the impact of discoveries through better distribution of knowledge; strengthening scientific and diplomatic relations; and enhancing a sense of shared responsibility for future action (Lyons et al. 2016). Also, international collaborations increase the impact of research, as measured by citations (Narin, Stevens, and Whitlow 1991; Sugimoto et al. 2017; Chinchilla-Rodríguez, Sugimoto, and Larivière 2019). Domestic collaboration among researchers in the academic, government, and industry sectors also receives higher citation rates when compared to articles from a single author or authors from only one sector (see section Business Collaboration in Peer-Reviewed Publications in forthcoming Indicators 2022 report “Invention, Knowledge Transfer, and Innovation”).
International Collaboration Patterns
Articles that have authors from universities or research institutions in at least two countries indicate international collaboration. The percentage of worldwide S&E articles produced with international collaboration increased from 18% to 23% from 2010 to 2020 (Table SPBS-35). International connections among researchers indicate the expanding research capabilities around the world. Authors with their institutional address in the United States were the largest group participating in international collaboration, cowriting 239,344 articles, or roughly 35% of the world’s internationally coauthored articles in 2020 (Table SPBS-35). The United States coauthors the most articles in collaboration with China, the UK, Germany, and Canada (Table SPBS-37).
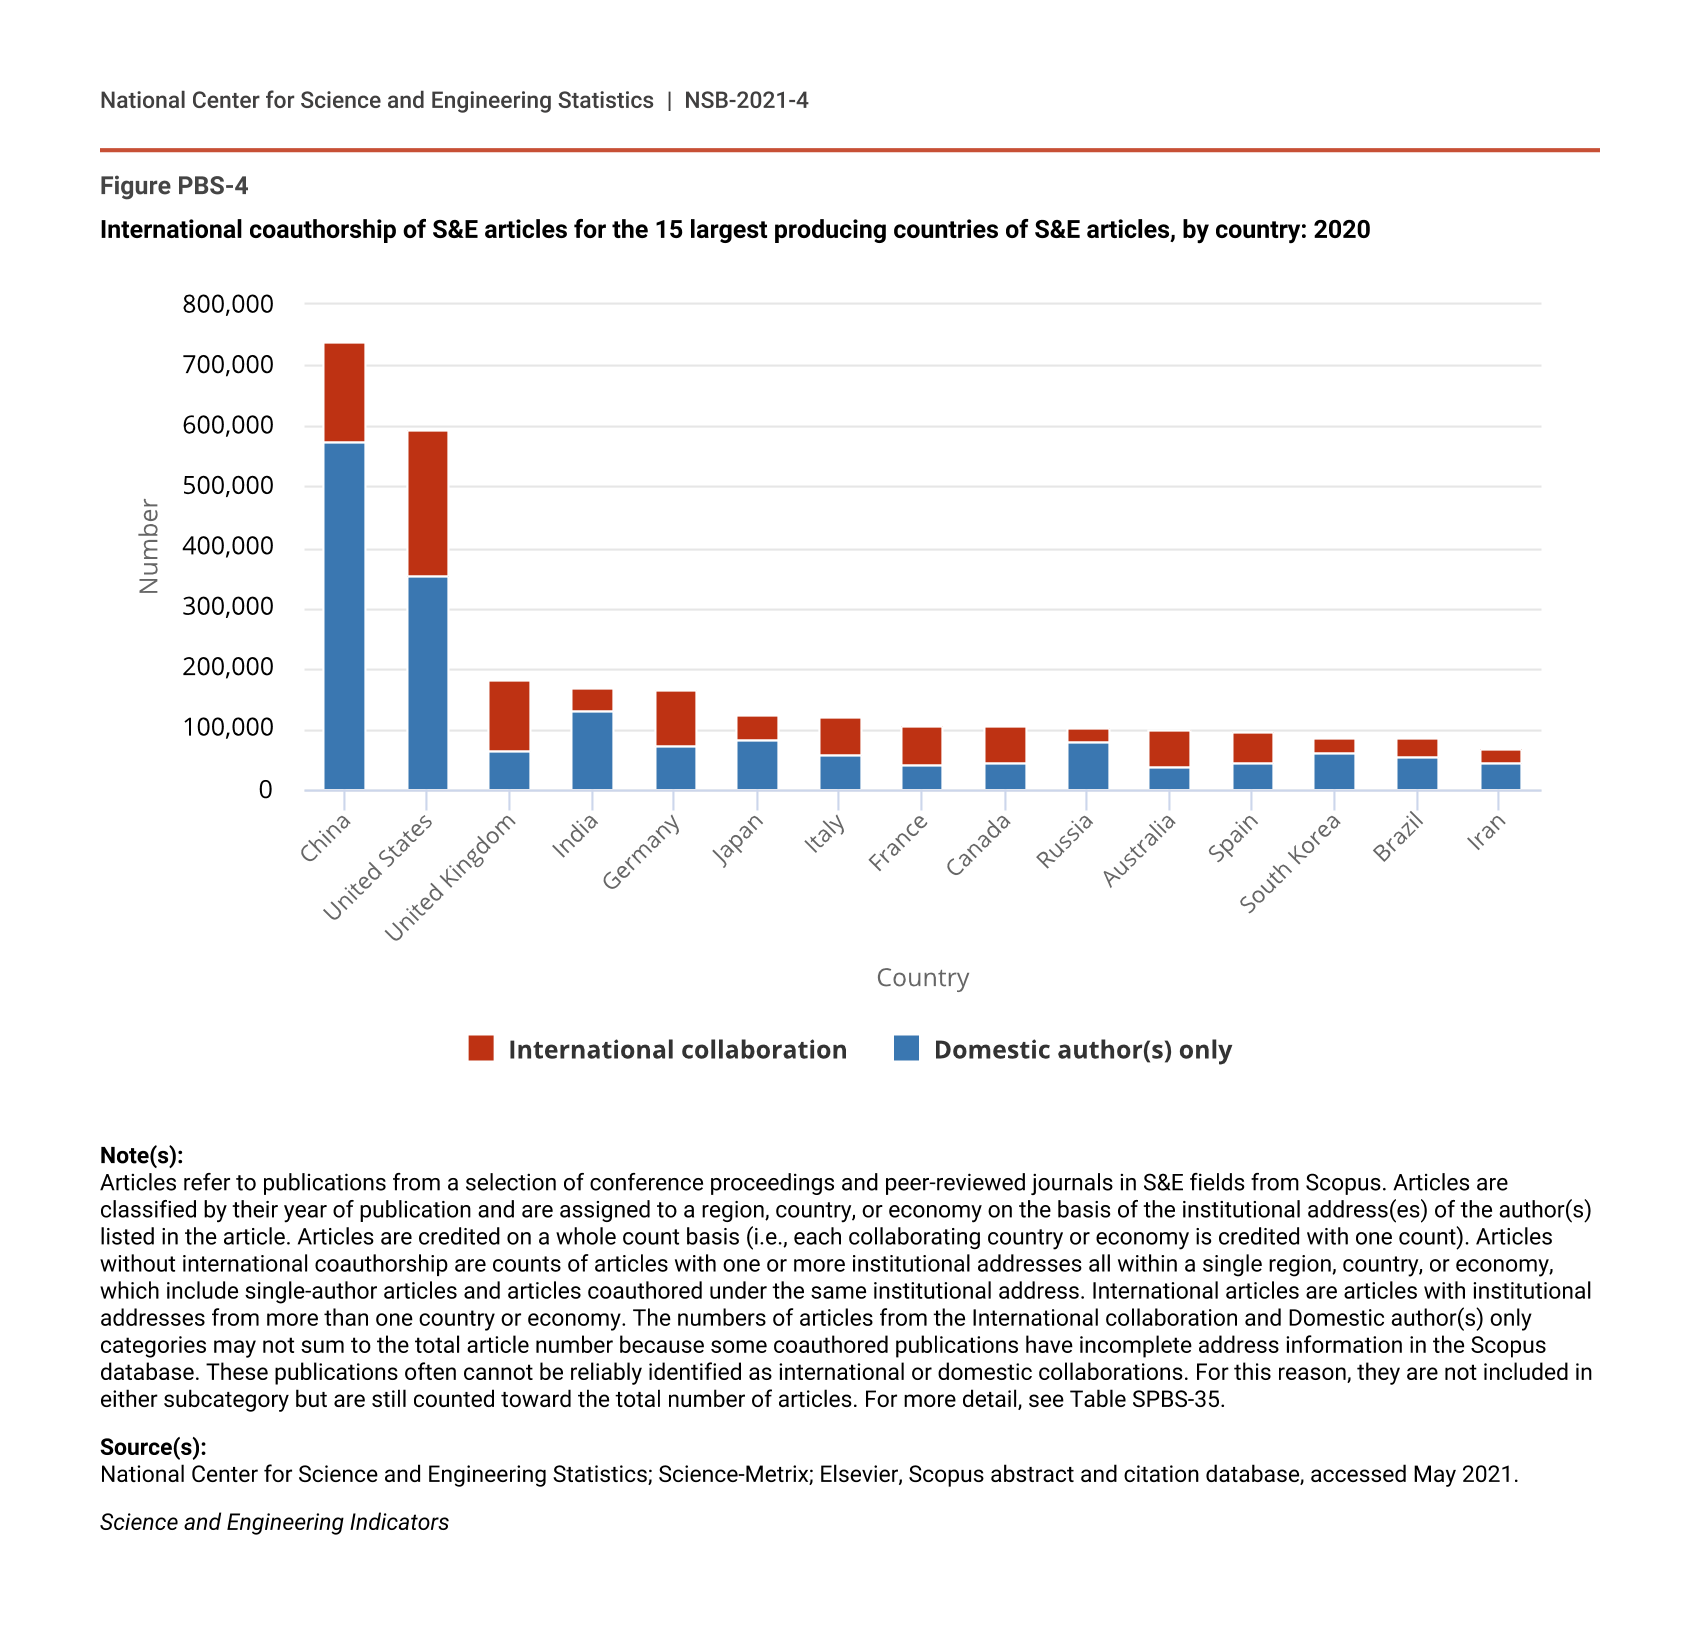
The United States collaborated with international partners on 40% of the U.S. articles in 2020 (Table SPBS-35). International collaboration rates vary by country. There is a higher percentage of international collaboration for the UK (65%), Australia (62%), France (61%), and Canada (58%), with lower rates for India (22%), China (22%), and Russia (25%) (Figure PBS-4). Beyond the 15 largest producers, the 2020 international collaboration rates vary: Saudi Arabia (76%), Switzerland (73%), and Belgium (72%) have relatively high collaboration rates, while Brazil (35%) and Poland (38%) are lower (Table SPBS-35).
International coauthorship of S&E articles for the 15 largest producing countries of S&E articles, by country: 2020
| Country | Domestic author(s) only | International collaboration |
|---|---|---|
| China | 574,661 | 163,185 |
| United States | 354,434 | 239,344 |
| United Kingdom | 64,119 | 117,790 |
| India | 131,286 | 36,811 |
| Germany | 73,618 | 92,056 |
| Japan | 83,685 | 41,280 |
| Italy | 59,556 | 60,383 |
| France | 41,947 | 65,510 |
| Canada | 43,672 | 61,121 |
| Russia | 78,825 | 25,659 |
| Australia | 37,972 | 61,625 |
| Spain | 45,086 | 50,584 |
| South Korea | 60,190 | 27,281 |
| Brazil | 55,383 | 29,967 |
| Iran | 46,191 | 21,098 |
Note(s):
Articles refer to publications from a selection of conference proceedings and peer-reviewed journals in S&E fields from Scopus. Articles are classified by their year of publication and are assigned to a region, country, or economy on the basis of the institutional address(es) of the author(s) listed in the article. Articles are credited on a whole count basis (i.e., each collaborating country or economy is credited with one count). Articles without international coauthorship are counts of articles with one or more institutional addresses all within a single region, country, or economy, which include single-author articles and articles coauthored under the same institutional address. International articles are articles with institutional addresses from more than one country or economy. The numbers of articles from the International collaboration and Domestic author(s) only categories may not sum to the total article number because some coauthored publications have incomplete address information in the Scopus database. These publications often cannot be reliably identified as international or domestic collaborations. For this reason, they are not included in either subcategory but are still counted toward the total number of articles. For more detail, see Table SPBS-35.
Source(s):
National Center for Science and Engineering Statistics; Science-Metrix; Elsevier, Scopus abstract and citation database, accessed May 2021.
Science and Engineering Indicators
The international collaboration rate was stable for 2018, 2019, and 2020, possibly indicating that international collaborations were not impacted by COVID-19 (Table SPBS-35). However, there is a potential for a lagged effect on published articles because the appearance of research in peer-reviewed journals typically evolves over multiple years (Fry et al. 2020).
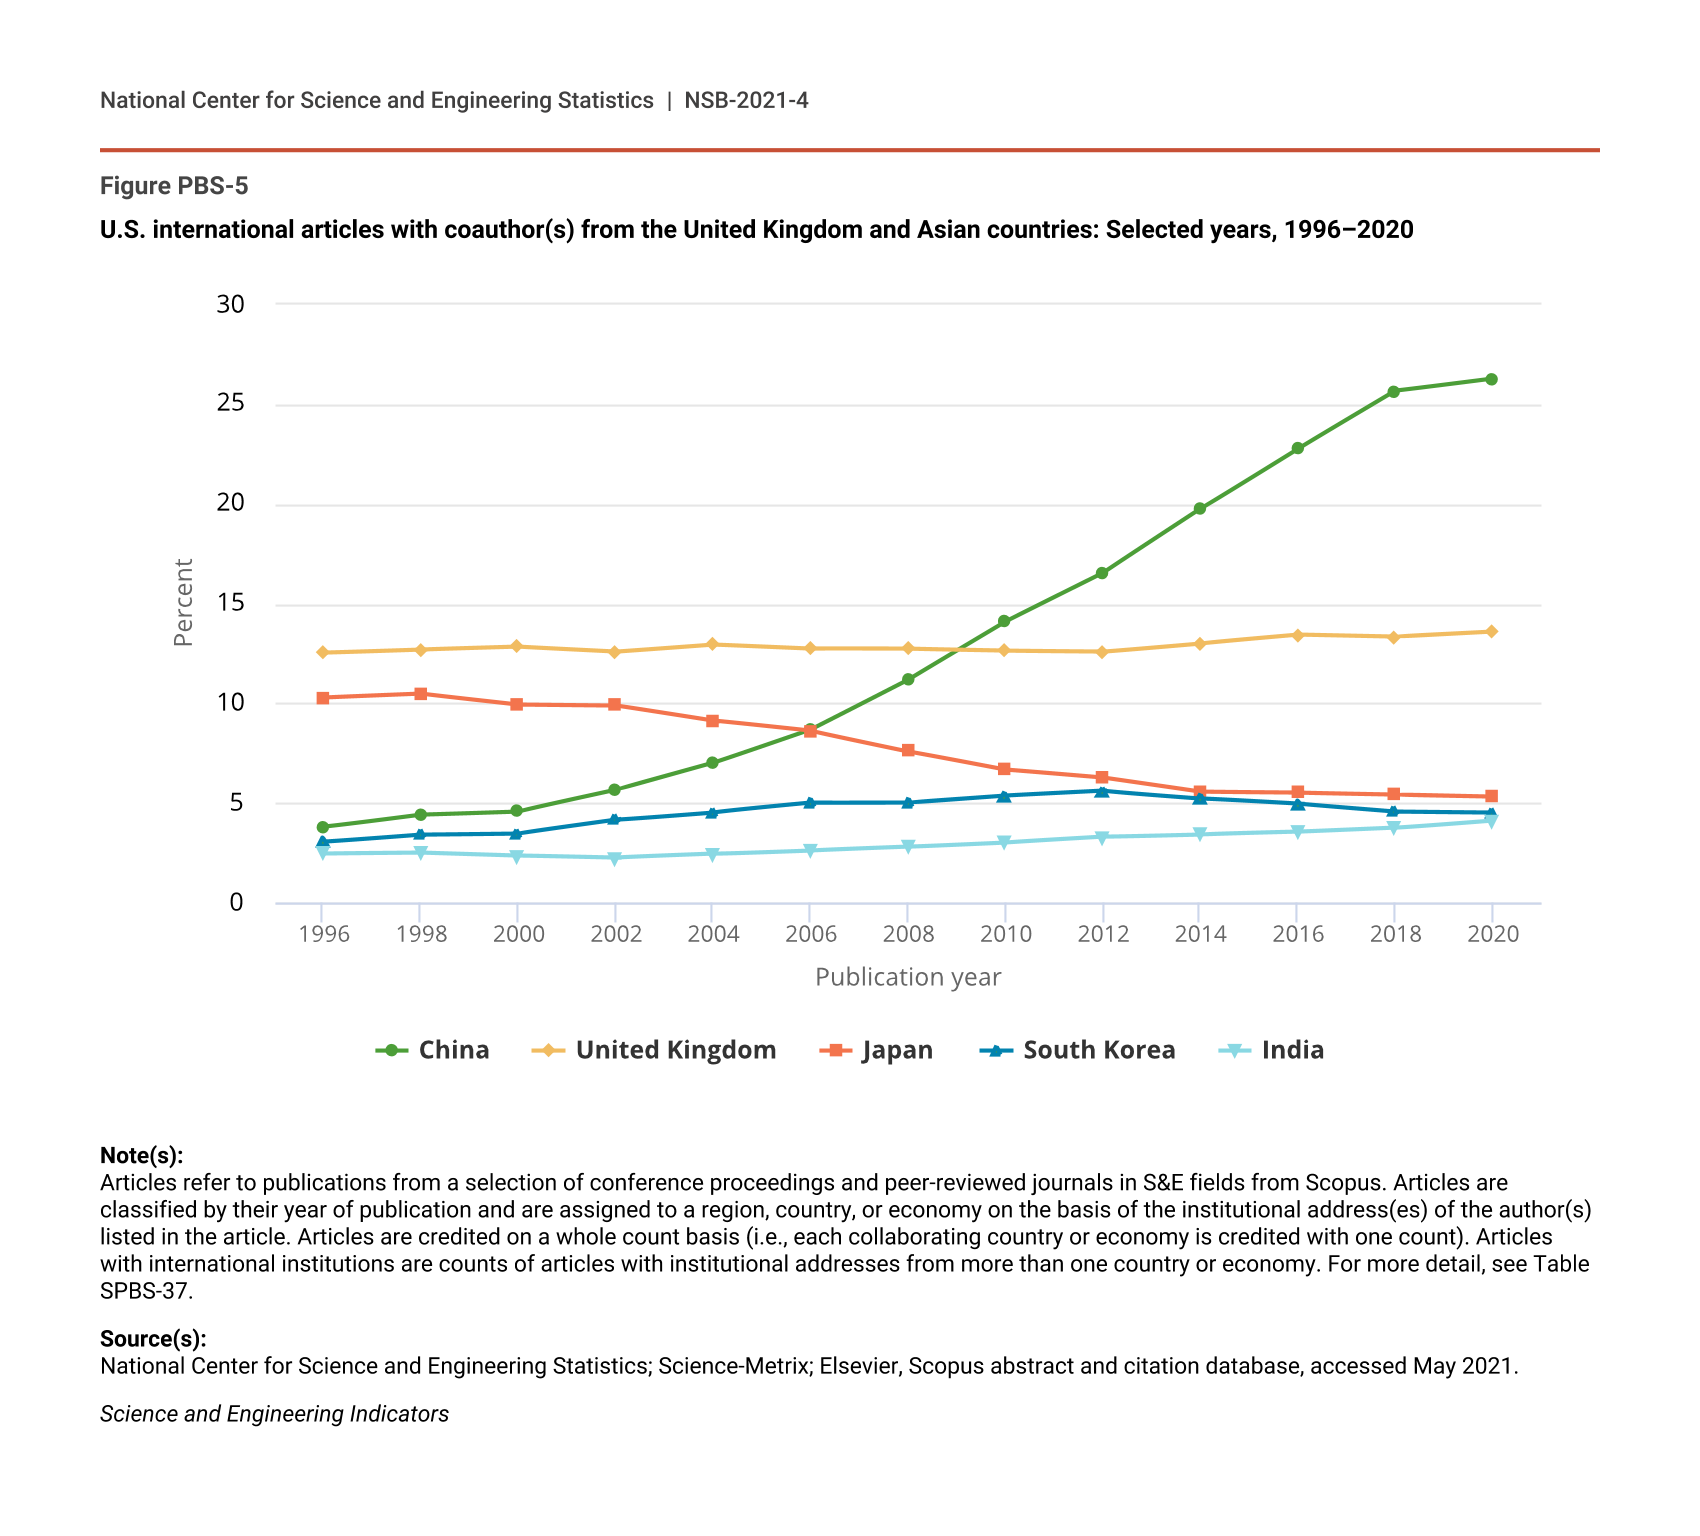
Globally, publication output shares have changed (Figure PBS-2), and so have the U.S. international collaboration partnerships, especially with Asian countries. In 1996, the largest collaboration country for the United States was the UK, which accounted for 13% of U.S. internationally collaborated articles; by comparison, China (26%) was the largest collaborator with the United States in 2020 (Figure PBS-5). In 2020, roughly one of every four internationally coauthored U.S. articles was with an author with an institutional address in China. The U.S.-China collaboration on publications has benefited both countries as well as global science through the amount of published research collaborations, funding agency support from U.S. and China, and the role of collaborators on papers (Lee and Haupt 2020). The rapid growth in U.S.-China collaborations coincided with the growing scientific and technological capabilities of China, such as rising R&D spending (see forthcoming Indicators 2022 report “Research and Development: U.S. and International Trends”) and university degree awards (see forthcoming Indicators 2022 report “Higher Education in Science and Engineering”), which may be contributing factors to the U.S.-China collaboration pattern.
U.S. international articles with coauthor(s) from the United Kingdom and Asian countries: Selected years, 1996–2020
| Publication year | China | United Kingdom | Japan | South Korea | India |
|---|---|---|---|---|---|
| 1996 | 3.78 | 12.51 | 10.29 | 3.04 | 2.46 |
| 1998 | 4.41 | 12.67 | 10.48 | 3.41 | 2.50 |
| 2000 | 4.57 | 12.81 | 9.94 | 3.47 | 2.35 |
| 2002 | 5.63 | 12.57 | 9.89 | 4.14 | 2.24 |
| 2004 | 6.99 | 12.93 | 9.12 | 4.52 | 2.42 |
| 2006 | 8.68 | 12.72 | 8.60 | 4.98 | 2.60 |
| 2008 | 11.19 | 12.71 | 7.58 | 4.99 | 2.78 |
| 2010 | 14.10 | 12.62 | 6.65 | 5.34 | 3.00 |
| 2012 | 16.53 | 12.58 | 6.24 | 5.58 | 3.28 |
| 2014 | 19.73 | 13.00 | 5.53 | 5.22 | 3.40 |
| 2016 | 22.76 | 13.42 | 5.49 | 4.94 | 3.52 |
| 2018 | 25.66 | 13.32 | 5.40 | 4.55 | 3.73 |
| 2020 | 26.28 | 13.57 | 5.30 | 4.50 | 4.11 |
Note(s):
Articles refer to publications from a selection of conference proceedings and peer-reviewed journals in S&E fields from Scopus. Articles are classified by their year of publication and are assigned to a region, country, or economy on the basis of the institutional address(es) of the author(s) listed in the article. Articles are credited on a whole count basis (i.e., each collaborating country or economy is credited with one count). Articles with international institutions are counts of articles with institutional addresses from more than one country or economy. For more detail, see Table SPBS-37.
Source(s):
National Center for Science and Engineering Statistics; Science-Metrix; Elsevier, Scopus abstract and citation database, accessed May 2021.
Science and Engineering Indicators
U.S. international articles with other Asian countries have also changed over time. From 1996 to 2020, U.S. articles with Japan generally declined but gradually increased with India. South Korea presents a case in which U.S. partnerships grew from 1996 to 2012 and then declined from 2014 to 2020 as South Korea increased its partnerships with other Asian countries. Meanwhile, there has been little change to the percentage of U.S. coauthorships with Canada and European countries, such as the UK, Germany, France, Switzerland, Italy, the Netherlands, and Sweden (Table SPBS-37).
Since 1996, the countries that produce over 75% of the world’s publication output partner with at least one U.S. author for a quarter or more of their international articles, with the exceptions of Russia and Spain from 2018 to 2020, France in 2008, and Iran for most years (Table SPBS-38). From 1996 to 2020, Canada, China, and South Korea have partnered with the United States the most, but coauthor percentages have declined in recent years as those countries have increased their coauthorship with other countries, primarily in the Pacific region.
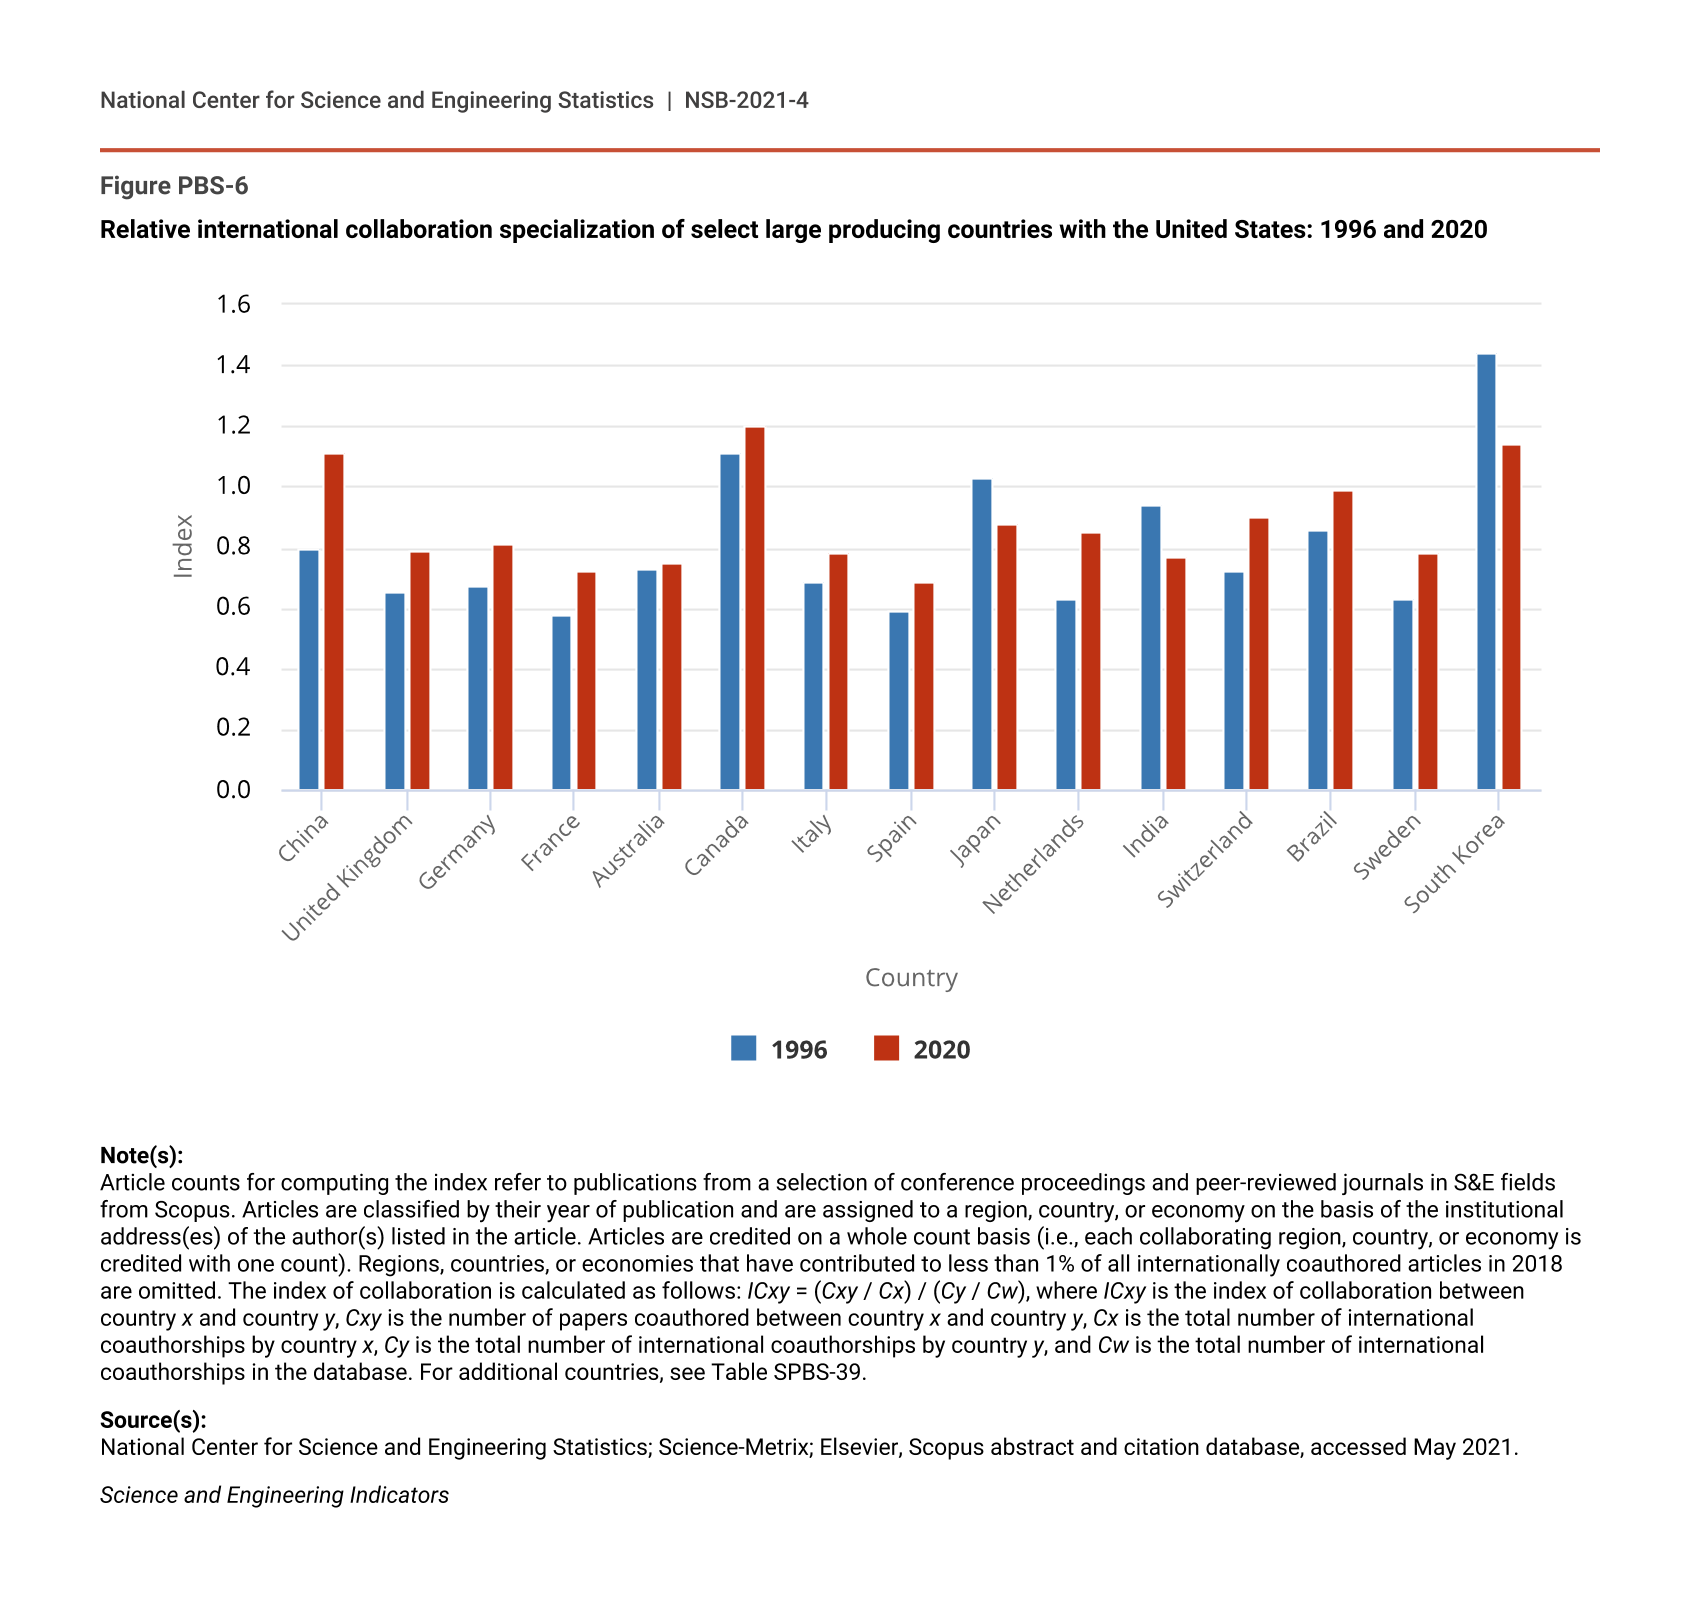
Normalizing the international collaboration by a country’s publication output enables comparisons independent of country size (He 2009). The international collaboration index is obtained by dividing a country’s share of collaboration with another country by its overall share of international collaborations with all countries. An index of 1.0 occurs when coauthorship between two countries is exactly proportional to their overall shares of international collaborations. Index values above 1.0 indicate stronger ties, and scores below 1.0 indicate weaker collaborative ties. The index of internationally coauthored S&E articles increased between the United States and most other major research countries from 1996 to 2020, with the exceptions of South Korea (1.4 to 1.1), Japan (1.0 to 0.9), and India (0.9 to 0.8) (Figure PBS-6).
Relative international collaboration specialization of select large producing countries with the United States: 1996 and 2020
| Country | 1996 | 2020 |
|---|---|---|
| China | 0.80 | 1.11 |
| United Kingdom | 0.65 | 0.79 |
| Germany | 0.67 | 0.81 |
| France | 0.58 | 0.72 |
| Australia | 0.73 | 0.75 |
| Canada | 1.11 | 1.20 |
| Italy | 0.69 | 0.78 |
| Spain | 0.59 | 0.69 |
| Japan | 1.03 | 0.88 |
| Netherlands | 0.63 | 0.85 |
| India | 0.94 | 0.77 |
| Switzerland | 0.72 | 0.90 |
| Brazil | 0.86 | 0.99 |
| Sweden | 0.63 | 0.78 |
| South Korea | 1.44 | 1.14 |
Note(s):
Article counts for computing the index refer to publications from a selection of conference proceedings and peer-reviewed journals in S&E fields from Scopus. Articles are classified by their year of publication and are assigned to a region, country, or economy on the basis of the institutional address(es) of the author(s) listed in the article. Articles are credited on a whole count basis (i.e., each collaborating region, country, or economy is credited with one count). Regions, countries, or economies that have contributed to less than 1% of all internationally coauthored articles in 2018 are omitted. The index of collaboration is calculated as follows: ICxy = (Cxy / Cx) / (Cy / Cw), where ICxy is the index of collaboration between country x and country y, Cxy is the number of papers coauthored between country x and country y, Cx is the total number of international coauthorships by country x, Cy is the total number of international coauthorships by country y, and Cw is the total number of international coauthorships in the database. For additional countries, see Table SPBS-39.
Source(s):
National Center for Science and Engineering Statistics; Science-Metrix; Elsevier, Scopus abstract and citation database, accessed May 2021.
Science and Engineering Indicators
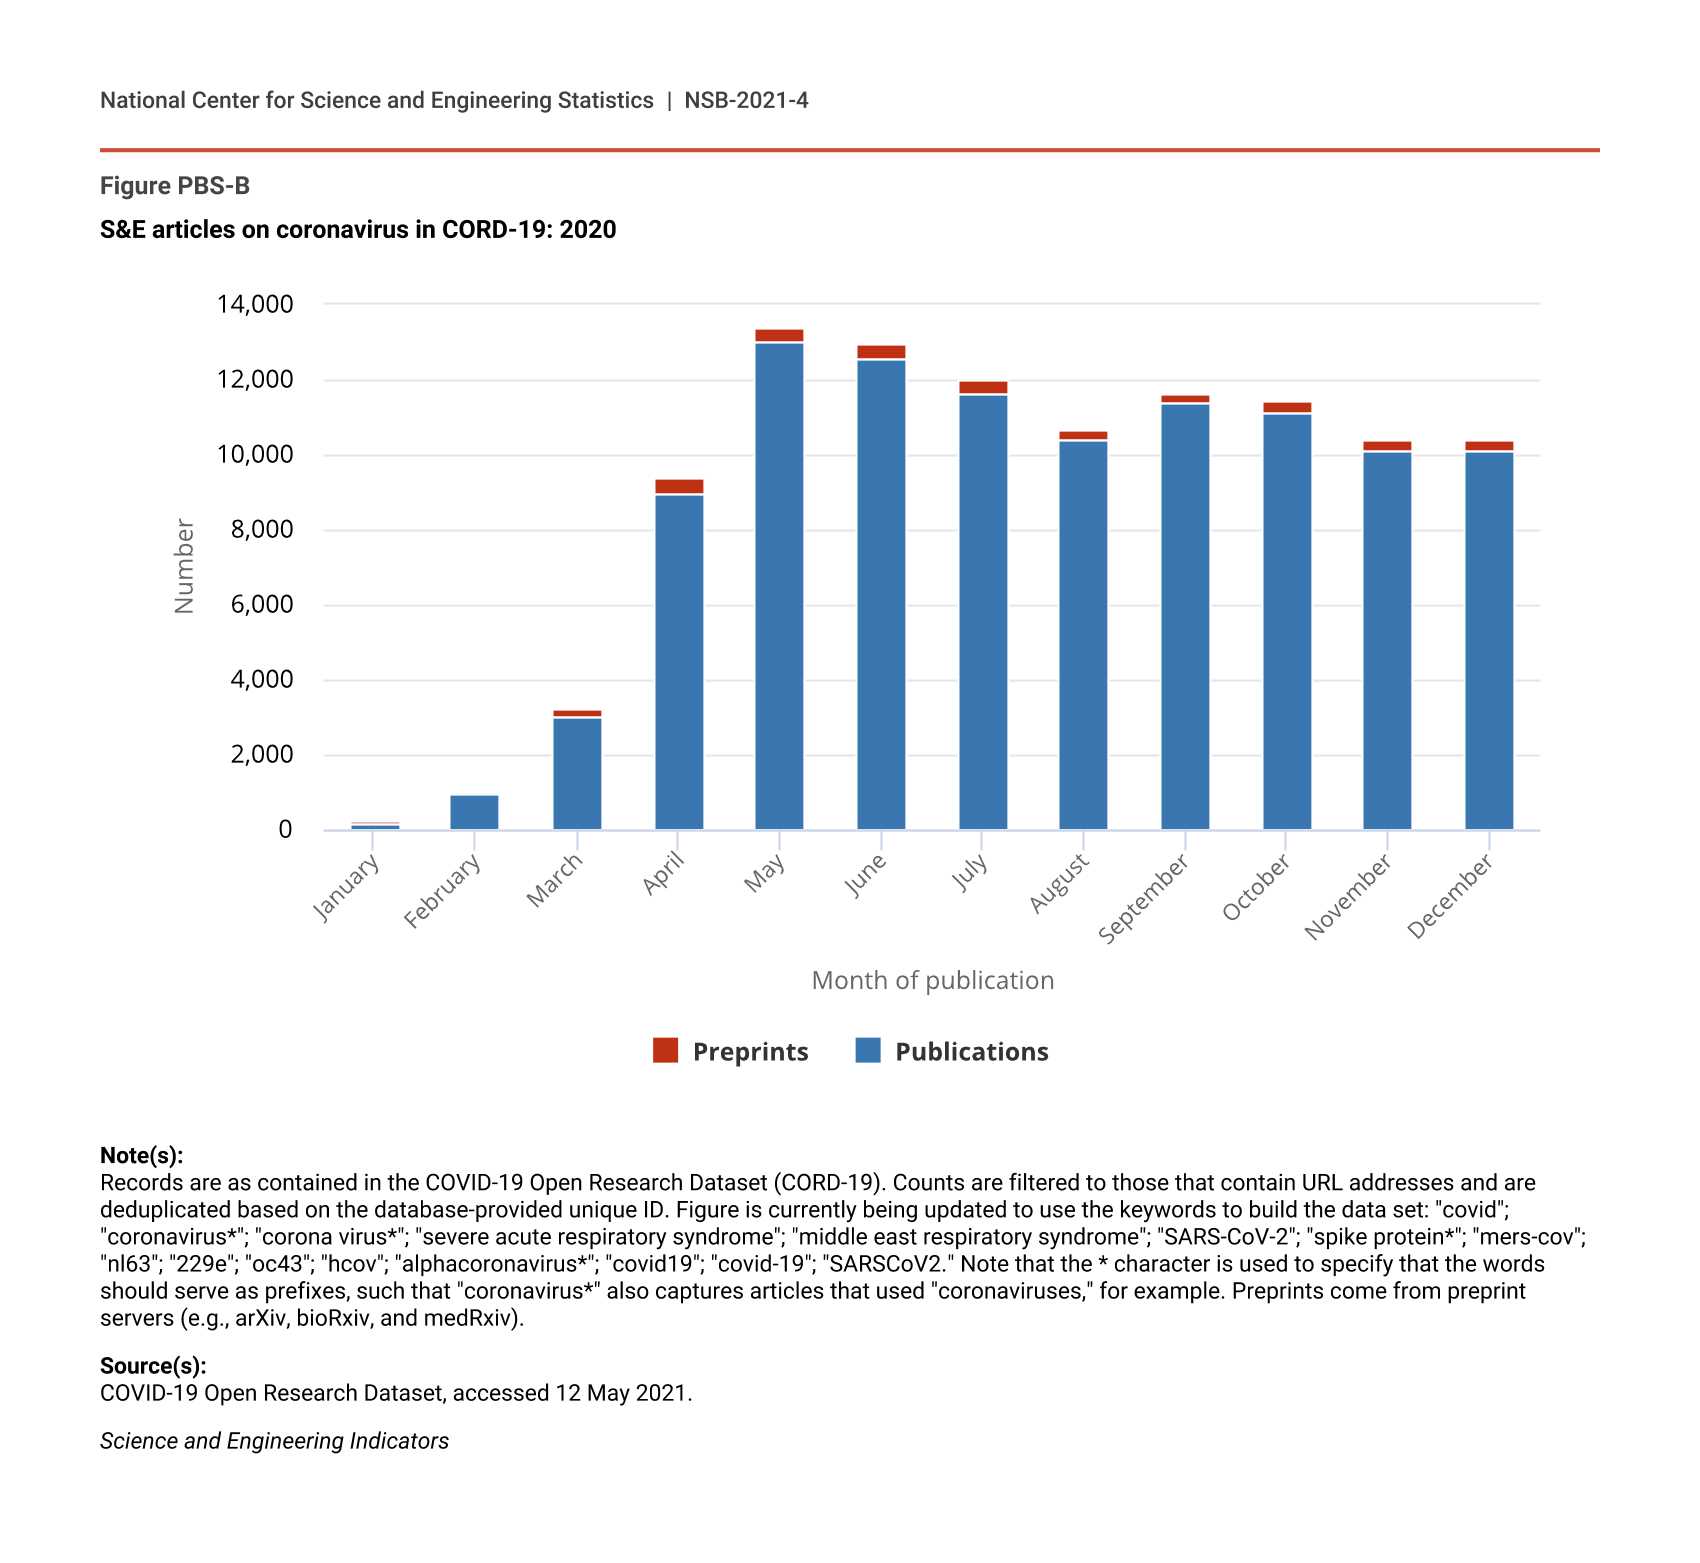
International collaboration on COVID-19 research shows the role of the United States as a leading research producer and collaborator. (See sidebar Coronavirus Publication Output and International Collaboration.)
International Citation Patterns
Like the indicators of international coauthorship, cross-national citations provide evidence that S&E research is increasingly international in scope. Citations to a country’s publications that come from publications authored outside that country are referred to as international citations. This section provides a relative measure normalized by the publication output by country. If the international citations were simply summed by country, the United States, the UK, Germany, and China would account for the largest shares of the international citations simply because they produce so many articles.
The relative citation index (RCI) provides a method to group the citations between countries as above (greater than 1), near (about 1), or below (less than 1) the expected rate of citation relative to each country’s output level. Using the RCI, U.S. authors display a proclivity for citing English-speaking countries with a citation rate above the expected rate with those countries: for example, Canada (1.22), the UK (1.25), and Australia (1.06) (Table PBS-2). In the next grouping of those near the expected rate of citation are countries with historically large research communities: for example, Germany (0.91), Italy (0.71), and France (0.85). Finally, U.S. authors cite countries with emerging research communities less than expected given the number of articles produced by those countries: for example, China (0.39), India (0.21), and Iran (0.26).
Relative citation index for 15 largest producing regions, countries, or economies: 2018
Note(s):
Citations refer to publications from a selection of journals, books, and conference proceedings in S&E from Scopus. Articles are classified by their year of publication and are assigned to a region, country, or economy on the basis of the institutional address(es) listed in the article. Articles are credited on a fractional count basis (i.e., for articles with collaborating institutions from multiple countries or economies, each country or economy receives fractional credit on the basis of the proportion of its participating institutions). Citation counts are based on all citations made to articles in their publication year and in the following two years (i.e., 3-year citation window; scores in 2018 are based on citations to articles published in 2018 that were made in articles published in 2018–20). The relative citation index (RCI) normalizes cross-national citation data for variations in relative size of publication output. RCI is computed by dividing the share of the citing country's outgoing citations going to the cited country and then dividing that amount by the share of publications attributed to the cited country. An RCI of 1.00 means that the citing country cites publications from the cited country as much as would be expected to happen randomly, showing no particular affinity between the countries. Scores higher than 1.00 mean that the citing country has a higher-than-expected tendency to cite the cited country’s S&E literature. For more detail, see Table SPBS-40. Cells in which the region, country, or economy collaborates at or above the world average for that year are shaded green.
Source(s):
National Center for Science and Engineering Statistics; Science-Metrix; Elsevier, Scopus abstract and citation database, accessed May 2021.
Science and Engineering Indicators
The RCI also provides a view into the international nature of the scientific research in a country by presenting the number of other countries from which the country draws its research (i.e., citations). For example, authors from China predominantly cite articles from China (2.6), and only South Korea, Saudi Arabia, and Australia are cited by China near the expected rate (Table PBS-2 and Table SPBS-40). Russia (12.9) and Iran (16.3) tend to cite within their own publications (Table PBS-2). On the other hand, France cites many other countries at a greater than expected rate—the United States (1.2), the UK (1.5), Germany (1.3), Italy (1.3), Canada (1.1), Spain (1.1), and Australia (1.1) (Table PBS-2). Many other European countries display a similar pattern. Supplementary tables provide equivalent information for each of the 14 scientific fields (Tables SPBS-41 through Table SPBS-54).