 An official website of the United States government
 Trends in U.S. R&D Performance
U.S. R&D is performed and funded by businesses, governments, higher education, and nonprofit organizations. R&D performance refers to who conducts R&D, whether it is funded from internal funds or external financial sources (e.g., contracts, grants). From the perspective of R&D funding, funds may be devoted to own R&D or to pay for R&D in other sectors or organizations (private R&D services suppliers, academic or nonprofit grantees) (OECD 2015:126). Academic R&D is covered only briefly in this report given that the Indicators 2024 report “Academic Research and Development” provides comprehensive information for this sector.
U.S. Total R&D and R&D Intensity
U.S. Total R&D
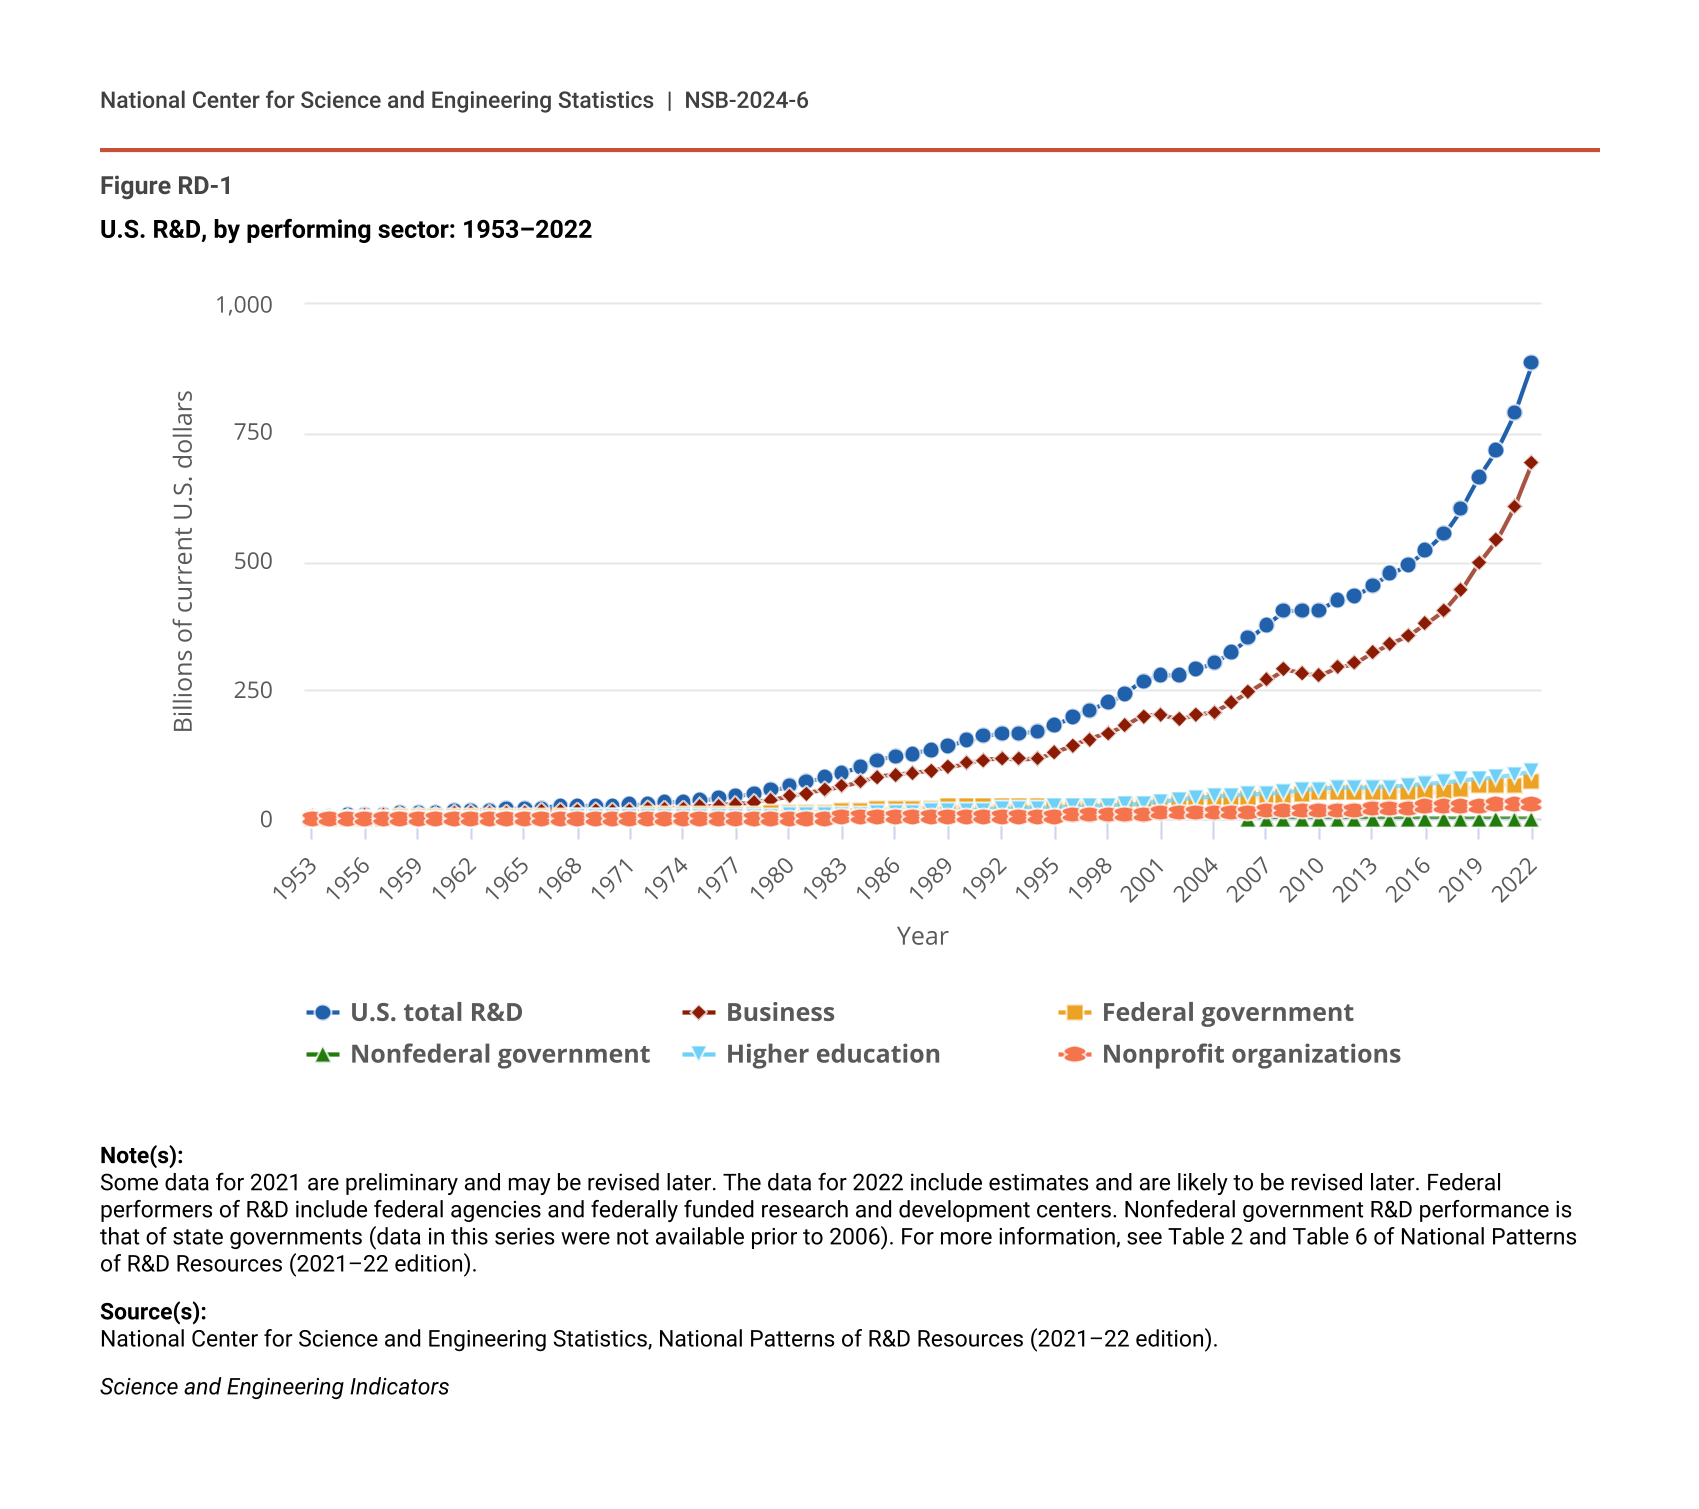
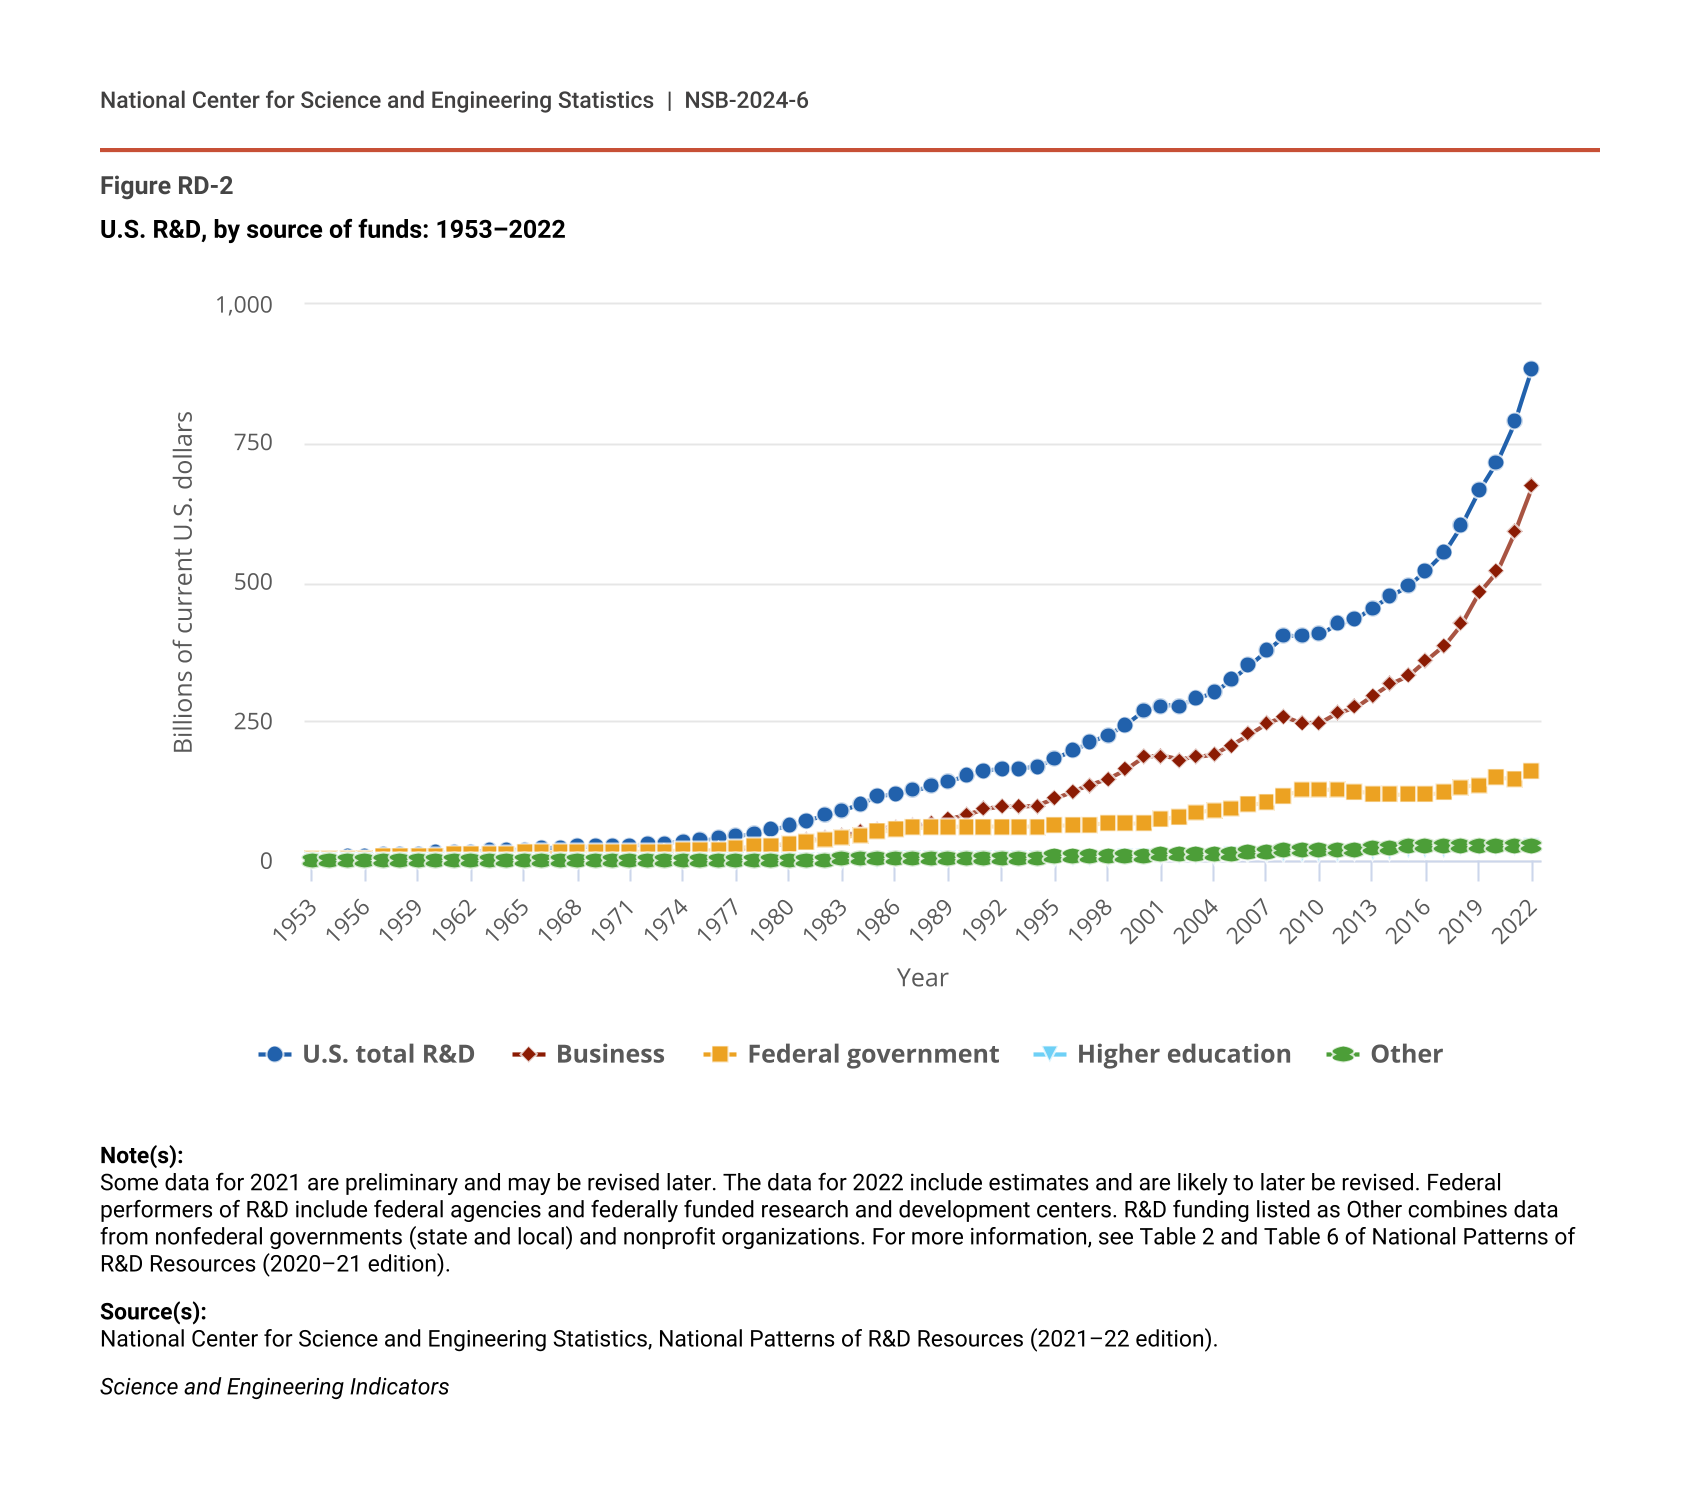
In 2022, the United States performed an estimated $885.6 billion in R&D in current (nominal) U.S. dollars (Figure RD-1, Figure RD-2; Table RD-1), based on National Patterns statistics (Anderson 2024; NCSES 2024). This is an increase of 12% from 2021 but only of 5% in constant (inflation-adjusted) 2017 U.S. dollars.
U.S. R&D, by performing sector: 1953–2022
| Year | U.S. total R&D | Business | Federal government | Nonfederal government | Higher education | Nonprofit organizations |
|---|---|---|---|---|---|---|
| 1953 | 5.2 | 3.6 | 1.1 | NA | 0.3 | 0.1 |
| 1954 | 5.6 | 4.1 | 1.1 | NA | 0.3 | 0.1 |
| 1955 | 6.2 | 4.4 | 1.3 | NA | 0.3 | 0.1 |
| 1956 | 8.5 | 6.3 | 1.7 | NA | 0.4 | 0.1 |
| 1957 | 9.9 | 7.3 | 2.0 | NA | 0.4 | 0.2 |
| 1958 | 10.9 | 8.1 | 2.2 | NA | 0.5 | 0.2 |
| 1959 | 12.5 | 9.2 | 2.5 | NA | 0.6 | 0.2 |
| 1960 | 13.7 | 10.0 | 2.7 | NA | 0.7 | 0.3 |
| 1961 | 14.6 | 10.4 | 3.1 | NA | 0.8 | 0.3 |
| 1962 | 15.6 | 11.0 | 3.2 | NA | 1.0 | 0.4 |
| 1963 | 17.5 | 12.2 | 3.7 | NA | 1.2 | 0.4 |
| 1964 | 19.1 | 13.0 | 4.3 | NA | 1.4 | 0.4 |
| 1965 | 20.3 | 13.8 | 4.4 | NA | 1.6 | 0.5 |
| 1966 | 22.1 | 15.2 | 4.5 | NA | 1.8 | 0.5 |
| 1967 | 23.3 | 16.0 | 4.8 | NA | 2.0 | 0.6 |
| 1968 | 24.7 | 17.0 | 4.9 | NA | 2.2 | 0.6 |
| 1969 | 26.0 | 17.8 | 5.2 | NA | 2.3 | 0.6 |
| 1970 | 26.3 | 17.6 | 5.6 | NA | 2.4 | 0.7 |
| 1971 | 27.0 | 17.8 | 5.8 | NA | 2.6 | 0.7 |
| 1972 | 28.7 | 19.0 | 6.2 | NA | 2.8 | 0.8 |
| 1973 | 31.0 | 20.7 | 6.4 | NA | 3.0 | 0.9 |
| 1974 | 33.4 | 22.2 | 6.9 | NA | 3.2 | 1.0 |
| 1975 | 35.7 | 23.5 | 7.6 | NA | 3.6 | 1.1 |
| 1976 | 39.4 | 26.1 | 8.3 | NA | 3.9 | 1.1 |
| 1977 | 43.3 | 28.9 | 8.9 | NA | 4.3 | 1.2 |
| 1978 | 48.7 | 32.2 | 10.1 | NA | 5.0 | 1.4 |
| 1979 | 55.4 | 37.1 | 11.0 | NA | 5.7 | 1.6 |
| 1980 | 63.2 | 43.2 | 11.9 | NA | 6.5 | 1.7 |
| 1981 | 72.3 | 50.4 | 13.0 | NA | 7.1 | 1.8 |
| 1982 | 80.7 | 57.2 | 14.1 | NA | 7.6 | 1.9 |
| 1983 | 89.9 | 63.7 | 15.8 | NA | 8.3 | 2.2 |
| 1984 | 102.2 | 73.1 | 17.5 | NA | 9.2 | 2.5 |
| 1985 | 114.7 | 82.4 | 19.2 | NA | 10.3 | 2.8 |
| 1986 | 120.2 | 85.9 | 19.9 | NA | 11.5 | 2.9 |
| 1987 | 126.4 | 90.2 | 20.4 | NA | 12.8 | 3.0 |
| 1988 | 133.9 | 94.9 | 21.6 | NA | 14.2 | 3.2 |
| 1989 | 141.9 | 99.9 | 22.7 | NA | 15.6 | 3.7 |
| 1990 | 152.0 | 107.4 | 23.5 | NA | 16.9 | 4.1 |
| 1991 | 160.9 | 114.7 | 23.3 | NA | 18.2 | 4.7 |
| 1992 | 165.4 | 116.8 | 24.2 | NA | 19.4 | 5.0 |
| 1993 | 165.7 | 115.4 | 24.5 | NA | 20.5 | 5.3 |
| 1994 | 169.2 | 117.4 | 24.6 | NA | 21.6 | 5.6 |
| 1995 | 183.6 | 129.8 | 25.4 | NA | 22.6 | 5.8 |
| 1996 | 197.3 | 142.4 | 25.0 | NA | 23.7 | 6.2 |
| 1997 | 211.9 | 155.4 | 25.2 | NA | 24.6 | 6.6 |
| 1998 | 225.8 | 167.1 | 25.8 | NA | 25.6 | 7.2 |
| 1999 | 244.5 | 182.1 | 26.8 | NA | 27.5 | 8.0 |
| 2000 | 267.9 | 200.0 | 28.5 | NA | 29.9 | 9.6 |
| 2001 | 278.5 | 202.0 | 32.8 | NA | 32.7 | 11.0 |
| 2002 | 277.9 | 193.9 | 35.5 | NA | 36.7 | 11.9 |
| 2003 | 291.4 | 200.7 | 37.2 | NA | 40.6 | 12.8 |
| 2004 | 302.7 | 208.3 | 37.7 | NA | 43.3 | 13.4 |
| 2005 | 325.3 | 226.2 | 39.6 | NA | 45.5 | 14.1 |
| 2006 | 350.9 | 247.7 | 41.6 | 0.3 | 47.4 | 14.0 |
| 2007 | 377.9 | 269.3 | 44.1 | 0.4 | 49.4 | 14.7 |
| 2008 | 404.8 | 290.7 | 45.6 | 0.5 | 52.1 | 15.9 |
| 2009 | 402.9 | 282.4 | 47.6 | 0.6 | 54.9 | 17.5 |
| 2010 | 406.6 | 279.0 | 50.8 | 0.7 | 58.1 | 18.0 |
| 2011 | 426.2 | 294.1 | 53.5 | 0.7 | 60.1 | 17.8 |
| 2012 | 433.7 | 302.3 | 52.1 | 0.7 | 60.9 | 17.8 |
| 2013 | 454.2 | 322.5 | 51.1 | 0.6 | 61.5 | 18.5 |
| 2014 | 475.9 | 340.7 | 52.7 | 0.6 | 62.3 | 19.6 |
| 2015 | 494.5 | 355.8 | 52.8 | 0.6 | 64.6 | 20.6 |
| 2016 | 521.7 | 379.5 | 51.2 | 0.6 | 67.8 | 22.6 |
| 2017 | 553.6 | 405.8 | 52.6 | 0.6 | 71.1 | 23.5 |
| 2018 | 604.0 | 445.6 | 58.4 | 0.6 | 74.9 | 24.6 |
| 2019 | 665.6 | 498.2 | 62.8 | 0.7 | 78.2 | 25.7 |
| 2020 | 716.9 | 543.2 | 65.1 | 0.7 | 80.8 | 27.1 |
| 2021 | 789.1 | 608.6 | 66.8 | 0.7 | 85.8 | 27.2 |
| 2022 | 885.6 | 692.7 | 73.3 | 0.7 | 91.5 | 27.3 |
Note(s):
Some data for 2021 are preliminary and may be revised later. The data for 2022 include estimates and are likely to be revised later. Federal performers of R&D include federal agencies and federally funded research and development centers. Nonfederal government R&D performance is that of state governments (data in this series were not available prior to 2006). For more information, see Table 2 and Table 6 of National Patterns of R&D Resources (2021–22 edition).
Source(s):
National Center for Science and Engineering Statistics, National Patterns of R&D Resources (2021–22 edition).
Science and Engineering Indicators
U.S. R&D, by source of funds: 1953–2022
| Year | U.S. total R&D | Business | Federal government | Higher education | Other |
|---|---|---|---|---|---|
| 1953 | 5.2 | 2.2 | 2.8 | 0.0 | 0.1 |
| 1954 | 5.6 | 2.4 | 3.1 | 0.0 | 0.1 |
| 1955 | 6.2 | 2.5 | 3.5 | 0.0 | 0.1 |
| 1956 | 8.5 | 3.3 | 5.0 | 0.0 | 0.1 |
| 1957 | 9.9 | 3.5 | 6.2 | 0.1 | 0.2 |
| 1958 | 10.9 | 3.7 | 7.0 | 0.1 | 0.2 |
| 1959 | 12.5 | 4.1 | 8.2 | 0.1 | 0.2 |
| 1960 | 13.7 | 4.5 | 8.9 | 0.1 | 0.2 |
| 1961 | 14.6 | 4.8 | 9.5 | 0.1 | 0.2 |
| 1962 | 15.6 | 5.1 | 10.1 | 0.1 | 0.3 |
| 1963 | 17.5 | 5.5 | 11.6 | 0.1 | 0.3 |
| 1964 | 19.1 | 5.9 | 12.8 | 0.1 | 0.3 |
| 1965 | 20.3 | 6.5 | 13.2 | 0.1 | 0.4 |
| 1966 | 22.1 | 7.3 | 14.2 | 0.2 | 0.4 |
| 1967 | 23.3 | 8.1 | 14.6 | 0.2 | 0.4 |
| 1968 | 24.7 | 9.0 | 15.0 | 0.2 | 0.5 |
| 1969 | 26.0 | 10.0 | 15.2 | 0.2 | 0.5 |
| 1970 | 26.3 | 10.4 | 15.0 | 0.3 | 0.6 |
| 1971 | 27.0 | 10.8 | 15.2 | 0.3 | 0.6 |
| 1972 | 28.7 | 11.7 | 16.0 | 0.3 | 0.7 |
| 1973 | 31.0 | 13.3 | 16.6 | 0.3 | 0.7 |
| 1974 | 33.4 | 14.9 | 17.3 | 0.4 | 0.8 |
| 1975 | 35.7 | 15.8 | 18.5 | 0.4 | 0.9 |
| 1976 | 39.4 | 17.7 | 20.3 | 0.5 | 1.0 |
| 1977 | 43.3 | 19.6 | 22.1 | 0.6 | 1.1 |
| 1978 | 48.7 | 22.5 | 24.4 | 0.7 | 1.2 |
| 1979 | 55.4 | 26.1 | 27.2 | 0.8 | 1.3 |
| 1980 | 63.2 | 30.9 | 30.0 | 0.9 | 1.4 |
| 1981 | 72.3 | 35.9 | 33.7 | 1.1 | 1.5 |
| 1982 | 80.7 | 40.7 | 37.1 | 1.2 | 1.7 |
| 1983 | 89.9 | 45.3 | 41.5 | 1.4 | 1.9 |
| 1984 | 102.2 | 52.2 | 46.5 | 1.5 | 2.1 |
| 1985 | 114.7 | 58.0 | 52.6 | 1.7 | 2.3 |
| 1986 | 120.2 | 61.0 | 54.6 | 2.0 | 2.6 |
| 1987 | 126.4 | 62.6 | 58.6 | 2.3 | 2.9 |
| 1988 | 133.9 | 68.0 | 60.1 | 2.5 | 3.2 |
| 1989 | 141.9 | 75.0 | 60.5 | 2.9 | 3.6 |
| 1990 | 152.0 | 83.2 | 61.6 | 3.2 | 4.0 |
| 1991 | 160.9 | 92.3 | 60.8 | 3.5 | 4.3 |
| 1992 | 165.4 | 96.2 | 60.9 | 3.6 | 4.6 |
| 1993 | 165.7 | 96.5 | 60.5 | 3.7 | 4.9 |
| 1994 | 169.2 | 99.2 | 60.8 | 3.9 | 5.3 |
| 1995 | 183.6 | 110.9 | 63.0 | 4.1 | 5.7 |
| 1996 | 197.3 | 123.4 | 63.4 | 4.4 | 6.1 |
| 1997 | 211.9 | 136.2 | 64.4 | 4.9 | 6.5 |
| 1998 | 225.8 | 147.8 | 65.9 | 5.2 | 6.9 |
| 1999 | 244.5 | 164.5 | 66.8 | 5.7 | 7.4 |
| 2000 | 267.9 | 186.0 | 67.2 | 6.3 | 8.5 |
| 2001 | 278.5 | 188.4 | 73.8 | 6.9 | 9.5 |
| 2002 | 277.9 | 180.7 | 78.9 | 7.7 | 10.7 |
| 2003 | 291.4 | 186.2 | 85.1 | 8.3 | 11.8 |
| 2004 | 302.7 | 191.3 | 90.8 | 8.6 | 12.0 |
| 2005 | 325.3 | 207.8 | 95.4 | 9.4 | 12.7 |
| 2006 | 350.9 | 227.2 | 99.9 | 10.2 | 13.6 |
| 2007 | 377.9 | 246.8 | 105.1 | 10.9 | 15.0 |
| 2008 | 404.8 | 258.0 | 117.6 | 11.7 | 17.4 |
| 2009 | 402.9 | 246.6 | 125.8 | 12.1 | 18.5 |
| 2010 | 406.6 | 248.1 | 126.6 | 12.3 | 19.6 |
| 2011 | 426.2 | 266.4 | 127.0 | 13.1 | 19.7 |
| 2012 | 433.7 | 275.7 | 123.8 | 14.3 | 19.9 |
| 2013 | 454.2 | 297.2 | 120.1 | 15.3 | 21.6 |
| 2014 | 475.9 | 318.4 | 118.4 | 16.2 | 23.0 |
| 2015 | 494.5 | 333.2 | 119.5 | 17.3 | 24.4 |
| 2016 | 521.7 | 360.3 | 118.2 | 18.7 | 24.5 |
| 2017 | 553.6 | 386.5 | 122.5 | 19.9 | 24.7 |
| 2018 | 604.0 | 426.5 | 131.1 | 21.0 | 25.5 |
| 2019 | 665.6 | 482.2 | 135.8 | 21.9 | 25.7 |
| 2020 | 716.9 | 520.4 | 148.2 | 22.6 | 25.8 |
| 2021 | 789.1 | 591.0 | 147.5 | 23.8 | 26.7 |
| 2022 | 885.6 | 672.9 | 159.8 | 25.5 | 27.3 |
Note(s):
Some data for 2021 are preliminary and may be revised later. The data for 2022 include estimates and are likely to later be revised. Federal performers of R&D include federal agencies and federally funded research and development centers. R&D funding listed as Other combines data from nonfederal governments (state and local) and nonprofit organizations. For more information, see Table 2 and Table 6 of National Patterns of R&D Resources (2020–21 edition).
Source(s):
National Center for Science and Engineering Statistics, National Patterns of R&D Resources (2021–22 edition).
Science and Engineering Indicators
U.S. R&D expenditures, by performing sector and source of funds: 2010–22
FFRDC = federally funded research and development center.
a Some data for 2021 are preliminary and may be revised later.
b The data for 2022 are estimates and are likely to be revised later.
c Includes expenditures of federal intramural R&D as well as costs associated with administering extramural R&D.
Note(s):
Data are based on annual reports by performers, except for the nonprofit sector. Expenditure levels for higher education, federal government, and nonfederal government performers are calendar year approximations based on fiscal year data.
Source(s):
National Center for Science and Engineering Statistics, National Patterns of R&D Resources (2021–22 edition).
Science and Engineering Indicators
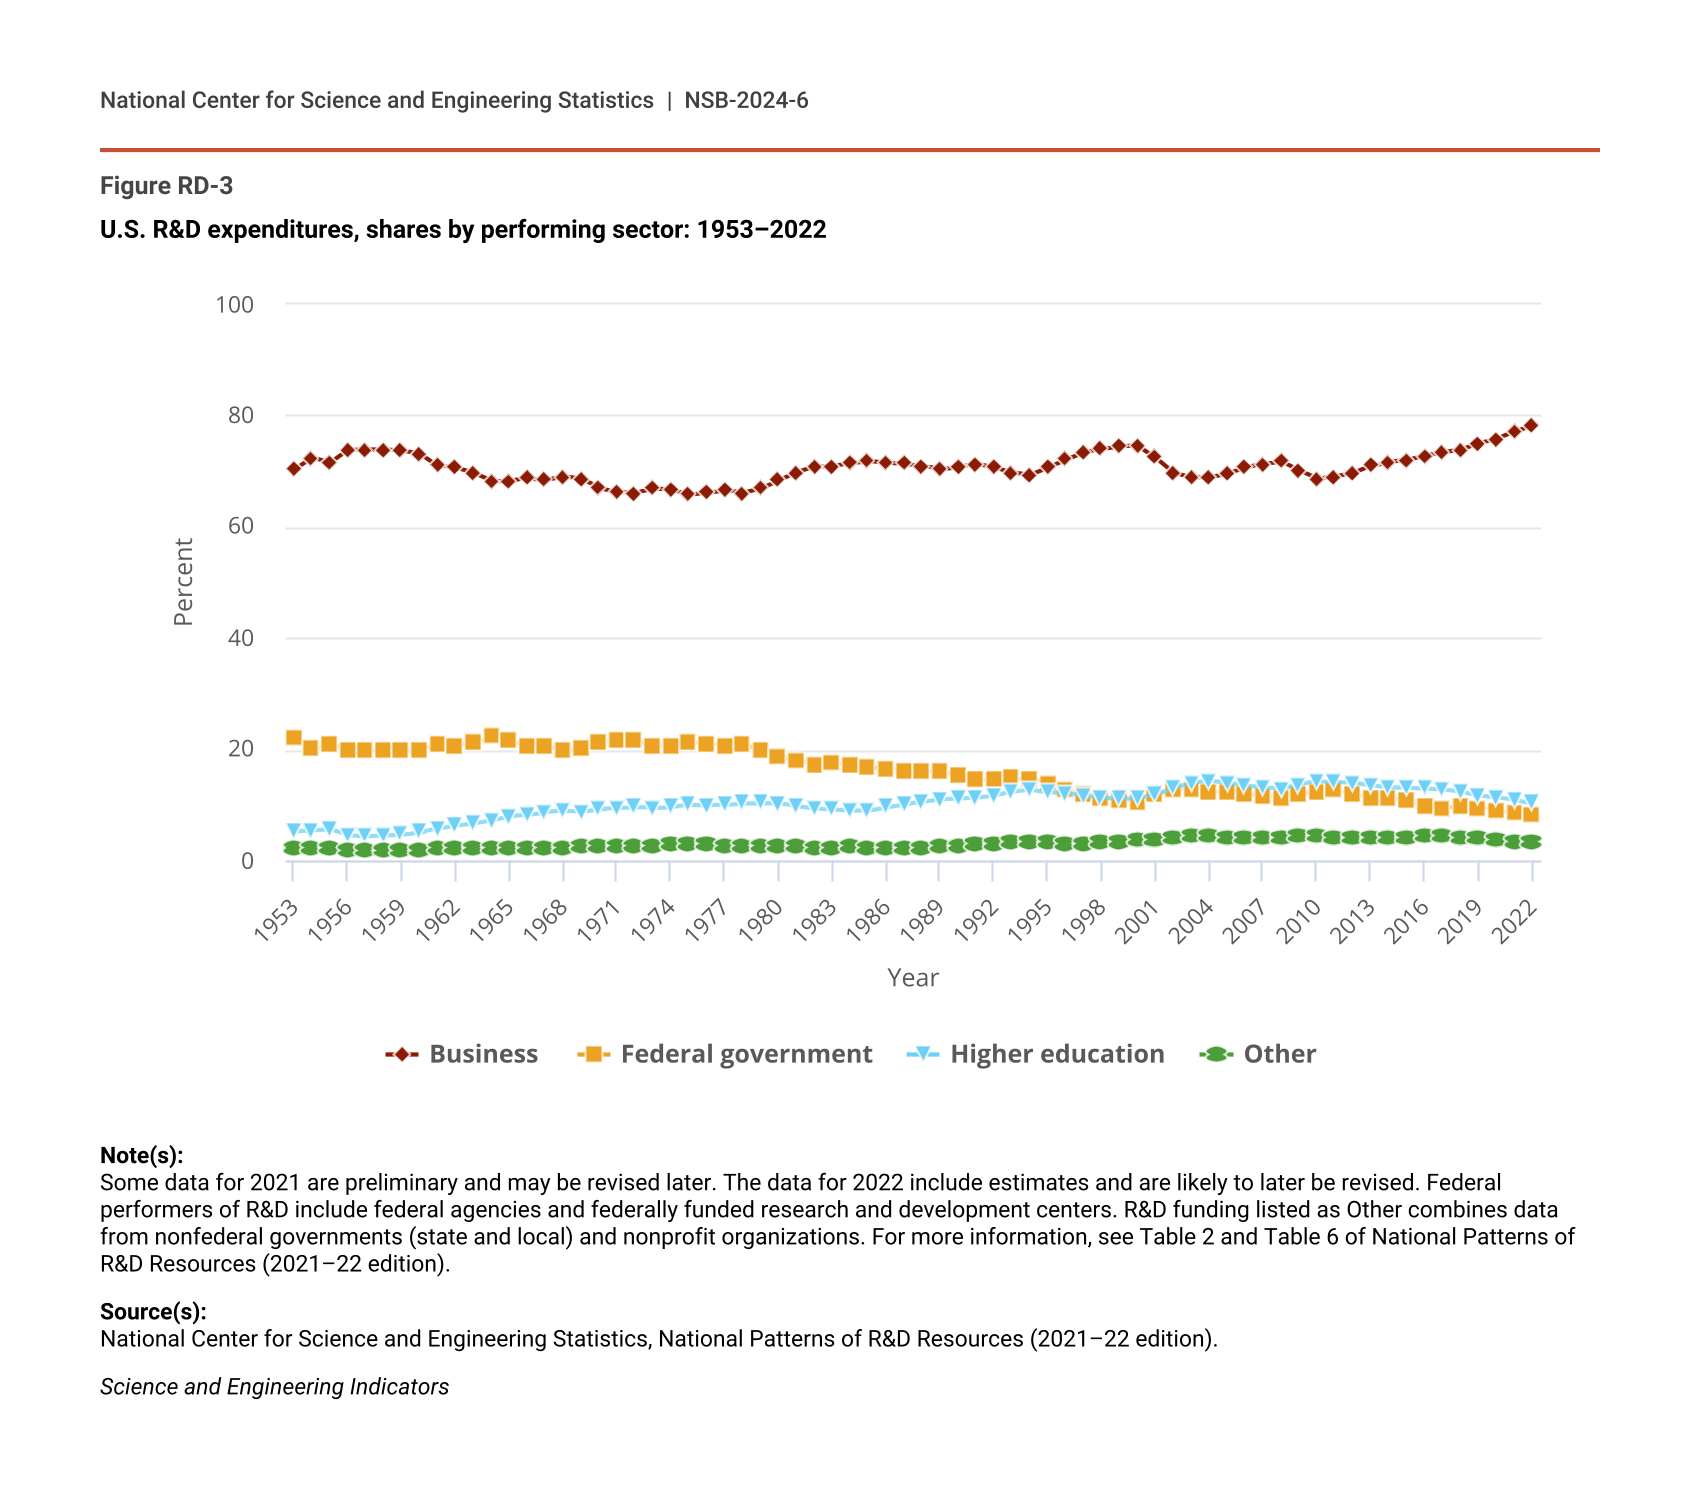
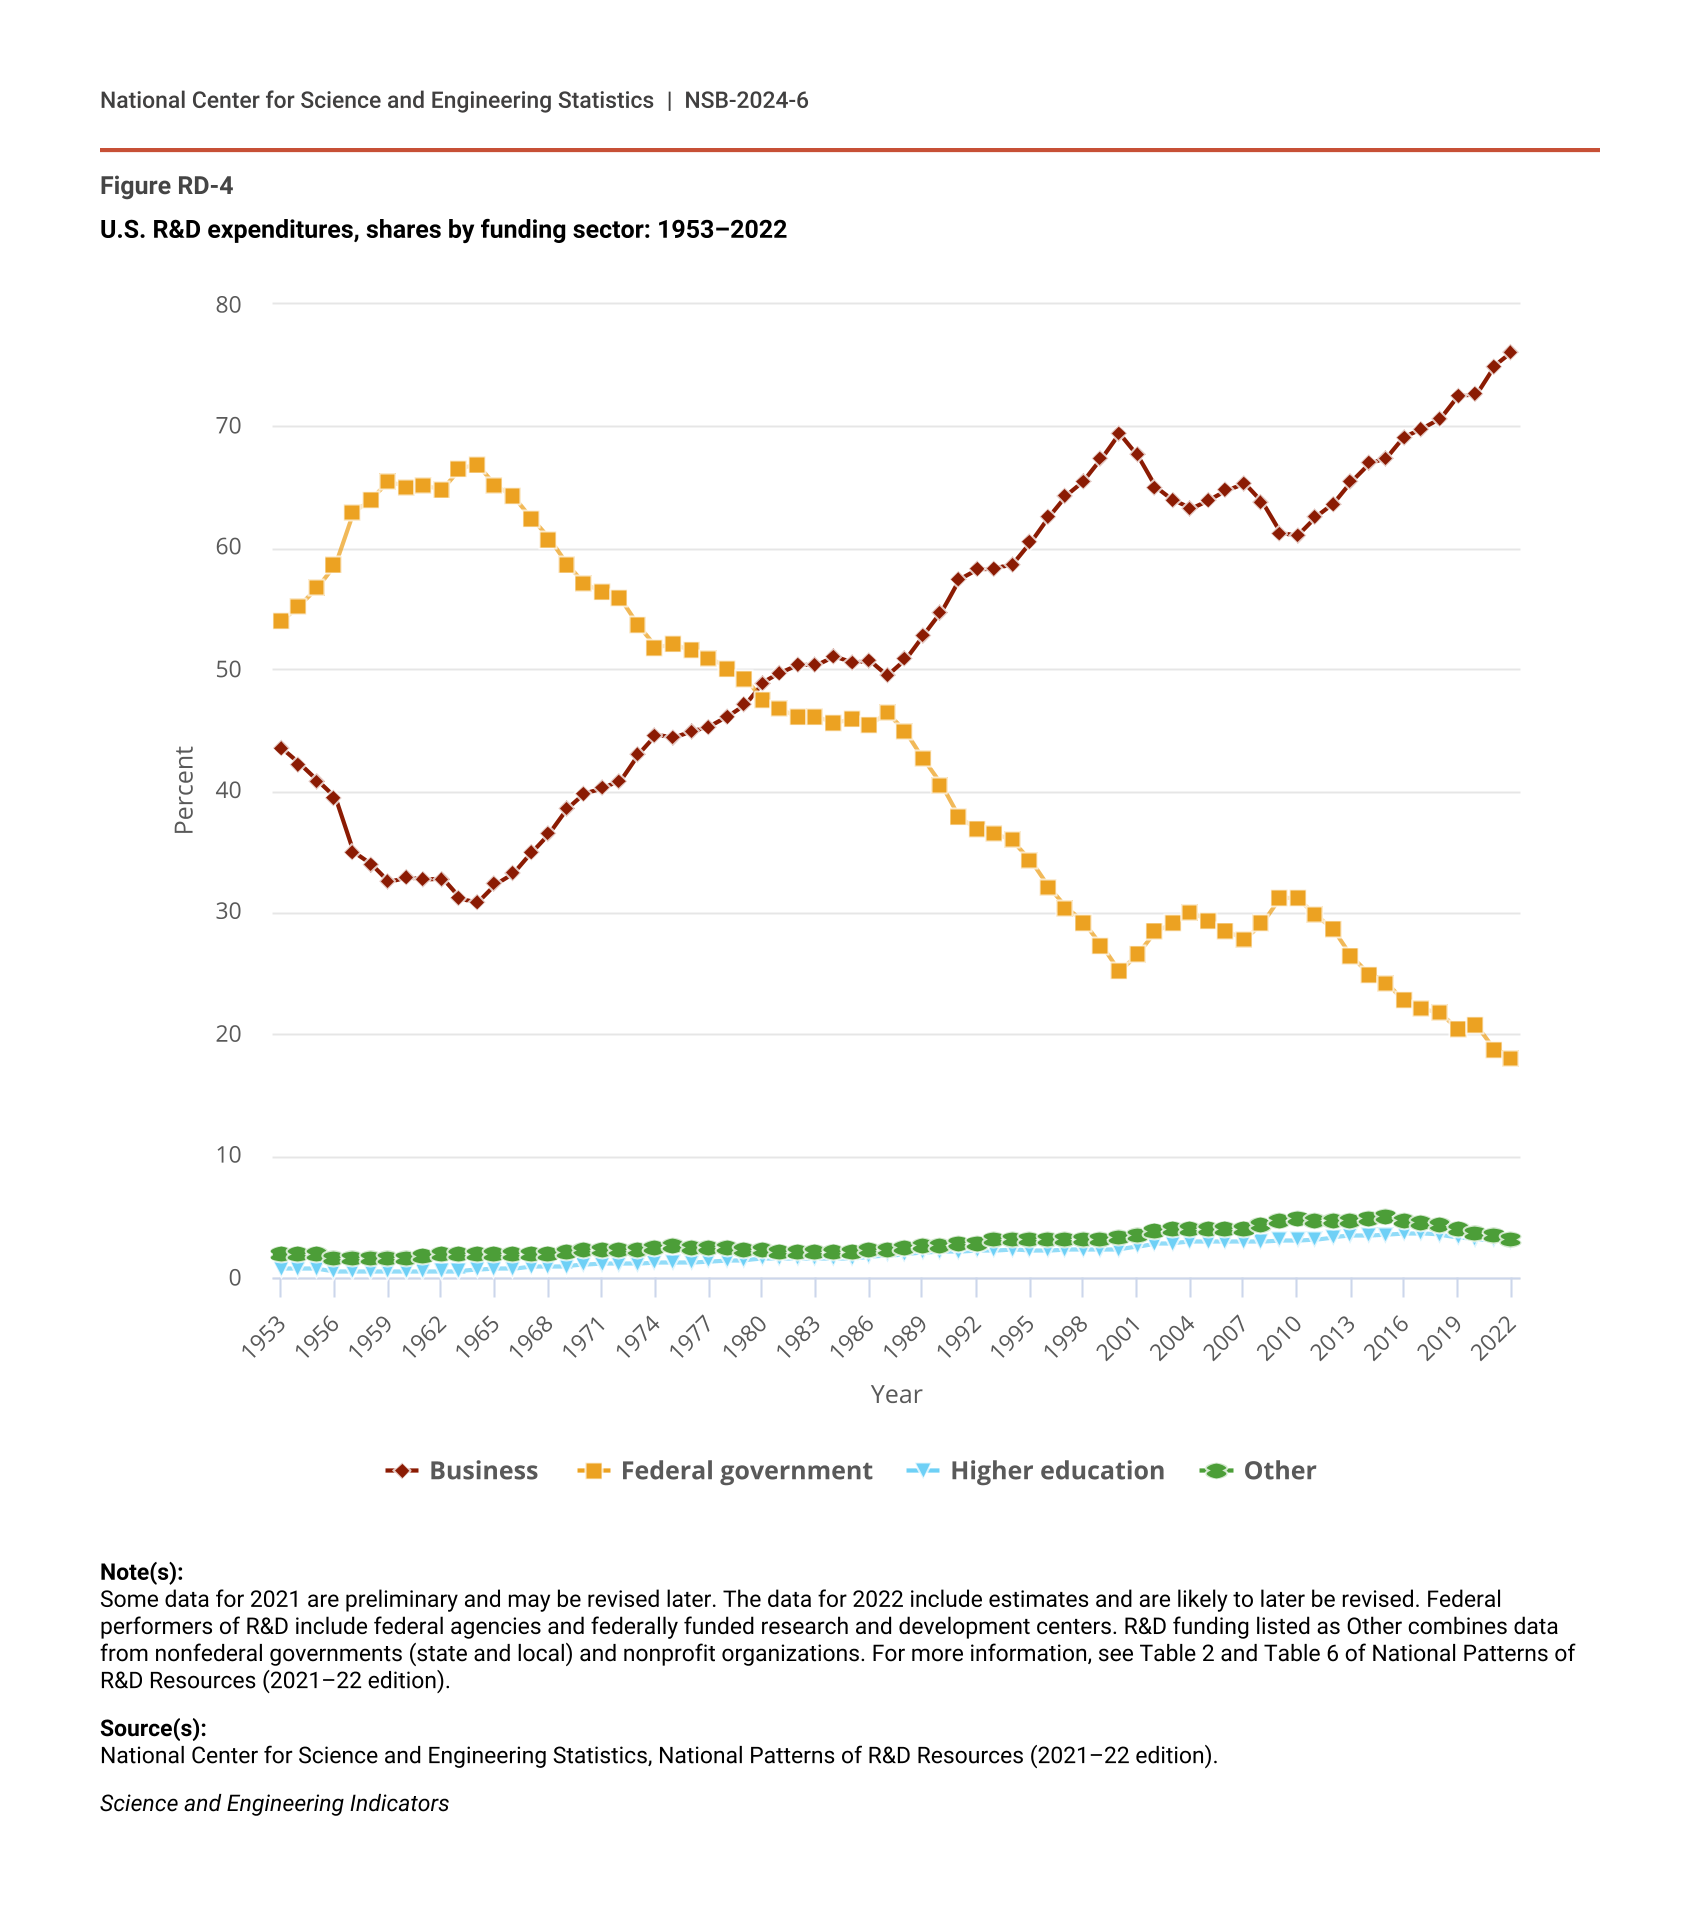
U.S. R&D performance has been on a long-term growth trajectory since the post–World War II era, with a compound annual growth rate (CAGR) of 4% since 1953 in constant dollars (NCSES 2024, Table 1). The top three U.S. R&D-performing sectors are business, higher education, and the federal government (Figure RD-3), with business being the largest-performing sector by far, with a 78% share in 2022. The higher education sector has been the second-largest performer since 2002, remaining slightly ahead of the federal government sector since then. On the other hand, the federal government and business sectors have funded a combined share of over 90% of U.S. R&D since the 1950s, trading first and second place in 1980 when the business sector surpassed the federal government as the largest funder (Figure RD-4).
U.S. R&D expenditures, shares by performing sector: 1953–2022
| Year | Business | Federal government | Higher education | Other |
|---|---|---|---|---|
| 1953 | 70.3 | 22.2 | 5.3 | 2.2 |
| 1954 | 72.4 | 20.1 | 5.4 | 2.2 |
| 1955 | 71.5 | 20.9 | 5.5 | 2.1 |
| 1956 | 73.8 | 19.9 | 4.6 | 1.7 |
| 1957 | 73.9 | 20.0 | 4.4 | 1.7 |
| 1958 | 73.9 | 19.8 | 4.5 | 1.8 |
| 1959 | 73.7 | 19.8 | 4.7 | 1.9 |
| 1960 | 73.2 | 19.8 | 5.1 | 1.9 |
| 1961 | 71.1 | 21.1 | 5.7 | 2.1 |
| 1962 | 70.6 | 20.7 | 6.3 | 2.3 |
| 1963 | 69.7 | 21.2 | 6.7 | 2.3 |
| 1964 | 68.3 | 22.3 | 7.2 | 2.2 |
| 1965 | 68.2 | 21.6 | 7.9 | 2.3 |
| 1966 | 68.8 | 20.5 | 8.2 | 2.4 |
| 1967 | 68.4 | 20.5 | 8.7 | 2.4 |
| 1968 | 69.0 | 19.7 | 8.9 | 2.4 |
| 1969 | 68.6 | 20.1 | 8.8 | 2.5 |
| 1970 | 67.0 | 21.3 | 9.2 | 2.6 |
| 1971 | 66.2 | 21.7 | 9.5 | 2.6 |
| 1972 | 66.1 | 21.6 | 9.6 | 2.7 |
| 1973 | 66.9 | 20.7 | 9.5 | 2.8 |
| 1974 | 66.7 | 20.7 | 9.6 | 3.0 |
| 1975 | 65.8 | 21.3 | 10.0 | 3.0 |
| 1976 | 66.2 | 21.0 | 9.9 | 2.9 |
| 1977 | 66.6 | 20.6 | 10.0 | 2.8 |
| 1978 | 66.1 | 20.8 | 10.3 | 2.8 |
| 1979 | 66.9 | 19.9 | 10.3 | 2.8 |
| 1980 | 68.4 | 18.8 | 10.2 | 2.6 |
| 1981 | 69.8 | 18.0 | 9.8 | 2.5 |
| 1982 | 70.8 | 17.4 | 9.4 | 2.4 |
| 1983 | 70.8 | 17.6 | 9.2 | 2.4 |
| 1984 | 71.5 | 17.1 | 9.0 | 2.5 |
| 1985 | 71.8 | 16.8 | 9.0 | 2.4 |
| 1986 | 71.5 | 16.6 | 9.6 | 2.4 |
| 1987 | 71.4 | 16.1 | 10.1 | 2.4 |
| 1988 | 70.9 | 16.1 | 10.6 | 2.4 |
| 1989 | 70.4 | 16.0 | 11.0 | 2.6 |
| 1990 | 70.7 | 15.5 | 11.1 | 2.7 |
| 1991 | 71.3 | 14.5 | 11.3 | 2.9 |
| 1992 | 70.6 | 14.6 | 11.7 | 3.0 |
| 1993 | 69.7 | 14.8 | 12.4 | 3.2 |
| 1994 | 69.4 | 14.5 | 12.8 | 3.3 |
| 1995 | 70.7 | 13.8 | 12.3 | 3.2 |
| 1996 | 72.1 | 12.7 | 12.0 | 3.1 |
| 1997 | 73.3 | 11.9 | 11.6 | 3.1 |
| 1998 | 74.0 | 11.4 | 11.3 | 3.2 |
| 1999 | 74.5 | 11.0 | 11.2 | 3.3 |
| 2000 | 74.6 | 10.6 | 11.2 | 3.6 |
| 2001 | 72.5 | 11.8 | 11.8 | 3.9 |
| 2002 | 69.8 | 12.8 | 13.2 | 4.3 |
| 2003 | 68.9 | 12.8 | 13.9 | 4.4 |
| 2004 | 68.8 | 12.4 | 14.3 | 4.4 |
| 2005 | 69.5 | 12.2 | 14.0 | 4.3 |
| 2006 | 70.6 | 11.9 | 13.5 | 4.1 |
| 2007 | 71.3 | 11.7 | 13.1 | 4.0 |
| 2008 | 71.8 | 11.3 | 12.9 | 4.1 |
| 2009 | 70.1 | 11.8 | 13.6 | 4.5 |
| 2010 | 68.6 | 12.5 | 14.3 | 4.6 |
| 2011 | 69.0 | 12.6 | 14.1 | 4.3 |
| 2012 | 69.7 | 12.0 | 14.0 | 4.2 |
| 2013 | 71.0 | 11.2 | 13.5 | 4.2 |
| 2014 | 71.6 | 11.1 | 13.1 | 4.2 |
| 2015 | 72.0 | 10.7 | 13.1 | 4.3 |
| 2016 | 72.8 | 9.8 | 13.0 | 4.4 |
| 2017 | 73.3 | 9.5 | 12.8 | 4.4 |
| 2018 | 73.8 | 9.7 | 12.4 | 4.2 |
| 2019 | 74.9 | 9.4 | 11.7 | 4.0 |
| 2020 | 75.8 | 9.1 | 11.3 | 3.9 |
| 2021 | 77.1 | 8.5 | 10.9 | 3.5 |
| 2022 | 78.2 | 8.3 | 10.3 | 3.2 |
Note(s):
Some data for 2021 are preliminary and may be revised later. The data for 2022 include estimates and are likely to later be revised. Federal performers of R&D include federal agencies and federally funded research and development centers. R&D funding listed as Other combines data from nonfederal governments (state and local) and nonprofit organizations. For more information, see Table 2 and Table 6 of National Patterns of R&D Resources (2021–22 edition).
Source(s):
National Center for Science and Engineering Statistics, National Patterns of R&D Resources (2021–22 edition).
Science and Engineering Indicators
U.S. R&D expenditures, shares by funding sector: 1953–2022
| Year | Business | Federal government | Higher education | Other |
|---|---|---|---|---|
| 1953 | 43.5 | 53.9 | 0.7 | 1.8 |
| 1954 | 42.2 | 55.2 | 0.7 | 1.9 |
| 1955 | 40.8 | 56.7 | 0.7 | 1.8 |
| 1956 | 39.4 | 58.6 | 0.5 | 1.5 |
| 1957 | 35.0 | 62.9 | 0.5 | 1.6 |
| 1958 | 34.0 | 63.9 | 0.5 | 1.6 |
| 1959 | 32.5 | 65.4 | 0.5 | 1.6 |
| 1960 | 32.9 | 65.0 | 0.5 | 1.6 |
| 1961 | 32.7 | 65.1 | 0.5 | 1.7 |
| 1962 | 32.8 | 64.8 | 0.5 | 1.9 |
| 1963 | 31.1 | 66.5 | 0.5 | 1.8 |
| 1964 | 30.8 | 66.8 | 0.6 | 1.8 |
| 1965 | 32.3 | 65.1 | 0.7 | 1.8 |
| 1966 | 33.2 | 64.2 | 0.7 | 1.9 |
| 1967 | 34.9 | 62.4 | 0.9 | 1.9 |
| 1968 | 36.5 | 60.7 | 0.9 | 1.9 |
| 1969 | 38.5 | 58.6 | 0.9 | 2.0 |
| 1970 | 39.8 | 57.0 | 1.0 | 2.2 |
| 1971 | 40.2 | 56.4 | 1.1 | 2.3 |
| 1972 | 40.8 | 55.8 | 1.1 | 2.3 |
| 1973 | 43.0 | 53.6 | 1.1 | 2.3 |
| 1974 | 44.6 | 51.8 | 1.2 | 2.4 |
| 1975 | 44.4 | 52.0 | 1.2 | 2.5 |
| 1976 | 44.9 | 51.5 | 1.2 | 2.4 |
| 1977 | 45.3 | 50.9 | 1.3 | 2.4 |
| 1978 | 46.1 | 50.1 | 1.4 | 2.4 |
| 1979 | 47.1 | 49.2 | 1.4 | 2.3 |
| 1980 | 48.9 | 47.4 | 1.5 | 2.2 |
| 1981 | 49.7 | 46.7 | 1.5 | 2.1 |
| 1982 | 50.4 | 46.0 | 1.5 | 2.1 |
| 1983 | 50.3 | 46.1 | 1.5 | 2.1 |
| 1984 | 51.0 | 45.5 | 1.5 | 2.0 |
| 1985 | 50.5 | 45.9 | 1.5 | 2.0 |
| 1986 | 50.7 | 45.4 | 1.7 | 2.2 |
| 1987 | 49.5 | 46.4 | 1.8 | 2.3 |
| 1988 | 50.8 | 44.9 | 1.9 | 2.4 |
| 1989 | 52.8 | 42.6 | 2.0 | 2.5 |
| 1990 | 54.7 | 40.5 | 2.1 | 2.6 |
| 1991 | 57.4 | 37.8 | 2.1 | 2.7 |
| 1992 | 58.2 | 36.8 | 2.2 | 2.8 |
| 1993 | 58.3 | 36.5 | 2.2 | 3.0 |
| 1994 | 58.6 | 35.9 | 2.3 | 3.1 |
| 1995 | 60.4 | 34.3 | 2.2 | 3.1 |
| 1996 | 62.5 | 32.1 | 2.2 | 3.1 |
| 1997 | 64.3 | 30.4 | 2.3 | 3.1 |
| 1998 | 65.5 | 29.2 | 2.3 | 3.0 |
| 1999 | 67.3 | 27.3 | 2.3 | 3.0 |
| 2000 | 69.4 | 25.1 | 2.3 | 3.2 |
| 2001 | 67.6 | 26.5 | 2.5 | 3.4 |
| 2002 | 65.0 | 28.4 | 2.8 | 3.8 |
| 2003 | 63.9 | 29.2 | 2.8 | 4.0 |
| 2004 | 63.2 | 30.0 | 2.9 | 3.9 |
| 2005 | 63.9 | 29.3 | 2.9 | 3.9 |
| 2006 | 64.7 | 28.5 | 2.9 | 3.9 |
| 2007 | 65.3 | 27.8 | 2.9 | 4.0 |
| 2008 | 63.7 | 29.1 | 2.9 | 4.3 |
| 2009 | 61.2 | 31.2 | 3.0 | 4.6 |
| 2010 | 61.0 | 31.1 | 3.0 | 4.8 |
| 2011 | 62.5 | 29.8 | 3.1 | 4.6 |
| 2012 | 63.6 | 28.6 | 3.3 | 4.6 |
| 2013 | 65.4 | 26.4 | 3.4 | 4.7 |
| 2014 | 66.9 | 24.9 | 3.4 | 4.8 |
| 2015 | 67.4 | 24.2 | 3.5 | 4.9 |
| 2016 | 69.1 | 22.7 | 3.6 | 4.7 |
| 2017 | 69.8 | 22.1 | 3.6 | 4.5 |
| 2018 | 70.6 | 21.7 | 3.5 | 4.2 |
| 2019 | 72.5 | 20.4 | 3.3 | 3.9 |
| 2020 | 72.6 | 20.7 | 3.1 | 3.6 |
| 2021 | 74.9 | 18.7 | 3.0 | 3.4 |
| 2022 | 76.0 | 18.0 | 2.9 | 3.1 |
Note(s):
Some data for 2021 are preliminary and may be revised later. The data for 2022 include estimates and are likely to later be revised. Federal performers of R&D include federal agencies and federally funded research and development centers. R&D funding listed as Other combines data from nonfederal governments (state and local) and nonprofit organizations. For more information, see Table 2 and Table 6 of National Patterns of R&D Resources (2021–22 edition).
Source(s):
National Center for Science and Engineering Statistics, National Patterns of R&D Resources (2021–22 edition).
Science and Engineering Indicators
U.S. National R&D Intensity
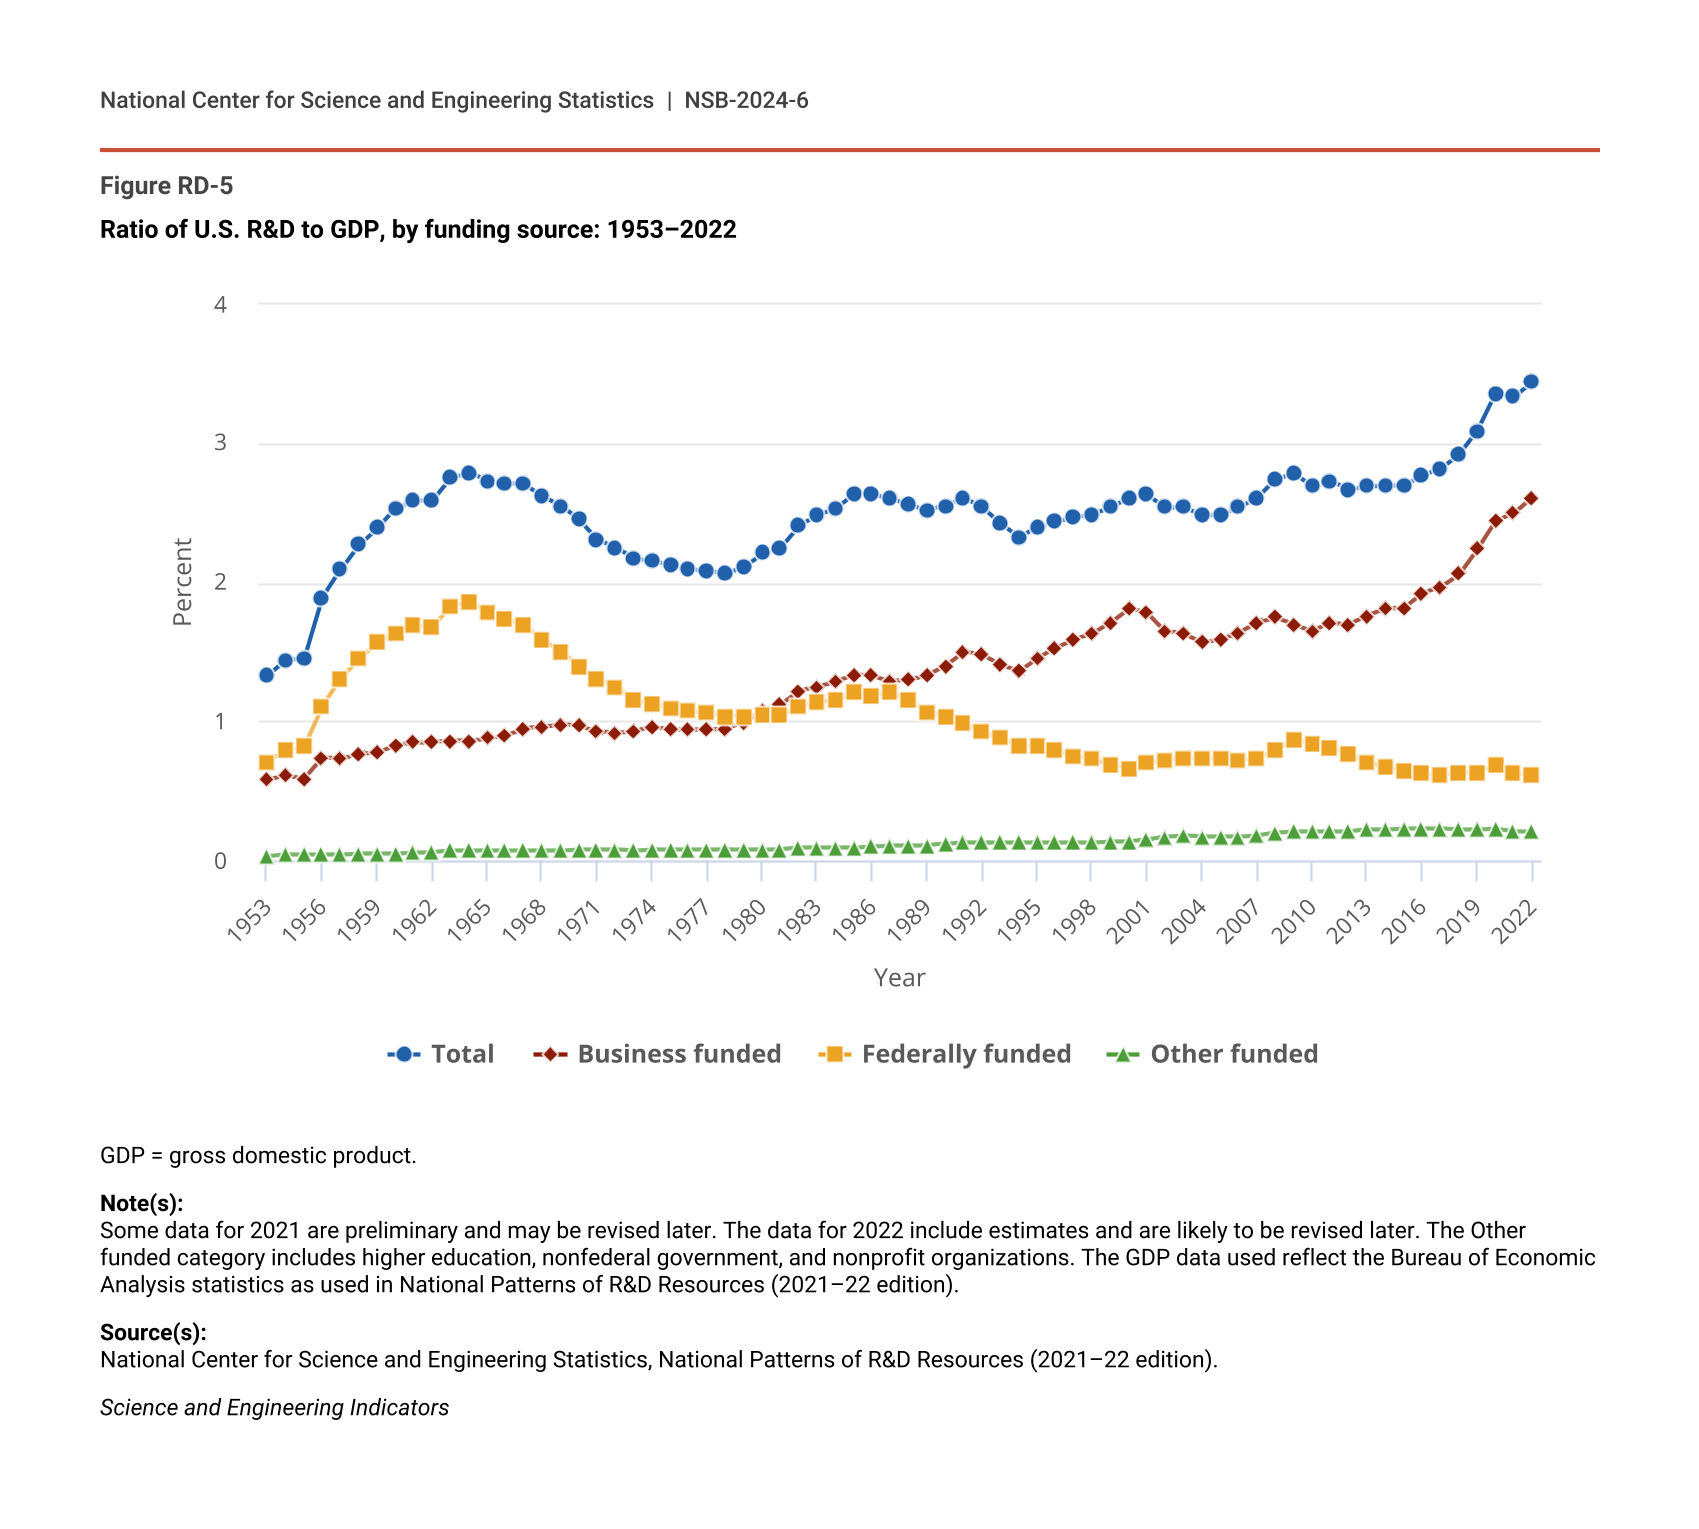
The ratio of R&D expenditures to gross domestic product (GDP) is an intensity measure at the national level used for analysis and policymaking. For the United States, this measure has been above 3.0% since 2019 and was 3.4% in 2022, based on National Patterns statistics (Figure RD-5) (NCSES 2024, Table 1). Based on R&D funding measures, the ratio follows the pattern of relative shares of business versus federal sources (Figure RD-4), with the business R&D-to-GDP ratio being higher than the federal R&D-to-GDP ratio for the last few decades. The federal R&D-to-GDP ratio has declined since the last peak in 2009, associated with funds from the American Recovery and Reinvestment Act (ARRA).
Ratio of U.S. R&D to GDP, by funding source: 1953–2022
| Year | Total | Business funded | Federally funded | Other funded |
|---|---|---|---|---|
| 1953 | 1.33 | 0.58 | 0.71 | 0.03 |
| 1954 | 1.44 | 0.61 | 0.79 | 0.04 |
| 1955 | 1.45 | 0.59 | 0.82 | 0.04 |
| 1956 | 1.89 | 0.74 | 1.11 | 0.04 |
| 1957 | 2.09 | 0.73 | 1.31 | 0.04 |
| 1958 | 2.27 | 0.77 | 1.45 | 0.05 |
| 1959 | 2.39 | 0.78 | 1.57 | 0.05 |
| 1960 | 2.53 | 0.83 | 1.64 | 0.05 |
| 1961 | 2.59 | 0.85 | 1.69 | 0.06 |
| 1962 | 2.59 | 0.85 | 1.68 | 0.06 |
| 1963 | 2.75 | 0.86 | 1.83 | 0.07 |
| 1964 | 2.79 | 0.86 | 1.86 | 0.07 |
| 1965 | 2.73 | 0.88 | 1.78 | 0.07 |
| 1966 | 2.71 | 0.90 | 1.74 | 0.07 |
| 1967 | 2.71 | 0.95 | 1.69 | 0.07 |
| 1968 | 2.62 | 0.96 | 1.59 | 0.07 |
| 1969 | 2.55 | 0.98 | 1.50 | 0.07 |
| 1970 | 2.45 | 0.97 | 1.40 | 0.08 |
| 1971 | 2.31 | 0.93 | 1.31 | 0.08 |
| 1972 | 2.25 | 0.92 | 1.25 | 0.08 |
| 1973 | 2.17 | 0.93 | 1.16 | 0.07 |
| 1974 | 2.16 | 0.96 | 1.12 | 0.08 |
| 1975 | 2.12 | 0.94 | 1.10 | 0.08 |
| 1976 | 2.10 | 0.94 | 1.08 | 0.08 |
| 1977 | 2.08 | 0.94 | 1.06 | 0.08 |
| 1978 | 2.07 | 0.95 | 1.04 | 0.08 |
| 1979 | 2.11 | 0.99 | 1.04 | 0.08 |
| 1980 | 2.21 | 1.08 | 1.05 | 0.08 |
| 1981 | 2.25 | 1.12 | 1.05 | 0.08 |
| 1982 | 2.41 | 1.22 | 1.11 | 0.09 |
| 1983 | 2.48 | 1.25 | 1.14 | 0.09 |
| 1984 | 2.53 | 1.29 | 1.15 | 0.09 |
| 1985 | 2.64 | 1.34 | 1.21 | 0.09 |
| 1986 | 2.63 | 1.33 | 1.19 | 0.10 |
| 1987 | 2.60 | 1.29 | 1.21 | 0.11 |
| 1988 | 2.56 | 1.30 | 1.15 | 0.11 |
| 1989 | 2.52 | 1.33 | 1.07 | 0.11 |
| 1990 | 2.55 | 1.40 | 1.03 | 0.12 |
| 1991 | 2.61 | 1.50 | 0.99 | 0.13 |
| 1992 | 2.54 | 1.48 | 0.93 | 0.13 |
| 1993 | 2.42 | 1.41 | 0.88 | 0.13 |
| 1994 | 2.32 | 1.36 | 0.83 | 0.13 |
| 1995 | 2.40 | 1.45 | 0.82 | 0.13 |
| 1996 | 2.44 | 1.53 | 0.79 | 0.13 |
| 1997 | 2.47 | 1.59 | 0.75 | 0.13 |
| 1998 | 2.49 | 1.63 | 0.73 | 0.13 |
| 1999 | 2.54 | 1.71 | 0.69 | 0.14 |
| 2000 | 2.61 | 1.81 | 0.66 | 0.14 |
| 2001 | 2.63 | 1.78 | 0.70 | 0.15 |
| 2002 | 2.54 | 1.65 | 0.72 | 0.17 |
| 2003 | 2.54 | 1.63 | 0.74 | 0.18 |
| 2004 | 2.48 | 1.57 | 0.74 | 0.17 |
| 2005 | 2.49 | 1.59 | 0.73 | 0.17 |
| 2006 | 2.54 | 1.64 | 0.72 | 0.17 |
| 2007 | 2.61 | 1.71 | 0.73 | 0.18 |
| 2008 | 2.74 | 1.75 | 0.80 | 0.20 |
| 2009 | 2.78 | 1.70 | 0.87 | 0.21 |
| 2010 | 2.70 | 1.65 | 0.84 | 0.21 |
| 2011 | 2.73 | 1.71 | 0.81 | 0.21 |
| 2012 | 2.67 | 1.70 | 0.76 | 0.21 |
| 2013 | 2.69 | 1.76 | 0.71 | 0.22 |
| 2014 | 2.70 | 1.81 | 0.67 | 0.22 |
| 2015 | 2.70 | 1.82 | 0.65 | 0.23 |
| 2016 | 2.77 | 1.92 | 0.63 | 0.23 |
| 2017 | 2.82 | 1.97 | 0.62 | 0.23 |
| 2018 | 2.92 | 2.06 | 0.63 | 0.22 |
| 2019 | 3.09 | 2.24 | 0.63 | 0.22 |
| 2020 | 3.36 | 2.44 | 0.69 | 0.23 |
| 2021 | 3.34 | 2.50 | 0.63 | 0.21 |
| 2022 | 3.44 | 2.61 | 0.62 | 0.21 |
GDP = gross domestic product.
Note(s):
Some data for 2021 are preliminary and may be revised later. The data for 2022 include estimates and are likely to be revised later. The Other funded category includes higher education, nonfederal government, and nonprofit organizations. The GDP data used reflect the Bureau of Economic Analysis statistics as used in National Patterns of R&D Resources (2021–22 edition).
Source(s):
National Center for Science and Engineering Statistics, National Patterns of R&D Resources (2021–22 edition).
Science and Engineering Indicators
R&D-Performing Sectors
This section briefly describes U.S. R&D performance for all major sectors: business, higher education, federal and state government, and nonprofit. Later sections in this thematic report discuss additional details for business and the federal government.
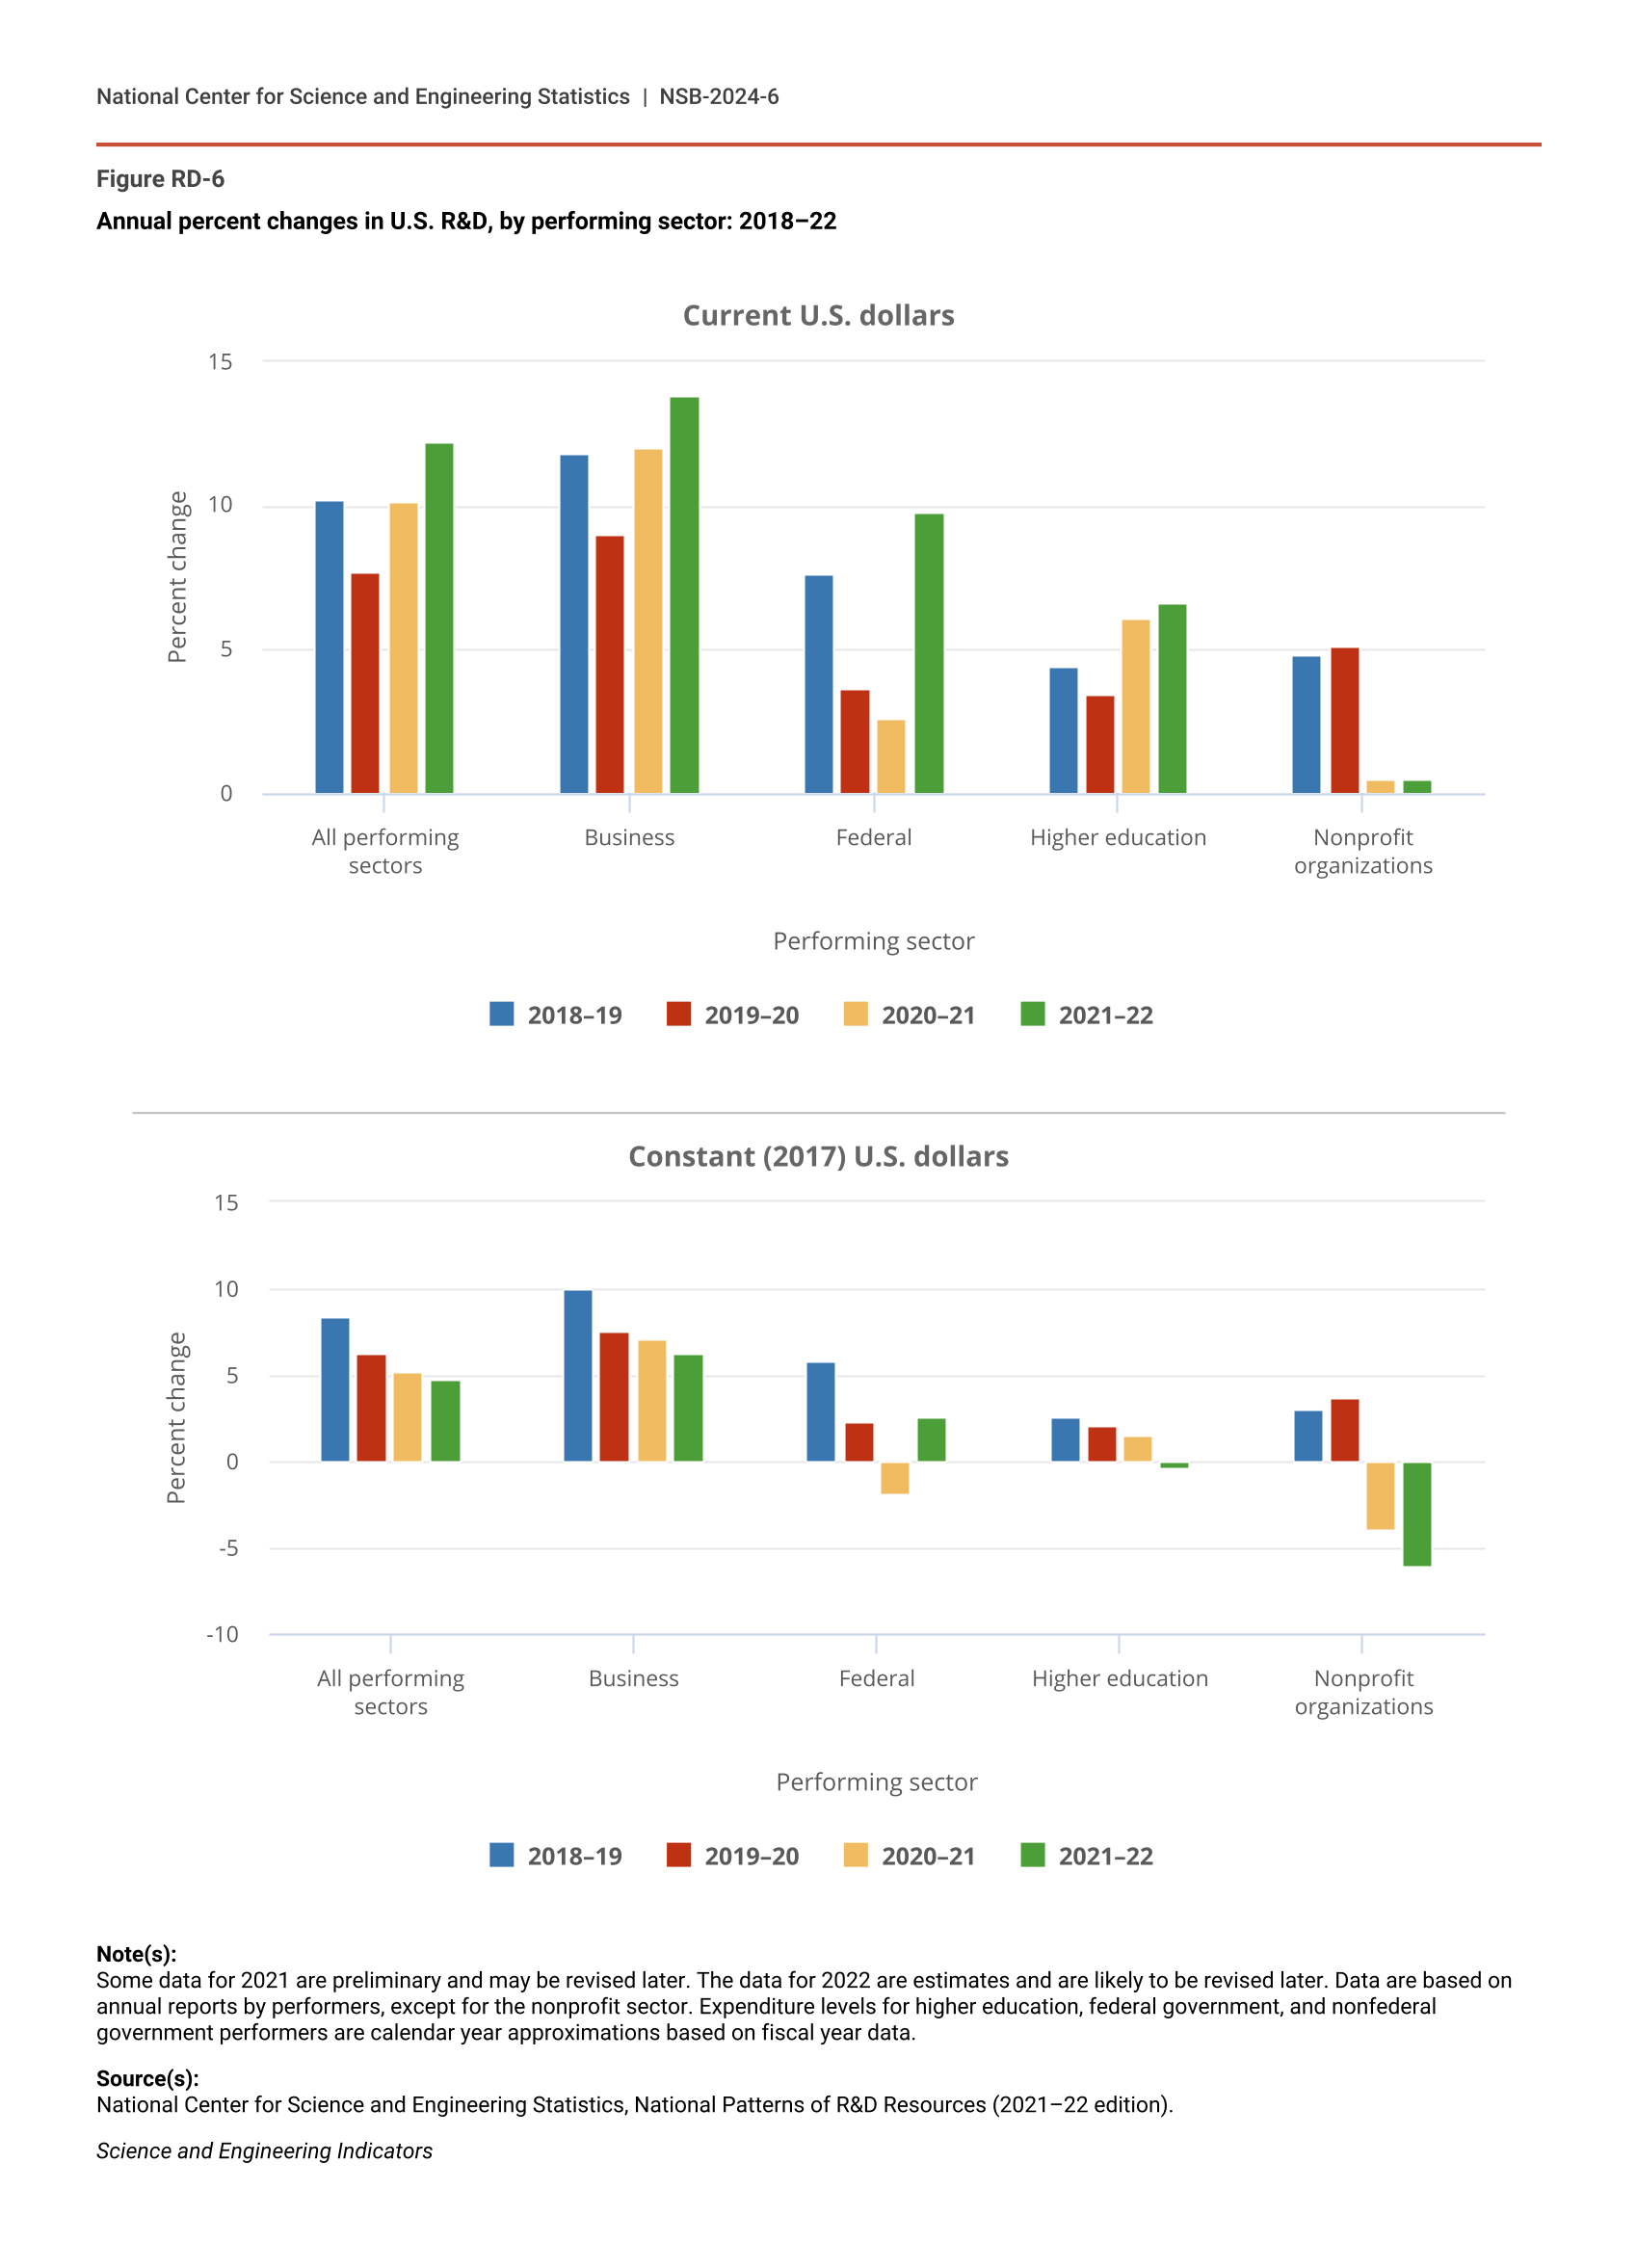
The business sector is by far the largest performer of U.S. R&D. In 2022, this sector performed $692.7 billion in domestic R&D (current U.S. dollars), compared with $608.6 billion in 2021 for a 14% increase (6% in constant dollars) (Figure RD-3, Figure RD-4, Figure RD-6; Table RD-1, Table RD-2). From 2010 to 2022, business R&D grew at an annual CAGR of 5% in constant dollars, the highest rate across all sectors. This growth was driven by several R&D-intensive industries, as discussed later in this thematic report.
Annual percent changes in U.S. R&D, by performing sector: 2018–22
| Performing sector | 2018–19 | 2019–20 | 2020–21 | 2021–22 |
|---|---|---|---|---|
| All performing sectors | 10.2 | 7.7 | 10.1 | 12.2 |
| Business | 11.8 | 9.0 | 12.0 | 13.8 |
| Federal | 7.6 | 3.6 | 2.6 | 9.8 |
| Higher education | 4.4 | 3.4 | 6.1 | 6.6 |
| Nonprofit organizations | 4.8 | 5.1 | 0.5 | 0.5 |
| Performing sector | 2018–19 | 2019–20 | 2020–21 | 2021–22 |
|---|---|---|---|---|
| All performing sectors | 8.4 | 6.3 | 5.2 | 4.8 |
| Business | 10.0 | 7.6 | 7.1 | 6.3 |
| Federal | 5.8 | 2.3 | -1.9 | 2.6 |
| Higher education | 2.6 | 2.1 | 1.5 | -0.4 |
| Nonprofit organizations | 3.0 | 3.7 | -3.9 | -6.1 |
Note(s):
Some data for 2021 are preliminary and may be revised later. The data for 2022 are estimates and are likely to be revised later. Data are based on annual reports by performers, except for the nonprofit sector. Expenditure levels for higher education, federal government, and nonfederal government performers are calendar year approximations based on fiscal year data.
Source(s):
National Center for Science and Engineering Statistics, National Patterns of R&D Resources (2021–22 edition).
Science and Engineering Indicators
U.S. R&D expenditures, by performing sector, source of funds, and type of R&D: 2022
NA = not available; amount not published in source data.
FFRDC = federally funded research and development center.
a Higher education totals for R&D, basic research, applied research, and experimental development are not published in the source data.
Note(s):
The data for 2022 are estimates and are likely to be revised later.
Source(s):
National Center for Science and Engineering Statistics, National Patterns of R&D Resources (2021–22 edition).
Science and Engineering Indicators
The second-largest performer sector was higher education, with $91.4 billion (or a 10% share) in 2022. This represented a 7% change from 2021 in current dollars but stagnated (-0.4% change) in constant dollars. Since 2010, the CAGR was 1.5% in constant dollars.
In 2022, the federal government performed $73.3 billion, or an 8% share of U.S. R&D, compared with $66.8 billion in 2021 for a 10% increase (3% in constant dollars) (Table RD-1, Table RD-2). The 2022 number included $47.0 billion in intramural R&D and $26.4 billion performed by federally funded R&D centers (FFRDCs). Nonfederal government R&D performance in 2022 was estimated to be $697 million, averaging $655 million from 2010 to 2022 in constant dollars. In 2022, it represented about 0.1% of the U.S. total (Table RD-1, Table RD-2).
Nonprofit organizations (excluding higher education institutions, the federal government, and nonfederal governments) performed $27.3 billion of R&D in 2022 ($23.2 billion in constant dollars) (Table RD-1, Table RD-2). Since 2010, the share of the sector has been between 3% and 4%.
Sources of R&D Funding
The business sector is the largest R&D funder in the United States. In 2022, the sector funded $672.9 billion ($570.4 billion in constant 2017 dollars), or 76% of total U.S. R&D (Table RD-2). Virtually all (99%) of the 2022 business R&D funding supported business R&D.
The federal government funded another 18% ($159.8 billion, or $135.5 billion in constant dollars) in 2022 as the second-largest source of funding for U.S. R&D (Figure RD-4; Table RD-1). The largest recipient sectors of federal R&D funding in 2022 were higher education (30%), intramural federal R&D (29%), businesses (17%), and FFRDCs (16%) (NCSES 2024, Table 6). The remaining sectors funded another 6%: higher education (3%), nonprofit organizations (2%), and state and other local or nonfederal government (1%) (Figure RD-4; Table RD-1, Table RD-2).
Type of R&D
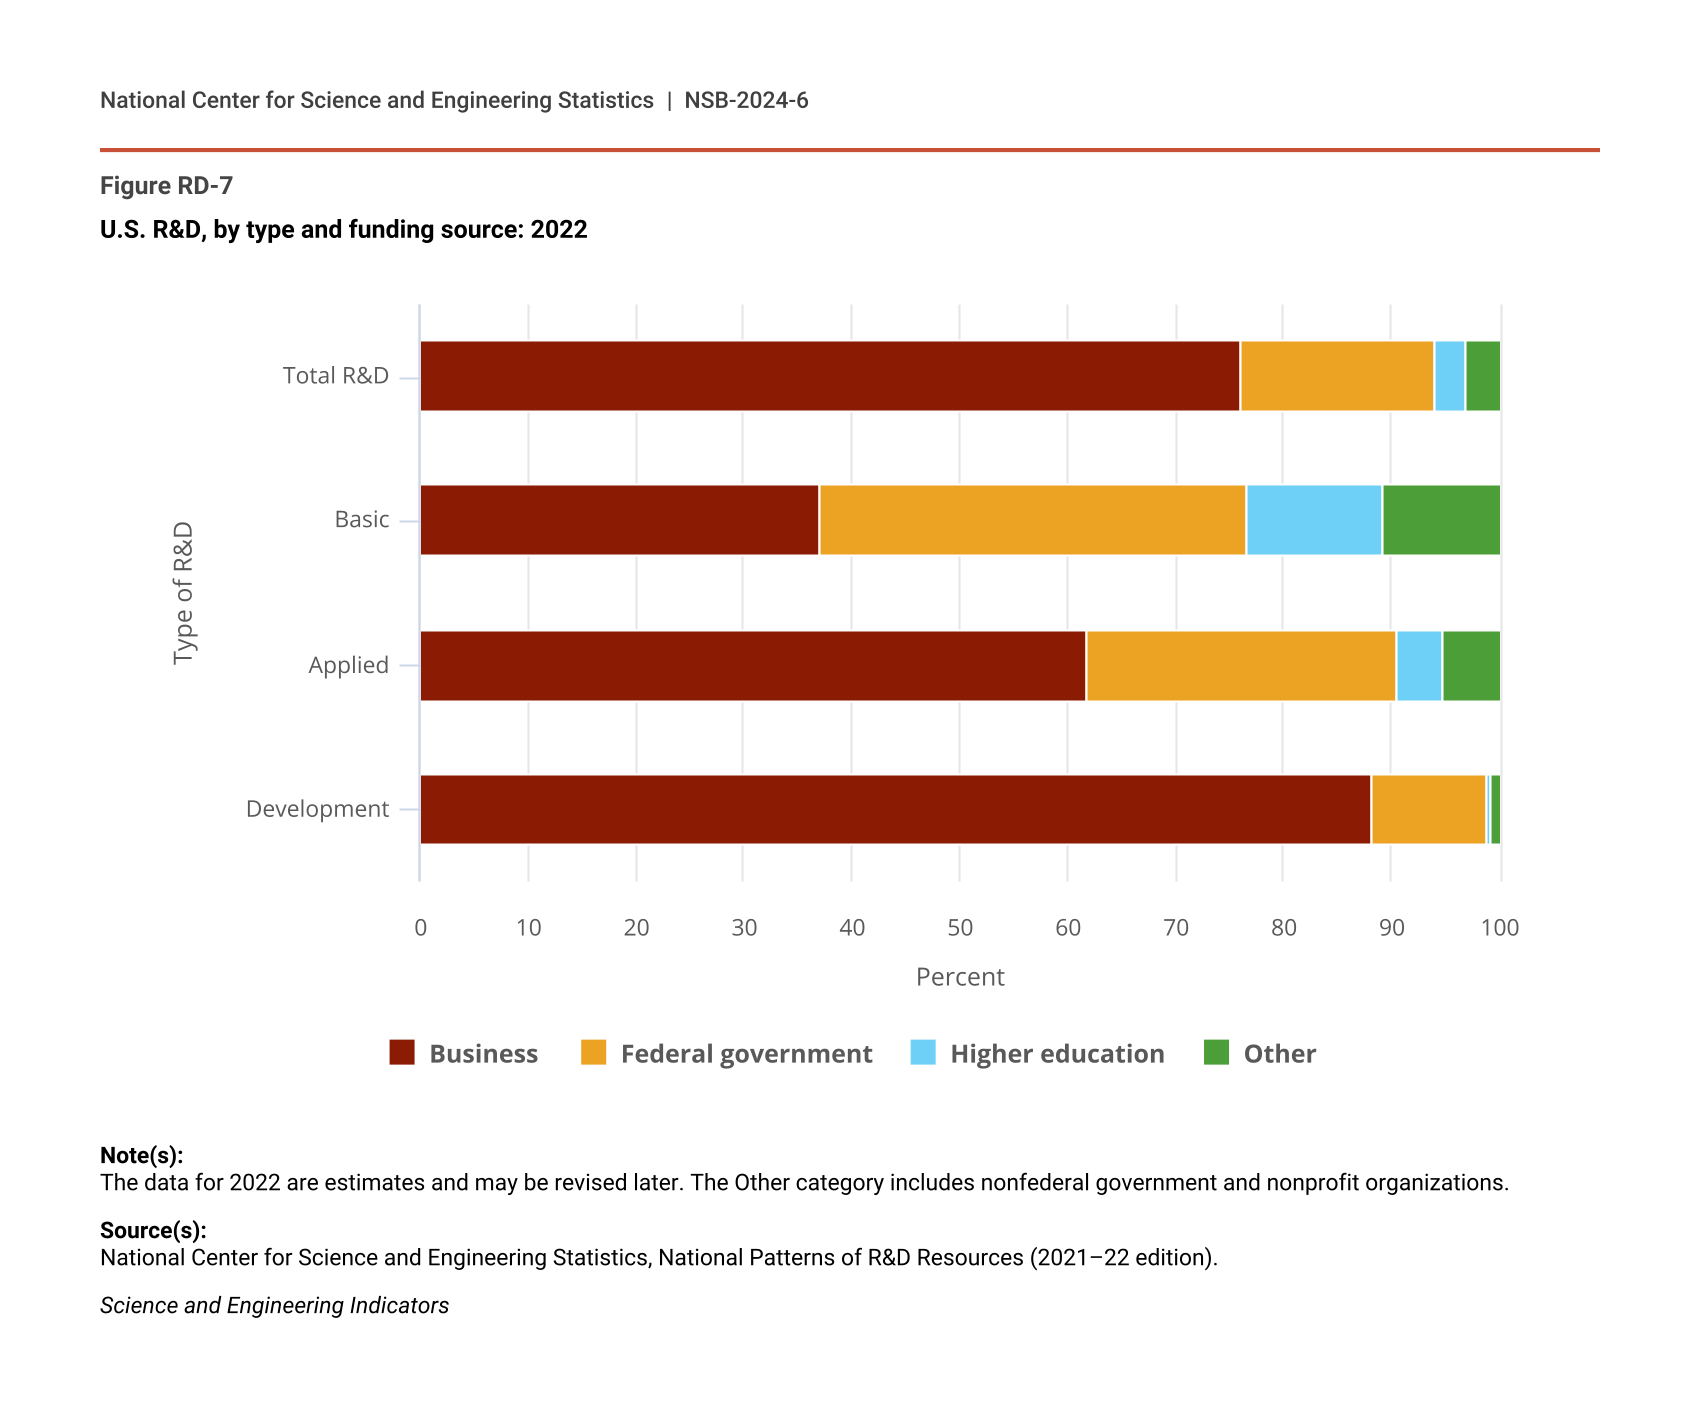
Most R&D performed in the United States is devoted to experimental development (hereafter, development), reflecting the large role of for-profit businesses in funding and performance. In 2022, development activities accounted for $596.2 billion in current dollars, or 67% of the $885.6 billion in total U.S. R&D performance. This was followed by applied research (18%) and basic research (15%). These relative shares have been stable for many years (Table RD-3). The higher education sector performs the largest share of basic research ($57.8 billion of $129.4 billion, or 45%), whereas the business sector performs 63% of applied research ($100.3 billion of $159.9 billion) and 92% of experimental development ($546.1 billion of $596.2 billion) (Table RD-2).
U.S. R&D expenditures, by type of R&D: Selected years, 2000–22
a Some data for 2021 are preliminary and may be revised later.
b The data for 2022 are estimates and are likely to be revised later.
Note(s):
Data throughout the time series reported here are consistently based on the Organisation for Economic Co-operation and Development's Frascati Manual 2015 (OECD 2015) definitions for basic research, applied research, and experimental development. Prior to 2010, however, some changes were introduced in the questionnaires of the sectoral expenditure surveys to improve the accuracy of respondents' classification of their R&D by type. Accordingly, small percentage changes in the historical data may not be meaningful.
Source(s):
National Center for Science and Engineering Statistics, National Patterns of R&D Resources (2021–22 edition).
Science and Engineering Indicators
U.S. businesses funded 88% of development expenditures in 2022, compared with 76% of overall U.S. R&D (Figure RD-7). Businesses also funded the largest share of applied research (62%). The federal government funded the largest proportion of total U.S. basic research (40%), followed by the business sector (37%) and the higher education sector (12%) (Table RD-2). For basic research performed by the higher education sector, 53% was funded by the federal government. For more information on long-term trends by type of R&D and on the higher education sector, see, respectively, Anderson (2024) and the Indicators 2024 report “Academic Research and Development.”
U.S. R&D, by type and funding source: 2022
| Type of R&D | Business | Federal government | Higher education | Other |
|---|---|---|---|---|
| Total R&D | 76.0 | 18.0 | 2.9 | 3.1 |
| Basic | 37.1 | 39.6 | 12.5 | 10.8 |
| Applied | 61.8 | 28.8 | 4.2 | 5.2 |
| Development | 88.2 | 10.5 | 0.4 | 0.8 |
Note(s):
The data for 2022 are estimates and may be revised later. The Other category includes nonfederal government and nonprofit organizations.
Source(s):
National Center for Science and Engineering Statistics, National Patterns of R&D Resources (2021–22 edition).
Science and Engineering Indicators