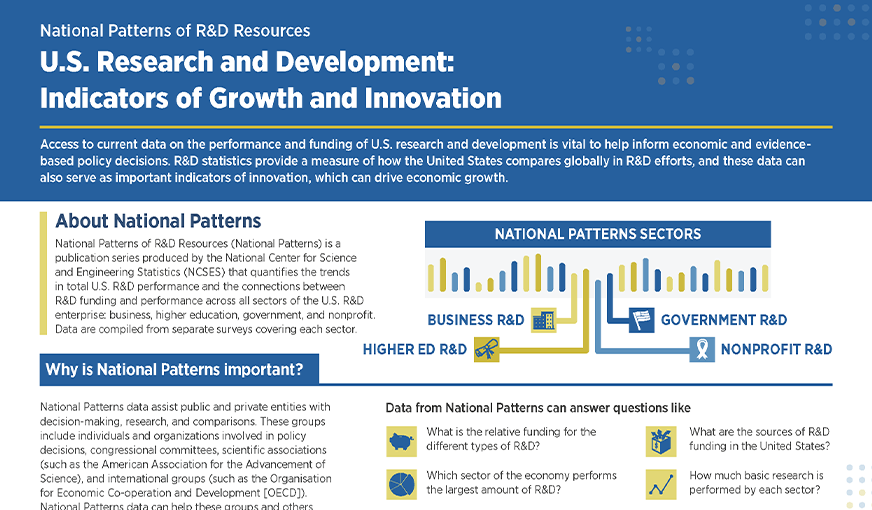
Discover research and development trends in government, industry, higher education, and federal research centers.
This collection presents trend data on the overall research and development effort in the United States. Information includes R&D expenditures by sector of performance, source of funds, character of R&D work, R&D-to-GDP ratios, and international comparisons.
National Patterns of R&D Resources provides current data on the levels and key trends of the performance and funding of R&D in the United States, with comparisons to the historical record (back to 1953). Detail is also provided for the U.S. total and by performer according to the types of R&D conducted (i.e., basic research, applied research, and experimental development).
Report frequency. Reports in this series are typically published annually.
Current reference period. Data from 1953 to 2022 are provided for almost all variables. The data for 2022 are estimates and not previously reported in this series. The data for 2021 are revised from the previous edition (2020–21) of this series. The data for 1953–2020 reflect final survey data but may still include some further (typically minor) revisions.
The National Patterns statistics draw primarily from NCSES’s annual national surveys of the R&D expenditures and funding of the organizations that perform the bulk of U.S. R&D. These organizations include the business sector, federal and nonfederal government, higher education, and nonprofit organizations. Each of these sectors is summarized—including links to other sections of the NCSES website with specifics on survey coverage, variables collected, and survey or sampling implementation—in the sections below.
For 2019–21, annual data on the R&D performed in the domestic United States by the business sector come from the NCSES Business Enterprise Research and Development (BERD) Survey, covering companies with 10 or more employees, and the Annual Business Survey (ABS), covering companies with 9 or fewer employees. BERD and ABS are conducted for NCSES by the Census Bureau in accordance with an agreement between the two agencies. BERD is a sample survey representing for-profit, publicly or privately held companies with 10 or more employees in the United States that performed or funded R&D either domestically or abroad in the manufacturing, mining, utilities, wholesale trade, transportation, information, or services industries. ABS is a sample survey of for-profit employer companies with a U.S. presence engaged in the mining, utilities, construction, manufacturing, wholesale trade, retail trade, or services industries. For the R&D statistics presented in this report, the ABS covers only businesses in the manufacturing, wholesale, and information sectors and the scientific R&D services industries with 1–9 employees.
For 2017 and 2018, the source of the data for companies with 10 or more employees was the Business R&D Survey (BRDS), a predecessor to the BERD Survey, with similar survey characteristics and coverage. ABS was again the source of data on companies with 9 or fewer employees in both of these years.
From 2008 to 2016, the primary source data on business R&D was the NCSES Business R&D and Innovation Survey (BRDIS), a predecessor of both BERD and BRDS. In a salient difference, BRDIS was designed to be nationally representative of all for-profit companies with 5 or more employees. In 2016, a companion survey, the Business R&D and Innovation Survey–Microbusiness (BRDI-M), provided statistics on the R&D activities that year of businesses with 1–4 employees. Prior to the 2016 data year, statistics on the R&D of these “micro” businesses ($4 billion–$5 billion annually) were neither available nor reported in the business R&D totals in National Patterns.
As noted, BERD, BRDS, and BRDIS are related surveys. With regard to R&D, the topical coverage has been similar: R&D performance (in the United States and worldwide); total and R&D employment (in the United States and worldwide); sources of R&D funding; type of R&D activities (basic research, applied research, development); type of R&D costs; R&D capital expenditures; R&D application and technology focus areas; geographic location (within the United States and in foreign countries); sales (in the United States and worldwide); and patenting, licensing, other technology transfer activities. The ABS and BRDI-M surveys provided R&D performance and funding data compatible with those for the larger companies.
For 2007 and earlier years, the data come from the NCSES Survey of Industrial Research and Development (SIRD), the predecessor to BRDIS. SIRD was also a sample survey, conducted annually (1953–2007), that provided national estimates of the R&D performed within the United States by industrial firms, whether U.S. or foreign owned. The SIRD target population consisted (same as BRDIS) of all for-profit companies with 5 or more employees, manufacturing and nonmanufacturing, that performed R&D in the United States. Data on the R&D of companies with fewer than 5 employees were not available throughout this period.
(Note: Data on business intramural R&D capital, as reported by BRDIS and its follow-on surveys, are not included as a component in the National Patterns total of business intramural R&D.)
Federal intramural R&D. Data on the intramural R&D performed by the federal government come from the NCSES Survey of Federal Funds for Research and Development (Federal Funds Survey), which is completed annually by all federal agencies conducting R&D programs (approximately 33 federal departments or independent agencies. The Federal Funds Survey data provide intramural R&D totals as outlays and obligations on a federal fiscal year basis. The obligations data are further detailed by federal agency, performer, type of R&D, geographical area, and field of science and engineering. (Note: Data on federal intramural R&D plant reported by the Federal Funds Survey are not included as a component in the National Patterns total of federal intramural R&D.)
Federally funded R&D centers (FFRDCs). The nation’s FFRDCs are a second venue of federal R&D performance. (For the 2021–22 edition of National Patterns, there were 43 FFRDCs, although the number can change from year to year; NCSES maintains a Master Government List of the population of FFRDCs, which it regularly updates: https://www.nsf.gov/statistics/ffrdclist/.) FFRDCs are R&D-performing organizations administered by an industrial firm, a university, a nonprofit institution, or a consortium but that have funding exclusively or substantially from the federal government. An FFRDC is operated to provide R&D capability to serve an agency’s mission objectives or, in some cases, to provide major facilities at universities for research and training purposes. Since FY 2001, NCSES’s FFRDC Research and Development Survey (known previously as the Survey of Research and Development Expenditures at FFRDCs) has provided annual data (by federal fiscal year) on the R&D expenditures (with additional detail) of all the nation’s FFRDCs. Prior to FY 2001, R&D expenditure data for the FFRDCs were collected as part of the major performer surveys: the Survey of R&D Expenditures at Universities and Colleges (for university-administered FFRDCs), the SIRD (for industry-administered FFRDCs), and the Federal Funds Survey (for nonprofit-administered FFRDCs).
The category of nonfederal government R&D performance included in National Patterns is the intramural R&D of state governments (i.e., the R&D performance of state agency and department employees and the services performed by others in support of internal R&D projects). Data on this state intramural R&D come from the NCSES Survey of State Government Research and Development. This state survey is a comparatively recent NCSES initiative, with the first data year in FY 2006.
In addition, the BERD, FFRDC, and Higher Education Research and Development (HERD) Surveys (see above and below) provide detail on R&D funding by nonfederal governments other than just state governments.
For academic FY 2010 and onward, data on the R&D performed in higher education come from the NCSES HERD Survey. HERD is an annual census of universities and colleges that grant a bachelor’s degree or higher and expend at least $150,000 in separately accounted-for R&D during the fiscal year of these academic institutions. The survey collects information on R&D expenditures by field of research, source of funds, and type of R&D, as well as on head counts of R&D personnel.
The HERD Survey replaced the earlier Survey of Research and Development Expenditures at Universities and Colleges. For data years FY 2009 and earlier, the Universities and Colleges Survey provides the data on academic R&D.
This sector refers to R&D performed in the United States by nonprofit organizations other than government or academia. The most recent data on nonprofit organization R&D come from the NCSES FYs 2021–22 Nonprofit Research Activities (NPRA) module of the Annual Business Survey and the 2016 NPRA Survey. Data for 2017–19 are estimated based on the 2016 NPRA Survey and NPRA 2021 Survey revisions to 2020 data. The 1998–2015 data for nonprofit organization R&D funded by the federal government come from the NCSES annual Survey of Federal Funds for Research and Development; data for nonprofit organization R&D funded by businesses and by the nonprofit sector itself for that period are estimated based on parameters from the 1996–97 Survey of Research and Development Funding and Performance by Nonprofit Organizations, which was also conducted in 1973. Data for years prior to 1973 come from earlier National Patterns reports (which reflect, in part, surveys in 1957 and 1960).
Some of the trend analyses in National Patterns draw on National Income and Product Accounts data (e.g., U.S. gross domestic product [GDP], state domestic product) assembled by the U.S. Bureau of Economic Activity (BEA). For details on this U.S. economic data, see https://www.bea.gov/data/gdp.
In keeping with international conventions, U.S. R&D expenditures in current dollars are adjusted for inflation based on BEA’s implicit GDP price deflator.
The National Patterns statistical picture of the U.S. R&D system is developed from integration of primary data from NCSES sectoral R&D surveys. Adjustments to the primary data are needed in some cases to increase their consistency. Furthermore, preliminary or otherwise estimated values may be used (and later revised) where final data from one or more of the surveys are not yet available but can reasonably be approximated.
Key features of the methodology include the following:
Additional details on methodology and technical issues pertaining to specific variables are provided in the notes on each table. For further information about compiling the National Patterns statistics, contact the report’s author.
R&D performers and funders. The U.S. R&D system consists of the R&D activities of differing performers and sources of funding for these activities. The main categories of R&D performers tracked by NCSES are businesses; federal agencies; FFRDCs (administered by businesses, universities, or nonprofit organizations); nonfederal government agencies (specifically those of the 50 states and the District of Columbia); higher education; and nonprofit organizations. For R&D funding, the main categories are businesses; the federal government; nonfederal government (state, regional, local); higher education; and nonprofit organizations. Organizations that perform R&D often receive significant levels of outside funding; R&D funders may also be significant performers.
Type of R&D. As defined by the Organisation for Economic Co-operation and Development’s Frascati Manual (in seven editions since the early 1960s), R&D spans three main types of activities:
Basic research: Experimental or theoretical work undertaken primarily to acquire new knowledge of the underlying foundations of phenomena and observable facts, without any particular application or use in view.
Applied research: Original investigation undertaken in order to acquire new knowledge. It is, however, directed primarily towards a specific, practical aim or objective.
Experimental development: Systematic work, drawing on knowledge gained from research and practical experience and producing additional knowledge, which is directed to producing new products or processes or improving existing products or processes.
National Patterns of R&D Resources provides current data on the levels and key trends of the performance and funding of research and experimental development (R&D) in the United States. These detailed statistical tables supplement analytical InfoBriefs available at https://ncses.nsf.gov/data-collections/national-patterns/, from the National Center for Science and Engineering Statistics (NCSES).
The National Patterns statistics draw primarily from NCSES’s national surveys of the R&D expenditures and funding of the organizations that perform the bulk of U.S. R&D—including businesses, federal and nonfederal government, higher education, and nonprofit organizations. Additional details on levels and trends are provided by type of R&D performed (i.e., basic research, applied research, and experimental development). The National Patterns data are reported in both current and inflation-adjusted dollars. These data along with gross domestic product (GDP), also reported in current and inflation-adjusted dollars, are presented back to 1953 to facilitate trend analysis and comparison of growth in R&D to overall U.S. economic growth.
The data for 2022 are estimates based mainly on early findings from the 2021 sectoral R&D expenditure surveys and evident recent trends. Data for 2021 were included in the previous edition (2020–21) of this report series but are now revised to reflect new, nearly final input from the sectoral surveys. The numbers for 1953–2020 reflect largely final survey data and, in general, exhibit minor revisions (if any).
The statistical tables are arranged to exhibit the U.S. R&D data from two differing perspectives. The first perspective (tables 2–5) is by type of R&D performer, with detailed breakouts by source of funds. The second perspective (tables 6–9) is by source of funds, with detailed breakouts by type of performer. The data in both groups of tables sum to the same overall U.S. R&D performance totals. Table 1 provides data mainly on the U.S. R&D-to-gross domestic product (GDP) ratio and its components. Table 10 presents state-level breakdowns of the U.S. R&D totals, by performing sector and source of funds, for 2021.
For trend comparisons, use only the historical data from the most recent publication, which incorporates the latest revisions and corrections. Do not use data published earlier.
Gary Anderson of the National Center for Science and Engineering Statistics (NCSES) developed and oversaw preparation of this report under the leadership of Emilda B. Rivers, NCSES Director; Christina Freyman, NCSES Deputy Director; and John Finamore, NCSES Chief Statistician. Jock Black (NCSES) reviewed the report.
National Center for Science and Engineering Statistics (NCSES). 2024. National Patterns of R&D Resources: 2021–22 Data Update. NSF 24-318. Alexandria, VA: National Science Foundation. Available at https://ncses.nsf.gov/data-collections/national-patterns/2021-2022.
For additional information about this data collection or the methodology, contact