 An official website of the United States government

Analysis of Federal Funding for Research and Development in 2022: Basic Research
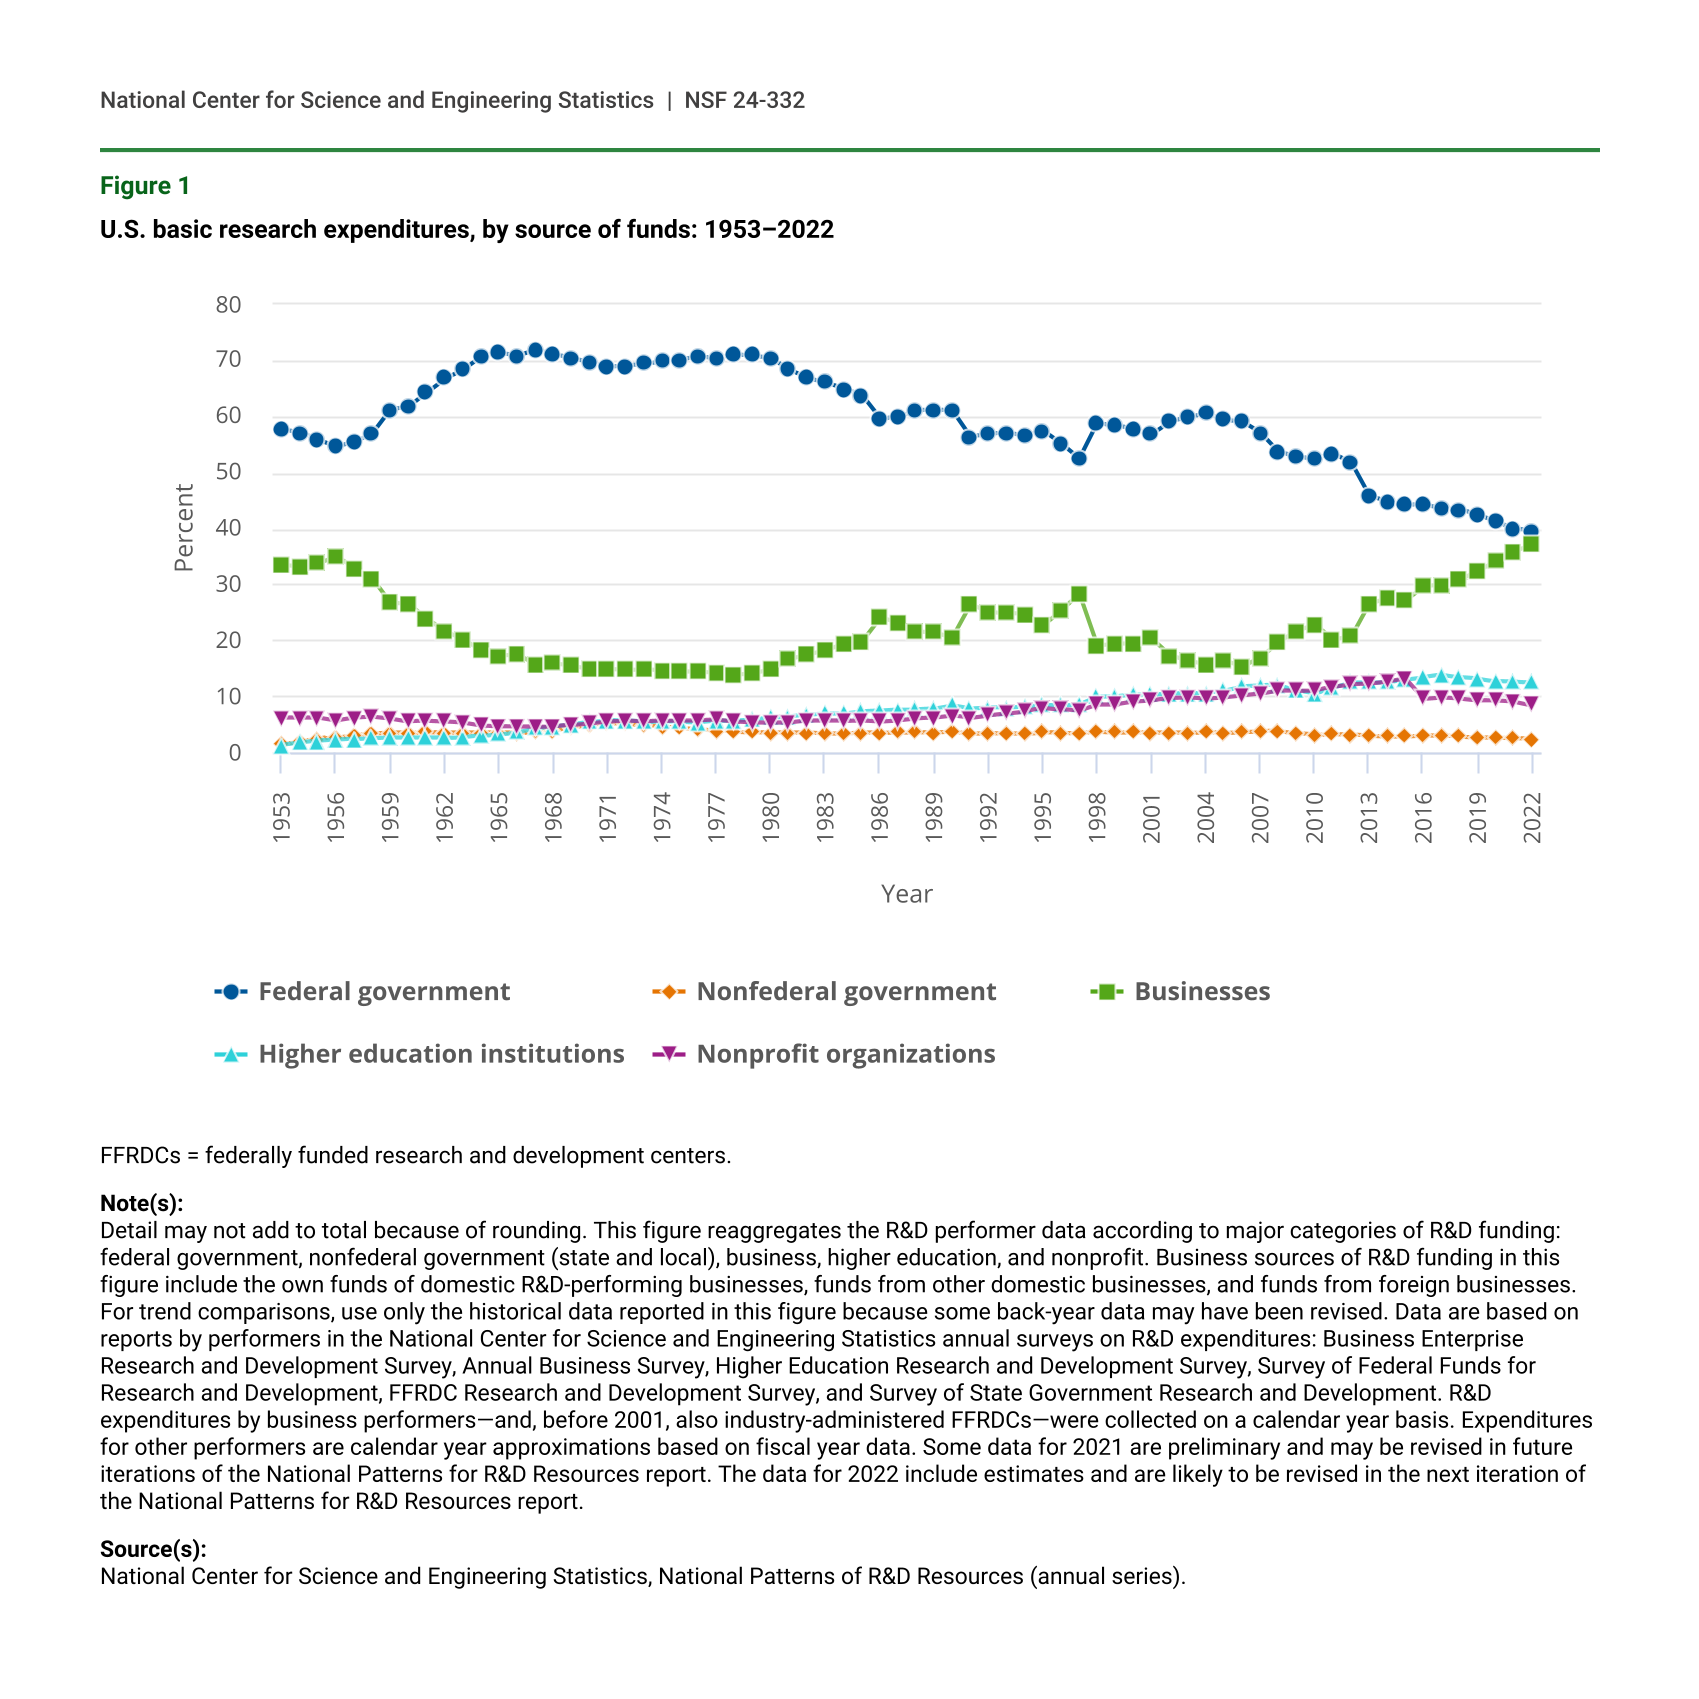
Funding for U.S. domestic research and development (R&D) performance, estimated to reach $885.6 billion in 2022, comes from a number of sectors, including businesses, government, higher education, and nonprofit organizations. The National Patterns of R&D Resources (National Patterns) publication series compiles data from surveys of organizations that perform R&D and documents trends in U.S. R&D funding and performance. In the 1980s, the business sector passed the federal government as the largest overall funder of domestic R&D performance. The most recent National Patterns publication made it clear that a similar milestone is approaching with respect to funding of basic research. At the turn of the century, the federal government funded about 60% of basic research. In 2022, the federal government is estimated to fund 40% of basic research (figure 1). As the share of federal funding for basic research has decreased, the share funded by business has increased. National Patterns estimates show that in 2022 40% and 37% of basic research is funded by the federal government and businesses, respectively.
U.S. basic research expenditures, by source of funds: 1953–2022
| Year | Federal government | Nonfederal government | Businesses | Higher education institutions | Nonprofit organizations |
|---|---|---|---|---|---|
| 1953 | 57.7 | 1.4 | 33.5 | 1.3 | 6.1 |
| 1954 | 57.1 | 1.9 | 33.2 | 1.7 | 6.1 |
| 1955 | 55.8 | 2.4 | 33.7 | 2.0 | 6.1 |
| 1956 | 54.6 | 2.6 | 34.9 | 2.2 | 5.6 |
| 1957 | 55.5 | 3.0 | 32.9 | 2.4 | 6.1 |
| 1958 | 57.0 | 3.3 | 31.0 | 2.5 | 6.3 |
| 1959 | 61.2 | 3.5 | 26.7 | 2.6 | 6.0 |
| 1960 | 61.7 | 3.5 | 26.6 | 2.6 | 5.5 |
| 1961 | 64.3 | 3.6 | 23.9 | 2.6 | 5.6 |
| 1962 | 66.8 | 3.5 | 21.6 | 2.6 | 5.5 |
| 1963 | 68.4 | 3.5 | 20.1 | 2.7 | 5.3 |
| 1964 | 70.7 | 3.5 | 18.1 | 2.9 | 4.8 |
| 1965 | 71.3 | 3.5 | 17.3 | 3.2 | 4.6 |
| 1966 | 70.8 | 3.5 | 17.5 | 3.6 | 4.5 |
| 1967 | 72.0 | 3.6 | 15.6 | 4.3 | 4.5 |
| 1968 | 71.0 | 3.9 | 15.9 | 4.6 | 4.6 |
| 1969 | 70.4 | 4.4 | 15.5 | 4.9 | 4.9 |
| 1970 | 69.6 | 5.0 | 14.8 | 5.4 | 5.2 |
| 1971 | 68.8 | 5.2 | 14.8 | 5.7 | 5.5 |
| 1972 | 69.0 | 5.1 | 14.7 | 5.6 | 5.7 |
| 1973 | 69.4 | 4.8 | 14.8 | 5.4 | 5.5 |
| 1974 | 69.8 | 4.5 | 14.5 | 5.5 | 5.6 |
| 1975 | 70.1 | 4.4 | 14.4 | 5.4 | 5.7 |
| 1976 | 70.6 | 4.1 | 14.4 | 5.3 | 5.7 |
| 1977 | 70.5 | 3.9 | 14.3 | 5.6 | 5.8 |
| 1978 | 71.1 | 3.7 | 13.9 | 5.7 | 5.5 |
| 1979 | 70.9 | 3.6 | 14.1 | 5.9 | 5.3 |
| 1980 | 70.3 | 3.5 | 14.7 | 6.2 | 5.3 |
| 1981 | 68.3 | 3.5 | 16.6 | 6.4 | 5.3 |
| 1982 | 66.9 | 3.5 | 17.4 | 6.7 | 5.6 |
| 1983 | 66.1 | 3.3 | 18.1 | 6.9 | 5.6 |
| 1984 | 64.9 | 3.3 | 19.4 | 6.9 | 5.6 |
| 1985 | 63.8 | 3.5 | 19.8 | 7.3 | 5.7 |
| 1986 | 59.6 | 3.5 | 24.1 | 7.4 | 5.5 |
| 1987 | 60.0 | 3.6 | 23.2 | 7.6 | 5.7 |
| 1988 | 61.1 | 3.6 | 21.6 | 7.7 | 6.0 |
| 1989 | 61.2 | 3.5 | 21.4 | 7.8 | 6.1 |
| 1990 | 61.0 | 3.7 | 20.5 | 8.4 | 6.5 |
| 1991 | 56.3 | 3.4 | 26.4 | 7.8 | 6.1 |
| 1992 | 56.9 | 3.4 | 25.1 | 8.0 | 6.6 |
| 1993 | 57.1 | 3.3 | 24.8 | 7.9 | 6.9 |
| 1994 | 56.6 | 3.3 | 24.7 | 8.1 | 7.3 |
| 1995 | 57.4 | 3.6 | 22.7 | 8.5 | 7.9 |
| 1996 | 55.1 | 3.5 | 25.3 | 8.4 | 7.7 |
| 1997 | 52.4 | 3.4 | 28.3 | 8.6 | 7.4 |
| 1998 | 58.8 | 3.7 | 19.0 | 10.0 | 8.5 |
| 1999 | 58.4 | 3.6 | 19.4 | 10.0 | 8.5 |
| 2000 | 57.8 | 3.6 | 19.4 | 10.3 | 9.0 |
| 2001 | 56.8 | 3.5 | 20.3 | 10.3 | 9.2 |
| 2002 | 59.0 | 3.5 | 17.3 | 10.5 | 9.7 |
| 2003 | 59.9 | 3.5 | 16.4 | 10.4 | 9.8 |
| 2004 | 60.5 | 3.6 | 15.7 | 10.6 | 9.6 |
| 2005 | 59.4 | 3.5 | 16.4 | 11.0 | 9.8 |
| 2006 | 59.1 | 3.6 | 15.3 | 11.8 | 10.1 |
| 2007 | 57.1 | 3.7 | 16.9 | 11.9 | 10.4 |
| 2008 | 53.7 | 3.8 | 19.6 | 12.0 | 11.0 |
| 2009 | 52.8 | 3.4 | 21.7 | 11.1 | 11.0 |
| 2010 | 52.5 | 3.1 | 22.8 | 10.5 | 11.1 |
| 2011 | 53.3 | 3.2 | 20.2 | 11.6 | 11.7 |
| 2012 | 51.7 | 3.1 | 20.7 | 12.5 | 12.1 |
| 2013 | 45.8 | 2.9 | 26.6 | 12.5 | 12.2 |
| 2014 | 44.7 | 2.8 | 27.5 | 12.5 | 12.6 |
| 2015 | 44.1 | 2.8 | 27.0 | 13.0 | 13.1 |
| 2016 | 44.4 | 3.0 | 29.6 | 13.4 | 9.5 |
| 2017 | 43.6 | 3.0 | 29.9 | 13.8 | 9.8 |
| 2018 | 43.3 | 2.8 | 30.8 | 13.4 | 9.6 |
| 2019 | 42.4 | 2.7 | 32.4 | 13.1 | 9.3 |
| 2020 | 41.2 | 2.7 | 34.3 | 12.7 | 9.2 |
| 2021 | 40.0 | 2.5 | 35.9 | 12.6 | 9.0 |
| 2022 | 39.6 | 2.4 | 37.1 | 12.5 | 8.4 |
FFRDCs = federally funded research and development centers.
Note(s):
Detail may not add to total because of rounding. This figure reaggregates the R&D performer data according to major categories of R&D funding: federal government, nonfederal government (state and local), business, higher education, and nonprofit. Business sources of R&D funding in this figure include the own funds of domestic R&D-performing businesses, funds from other domestic businesses, and funds from foreign businesses. For trend comparisons, use only the historical data reported in this figure because some back-year data may have been revised. Data are based on reports by performers in the National Center for Science and Engineering Statistics annual surveys on R&D expenditures: Business Enterprise Research and Development Survey, Annual Business Survey, Higher Education Research and Development Survey, Survey of Federal Funds for Research and Development, FFRDC Research and Development Survey, and Survey of State Government Research and Development. R&D expenditures by business performers—and, before 2001, also industry-administered FFRDCs—were collected on a calendar year basis. Expenditures for other performers are calendar year approximations based on fiscal year data. Some data for 2021 are preliminary and may be revised in future iterations of the National Patterns for R&D Resources report. The data for 2022 include estimates and are likely to be revised in the next iteration of the National Patterns for R&D Resources report.
Source(s):
National Center for Science and Engineering Statistics, National Patterns of R&D Resources (annual series).
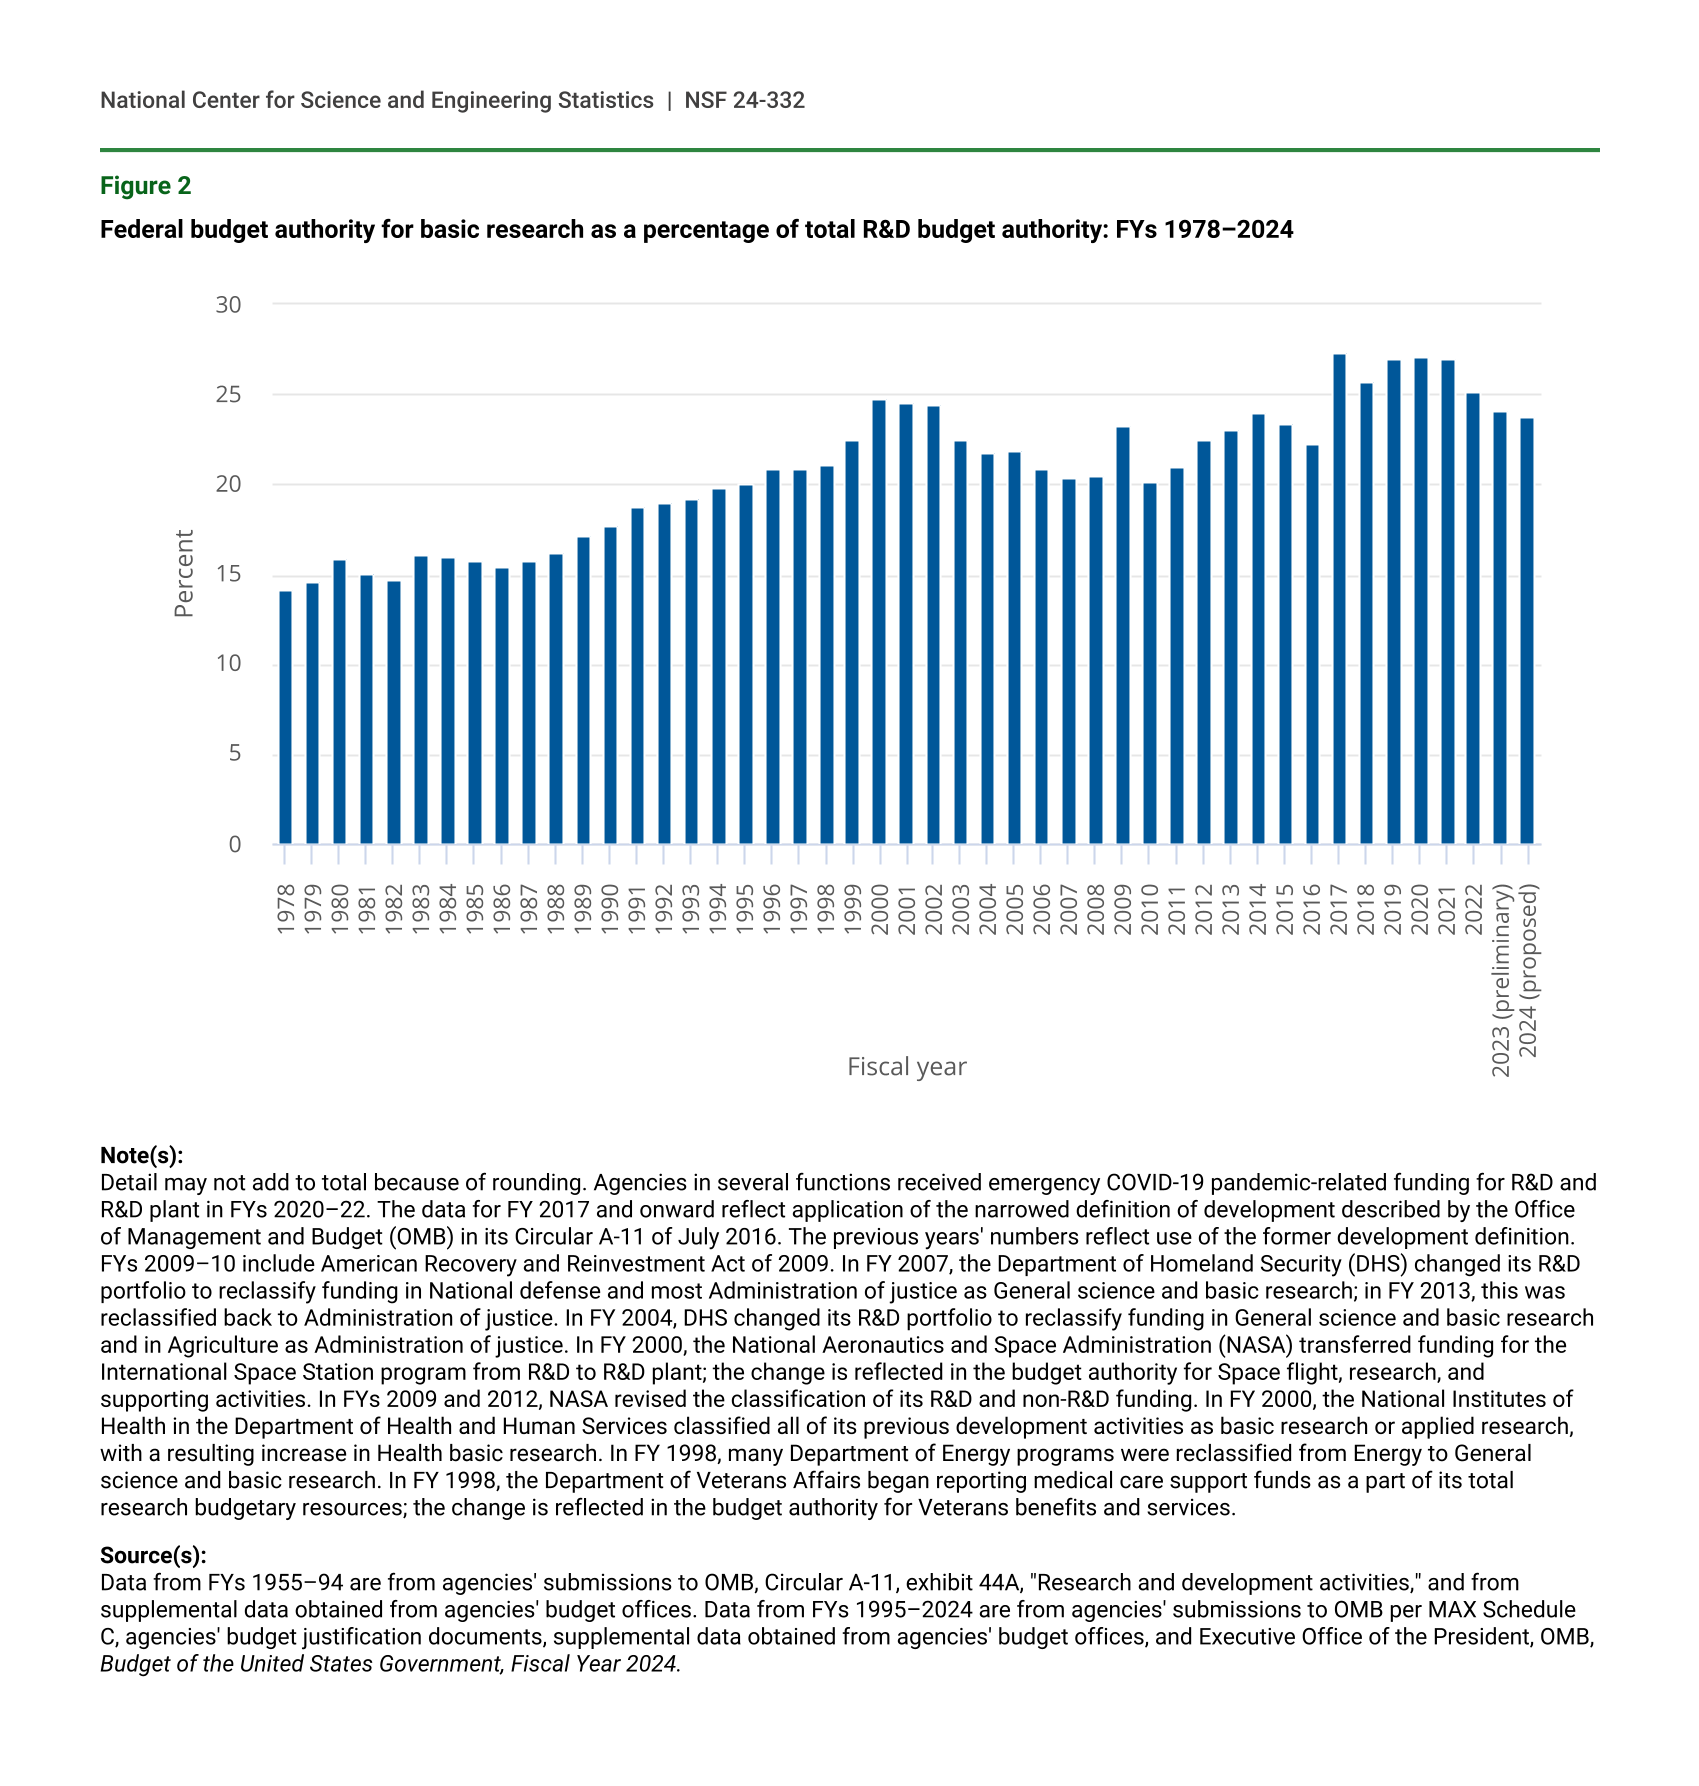
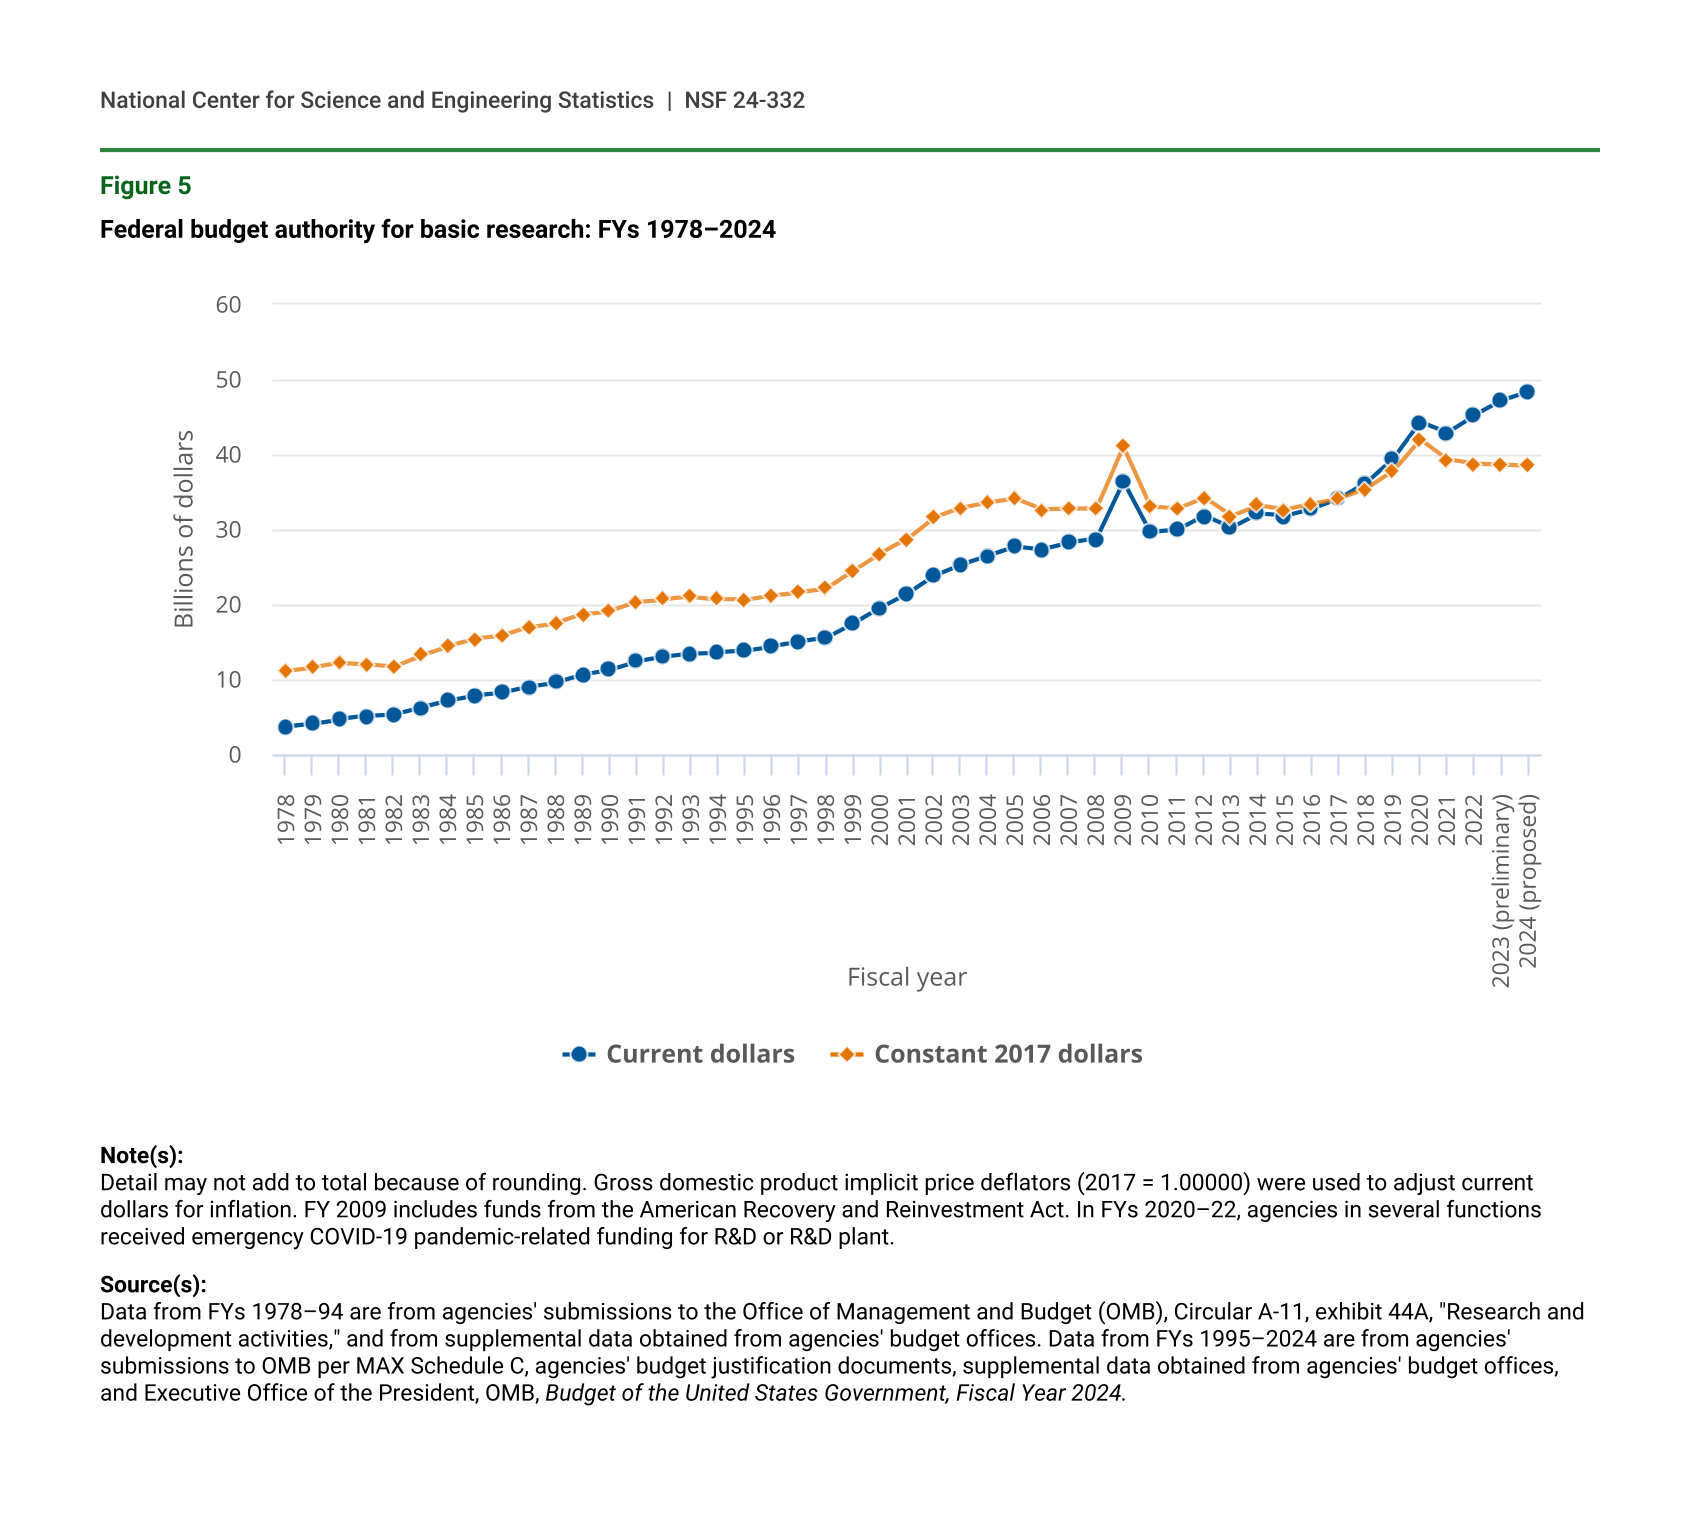
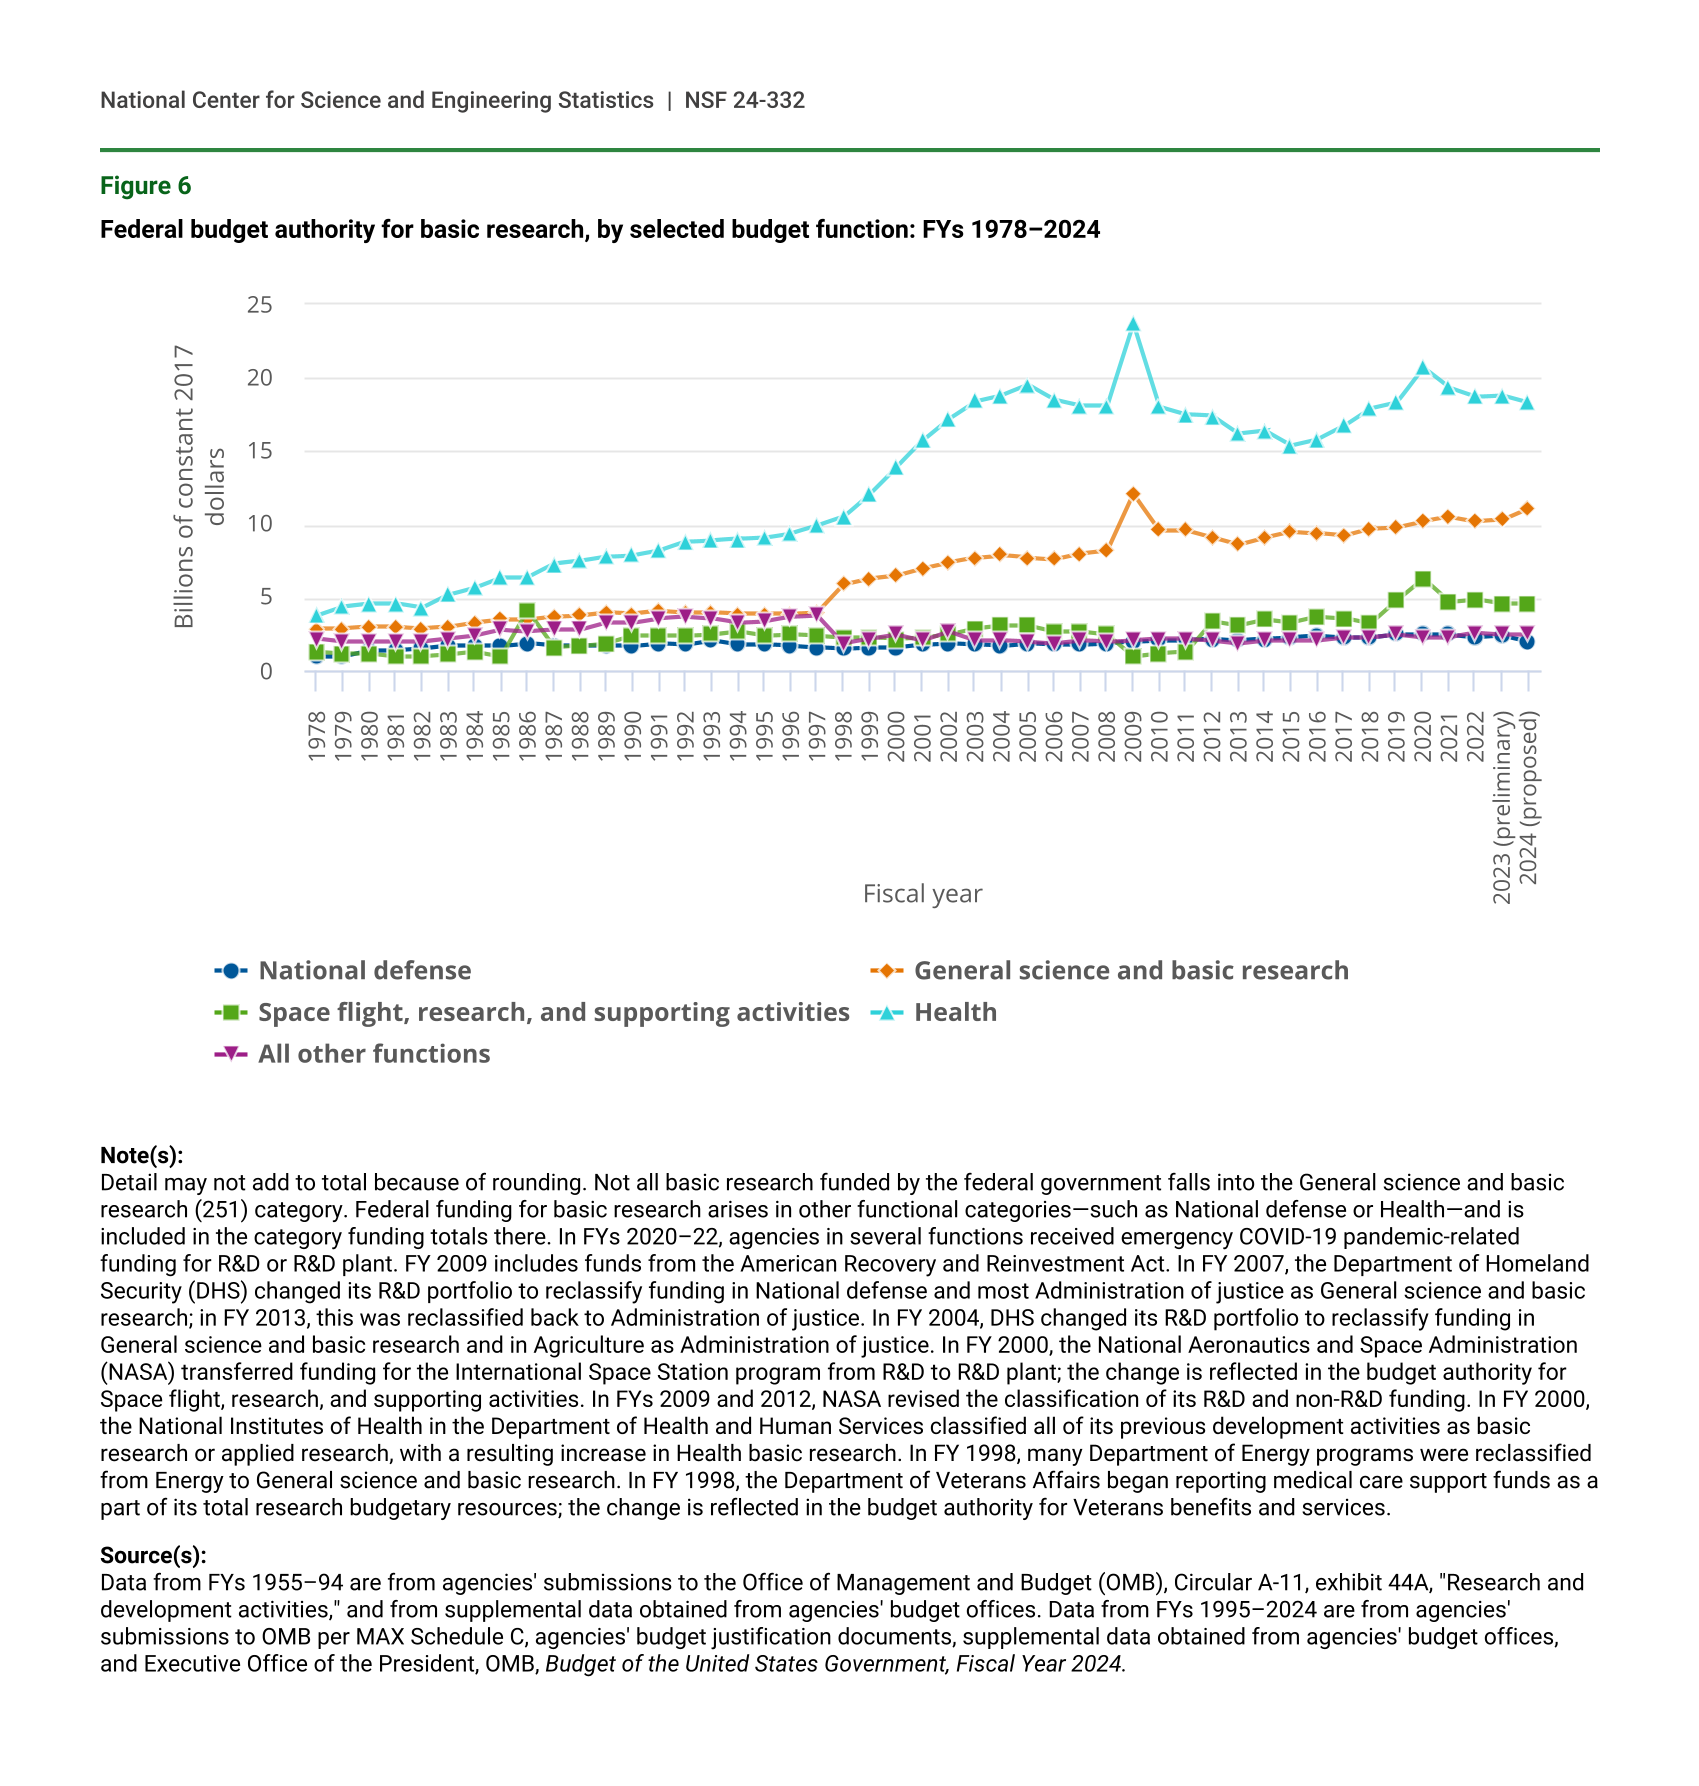
However, data from the Federal Funding for R&D by Budget Function (Budget Function) show that federal funding for basic research increased from 14% of total R&D budget authority in FY 1978 to a high of over 27% in FY 2017 and has remained relatively stable ever since, holding at approximately 25% in FY 2022 (figure 2). In order to understand whether federal funding for basic research is in decline and to understand what constitutes the federal government’s portfolio of basic research funding, this InfoBrief will examine federal funding for basic research using three data sources: National Patterns, Budget Function, and the Survey of Federal Funds for Research and Development (Federal Funds for R&D Survey), all sponsored by the National Center for Science and Engineering Statistics (NCSES) within the U.S. National Science Foundation (NSF).
Federal budget authority for basic research as a percentage of total R&D budget authority: FYs 1978–2024
| Fiscal year | Percentage of total |
|---|---|
| 1978 | 14.1 |
| 1979 | 14.6 |
| 1980 | 15.9 |
| 1981 | 15.1 |
| 1982 | 14.7 |
| 1983 | 16.1 |
| 1984 | 16.0 |
| 1985 | 15.7 |
| 1986 | 15.4 |
| 1987 | 15.8 |
| 1988 | 16.2 |
| 1989 | 17.1 |
| 1990 | 17.7 |
| 1991 | 18.8 |
| 1992 | 19.0 |
| 1993 | 19.2 |
| 1994 | 19.8 |
| 1995 | 20.0 |
| 1996 | 20.9 |
| 1997 | 20.9 |
| 1998 | 21.1 |
| 1999 | 22.5 |
| 2000 | 24.8 |
| 2001 | 24.6 |
| 2002 | 24.4 |
| 2003 | 22.5 |
| 2004 | 21.8 |
| 2005 | 21.9 |
| 2006 | 20.8 |
| 2007 | 20.4 |
| 2008 | 20.5 |
| 2009 | 23.3 |
| 2010 | 20.2 |
| 2011 | 21.0 |
| 2012 | 22.5 |
| 2013 | 23.1 |
| 2014 | 24.0 |
| 2015 | 23.4 |
| 2016 | 22.2 |
| 2017 | 27.3 |
| 2018 | 25.7 |
| 2019 | 27.0 |
| 2020 | 27.1 |
| 2021 | 27.0 |
| 2022 | 25.1 |
| 2023 (preliminary) | 24.1 |
| 2024 (proposed) | 23.8 |
Note(s):
Detail may not add to total because of rounding. Agencies in several functions received emergency COVID-19 pandemic-related funding for R&D and R&D plant in FYs 2020–22. The data for FY 2017 and onward reflect application of the narrowed definition of development described by the Office of Management and Budget (OMB) in its Circular A-11 of July 2016. The previous years' numbers reflect use of the former development definition. FYs 2009–10 include American Recovery and Reinvestment Act of 2009. In FY 2007, the Department of Homeland Security (DHS) changed its R&D portfolio to reclassify funding in National defense and most Administration of justice as General science and basic research; in FY 2013, this was reclassified back to Administration of justice. In FY 2004, DHS changed its R&D portfolio to reclassify funding in General science and basic research and in Agriculture as Administration of justice. In FY 2000, the National Aeronautics and Space Administration (NASA) transferred funding for the International Space Station program from R&D to R&D plant; the change is reflected in the budget authority for Space flight, research, and supporting activities. In FYs 2009 and 2012, NASA revised the classification of its R&D and non-R&D funding. In FY 2000, the National Institutes of Health in the Department of Health and Human Services classified all of its previous development activities as basic research or applied research, with a resulting increase in Health basic research. In FY 1998, many Department of Energy programs were reclassified from Energy to General science and basic research. In FY 1998, the Department of Veterans Affairs began reporting medical care support funds as a part of its total research budgetary resources; the change is reflected in the budget authority for Veterans benefits and services.
Source(s):
Data from FYs 1955–94 are from agencies' submissions to OMB, Circular A-11, exhibit 44A, "Research and development activities," and from supplemental data obtained from agencies' budget offices. Data from FYs 1995–2024 are from agencies' submissions to OMB per MAX Schedule C, agencies' budget justification documents, supplemental data obtained from agencies' budget offices, and Executive Office of the President, OMB, Budget of the United States Government, Fiscal Year 2024.
Basic Research by Funding Source
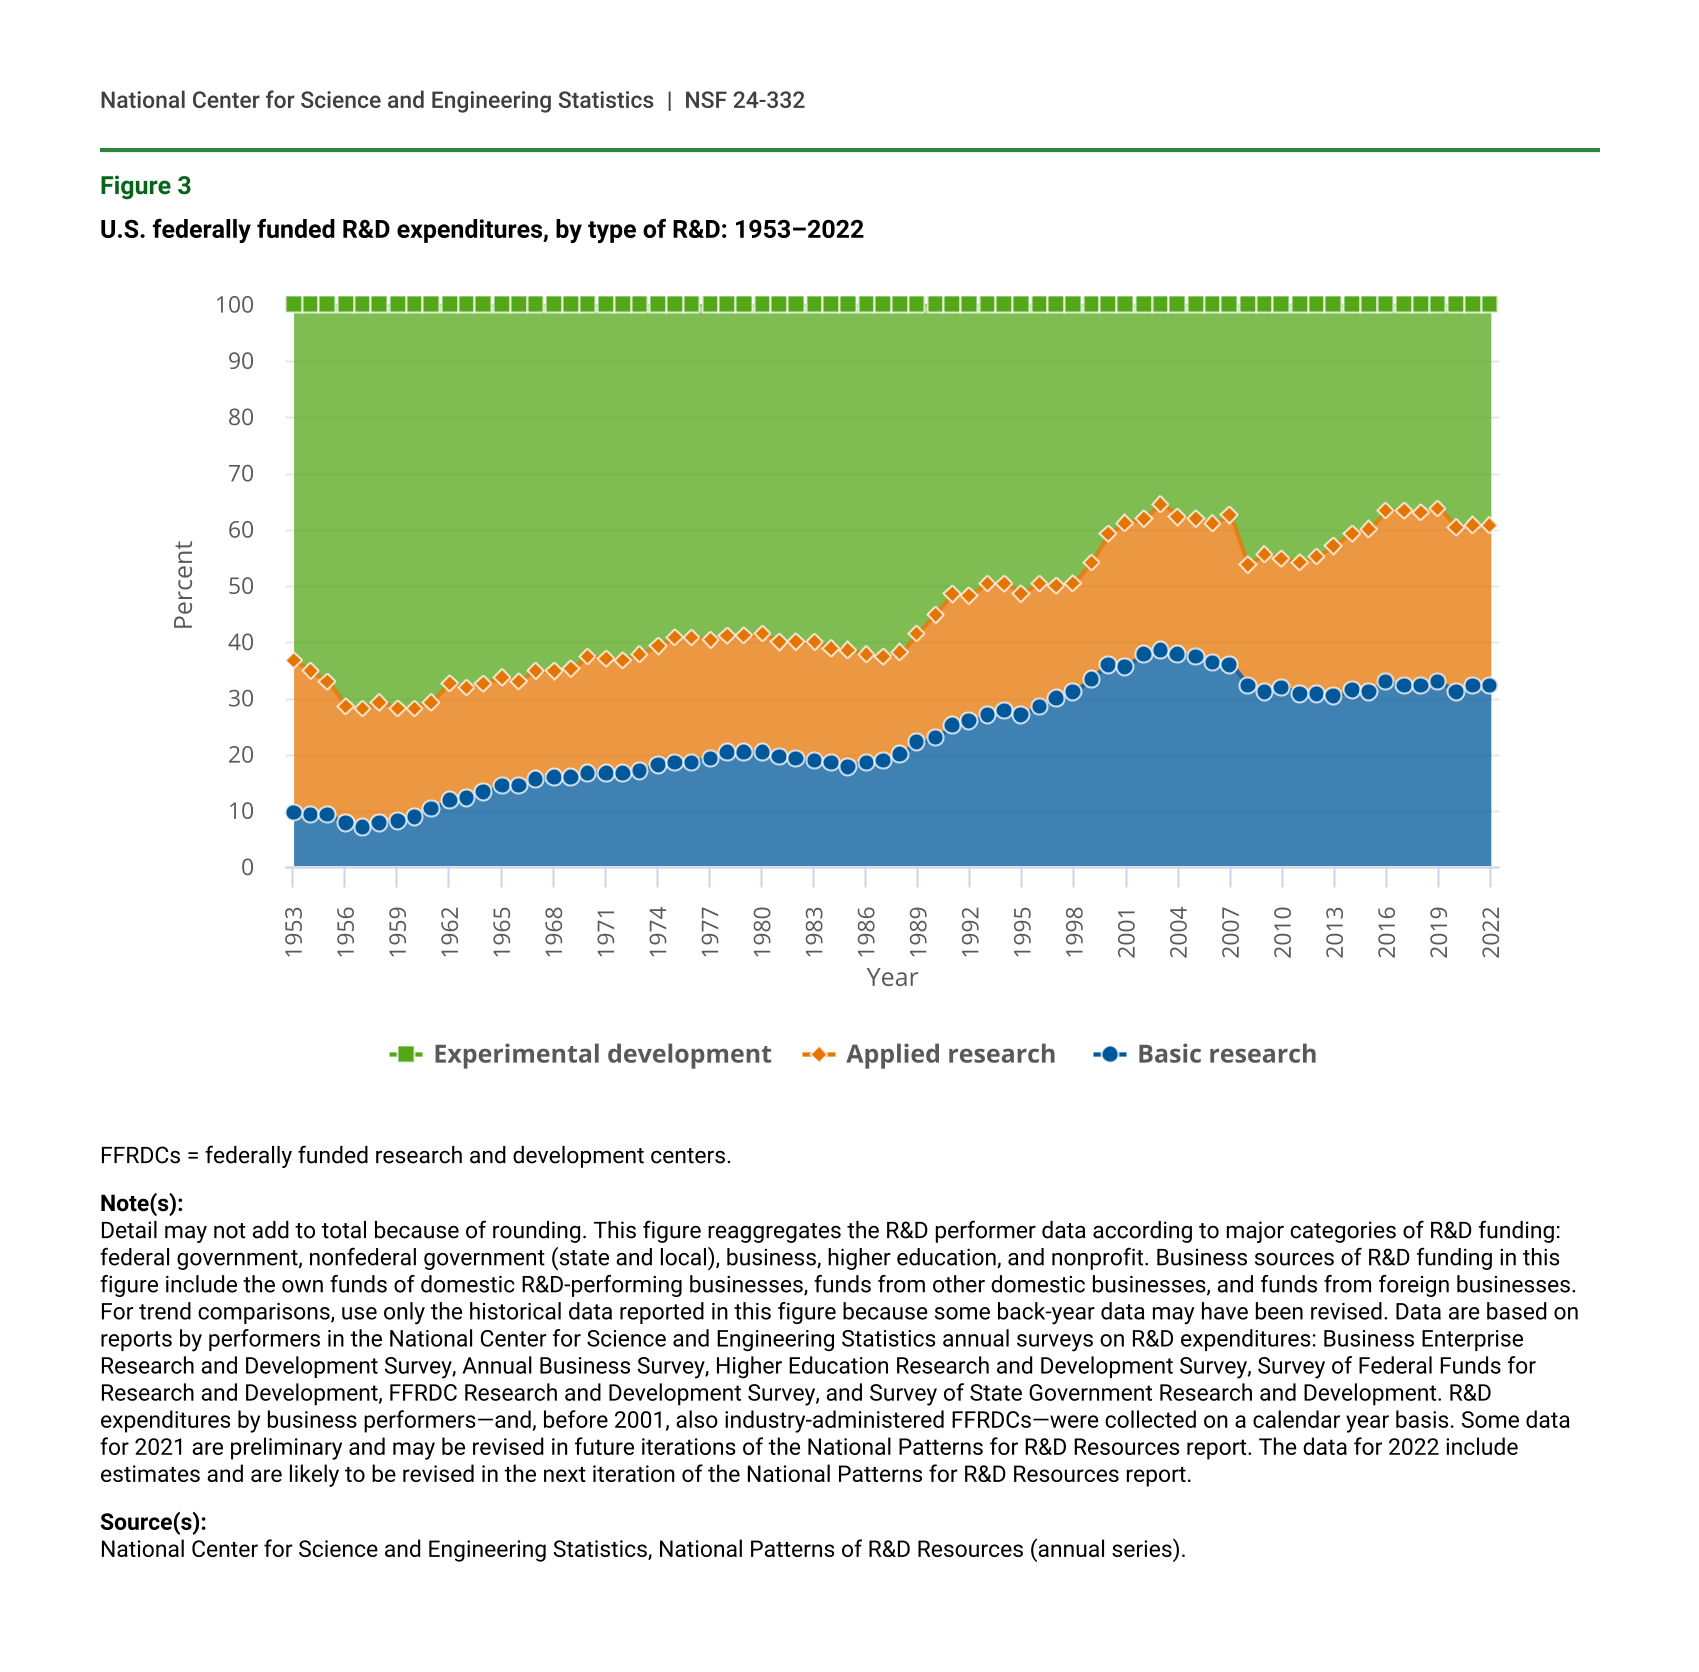
The federal government funds R&D, including basic research, that is performed in all sectors of the economy (i.e., government, business, higher education, and nonprofit). Although the federal government’s share of basic research across all performing sectors of the economy has been declining since the late 1970s, data from National Patterns shows federal funding for basic research as a percentage of total federal funds for R&D performance has increased from 10% in 1953 to 32% in 2022. Federal funds for basic research as a percentage of total federal funds for R&D reached an all-time high of 39% in 2003. The increases in federal funding for basic and applied research in the late 1990s and early 2000s can be attributed to the doubling of the budget for the National Institutes of Health (NIH), commonly referred to as “the NIH doubling”—a 5-year plan (1998 to 2003) between Congress and the executive branch to stimulate research through NIH, which is within the Department of Health and Human Services (HHS). Since 2008, federal funding for basic research as a percentage of all federal funding for R&D has remained relatively stable, hovering between 30% and 33% through 2022 (figure 3).
U.S. federally funded R&D expenditures, by type of R&D: 1953–2022
| Year | Basic research | Applied research | Experimental development |
|---|---|---|---|
| 1953 | 9.5 | 27.2 | 63.3 |
| 1954 | 9.4 | 25.3 | 65.3 |
| 1955 | 9.1 | 23.9 | 67.0 |
| 1956 | 7.9 | 20.6 | 71.5 |
| 1957 | 7.2 | 20.9 | 71.8 |
| 1958 | 7.7 | 21.5 | 70.8 |
| 1959 | 8.1 | 20.0 | 71.9 |
| 1960 | 8.9 | 19.4 | 71.7 |
| 1961 | 10.2 | 19.1 | 70.7 |
| 1962 | 12.0 | 20.7 | 67.3 |
| 1963 | 12.4 | 19.3 | 68.3 |
| 1964 | 13.3 | 19.3 | 67.5 |
| 1965 | 14.4 | 19.3 | 66.3 |
| 1966 | 14.6 | 18.5 | 66.8 |
| 1967 | 15.7 | 19.0 | 65.4 |
| 1968 | 16.0 | 18.8 | 65.2 |
| 1969 | 16.1 | 19.2 | 64.7 |
| 1970 | 16.7 | 20.7 | 62.6 |
| 1971 | 16.8 | 20.3 | 62.9 |
| 1972 | 16.6 | 20.2 | 63.2 |
| 1973 | 17.2 | 20.7 | 62.2 |
| 1974 | 18.2 | 21.0 | 60.8 |
| 1975 | 18.4 | 22.3 | 59.3 |
| 1976 | 18.7 | 22.0 | 59.3 |
| 1977 | 19.2 | 21.2 | 59.6 |
| 1978 | 20.3 | 20.8 | 58.9 |
| 1979 | 20.4 | 20.6 | 59.0 |
| 1980 | 20.5 | 20.8 | 58.7 |
| 1981 | 19.5 | 20.5 | 60.0 |
| 1982 | 19.2 | 20.7 | 60.1 |
| 1983 | 18.9 | 21.1 | 60.0 |
| 1984 | 18.6 | 20.4 | 60.9 |
| 1985 | 17.9 | 20.8 | 61.4 |
| 1986 | 18.7 | 19.1 | 62.2 |
| 1987 | 18.9 | 18.5 | 62.6 |
| 1988 | 20.1 | 17.9 | 62.0 |
| 1989 | 22.1 | 19.4 | 58.4 |
| 1990 | 22.8 | 22.2 | 55.0 |
| 1991 | 25.1 | 23.5 | 51.4 |
| 1992 | 25.8 | 22.5 | 51.7 |
| 1993 | 27.1 | 23.3 | 49.7 |
| 1994 | 27.6 | 22.7 | 49.7 |
| 1995 | 27.0 | 21.5 | 51.5 |
| 1996 | 28.5 | 22.0 | 49.5 |
| 1997 | 29.9 | 20.0 | 50.1 |
| 1998 | 31.1 | 19.3 | 49.6 |
| 1999 | 33.5 | 20.8 | 45.8 |
| 2000 | 36.1 | 23.0 | 40.9 |
| 2001 | 35.7 | 25.5 | 38.9 |
| 2002 | 37.7 | 24.0 | 38.3 |
| 2003 | 38.6 | 26.0 | 35.5 |
| 2004 | 37.6 | 24.8 | 37.6 |
| 2005 | 37.3 | 24.5 | 38.2 |
| 2006 | 36.4 | 24.7 | 38.9 |
| 2007 | 36.1 | 26.4 | 37.5 |
| 2008 | 32.2 | 21.5 | 46.4 |
| 2009 | 31.2 | 24.3 | 44.5 |
| 2010 | 31.7 | 23.3 | 45.0 |
| 2011 | 30.9 | 23.2 | 45.9 |
| 2012 | 30.9 | 24.3 | 44.9 |
| 2013 | 30.2 | 26.9 | 42.9 |
| 2014 | 31.3 | 28.1 | 40.6 |
| 2015 | 31.2 | 28.8 | 40.0 |
| 2016 | 32.9 | 30.5 | 36.6 |
| 2017 | 32.1 | 31.2 | 36.7 |
| 2018 | 32.3 | 30.7 | 37.0 |
| 2019 | 32.8 | 31.0 | 36.1 |
| 2020 | 31.1 | 29.4 | 39.6 |
| 2021 | 32.1 | 28.6 | 39.2 |
| 2022 | 32.1 | 28.8 | 39.1 |
FFRDCs = federally funded research and development centers.
Note(s):
Detail may not add to total because of rounding. This figure reaggregates the R&D performer data according to major categories of R&D funding: federal government, nonfederal government (state and local), business, higher education, and nonprofit. Business sources of R&D funding in this figure include the own funds of domestic R&D-performing businesses, funds from other domestic businesses, and funds from foreign businesses. For trend comparisons, use only the historical data reported in this figure because some back-year data may have been revised. Data are based on reports by performers in the National Center for Science and Engineering Statistics annual surveys on R&D expenditures: Business Enterprise Research and Development Survey, Annual Business Survey, Higher Education Research and Development Survey, Survey of Federal Funds for Research and Development, FFRDC Research and Development Survey, and Survey of State Government Research and Development. R&D expenditures by business performers—and, before 2001, also industry-administered FFRDCs—were collected on a calendar year basis. Some data for 2021 are preliminary and may be revised in future iterations of the National Patterns for R&D Resources report. The data for 2022 include estimates and are likely to be revised in the next iteration of the National Patterns for R&D Resources report.
Source(s):
National Center for Science and Engineering Statistics, National Patterns of R&D Resources (annual series).
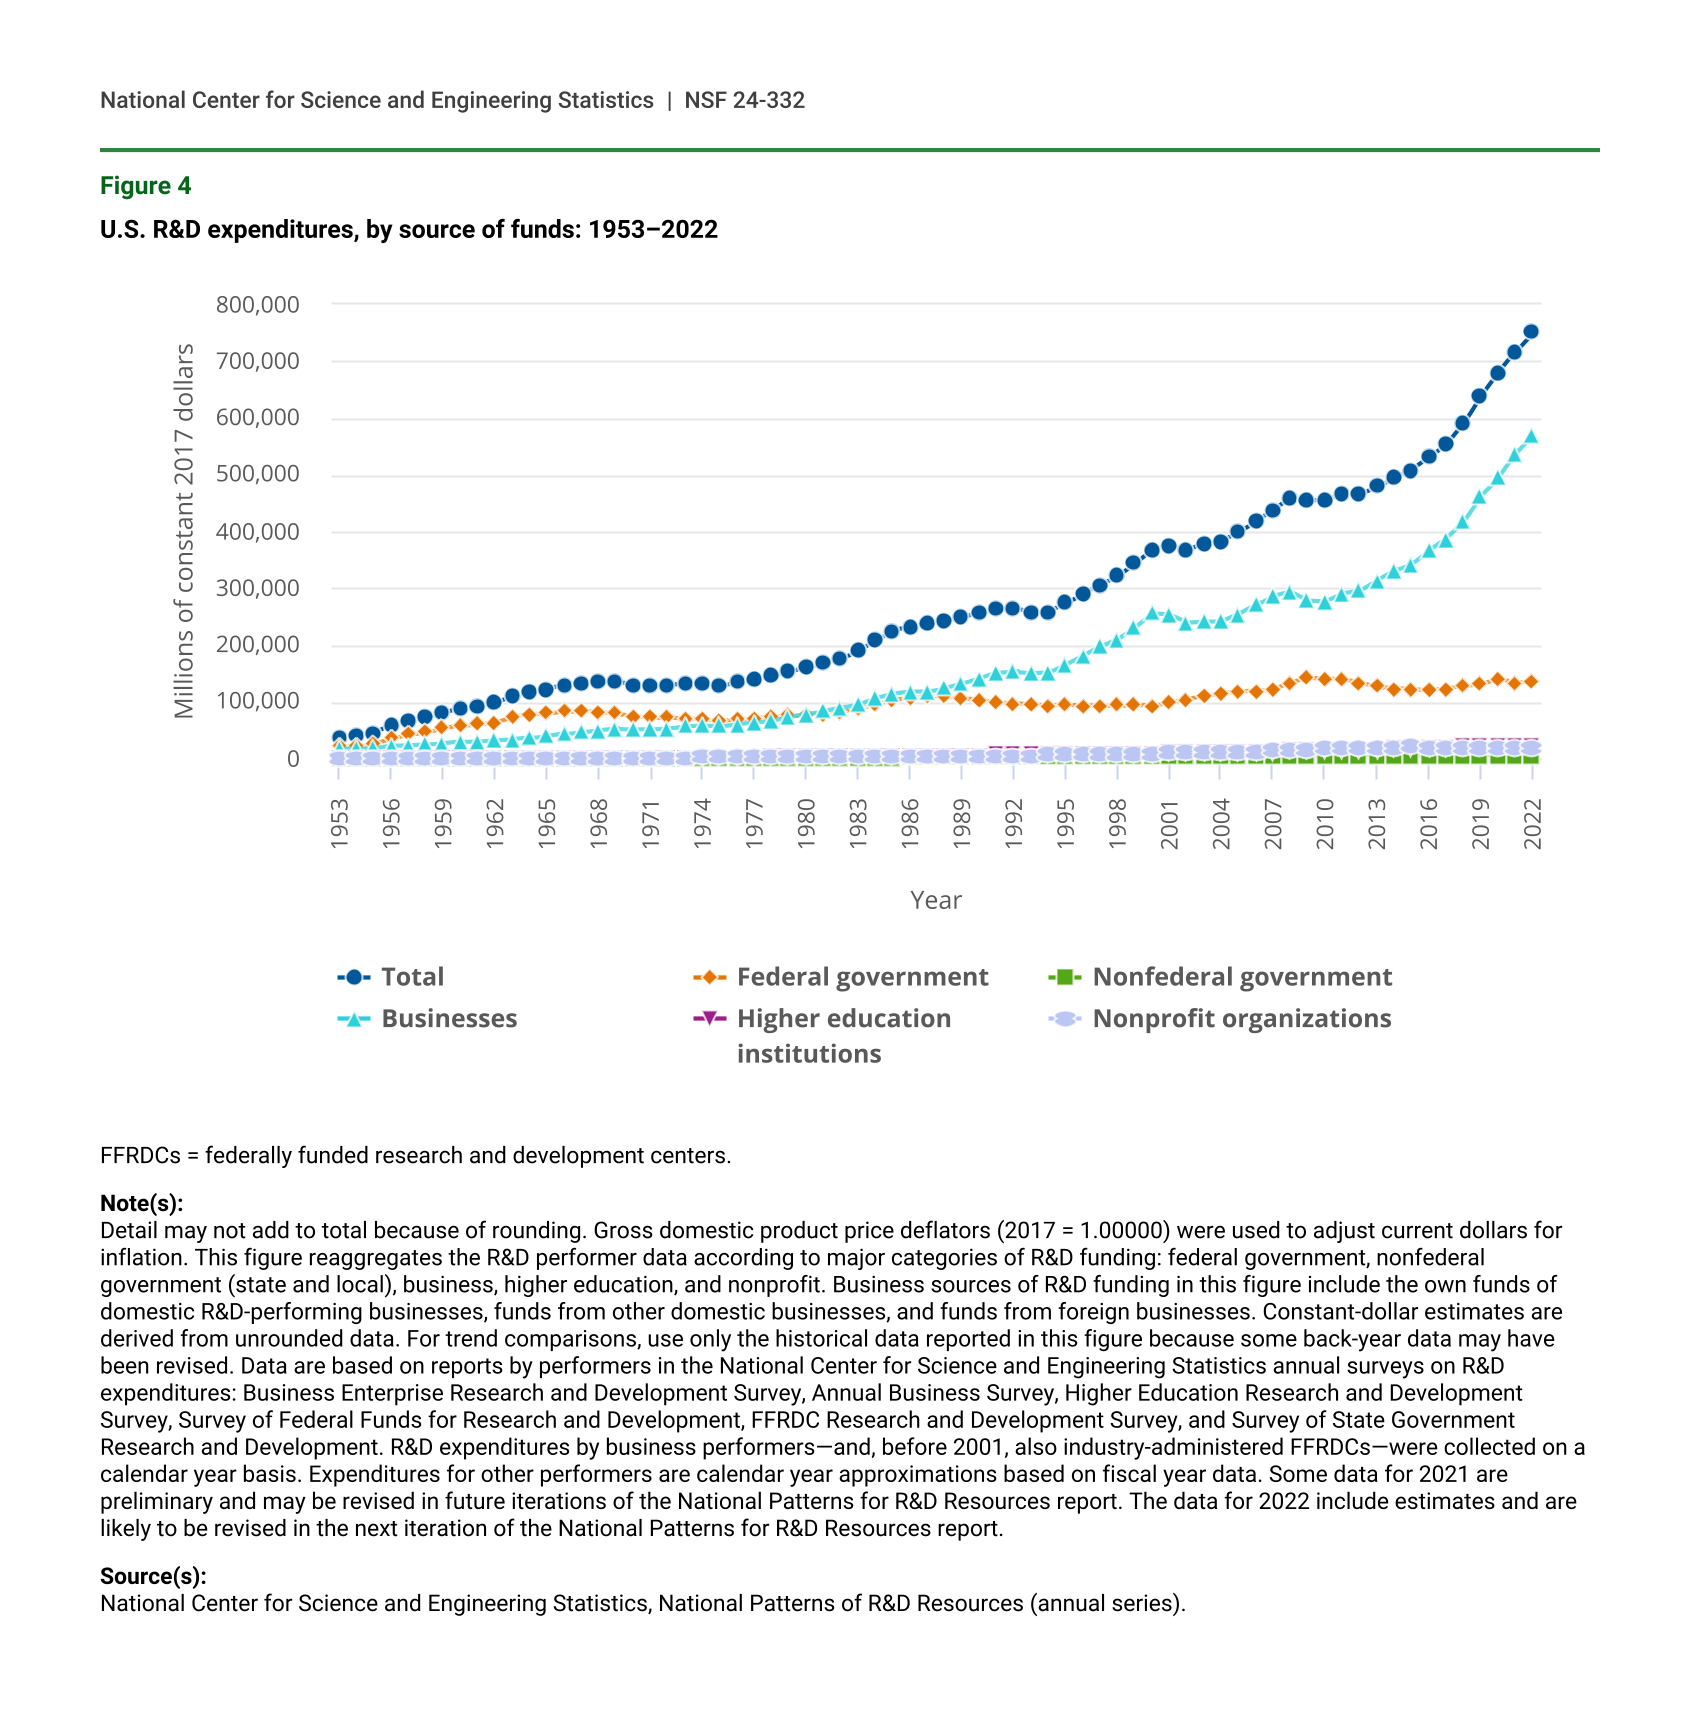
If the share of federal funds for basic research as a percentage of all federal R&D funding has been stable at about 32% since the late 2000s, why does National Patterns data show that the percentage of total basic research supported by the federal government has been in decline? National Patterns data also demonstrate a trend in private sector R&D. For example, between 2000 and 2022, the amount of R&D funded by the business sector has more than doubled when measured in constant dollars (figure 4). In 2000, businesses funded $256 billion in domestic R&D, which increased 123% to an estimated $570 billion in 2022. In contrast, federally funded R&D increased from $92 billion to $135 billion over the same time period, an increase of nearly 47%. Similarly, business funding for basic research increased from $11 billion in 2000 to $41 billion in 2022, whereas federal funding for basic research increased from $33 billion to $43 billion over the same period. (All dollar amounts in this paragraph are in constant dollars). Therefore, although federal funding for basic research as a percentage of all federal funding for R&D has been relatively stable in recent years, the growth in private sector funding for basic research has reduced the federal share of basic research across the economy overall.
U.S. R&D expenditures, by source of funds: 1953–2022
| Year | Total | Federal government | Nonfederal government | Businesses | Higher education institutions | Nonprofit organizations |
|---|---|---|---|---|---|---|
| 1953 | 38,372 | 20,692 | 294 | 16,706 | 271 | 409 |
| 1954 | 41,414 | 22,857 | 328 | 17,496 | 291 | 442 |
| 1955 | 44,817 | 25,412 | 362 | 18,274 | 304 | 464 |
| 1956 | 59,566 | 34,886 | 396 | 23,443 | 322 | 519 |
| 1957 | 67,199 | 42,271 | 434 | 23,531 | 346 | 617 |
| 1958 | 72,382 | 46,247 | 477 | 24,583 | 368 | 706 |
| 1959 | 81,701 | 53,425 | 527 | 26,588 | 399 | 762 |
| 1960 | 88,484 | 57,533 | 581 | 29,144 | 432 | 794 |
| 1961 | 93,001 | 60,561 | 642 | 30,377 | 476 | 945 |
| 1962 | 98,647 | 63,960 | 707 | 32,324 | 530 | 1,126 |
| 1963 | 109,276 | 72,640 | 780 | 34,029 | 599 | 1,229 |
| 1964 | 117,368 | 78,424 | 845 | 36,172 | 697 | 1,229 |
| 1965 | 122,192 | 79,605 | 902 | 39,510 | 821 | 1,355 |
| 1966 | 129,541 | 83,134 | 939 | 43,026 | 965 | 1,476 |
| 1967 | 133,162 | 83,064 | 958 | 46,459 | 1,138 | 1,543 |
| 1968 | 134,940 | 81,865 | 1,009 | 49,276 | 1,206 | 1,584 |
| 1969 | 135,560 | 79,411 | 1,085 | 52,202 | 1,215 | 1,648 |
| 1970 | 130,130 | 74,222 | 1,174 | 51,755 | 1,280 | 1,699 |
| 1971 | 127,058 | 71,706 | 1,235 | 51,028 | 1,365 | 1,725 |
| 1972 | 129,871 | 72,478 | 1,274 | 52,938 | 1,408 | 1,774 |
| 1973 | 132,600 | 71,060 | 1,289 | 56,973 | 1,474 | 1,804 |
| 1974 | 131,115 | 67,944 | 1,256 | 58,506 | 1,547 | 1,862 |
| 1975 | 128,316 | 66,667 | 1,252 | 56,923 | 1,552 | 1,922 |
| 1976 | 134,454 | 69,185 | 1,258 | 60,356 | 1,637 | 2,018 |
| 1977 | 139,118 | 70,851 | 1,265 | 63,051 | 1,825 | 2,127 |
| 1978 | 146,114 | 73,219 | 1,329 | 67,350 | 2,036 | 2,180 |
| 1979 | 153,363 | 75,395 | 1,333 | 72,271 | 2,174 | 2,190 |
| 1980 | 160,583 | 76,162 | 1,317 | 78,557 | 2,335 | 2,212 |
| 1981 | 167,744 | 78,286 | 1,348 | 83,413 | 2,454 | 2,243 |
| 1982 | 176,461 | 81,148 | 1,357 | 88,926 | 2,637 | 2,393 |
| 1983 | 189,161 | 87,169 | 1,384 | 95,189 | 2,853 | 2,567 |
| 1984 | 207,528 | 94,322 | 1,463 | 105,926 | 3,073 | 2,743 |
| 1985 | 225,616 | 103,572 | 1,640 | 114,041 | 3,429 | 2,934 |
| 1986 | 231,920 | 105,349 | 1,869 | 117,632 | 3,893 | 3,177 |
| 1987 | 237,816 | 110,306 | 2,003 | 117,771 | 4,257 | 3,479 |
| 1988 | 243,385 | 109,313 | 2,118 | 123,577 | 4,594 | 3,784 |
| 1989 | 248,214 | 105,774 | 2,229 | 131,141 | 4,989 | 4,081 |
| 1990 | 256,292 | 103,888 | 2,359 | 140,306 | 5,373 | 4,366 |
| 1991 | 262,397 | 99,140 | 2,418 | 150,547 | 5,639 | 4,652 |
| 1992 | 263,686 | 97,141 | 2,432 | 153,457 | 5,691 | 4,965 |
| 1993 | 258,173 | 94,289 | 2,425 | 150,404 | 5,777 | 5,277 |
| 1994 | 258,078 | 92,699 | 2,475 | 151,308 | 6,006 | 5,590 |
| 1995 | 274,318 | 94,069 | 2,616 | 165,630 | 6,140 | 5,863 |
| 1996 | 289,515 | 93,002 | 2,730 | 181,057 | 6,507 | 6,219 |
| 1997 | 305,588 | 92,821 | 2,743 | 196,436 | 6,997 | 6,592 |
| 1998 | 321,964 | 93,995 | 2,739 | 210,746 | 7,406 | 7,078 |
| 1999 | 343,758 | 93,961 | 2,864 | 231,390 | 7,950 | 7,593 |
| 2000 | 368,456 | 92,458 | 3,001 | 255,734 | 8,621 | 8,643 |
| 2001 | 374,583 | 99,238 | 3,149 | 253,374 | 9,244 | 9,578 |
| 2002 | 368,020 | 104,446 | 3,381 | 239,294 | 10,161 | 10,738 |
| 2003 | 378,366 | 110,553 | 3,621 | 241,761 | 10,760 | 11,672 |
| 2004 | 382,831 | 114,818 | 3,700 | 241,974 | 10,922 | 11,416 |
| 2005 | 398,851 | 116,990 | 3,650 | 254,763 | 11,468 | 11,981 |
| 2006 | 417,393 | 118,872 | 3,917 | 270,225 | 12,103 | 12,275 |
| 2007 | 437,630 | 121,747 | 4,162 | 285,834 | 12,661 | 13,225 |
| 2008 | 459,907 | 133,634 | 4,796 | 293,162 | 13,336 | 14,980 |
| 2009 | 455,003 | 142,018 | 4,851 | 278,479 | 13,615 | 16,041 |
| 2010 | 453,632 | 141,263 | 4,800 | 276,828 | 13,680 | 17,061 |
| 2011 | 465,903 | 138,842 | 4,795 | 291,237 | 14,323 | 16,707 |
| 2012 | 465,418 | 132,894 | 4,462 | 295,894 | 15,326 | 16,841 |
| 2013 | 479,297 | 126,760 | 4,478 | 313,587 | 16,188 | 18,284 |
| 2014 | 493,603 | 122,760 | 4,370 | 330,228 | 16,776 | 19,468 |
| 2015 | 508,109 | 122,829 | 4,394 | 342,434 | 17,736 | 20,716 |
| 2016 | 531,028 | 120,290 | 5,084 | 366,743 | 19,065 | 19,846 |
| 2017 | 553,612 | 122,470 | 5,076 | 386,538 | 19,880 | 19,648 |
| 2018 | 590,500 | 128,162 | 5,135 | 416,936 | 20,519 | 19,748 |
| 2019 | 639,911 | 130,547 | 5,263 | 463,645 | 21,041 | 19,415 |
| 2020 | 680,262 | 140,602 | 5,386 | 493,791 | 21,408 | 19,076 |
| 2021 | 715,953 | 133,860 | 5,202 | 536,244 | 21,579 | 19,069 |
| 2022 | 750,649 | 135,482 | 5,003 | 570,358 | 21,627 | 18,179 |
FFRDCs = federally funded research and development centers.
Note(s):
Detail may not add to total because of rounding. Gross domestic product price deflators (2017 = 1.00000) were used to adjust current dollars for inflation. This figure reaggregates the R&D performer data according to major categories of R&D funding: federal government, nonfederal government (state and local), business, higher education, and nonprofit. Business sources of R&D funding in this figure include the own funds of domestic R&D-performing businesses, funds from other domestic businesses, and funds from foreign businesses. Constant-dollar estimates are derived from unrounded data. For trend comparisons, use only the historical data reported in this figure because some back-year data may have been revised. Data are based on reports by performers in the National Center for Science and Engineering Statistics annual surveys on R&D expenditures: Business Enterprise Research and Development Survey, Annual Business Survey, Higher Education Research and Development Survey, Survey of Federal Funds for Research and Development, FFRDC Research and Development Survey, and Survey of State Government Research and Development. R&D expenditures by business performers—and, before 2001, also industry-administered FFRDCs—were collected on a calendar year basis. Expenditures for other performers are calendar year approximations based on fiscal year data. Some data for 2021 are preliminary and may be revised in future iterations of the National Patterns for R&D Resources report. The data for 2022 include estimates and are likely to be revised in the next iteration of the National Patterns for R&D Resources report.
Source(s):
National Center for Science and Engineering Statistics, National Patterns of R&D Resources (annual series).
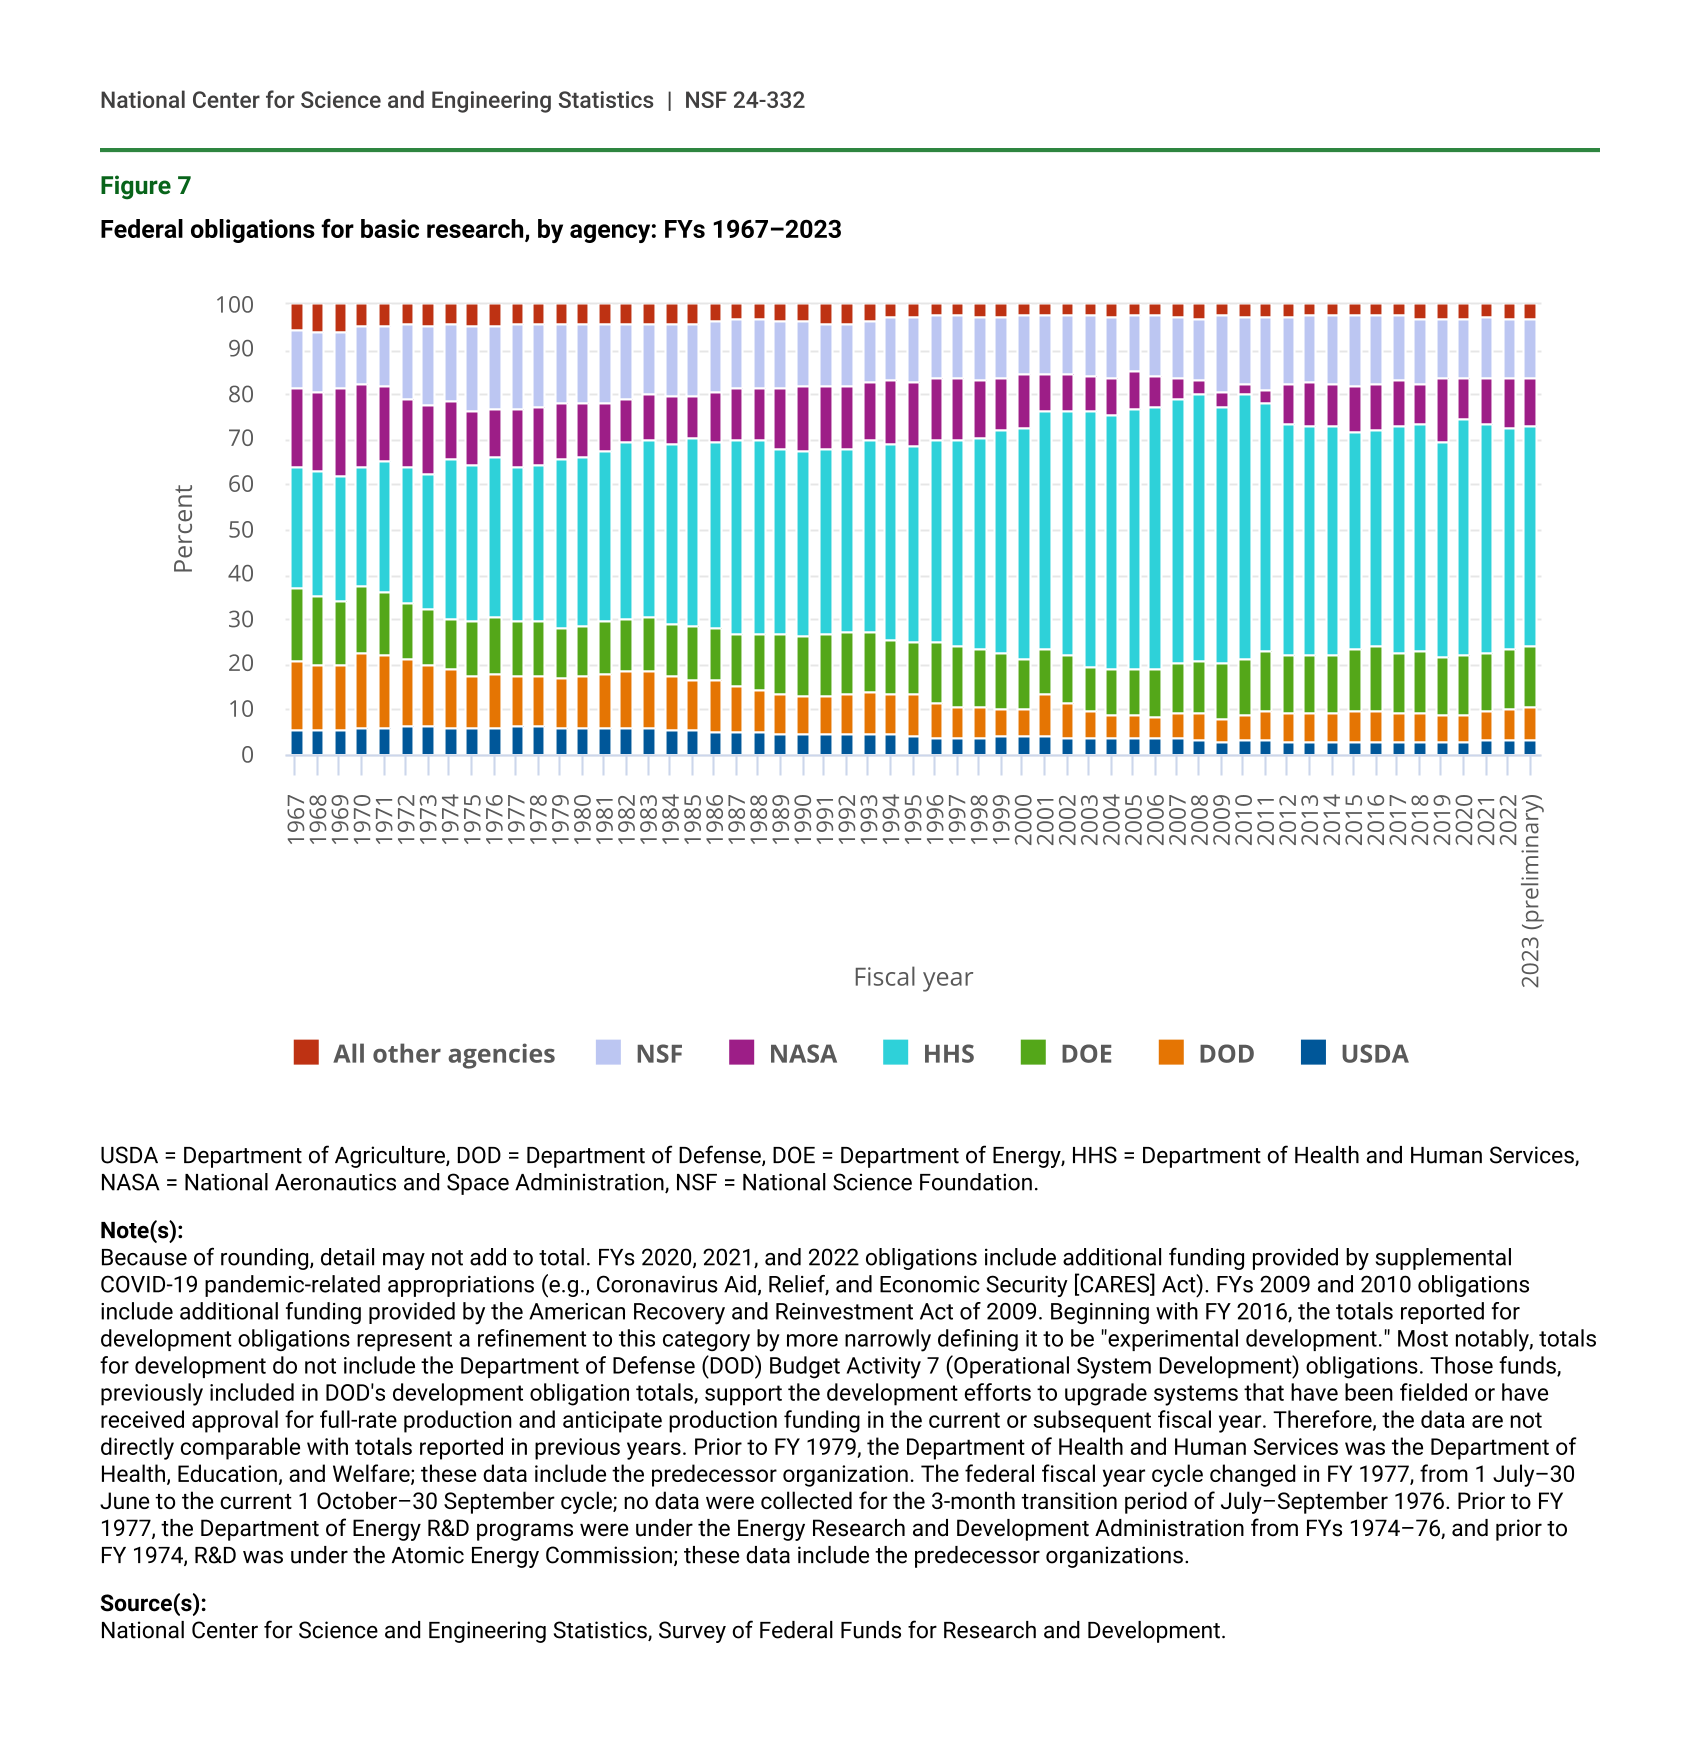
Federal Obligations for Basic Research by Agency
In FY 2022, federal obligations for basic research totaled $45.4 billion in current dollars, or about 24% of the total federal R&D portfolio ($190.4 billion). From a science policy perspective, obligations for R&D are an important measure because they indicate an agency’s funding priorities at a given point in time. Data from the NCSES-sponsored Federal Funds for R&D Survey show that HHS (previously called the Department of Health, Education, and Welfare) has consistently been the largest funder of basic research by the federal government since at least FY 1967 when it accounted for 27% of all federal obligations for basic research (figure 7). In FY 2008, HHS peaked as the largest funder of basic research with 59% of all federal obligations for basic research. In FY 2023, HHS alone accounted for 49% of all federal funding for basic research.
Federal obligations for basic research, by agency: FYs 1967–2023
| Fiscal year | USDA | DOD | DOE | HHS | NASA | NSF | All other agencies |
|---|---|---|---|---|---|---|---|
| 1967 | 5.4 | 15.4 | 16.3 | 26.5 | 17.8 | 12.9 | 5.6 |
| 1968 | 5.4 | 14.3 | 15.3 | 28.1 | 17.4 | 13.7 | 5.8 |
| 1969 | 5.5 | 14.2 | 14.7 | 27.6 | 19.5 | 12.7 | 5.8 |
| 1970 | 6.0 | 16.5 | 14.9 | 26.6 | 18.6 | 12.7 | 4.7 |
| 1971 | 6.0 | 16.3 | 14.0 | 29.0 | 16.5 | 13.8 | 4.5 |
| 1972 | 6.3 | 15.0 | 12.3 | 30.4 | 15.2 | 16.8 | 4.0 |
| 1973 | 6.4 | 13.7 | 12.3 | 29.9 | 15.7 | 17.6 | 4.4 |
| 1974 | 6.1 | 12.7 | 11.3 | 35.6 | 12.8 | 17.4 | 4.1 |
| 1975 | 6.0 | 11.6 | 12.1 | 34.9 | 12.0 | 18.8 | 4.7 |
| 1976 | 6.2 | 11.8 | 12.5 | 35.6 | 10.6 | 18.9 | 4.4 |
| 1977 | 6.3 | 11.5 | 12.0 | 34.4 | 12.7 | 19.2 | 4.1 |
| 1978 | 6.6 | 11.1 | 11.9 | 34.9 | 13.0 | 18.3 | 4.2 |
| 1979 | 6.1 | 11.2 | 11.0 | 37.6 | 12.2 | 17.5 | 4.3 |
| 1980 | 5.9 | 11.6 | 11.2 | 37.7 | 12.0 | 17.4 | 4.2 |
| 1981 | 6.2 | 12.0 | 11.6 | 37.7 | 10.5 | 17.8 | 4.1 |
| 1982 | 6.0 | 12.5 | 11.7 | 39.1 | 9.8 | 16.7 | 4.1 |
| 1983 | 5.8 | 12.5 | 12.3 | 39.5 | 9.9 | 16.0 | 4.0 |
| 1984 | 5.6 | 12.0 | 11.8 | 39.8 | 10.7 | 16.0 | 4.2 |
| 1985 | 5.7 | 11.0 | 12.1 | 41.3 | 9.6 | 16.1 | 4.1 |
| 1986 | 5.3 | 11.3 | 11.8 | 41.0 | 11.2 | 15.6 | 3.8 |
| 1987 | 5.0 | 10.1 | 11.9 | 42.8 | 11.3 | 15.3 | 3.4 |
| 1988 | 5.1 | 9.3 | 12.5 | 43.1 | 11.7 | 15.1 | 3.2 |
| 1989 | 4.6 | 8.9 | 13.3 | 41.4 | 13.4 | 14.7 | 3.7 |
| 1990 | 4.6 | 8.4 | 13.3 | 41.2 | 14.5 | 14.1 | 3.9 |
| 1991 | 4.6 | 8.2 | 13.9 | 41.5 | 14.0 | 13.8 | 4.1 |
| 1992 | 4.8 | 8.8 | 13.9 | 40.5 | 13.9 | 13.9 | 4.2 |
| 1993 | 4.6 | 9.5 | 13.1 | 42.5 | 13.4 | 13.0 | 3.9 |
| 1994 | 4.5 | 8.9 | 11.9 | 43.5 | 14.5 | 13.8 | 2.9 |
| 1995 | 4.3 | 9.0 | 11.8 | 43.7 | 14.3 | 14.2 | 2.8 |
| 1996 | 3.8 | 7.9 | 13.3 | 45.0 | 13.7 | 13.9 | 2.4 |
| 1997 | 3.9 | 6.8 | 13.2 | 45.9 | 14.0 | 13.8 | 2.4 |
| 1998 | 3.9 | 6.6 | 13.0 | 47.1 | 13.0 | 13.6 | 2.9 |
| 1999 | 4.3 | 6.0 | 12.2 | 49.5 | 11.7 | 13.5 | 2.8 |
| 2000 | 4.1 | 6.3 | 11.1 | 51.4 | 11.8 | 13.0 | 2.3 |
| 2001 | 4.1 | 9.2 | 10.5 | 52.8 | 8.0 | 13.0 | 2.4 |
| 2002 | 3.9 | 7.7 | 10.5 | 54.3 | 8.4 | 13.0 | 2.2 |
| 2003 | 3.9 | 5.6 | 9.9 | 57.0 | 7.7 | 13.7 | 2.2 |
| 2004 | 3.5 | 5.4 | 10.2 | 56.5 | 8.2 | 13.4 | 2.7 |
| 2005 | 3.5 | 5.2 | 10.1 | 58.2 | 8.3 | 12.6 | 2.2 |
| 2006 | 3.6 | 4.9 | 10.7 | 58.5 | 6.8 | 13.2 | 2.5 |
| 2007 | 3.5 | 5.7 | 11.2 | 58.7 | 4.9 | 13.5 | 2.6 |
| 2008 | 3.3 | 6.0 | 11.7 | 59.0 | 3.2 | 13.7 | 3.1 |
| 2009 | 2.8 | 5.3 | 12.4 | 57.1 | 3.1 | 17.1 | 2.3 |
| 2010 | 3.1 | 5.8 | 12.5 | 58.7 | 2.5 | 14.7 | 2.7 |
| 2011 | 3.3 | 6.4 | 13.5 | 54.8 | 2.9 | 16.0 | 3.0 |
| 2012 | 2.8 | 6.6 | 12.8 | 51.6 | 8.4 | 15.0 | 2.8 |
| 2013 | 2.8 | 6.3 | 12.9 | 51.3 | 9.5 | 14.6 | 2.5 |
| 2014 | 2.9 | 6.6 | 12.9 | 50.7 | 9.6 | 15.0 | 2.5 |
| 2015 | 2.9 | 6.8 | 14.1 | 47.8 | 10.2 | 15.8 | 2.4 |
| 2016 | 2.9 | 6.9 | 14.2 | 48.4 | 10.2 | 15.0 | 2.4 |
| 2017 | 2.9 | 6.3 | 13.5 | 50.2 | 10.3 | 14.2 | 2.5 |
| 2018 | 2.7 | 6.6 | 13.8 | 50.4 | 9.1 | 14.1 | 3.3 |
| 2019 | 2.6 | 6.3 | 12.7 | 47.7 | 14.2 | 13.0 | 3.4 |
| 2020 | 2.8 | 6.0 | 13.2 | 52.5 | 9.2 | 13.1 | 3.1 |
| 2021 | 3.1 | 6.7 | 13.0 | 50.9 | 9.9 | 13.7 | 2.7 |
| 2022 | 3.1 | 6.9 | 13.5 | 49.4 | 11.1 | 12.9 | 3.1 |
| 2023 (preliminary) | 3.3 | 7.3 | 13.5 | 49.1 | 10.5 | 13.2 | 3.2 |
USDA = Department of Agriculture, DOD = Department of Defense, DOE = Department of Energy, HHS = Department of Health and Human Services, NASA = National Aeronautics and Space Administration, NSF = National Science Foundation.
Note(s):
Because of rounding, detail may not add to total. FYs 2020, 2021, and 2022 obligations include additional funding provided by supplemental COVID-19 pandemic-related appropriations (e.g., Coronavirus Aid, Relief, and Economic Security [CARES] Act). FYs 2009 and 2010 obligations include additional funding provided by the American Recovery and Reinvestment Act of 2009. Beginning with FY 2016, the totals reported for development obligations represent a refinement to this category by more narrowly defining it to be "experimental development." Most notably, totals for development do not include the Department of Defense (DOD) Budget Activity 7 (Operational System Development) obligations. Those funds, previously included in DOD's development obligation totals, support the development efforts to upgrade systems that have been fielded or have received approval for full-rate production and anticipate production funding in the current or subsequent fiscal year. Therefore, the data are not directly comparable with totals reported in previous years. Prior to FY 1979, the Department of Health and Human Services was the Department of Health, Education, and Welfare; these data include the predecessor organization. The federal fiscal year cycle changed in FY 1977, from 1 July–30 June to the current 1 October–30 September cycle; no data were collected for the 3-month transition period of July–September 1976. Prior to FY 1977, the Department of Energy R&D programs were under the Energy Research and Development Administration from FYs 1974–76, and prior to FY 1974, R&D was under the Atomic Energy Commission; these data include the predecessor organizations.
Source(s):
National Center for Science and Engineering Statistics, Survey of Federal Funds for Research and Development.
Agencies’ shares of obligations for basic research have changed over time as agency missions have grown and developed with national needs. For example, in FY 1967, the National Aeronautics and Space Administration (NASA) was the second-largest funder of basic research, accounting for nearly 18% of federal obligations, followed by the Department of Energy (DOE) (previously called the Atomic Energy Commission) (16%), the Department of Defense (DOD) (15%), NSF (13%), and the Department of Agriculture (USDA) (5%). By FY 2023, DOE and NSF were the second- and third-largest funders of basic research, respectively, accounting for 13% each, followed by NASA (11%), DOD (7%), and USDA (3%). In FY 2023, all other agencies combined accounted for 3% of federal obligations for basic research.
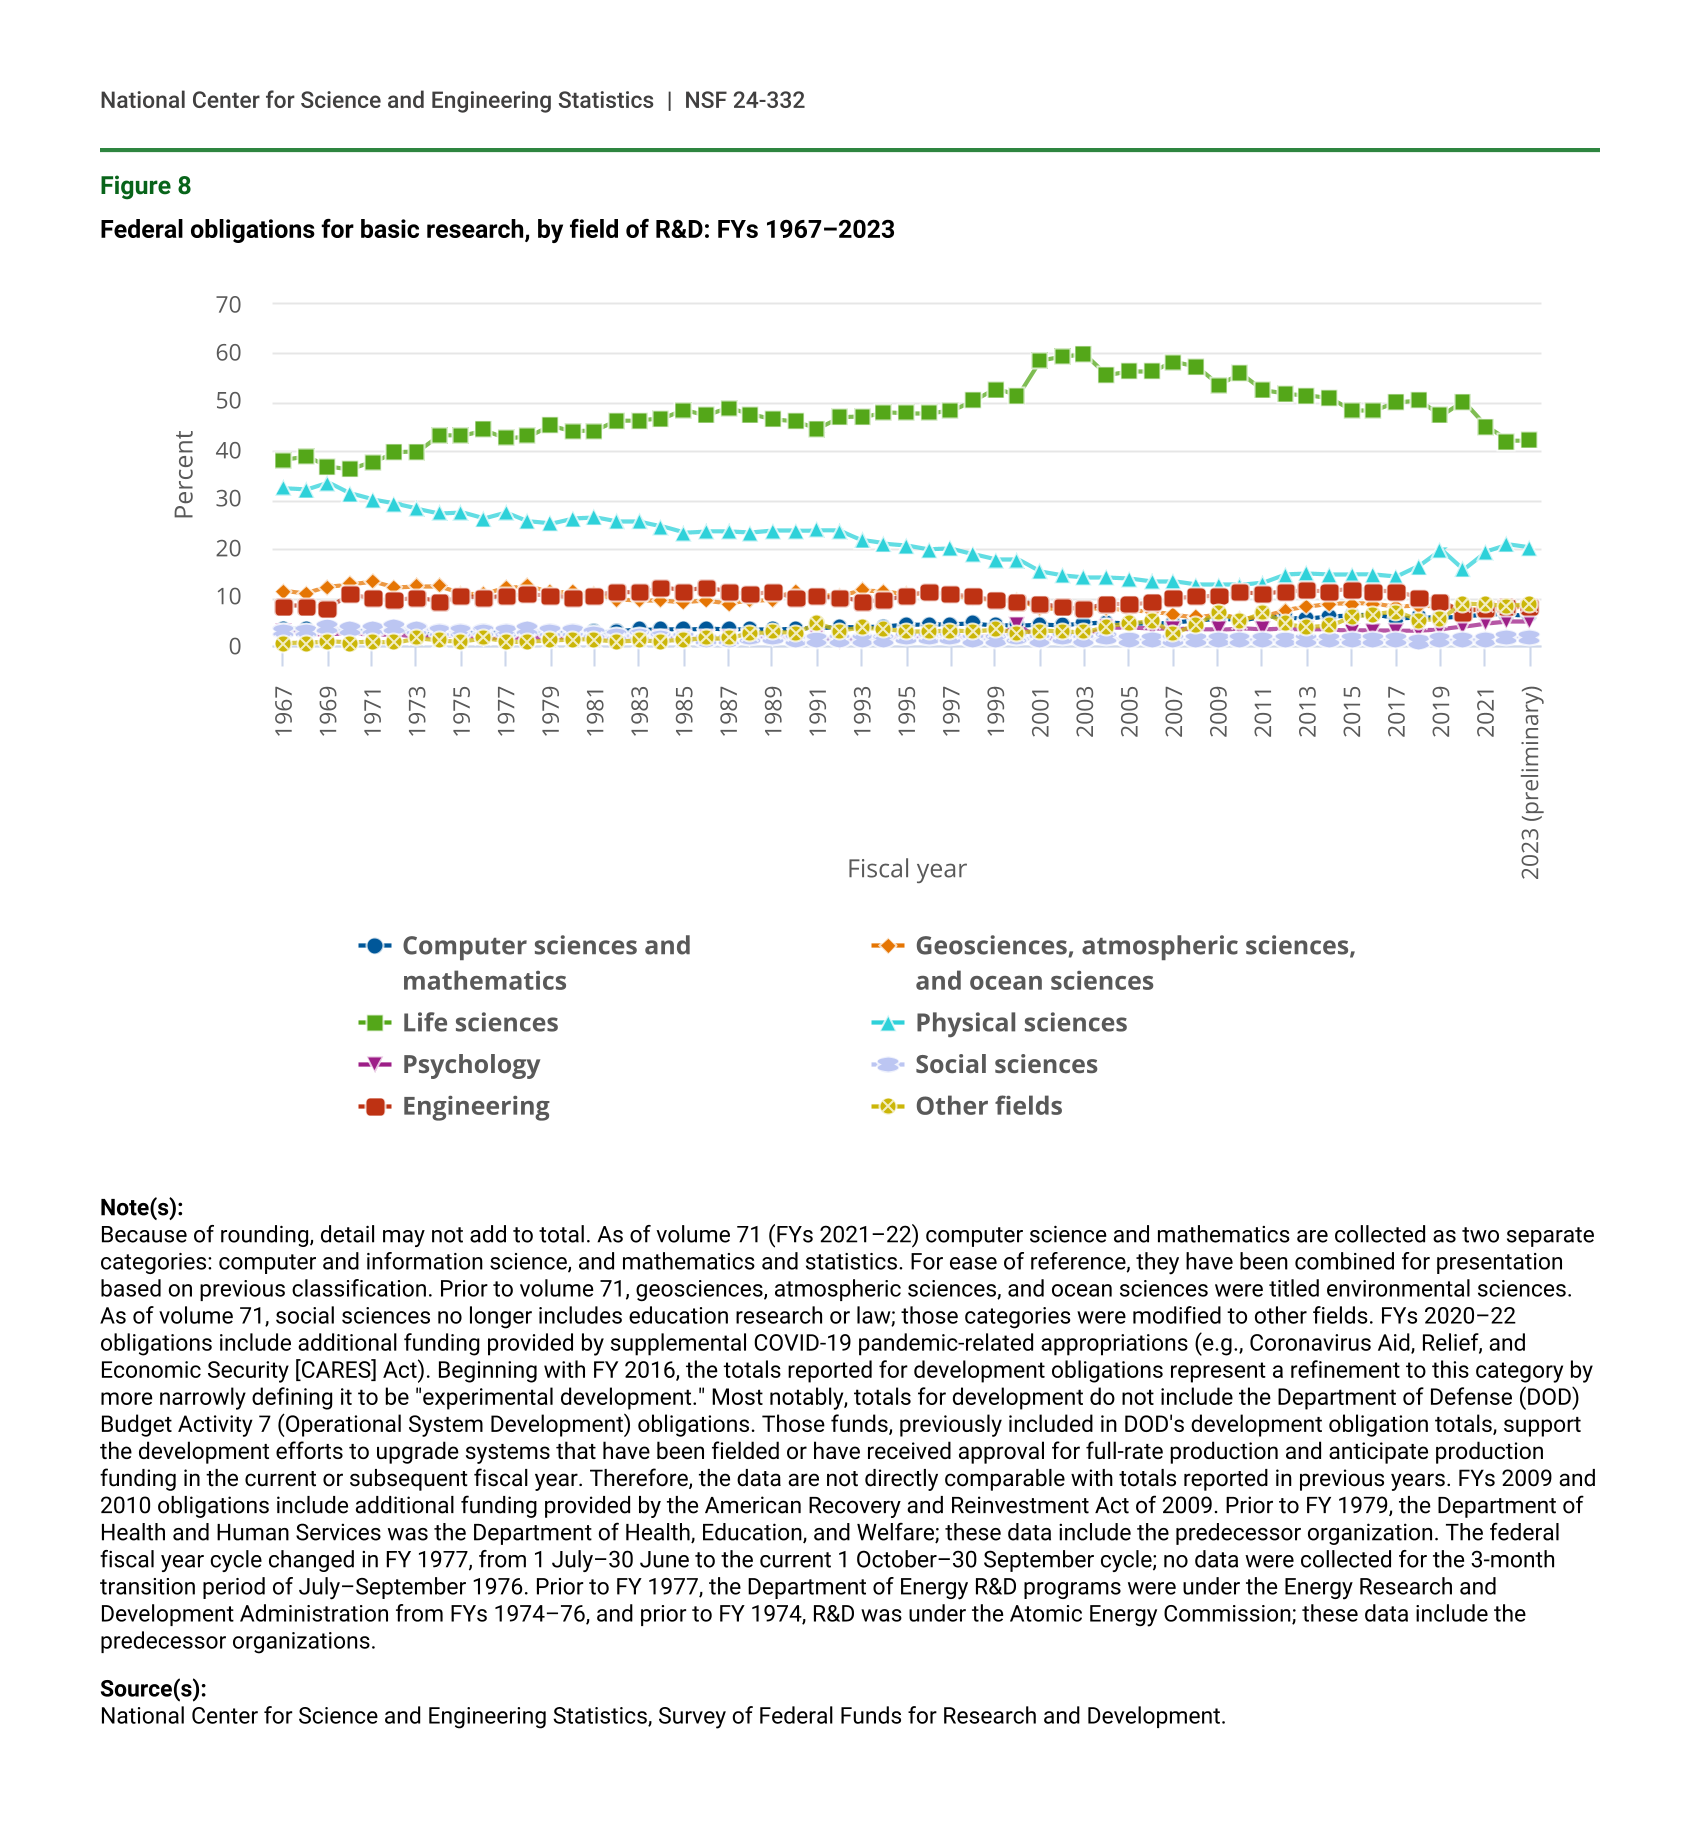
Federal Obligations for Basic Research by Fields of R&D
Federal Funds for R&D also measures federal agency obligations by type of R&D (i.e., basic research, applied research, and experimental development) and by field of R&D, formerly known as field of science and engineering. Federal funding for fields of R&D is often driven by agency mission and need. For example, given that HHS is the predominate funder of basic research among all agencies, it should come as little surprise that the majority of federal funding for basic research is in the field of life sciences, which accounted for 42% of all fields of R&D for basic research in FY 2022 (figure 8). Life sciences reached a peak of nearly 60% of all fields of R&D for basic research in FY 2003 at the end of the NIH doubling process. Life sciences includes five subcategories: agricultural sciences, biological and biomedical sciences, health sciences, natural resources and conservation, and all other life sciences.
Federal obligations for basic research, by field of R&D: FYs 1967–2023
| Fiscal year | Computer sciences and mathematics | Geosciences, atmospheric sciences, and ocean sciences | Life sciences | Physical sciences | Psychology | Social sciences | Engineering | Other fields |
|---|---|---|---|---|---|---|---|---|
| 1967 | 3.5 | 11.3 | 38.2 | 32.3 | 2.9 | 3.0 | 8.3 | 0.5 |
| 1968 | 3.6 | 10.8 | 38.9 | 32.0 | 2.5 | 3.2 | 8.3 | 0.6 |
| 1969 | 2.8 | 12.1 | 36.8 | 33.5 | 2.4 | 3.7 | 7.8 | 0.9 |
| 1970 | 3.1 | 12.6 | 36.2 | 31.2 | 2.5 | 3.3 | 10.5 | 0.6 |
| 1971 | 2.8 | 13.2 | 37.7 | 29.9 | 2.3 | 3.5 | 9.7 | 0.8 |
| 1972 | 3.0 | 12.0 | 39.7 | 29.1 | 2.4 | 3.7 | 9.4 | 0.7 |
| 1973 | 2.7 | 12.2 | 39.8 | 28.1 | 2.0 | 3.6 | 9.9 | 1.6 |
| 1974 | 2.2 | 12.2 | 43.2 | 27.2 | 1.9 | 3.1 | 9.0 | 1.1 |
| 1975 | 2.4 | 10.8 | 43.1 | 27.4 | 2.3 | 2.8 | 10.2 | 1.0 |
| 1976 | 3.0 | 10.6 | 44.2 | 26.1 | 1.6 | 3.1 | 9.9 | 1.6 |
| 1977 | 2.6 | 11.9 | 42.5 | 27.3 | 1.7 | 2.9 | 10.4 | 0.8 |
| 1978 | 2.6 | 12.2 | 42.9 | 25.5 | 1.8 | 3.4 | 10.6 | 1.0 |
| 1979 | 2.5 | 10.9 | 45.1 | 25.0 | 1.8 | 3.1 | 10.4 | 1.2 |
| 1980 | 2.5 | 11.2 | 44.0 | 26.1 | 1.8 | 3.1 | 10.0 | 1.4 |
| 1981 | 2.8 | 10.6 | 44.1 | 26.3 | 1.8 | 2.7 | 10.4 | 1.3 |
| 1982 | 3.0 | 9.5 | 46.1 | 25.4 | 1.6 | 2.2 | 11.1 | 1.0 |
| 1983 | 3.3 | 9.3 | 46.2 | 25.4 | 1.5 | 2.2 | 11.0 | 1.2 |
| 1984 | 3.4 | 9.3 | 46.5 | 24.5 | 1.5 | 1.9 | 12.0 | 1.0 |
| 1985 | 3.3 | 8.9 | 48.4 | 23.2 | 1.7 | 1.8 | 11.3 | 1.3 |
| 1986 | 3.6 | 9.2 | 47.3 | 23.5 | 1.6 | 1.4 | 11.9 | 1.5 |
| 1987 | 3.4 | 8.7 | 48.8 | 23.4 | 1.6 | 1.4 | 11.1 | 1.5 |
| 1988 | 3.3 | 9.2 | 47.5 | 23.2 | 1.9 | 1.5 | 10.6 | 2.7 |
| 1989 | 3.3 | 9.6 | 46.4 | 23.6 | 1.8 | 1.5 | 11.2 | 2.8 |
| 1990 | 3.6 | 11.3 | 45.9 | 23.6 | 1.9 | 1.3 | 9.8 | 2.7 |
| 1991 | 3.5 | 10.4 | 44.6 | 23.7 | 1.9 | 1.3 | 10.1 | 4.5 |
| 1992 | 3.9 | 10.4 | 46.8 | 23.6 | 1.0 | 1.1 | 10.0 | 3.2 |
| 1993 | 3.8 | 11.4 | 46.9 | 21.7 | 1.8 | 1.4 | 9.0 | 3.8 |
| 1994 | 3.9 | 11.2 | 47.9 | 20.9 | 1.8 | 1.4 | 9.5 | 3.4 |
| 1995 | 4.3 | 10.6 | 47.6 | 20.6 | 2.0 | 1.5 | 10.4 | 2.9 |
| 1996 | 4.4 | 10.7 | 47.6 | 19.8 | 2.0 | 1.5 | 11.1 | 2.9 |
| 1997 | 4.4 | 10.3 | 48.2 | 19.9 | 2.0 | 1.5 | 10.6 | 3.1 |
| 1998 | 4.5 | 9.8 | 50.3 | 18.8 | 2.0 | 1.4 | 10.2 | 2.9 |
| 1999 | 4.2 | 9.3 | 52.7 | 17.7 | 2.0 | 1.4 | 9.4 | 3.3 |
| 2000 | 4.1 | 9.4 | 51.3 | 17.7 | 4.2 | 1.6 | 9.0 | 2.7 |
| 2001 | 4.4 | 7.6 | 58.5 | 15.2 | 1.3 | 1.3 | 8.7 | 3.2 |
| 2002 | 4.2 | 7.7 | 59.3 | 14.4 | 2.0 | 1.5 | 7.9 | 3.0 |
| 2003 | 4.5 | 7.7 | 59.7 | 14.0 | 2.2 | 1.4 | 7.7 | 2.8 |
| 2004 | 4.7 | 7.7 | 55.5 | 14.0 | 3.7 | 1.6 | 8.7 | 4.0 |
| 2005 | 4.5 | 7.2 | 56.2 | 13.8 | 3.8 | 1.4 | 8.5 | 4.5 |
| 2006 | 4.5 | 7.0 | 56.2 | 13.2 | 3.6 | 1.4 | 8.9 | 5.2 |
| 2007 | 4.8 | 6.4 | 58.2 | 13.2 | 3.6 | 1.3 | 9.8 | 2.6 |
| 2008 | 5.2 | 5.9 | 57.3 | 12.5 | 3.4 | 1.2 | 10.1 | 4.4 |
| 2009 | 5.7 | 6.5 | 53.5 | 12.5 | 3.3 | 1.3 | 10.4 | 6.8 |
| 2010 | 5.2 | 5.6 | 55.8 | 12.5 | 3.6 | 1.1 | 11.0 | 5.1 |
| 2011 | 6.1 | 6.1 | 52.4 | 13.0 | 3.3 | 1.3 | 10.8 | 6.9 |
| 2012 | 5.8 | 7.3 | 51.7 | 14.7 | 3.5 | 1.2 | 11.2 | 4.5 |
| 2013 | 5.7 | 8.0 | 51.4 | 14.9 | 3.4 | 1.3 | 11.4 | 3.8 |
| 2014 | 6.1 | 8.7 | 50.7 | 14.7 | 3.3 | 1.2 | 11.2 | 4.1 |
| 2015 | 6.3 | 8.7 | 48.2 | 14.7 | 3.2 | 1.1 | 11.7 | 6.1 |
| 2016 | 6.5 | 8.6 | 48.2 | 14.6 | 3.1 | 1.2 | 11.3 | 6.5 |
| 2017 | 5.6 | 8.1 | 49.8 | 14.2 | 3.1 | 1.1 | 11.1 | 7.0 |
| 2018 | 5.8 | 8.3 | 50.2 | 16.4 | 3.2 | 1.0 | 9.9 | 5.2 |
| 2019 | 5.8 | 8.1 | 47.2 | 19.8 | 3.4 | 1.1 | 9.0 | 5.6 |
| 2020 | 6.1 | 7.6 | 50.1 | 15.7 | 3.9 | 1.1 | 7.0 | 8.6 |
| 2021 | 6.5 | 7.2 | 45.0 | 19.4 | 4.6 | 1.3 | 7.6 | 8.4 |
| 2022 | 6.4 | 7.6 | 42.0 | 20.8 | 5.0 | 1.7 | 8.2 | 8.3 |
| 2023 (preliminary) | 6.3 | 8.2 | 42.1 | 20.1 | 5.0 | 1.7 | 8.1 | 8.5 |
Note(s):
Because of rounding, detail may not add to total. As of volume 71 (FYs 2021–22) computer science and mathematics are collected as two separate categories: computer and information science, and mathematics and statistics. For ease of reference, they have been combined for presentation based on previous classification. Prior to volume 71, geosciences, atmospheric sciences, and ocean sciences were titled environmental sciences. As of volume 71, social sciences no longer includes education research or law; those categories were modified to other fields. FYs 2020–22 obligations include additional funding provided by supplemental COVID-19 pandemic-related appropriations (e.g., Coronavirus Aid, Relief, and Economic Security [CARES] Act). Beginning with FY 2016, the totals reported for development obligations represent a refinement to this category by more narrowly defining it to be "experimental development." Most notably, totals for development do not include the Department of Defense (DOD) Budget Activity 7 (Operational System Development) obligations. Those funds, previously included in DOD's development obligation totals, support the development efforts to upgrade systems that have been fielded or have received approval for full-rate production and anticipate production funding in the current or subsequent fiscal year. Therefore, the data are not directly comparable with totals reported in previous years. FYs 2009 and 2010 obligations include additional funding provided by the American Recovery and Reinvestment Act of 2009. Prior to FY 1979, the Department of Health and Human Services was the Department of Health, Education, and Welfare; these data include the predecessor organization. The federal fiscal year cycle changed in FY 1977, from 1 July–30 June to the current 1 October–30 September cycle; no data were collected for the 3-month transition period of July–September 1976. Prior to FY 1977, the Department of Energy R&D programs were under the Energy Research and Development Administration from FYs 1974–76, and prior to FY 1974, R&D was under the Atomic Energy Commission; these data include the predecessor organizations.
Source(s):
National Center for Science and Engineering Statistics, Survey of Federal Funds for Research and Development.Although HHS accounted for nearly 81% of all federal basic research funding for life sciences in FY 2022, USDA was the second-largest funder, accounting for 6% ($1.2 billion), followed by NSF and the Department of Veterans Affairs at 4% ($787.0 million) and 3% ($665.1 million), respectively (table 1). Although federal obligations for basic research in psychology amounts to only 5% ($2.3 billion) of all fields of R&D, it is highly concentrated within HHS, which accounted for 97% ($2.2 billion) of all basic research in psychology in FY 2022.
Federal obligations for basic research, by agency and field of R&D: FY 2022
Note(s):
Because of rounding, detail may not add to total. Only those agencies and subdivisions that had obligations in variables represented by this table appear in the table. FY 2022 obligations include additional funding provided by supplemental COVID-19 pandemic-related appropriations (e.g., Coronavirus Aid, Relief, and Economic Security [CARES] Act).
Source(s):
National Center for Science and Engineering Statistics, Survey of Federal Funds for Research and Development, FYs 2022–23.
In FY 2022, physical sciences was the second-largest field of R&D, accounting for 21% ($9.4 billion) of all federal funding for basic research. DOE accounted for 40% ($3.7 billion) of all basic research obligations for physical sciences in 2022, followed by NASA at 35% ($3.4 billion) and NSF at 14% ($1.3 billion). Federal obligations for basic research in geosciences, atmospheric sciences, and ocean sciences; engineering; and other fields, each accounted for approximately 8% of all federal funds. NASA and NSF were the largest contributors to geosciences, atmospheric sciences, and ocean sciences with 46% ($1.6 billion) and 30% ($1.0 billion), respectively. HHS and DOD were the largest funders of basic research in engineering at 45% ($1.7 billion) and 28% ($1.0 billion), respectively. In FY 2022, basic research in computer and information sciences accounted for 5% ($2.3 billion) of all obligations for basic research, with DOE accounting for 44% ($1.0 billion) and NSF accounting for 34% ($776.0 million) of federal finding for this field of R&D.
Federal Obligations for Basic Research by Type of Performer
Although the National Patterns report presents data on R&D expenditures by performing sector and source of funds (e.g., federal government and businesses), the Federal Funds for R&D Survey present data on obligations from the federal government for R&D to several performing sectors. Although federal agencies are both performers and funders for R&D, the majority (68%, or $30.8 billion) of federal obligations for basic research in FY 2022 were directed to extramural performers of R&D—namely, businesses, higher education institutions, nonprofit organizations, state and local governments, and other non-U.S. performers or foreign performers (table 2). Among intramural performers, namely, federal agencies and federally funded research and development centers (FFRDCs), DOE was the predominant funder in FY 2022 with $4.7 billion; however, of this amount, $4.5 billion was directed toward FFRDCs. HHS followed with $4.6 billion, of which $4.2 billion was directed toward federal agencies’ facilities and laboratories. Although obligations for intramural basic research at federal agencies totaled $7.8 billion in FY 2022, HHS accounted for 54% ($4.2 billion). However, with regard to FFRDCs, DOE accounted for 66% ($4.5 billion) of total basic research to FFRDCs ($6.7 billion).
Federal obligations for basic research, by agency and performer: FY 2022
FFRDCs = federally funded research and development centers.
a Federal agencies' activities cover costs associated with the administration of federal R&D performance and R&D procurements from nonfederal performers by federal personnel, transfers of funds to other federal agencies for purposes related to R&D, and actual federal performance.
b Higher education includes both public and private institutions as well as University Affiliated Research Centers.
Note(s):
Because of rounding, detail may not add to total. Only those agencies and subdivisions that had obligations in variables represented by this table appear in the table. FY 2022 obligations include additional funding provided by supplemental COVID-19 pandemic-related appropriations (e.g., Coronavirus Aid, Relief, and Economic Security [CARES] Act).
Source(s):
National Center for Science and Engineering Statistics, Survey of Federal Funds for Research and Development, FYs 2022–23.
As the predominant funder of basic research across all federal agencies, HHS continues to have a larger share of funding to extramural performers of R&D. For example, when it comes to federal obligations in FY 2022, HHS accounted for 31% ($1.2 billion) to the business sector, 58% ($12.8 billion) to higher education institutions, 81% ($3.2 billion) to nonprofit organizations, 87% ($472.1 million) to state and local governments, and 66% ($131.0 million) to non-U.S. performers. NASA was the second-largest funder to the business sector for basic research in FY 2022, followed by DOD. NSF was the second-largest funder of basic research to higher education institutions and nonprofit organizations.
Conclusion
Federal obligations for basic research, in both current dollars and constant 2017 dollars, are the highest they have been since NCSES began keeping records of federal obligations by type of R&D in 1952 (figure 9). The fact that federal obligations are a smaller share within the scope of total U.S. R&D performance is indicative of growth in the U.S. economy and increased funding for basic research by the business sector rather than any decline or dramatic change in federal science and technology policy. Indeed, basic research has increased as a share of federally funded R&D performance, federal R&D authority, and federal R&D obligations.
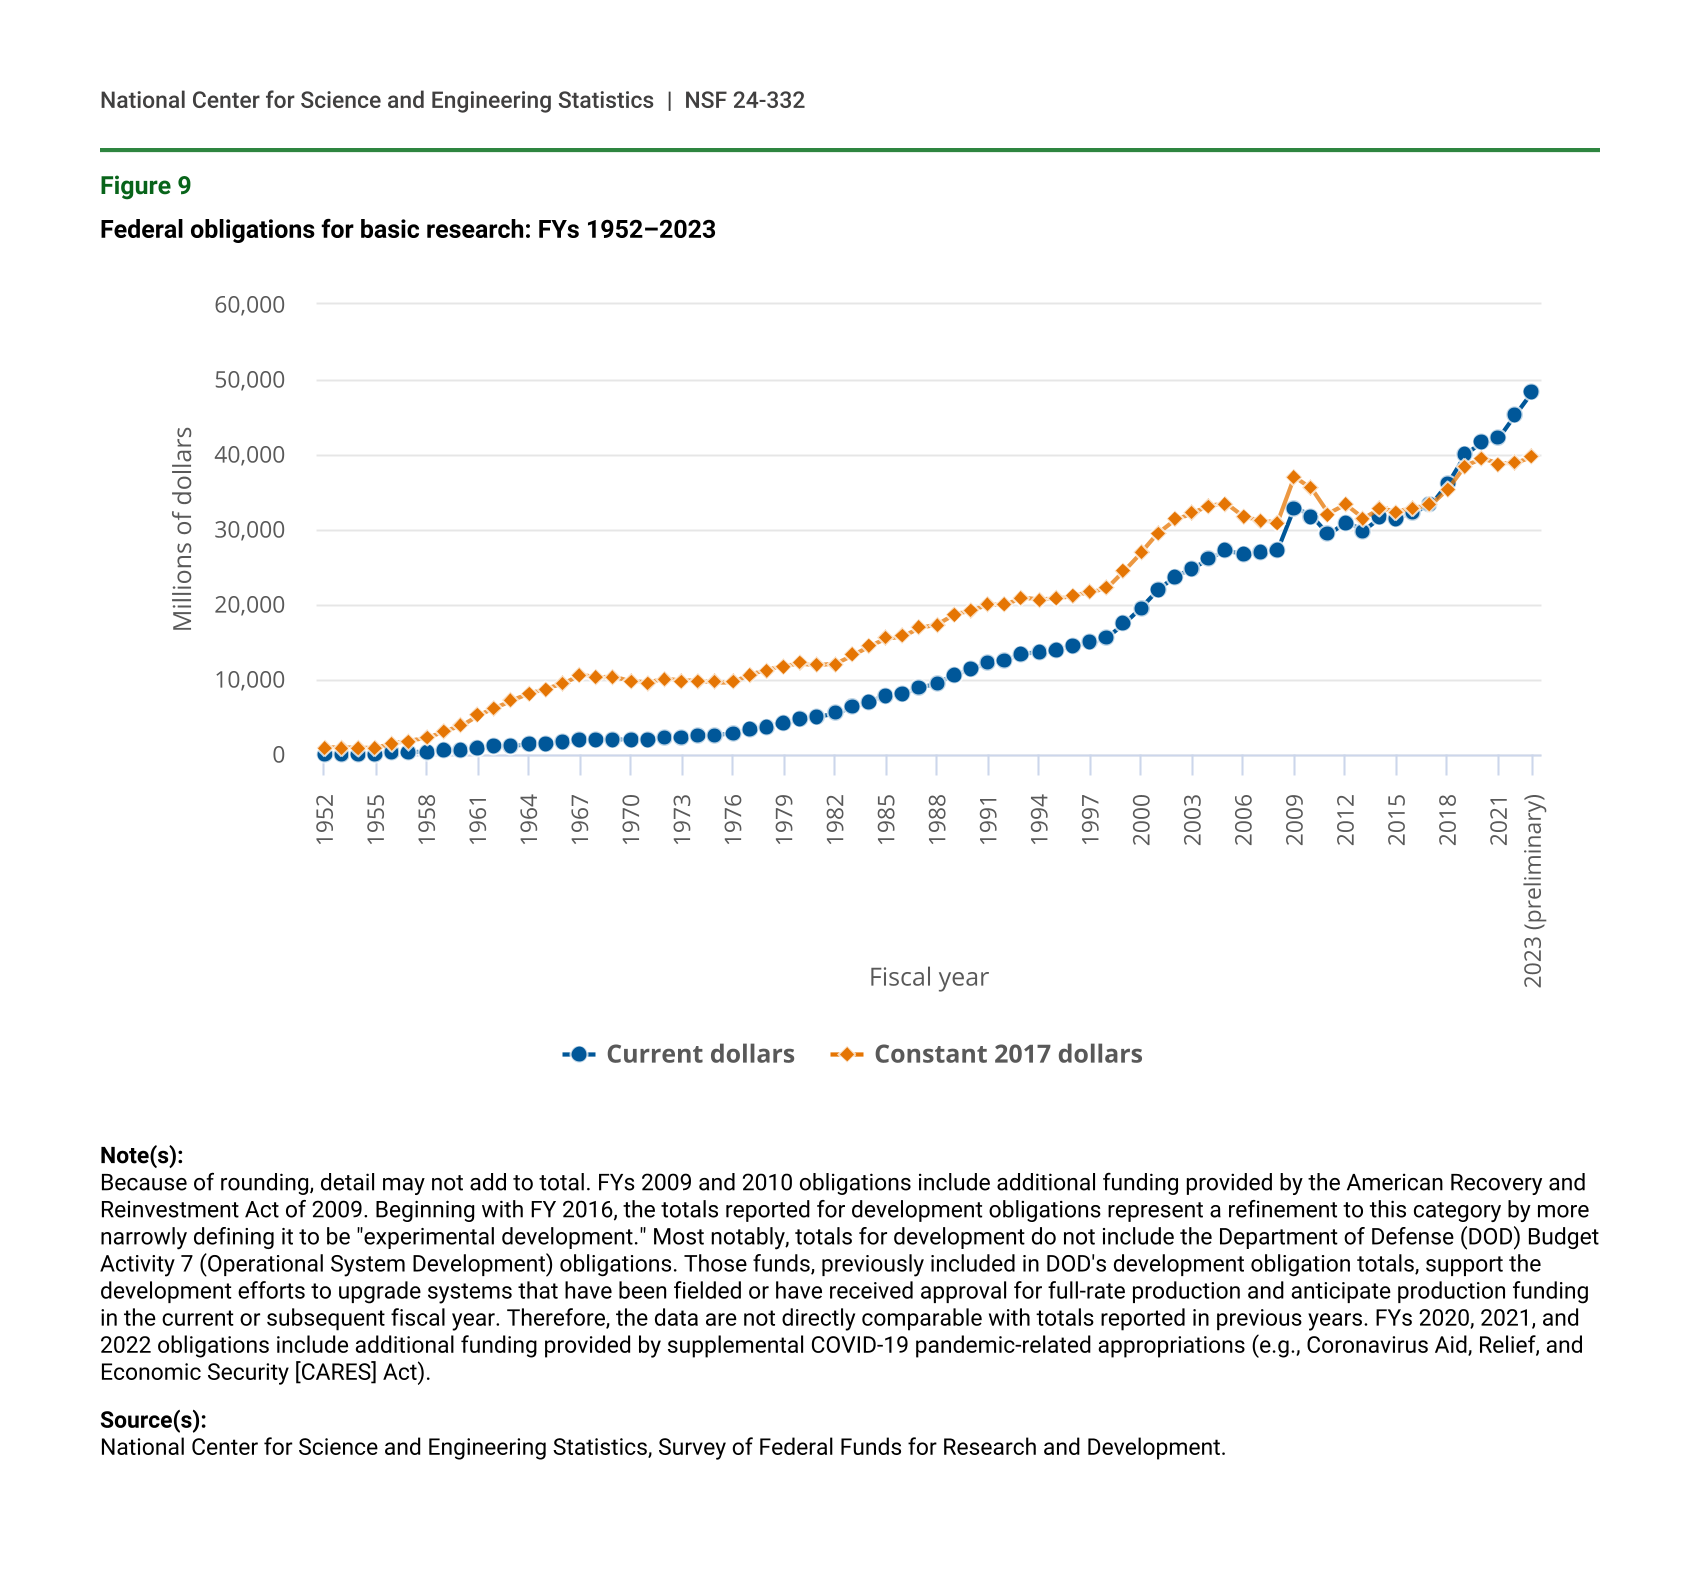
Federal obligations for basic research: FYs 1952–2023
| Fiscal year | Current dollars | Constant 2017 dollars |
|---|---|---|
| 1952 | 121 | 916 |
| 1953 | 116 | 863 |
| 1954 | 116 | 853 |
| 1955 | 130 | 949 |
| 1956 | 206 | 1,469 |
| 1957 | 262 | 1,799 |
| 1958 | 335 | 2,227 |
| 1959 | 466 | 3,056 |
| 1960 | 590 | 3,819 |
| 1961 | 815 | 5,198 |
| 1962 | 986 | 6,231 |
| 1963 | 1,152 | 7,189 |
| 1964 | 1,303 | 8,038 |
| 1965 | 1,435 | 8,705 |
| 1966 | 1,579 | 9,372 |
| 1967 | 1,846 | 10,633 |
| 1968 | 1,841 | 10,242 |
| 1969 | 1,945 | 10,350 |
| 1970 | 1,926 | 9,732 |
| 1971 | 1,980 | 9,520 |
| 1972 | 2,187 | 10,036 |
| 1973 | 2,232 | 9,820 |
| 1974 | 2,388 | 9,806 |
| 1975 | 2,588 | 9,633 |
| 1976 | 2,767 | 9,629 |
| 1977 | 3,259 | 10,573 |
| 1978 | 3,699 | 11,245 |
| 1979 | 4,193 | 11,794 |
| 1980 | 4,674 | 12,094 |
| 1981 | 5,041 | 11,879 |
| 1982 | 5,482 | 12,077 |
| 1983 | 6,260 | 13,215 |
| 1984 | 7,067 | 14,403 |
| 1985 | 7,819 | 15,418 |
| 1986 | 8,153 | 15,724 |
| 1987 | 8,942 | 16,869 |
| 1988 | 9,474 | 17,310 |
| 1989 | 10,602 | 18,620 |
| 1990 | 11,286 | 19,122 |
| 1991 | 12,171 | 19,910 |
| 1992 | 12,490 | 19,933 |
| 1993 | 13,399 | 20,894 |
| 1994 | 13,523 | 20,637 |
| 1995 | 13,877 | 20,737 |
| 1996 | 14,464 | 21,214 |
| 1997 | 14,942 | 21,533 |
| 1998 | 15,613 | 22,222 |
| 1999 | 17,444 | 24,524 |
| 2000 | 19,570 | 26,952 |
| 2001 | 21,958 | 29,526 |
| 2002 | 23,668 | 31,332 |
| 2003 | 24,751 | 32,149 |
| 2004 | 26,121 | 33,119 |
| 2005 | 27,140 | 33,395 |
| 2006 | 26,585 | 31,682 |
| 2007 | 26,866 | 31,160 |
| 2008 | 27,154 | 30,853 |
| 2009 | 32,879 | 36,980 |
| 2010 | 31,795 | 35,454 |
| 2011 | 29,314 | 32,044 |
| 2012 | 30,959 | 33,239 |
| 2013 | 29,779 | 31,403 |
| 2014 | 31,588 | 32,713 |
| 2015 | 31,527 | 32,316 |
| 2016 | 32,293 | 32,838 |
| 2017 | 33,271 | 33,271 |
| 2018 | 36,195 | 35,409 |
| 2019 | 40,017 | 38,437 |
| 2020 | 41,547 | 39,392 |
| 2021 | 42,266 | 38,741 |
| 2022 | 45,393 | 38,887 |
| 2023 (preliminary) | 48,467 | 39,704 |
Note(s):
Because of rounding, detail may not add to total. FYs 2009 and 2010 obligations include additional funding provided by the American Recovery and Reinvestment Act of 2009. Beginning with FY 2016, the totals reported for development obligations represent a refinement to this category by more narrowly defining it to be "experimental development." Most notably, totals for development do not include the Department of Defense (DOD) Budget Activity 7 (Operational System Development) obligations. Those funds, previously included in DOD's development obligation totals, support the development efforts to upgrade systems that have been fielded or have received approval for full-rate production and anticipate production funding in the current or subsequent fiscal year. Therefore, the data are not directly comparable with totals reported in previous years. FYs 2020, 2021, and 2022 obligations include additional funding provided by supplemental COVID-19 pandemic-related appropriations (e.g., Coronavirus Aid, Relief, and Economic Security [CARES] Act).
Source(s):
National Center for Science and Engineering Statistics, Survey of Federal Funds for Research and Development.
Data Sources, Limitations, and Availability
The statistics on U.S. R&D are from National Patterns. These data derive mainly from integrating the data on R&D expenditures and funding collected by NCSES’s annual national surveys of the organizations that perform and fund the vast majority of U.S. R&D. These surveys cover each of four sectors of the economy: higher education, government, business enterprise, and nonprofit organizations. In some cases, the primary data from these surveys are adjusted to enable consistent integration of the statistics across these separately conducted surveys. The 2022 business R&D data are based on respondents’ projected R&D costs and will be revised when actual R&D costs are collected in the following year. In addition, preliminary or otherwise estimated values may be used where final data from one or more of the surveys are not yet available but can reasonably be estimated. Estimates in this InfoBrief are based on census and sample survey data that are subject to nonsampling error. Sample-survey–based estimates are also subject to sampling error. Comparisons based on sample-survey-based estimates were not tested for statistical significance.
The R&D surveys include NCSES’s annual surveys of business R&D (the Business Enterprise Research and Development Survey for 2019–21, the preceding Business Research and Development Survey for 2017–18, the Business R&D and Innovation Survey for 2008–16, and the Survey of Industrial R&D for 2007 and earlier years). In addition, the business R&D totals include the R&D expenditures reported by “micro” companies (defined as companies with fewer than 10 employees) through NCSES surveys fielded for 2016 and forward (the 2016 Business R&D and Innovation Survey—Microbusiness and the Annual Business Survey (ABS) since 2017). Other NCSES survey data sources are the Higher Education Research and Development Survey (for FYs 2010–20), the preceding Survey of R&D Expenditures at Universities and Colleges (FY 2009 and earlier years), the Federal Funds for R&D Survey (FYs 2020–21 and earlier years), and the FFRDC Research and Development Survey (FY 2020 and earlier years). Amounts for the R&D performed by nonprofit organizations with funding from the nonprofit sector and from business sources are estimated based on data and parameters from the FY 2021 Nonprofit Research Activities (NPRA) module of the ABS, the 2016 NPRA Survey, and the 1996–97 Survey of R&D Funding and Performance by Nonprofit Organizations. For more information, see the Technical Notes at https://ncses.nsf.gov/data-collections/national-patterns/2021-2022#technical-notes. A full set of data tables and methodology information for the National Patterns data are available at https://ncses.nsf.gov/data-collections/national-patterns/2021-2022.
The statistics on federal budget authority for R&D are from the Budget Function report. These data are based on the budget information that federal agencies provide to the Office of Management and Budget for the federal budget-making process. The data for FY 2022 mainly reflect the final appropriations levels. The statistics for FY 2023 are preliminary and draw on the federal agency estimates based on final funding levels passed as a consolidated spending bill on 29 December 2022: the Consolidated Appropriations Act, 2023 (H.R. 2617; Public Law 117-328). The data for FY 2024 draw mainly from the president’s proposed budget for the U.S. government in FY 2024 (publicly released 9 March 2023) but also include subsequent information from the executive branch and agency budget offices. As a result, the budget numbers for individual activities, programs, or agencies may differ from those published in the president’s proposed budget or agency budget documents. In general, the agencies’ estimates of funding for R&D in FYs 2022 and 2023 that stem from the CHIPS and Science Act (H.R. 4346) and the Inflation Reduction Act (H.R. 5376) are not independently documented and cannot be separated from the appropriations totals. Additionally, congressionally funded projects (known in the Senate as Congressionally Directed Spending and in the House as Community Project Funding) were reintroduced in FY 2022 and contributed to substantial increases in R&D for some agencies. In general, agency reporting on funding for R&D in FYs 2020–22 stemming from COVID-19 pandemic appropriations was uneven and incomplete. Notes accompanying many of the data tables indicate the extent to which funding from these supplementary appropriations are recognized in the reported data. For more information on budget function and classifying R&D, see Budget Function’s Technical Notes at https://ncses.nsf.gov/data-collections/federal-budget-function/2022-2024#technical-notes. A full set of data tables and methodology information on federal budget authority are available at https://ncses.nsf.gov/data-collections/federal-budget-function/2022-2024#data.
The statistics on federal obligations for R&D are from the Federal Funds for R&D Survey. This survey is a census of all federal agencies that fund R&D programs, as identified from information in the president’s budget submission to Congress, excluding the Central Intelligence Agency. Federal agencies that fund R&D are identified in Analytical Perspectives, Budget of the United States Government, Fiscal Year 2023. Data were obtained from 32 federal agencies that had obligations for R&D during FY 2022 or FY 2023. Because multiple subdivisions of some federal departments completed the survey, there were agency-level responses from 6 federal departments, 48 agencies (within another 8 federal departments), and 18 independent agencies. However, lower offices could also be authorized to enter data. When these suboffices are included, there were 725 total respondents.
Although the Federal Funds for R&D Survey is a census of federal agencies that fund R&D and there is no sampling error, survey data are still subject to some degree of unmeasured nonsampling error, which may include errors in classification or measurement of certain aspects of an agencies R&D. For additional information, see the section Survey Quality Measures within the Technical Notes of the survey at https://ncses.nsf.gov/surveys/federal-funds-research-development/2022-2023#technical-notes. The full set of data tables for FY 2022 are available at https://ncses.nsf.gov/surveys/federal-funds-research-development/.
The data from all of these sources are all released annually on the NCSES website at https://ncses.nsf.gov/.
This product has been reviewed for unauthorized disclosure of confidential information under NCSES-DRN24-039.
Notes
1Anderson G; National Center for Science and Engineering Statistics (NCSES). 2024. U.S. R&D Increased by $72 Billion in 2021 to $789 Billion; Estimate for 2022 Indicates Further Increase to $886 Billion. NSF 24-317. Alexandria, VA: U.S. National Science Foundation. Available at https://ncses.nsf.gov/pubs/nsf24317/.
2National Center for Science and Engineering Statistics, National Patterns of R&D Resources (annual series): table 6. Available at https://ncses.nsf.gov/pubs/nsf24318/table/6.
3National Patterns data are presented on a calendar year approximations based on fiscal year data, and all other data in this InfoBrief show fiscal years.
4For more information on the NIH doubling, see https://crsreports.congress.gov/product/pdf/R/R43341.
5Data are adjusted to 2017 constant dollars from the National Center for Science and Engineering Statistics, National Patterns of R&D Resources (annual series): table 7, U.S. basic research expenditures by source of funds and performing section: 1953–2022. Gross domestic product implicit price deflators (2017 = 1.00000) were used to adjust current dollars for inflation.
6For more information, see Circular A-11: Preparation, Submission, and Execution of the Budget, Section 20.4; Office of Management and Budget, 2023. Available at https://www.whitehouse.gov/wp-content/uploads/2018/06/a11_web_toc.pdf.
7Budget function classifications are intended to provide a means of arraying budget data according to the major purposes served. These functions include all spending for a given topic, regardless of the federal agency that oversees the individual federal program. For more information, see Budget Function Classifications: Origins, Trends, and Implications for Current Uses, U.S. General Accounting Office, February 1998, GAO/AIMD-98-67.
8For details, see Budget Function: table 23 in the full set of tables at https://ncses.nsf.gov/data-collections/federal-budget-function/2022-2024#data.
9Congress took a number of legislative steps from March 2020 through March 2021 to provide added appropriations in response to the COVID-19 pandemic, some of which increased funding for related R&D. These include the Coronavirus Preparedness and Response Supplemental Appropriations Act, 2020 (H.R. 6074, 6 March 2020); the Families First Coronavirus Response Act (H.R. 6201, 18 March 2020); the Coronavirus Aid, Relief, and Economic Security Act (H.R. 748, 27 March 2020); and the Paycheck Protection Program and Health Care Enhancement Act (H.R. 266, 24 April 2020). Additional funding for R&D related to COVID-19 was also provided by the Consolidated Appropriations Act, 2021 (H.R. 133, 27 December 2020) and by the American Rescue Plan Act of 2021 (H.R. 1319, 10 March 2021).
10As part of the annual budget process, the federal government designates funds for R&D to help foster knowledge and innovation within the nation. This funding is classified into 20 functional categories. For more information on federal budget functional categories see Circular A-11: Preparation, Submission, and Execution of the Budget, Exhibit 79A; Office of Management and Budget, 2023. Available at https://www.whitehouse.gov/wp-content/uploads/2018/06/a11_web_toc.pdf.
11For details, see table 1 in the full set of Federal Funds for R&D Survey tables at https://ncses.nsf.gov/surveys/federal-funds-research-development/2022-2023#data.
12Obligations represent the amount for orders placed, contracts awarded, services received, and similar transactions during a given period, regardless of when the funds were appropriated or when future payment of money is required.
13The Department of Health, Education, and Welfare was re-organized in 1979, creating the new Department of Education and the Department of Health and Human Services.
14Effective with volume 71 (FYs 2021 and 2022), the Federal Funds for R&D Survey was redesigned and the fields of science and engineering were revised to the fields of R&D. For a crosswalk of changes from fields of science and engineering to fields of R&D, see technical table A-3, Crosswalk for the Survey of Federal Funds for Research and Development: Volume 70 to Volume 71 at https://ncses.nsf.gov/surveys/federal-funds-research-development/2022-2023#technical-tables.
15In FY 2022, HHS accounted for 81% of all basic research funding for life sciences. For details, see table 29 in the full set of Federal Funds for R&D Survey tables at https://ncses.nsf.gov/surveys/federal-funds-research-development/2022-2023#data.
16For details, see table 29 in the full set of Federal Funds for R&D Survey tables at https://ncses.nsf.gov/surveys/federal-funds-research-development/2022-2023#data.
17In addition to obligations for the conduct of R&D at an agency’s own facilities and laboratories, the federal agency performer category also includes agencies’ administrative costs to manage extramural R&D programs and transfers to other federal agencies for the conduct of R&D. The final disposition of these transferred funds may be intramural by the receiving agency or may be issued as grants or contracts by the receiving agency as extramural R&D. However, federal reporting guidelines instruct the originating agency to report these funds.
18For further details on the correspondence between sectors used to measure R&D and those used in the System of National Accounts, see the Frascati Manual 2015: Guidelines for Collecting and Reporting Data on Research and Experimental Development https://doi.org/10.1787/9789264239012-en.
19Estimates from the NCSES business and nonprofit organization R&D surveys mentioned are all derived from sample data and thereby contain sampling error. Consequently, estimates of total U.S. R&D also contain sampling error. For more information on this topic and other surveys used in the National Patterns tabulations, see the Technical Notes at https://ncses.nsf.gov/data-collections/national-patterns/2021-2022#technical-notes.
20See chapter 18, Research and Development, Analytical Perspectives, Budget of the United States Government, Fiscal Year 2024. Available at https://www.whitehouse.gov/wp-content/uploads/2023/03/ap_6_research_fy2024.pdf.
Suggested Citation
Pece CV, Anderson GW; National Center for Science and Engineering Statistics (NCSES). 2024. Analysis of Federal Funding for Research and Development in 2022: Basic Research. NSF 24-332. Alexandria, VA: U.S. National Science Foundation. Available at https://ncses.nsf.gov/pubs/nsf24332.
Contact Us
NCSES
National Center for Science and Engineering Statistics
Directorate for Social, Behavioral and Economic Sciences
U.S. National Science Foundation
2415 Eisenhower Avenue, Suite W14200
Alexandria, VA 22314
Tel: (703) 292-8780
FIRS: (800) 877-8339
TDD: (800) 281-8749
E-mail: ncsesweb@nsf.gov
NSF 24-332
|August 15, 2024