 An official website of the United States government
 National Totals
Of the $2.4 billion in state government agency R&D expenditures in FY 2019, 77% came from state and other nonfederal sources; the remainder came from federal sources (table 1). Although state governments are both funders and performers of R&D, the majority (72%) of their expenditures support extramural R&D (i.e., performers other than state agencies). Higher education institutions were the primary recipients of these expenditures, receiving 59% of all extramural funding, followed by companies and individuals (25%). Intramural performers of R&D, the state agencies themselves, totaled $676 million in FY 2019, an increase of 6% from the $635 million in FY 2018.
Expenditures for R&D plant (construction projects, major building renovations, major equipment purchases, and land and building acquisitions intended primarily for R&D use) totaled $10 million in FY 2019, down from $14 million reported in FY 2018. R&D plant expenditures are highly variable year to year and will increase or decrease as capital projects begin or end.
State Government R&D Funding and Performance
Overview
Although all state governments had R&D expenditures in FY 2019, the amounts are often concentrated in a handful of states. Specifically, six states (California, New York, Texas, Florida, Ohio, and Pennsylvania) accounted for 64% of all state government R&D expenditures (table 3). Expenditures also vary by state between intramural and extramural R&D. For example, 62% ($277 million) of New York’s R&D expenditures are directed toward intramural performance, whereas 86% ($454 million) of California’s R&D is directed toward extramural performers.
State government expenditures for R&D, by state and performer type: FY 2019
a State R&D expenditures do not include R&D plant.
b Intramural performers include a department’s or agency’s own employees who perform R&D and services performed by others in support of an internal R&D project.
c Extramural performers are those outside the department or agency who perform R&D.
d Companies and individuals include individuals under contract for research projects.
e Other includes federal government; nonprofit organizations; city, county, regional, or other local governments; and other state governments.
f U.S. total reflects all 50 states and the District of Columbia.
Source(s):
National Center for Science and Engineering Statistics, Survey of State Government Research and Development, FY 2019.
Intramural R&D Performance
Six states accounted for 70% of the $676 million in expenditures for intramural R&D performed by all state agencies in FY 2019: New York ($277 million), California ($73 million), Florida ($51 million), South Carolina ($29 million), Oregon ($25 million), and Connecticut ($25 million) (table 3). In FY 2019, 42% ($284 million) of all state agency intramural R&D performance was supported by federal funds. New York was recipient of the greatest share at 47% ($134 million) of all federal funds for state-agency performed R&D. South Carolina received the second-largest amount of federal funds used for state agency intramural R&D with $20 million.
The majority (78%) of state government intramural R&D performance in FY 2019 was directed toward applied research ($524 million), whereas basic research constituted approximately 19% ($129 million) of intramural R&D and experimental development was 3% ($23 million) (table 1). All state governments except Michigan and Nevada reported a portion of their intramural R&D as applied research.
Extramural R&D Performance
Six states accounted for 65% of the total $1.8 billion in FY 2019 state government expenditures for extramural R&D performance: California ($454 million), Texas ($229 million), New York ($172 million), Florida ($120 million), Ohio ($79 million), and Pennsylvania ($76 million) (table 3). However, states varied in how they distributed extramural R&D. For example, Texas state agencies directed 86% of their extramural funding for R&D toward higher education institutions ($197 million) compared with 13% ($31 million) to companies and individuals. By comparison, California’s distribution of extramural R&D funding is relatively balanced across the three sectors with 35% ($159 million) directed toward higher education, 41% ($187 million) toward companies and individuals, and 24%, ($107 million) toward other performers.
R&D by State Government Functions
Whether performed by state agencies themselves or by others performers outside the agency, most states reported a broad mix of R&D projects related to state government functions: agriculture, energy, environment and natural resources, health, and transportation (table 2). Health-related R&D expenditures account for the largest share (45%) of state agencies’ R&D. Although health-related R&D declined 2% in FY 2019, it had increased each year starting in FY 2014 to an all-time high in FY 2018. Environment and natural resources R&D expenditures accounted for 19% of total state government R&D expenditures in FY 2019. Transportation, agriculture, and all other projects’ shares of total R&D expenditures in FY 2019 were 11%, 6%, and 7%, respectively. As a result of state government participation in the Federal Highway Administration Transportation Pooled Funding Program, all states received some federal funding to support transportation-related R&D projects.
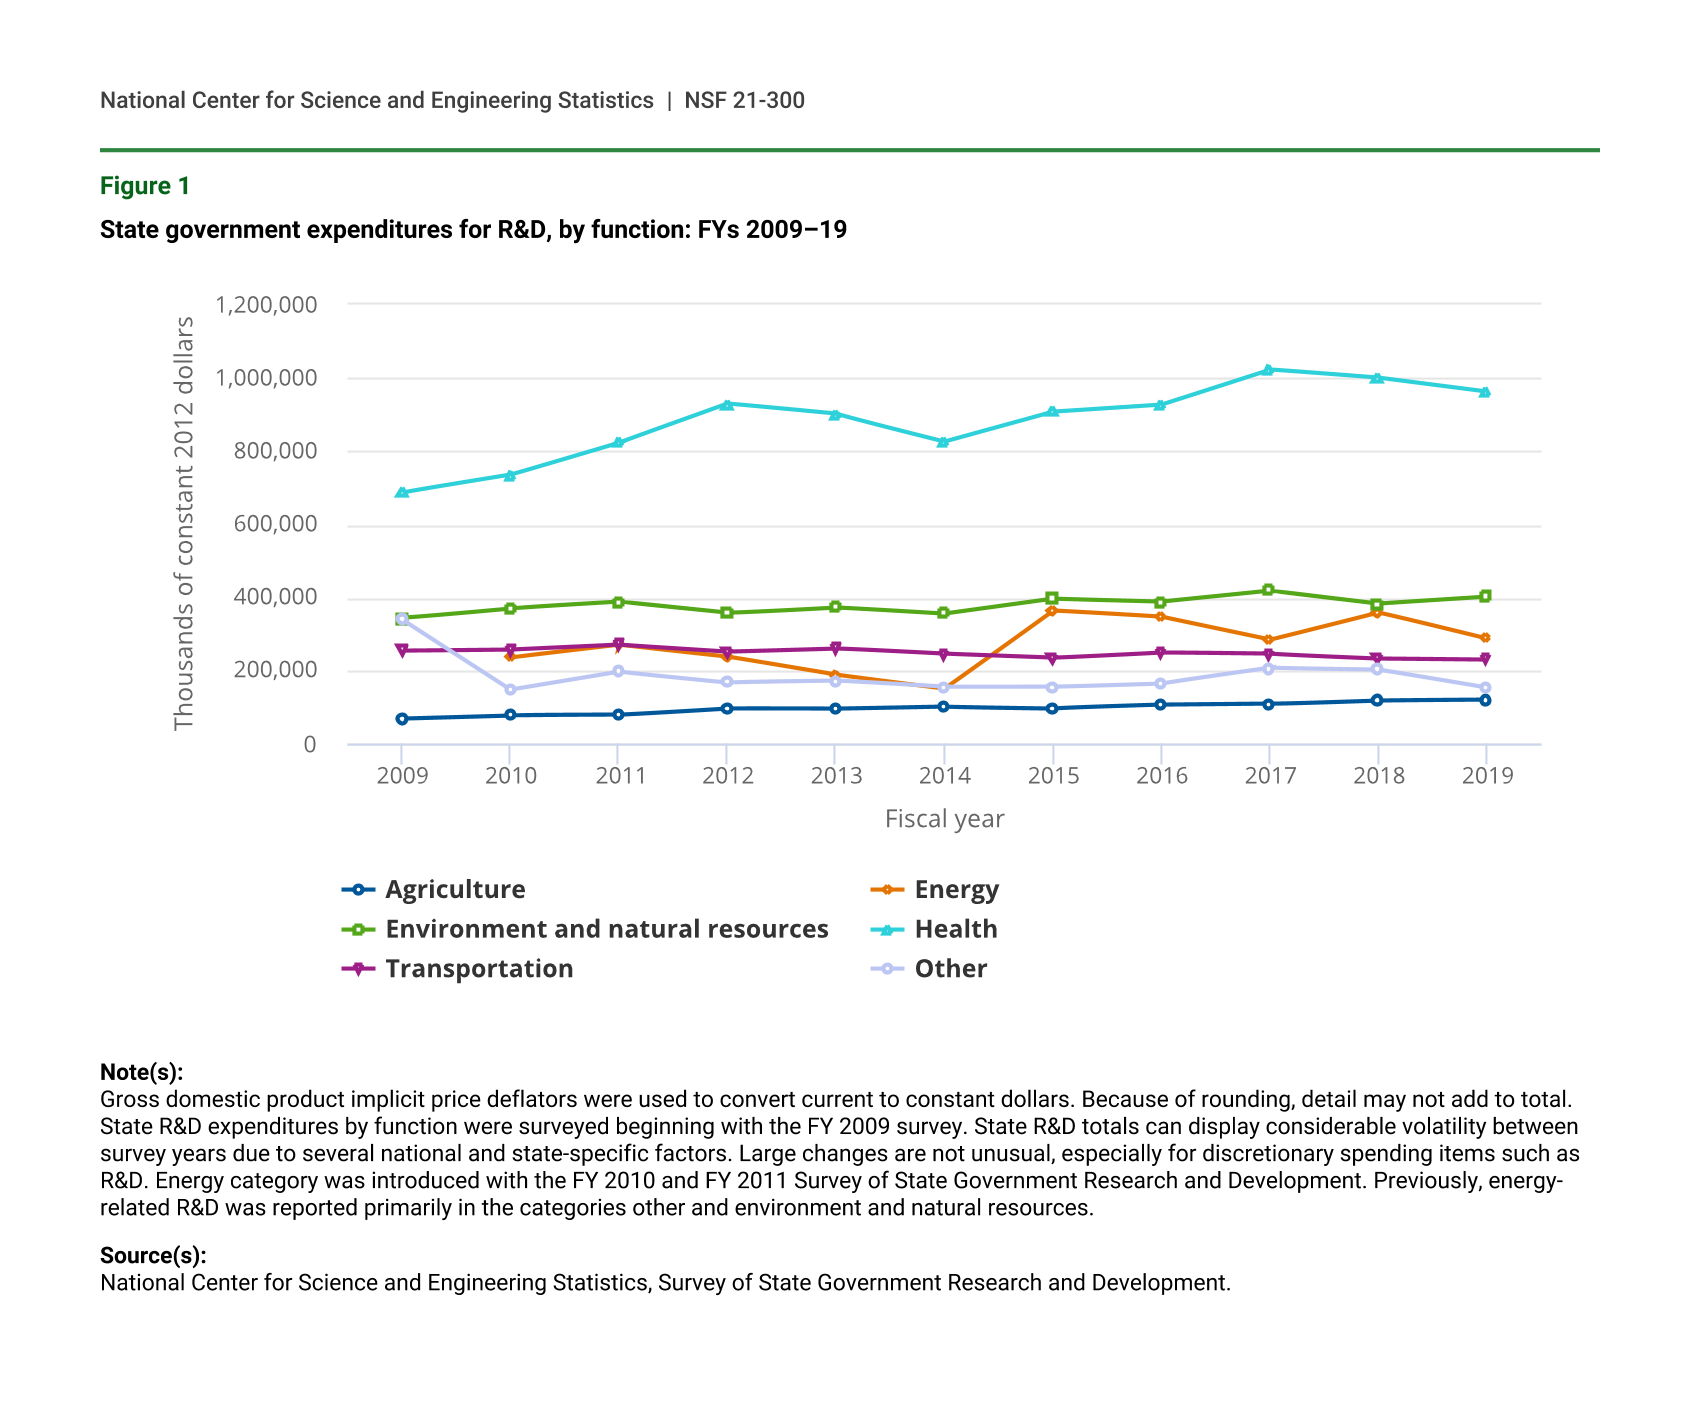
Inflation Adjusted 10-Year Time Series
Among all functions, health-related R&D has shown the largest change between FY 2009 and FY 2019 (figure 1). When adjusted for inflation, health R&D expenditures increased 40%, from $687 million in FY 2009 to $962 million in FY 2019. During the same 10-year period, R&D expenditures related to agriculture and environment and natural resources increased 74% and 17%, respectively, whereas transportation decreased 9%, from $254.0 million in FY 2009 to $231 million in FY 2019. The energy function was not collected separately until FY 2010, but it has shown increases in inflation-adjusted expenditures of 22% from FY 2010 to FY 2019.
State government expenditures for R&D, by function: FYs 2009–19
| Fiscal year | Agriculture | Energy | Environment and natural resources | Health | Transportation | Other |
|---|---|---|---|---|---|---|
| 2009 | 69,674 | NA | 343,923 | 686,827 | 253,967 | 340,036 |
| 2010 | 78,040 | 236,338 | 370,613 | 734,626 | 257,038 | 148,639 |
| 2011 | 78,798 | 270,681 | 387,586 | 822,782 | 270,533 | 197,680 |
| 2012 | 96,579 | 238,546 | 357,528 | 928,731 | 252,070 | 168,807 |
| 2013 | 95,558 | 188,904 | 373,375 | 900,444 | 260,717 | 172,576 |
| 2014 | 101,461 | 151,431 | 355,691 | 826,358 | 245,371 | 155,336 |
| 2015 | 97,253 | 364,901 | 396,305 | 907,884 | 234,829 | 156,192 |
| 2016 | 105,995 | 347,426 | 388,715 | 927,397 | 249,784 | 165,500 |
| 2017 | 108,973 | 285,293 | 418,504 | 1,022,912 | 246,239 | 207,516 |
| 2018 | 119,094 | 359,896 | 383,330 | 1,000,029 | 234,245 | 203,393 |
| 2019 | 121,284 | 287,350 | 402,161 | 962,170 | 231,215 | 153,817 |
Note(s):
Gross domestic product implicit price deflators were used to convert current to constant dollars. Because of rounding, detail may not add to total. State R&D expenditures by function were surveyed beginning with the FY 2009 survey. State R&D totals can display considerable volatility between survey years due to several national and state-specific factors. Large changes are not unusual, especially for discretionary spending items such as R&D. Energy category was introduced with the FY 2010 and FY 2011 Survey of State Government Research and Development. Previously, energy-related R&D was reported primarily in the categories other and environment and natural resources.
Source(s):
National Center for Science and Engineering Statistics, Survey of State Government Research and Development.
Agency-Specific R&D Details
Of all 711 state agencies that responded to the survey in FY 2019, the largest 20, by total expenditures, accounted for 59% of all agency R&D expenditures (table 4). To illustrate how concentrated expenditures are for health-related R&D, these 20 agencies accounted for $898 million of the $1.1 billion in state agency health R&D, or 83% of the R&D funding total. Although most states invest in health-related R&D, it is still highly concentrated. The six largest health agencies reporting R&D expenditures in FY 2019 constitute 72% of all state government health-related R&D. State expenditures for energy-related R&D is even more concentrated: the California Energy Commission alone accounted for 51% of all state agencies’ energy-related R&D expenditures. In the case of agriculture, the five largest agencies constitute 39% ($53 million) of all state government investment in agricultural R&D, while the five largest agencies in environment and natural resources and in transportation account for 36% ($161 million) and 35% ($90 million), respectively.
Individual state agency expenditures for R&D for the 20 largest agencies, by function: FY 2019
a U.S. total reflects all 50 states and the District of Columbia.
Note(s):
Includes state agency funding from all sources for both intramural and extramural performance. Detail may not add to total because of rounding.
Source(s):
National Center for Science and Engineering Statistics, Survey of State Government Research and Development, FY 2019.
Data Sources and Limitations
Data presented in this InfoBrief are in current dollars, unless specifically cited that they have been adjusted for inflation. All 50 states and the District of Columbia participated in the FY 2019 survey, and 711 of the 747 selected agencies (95%) responded to the survey. Puerto Rico agencies did not report to the survey for FY 2019. Data for the FY 2019 survey were collected for NCSES by the U.S. Census Bureau under an interagency agreement.
Most states’ fiscal year begins on 1 July and ends the following 30 June. For example, FY 2018 begins on 1 July 2017 and ends on 30 June 2018. There are, however, five exceptions to the 30 June fiscal year end: New York (ends 31 March), Texas (ends 31 August), and Alabama, Michigan, and the District of Columbia (ends 30 September). Data presented in this InfoBrief are for each of the respective fiscal year (12 months) periods as defined by the states.
Terms such as state, state government, and state agencies have equivalent meaning and are used interchangeably throughout this InfoBrief. The amounts reported here are for R&D expenditures of state government departments, agencies, public authorities, institutions, and other dependent entities that operate separately or somewhat autonomously from the central state government. State government R&D totals can display considerable volatility between survey years due to several national and state-specific factors. Large changes are not unusual, especially for discretionary spending items such as R&D.
Amounts reported do not include direct appropriations from state legislatures to universities, colleges, and private organizations. As a result, the $1.1 billion in FY 2019 expenditures reported by state agencies to support R&D performance by academic institutions differs from the figure reported by universities and colleges in the NCSES Higher Education R&D Survey for expenditures on R&D activities funded from state and local government sources.
State- and agency-specific data not available in this InfoBrief are available in the full set of data tables from this survey in the report State Government Research and Development: FY 2019 at https://ncses.nsf.gov/pubs/nsf21301/.
Notes
1State agency expenditures directed toward higher education institutions under this survey do not include direct state appropriations to colleges and universities.
2Data on intramural R&D by source of funds are available in data table 5, available at https://ncses.nsf.gov/pubs/nsf21301/.
3Data for state government expenditures for intramural R&D, by state and type of R&D (i.e., basic research, applied research, and experimental development) are available in data table 7, available at https://ncses.nsf.gov/pubs/nsf21301/.
4Data on federal funding for R&D by federal department or agency are available in data table 16, available at https://ncses.nsf.gov/pubs/nsf21301/.
5Gross domestic product implicit price deflators were used to convert current to constant 2012 dollars. Data on federal fiscal year, historical figures, 1953–2018 can be found in Office of Management and Budget. 2019. Budget of the U.S. Government, Fiscal Year 2020. Historical Tables (Table 10.1). Available at https://www.govinfo.gov/features/budget-fy2020. Data on projections for 2019–21 can be found in Office of Management and Budget. 2020. Economic and Budget Analyses. In Analytical Perspectives, Budget of the U.S. Government, Fiscal Year 2021. Available at https://www.whitehouse.gov/wp-content/uploads/2020/02/ap_2_assumptions_fy21.pdf.
6The energy category was introduced with the FY 2010 and FY 2011 Survey of State Government Research and Development. Previously, energy-related R&D was reported primarily in the other category, and to some degree in the environment and natural resources category.
7Data on individual state agency expenditures by function are available in data table 21, available at https://ncses.nsf.gov/pubs/nsf21301/.
Suggested Citation
Pece C; National Center for Science and Engineering Statistics (NCSES). 2020. State Government R&D Expenditures Decline 4% in FY 2019; Health-Related R&D Declines 2%. NSF 21-300. Alexandria, VA: National Science Foundation. Available at https://ncses.nsf.gov/pubs/nsf21300/.
Contact Us
NCSES
National Center for Science and Engineering Statistics
Directorate for Social, Behavioral and Economic Sciences
National Science Foundation
2415 Eisenhower Avenue, Suite W14200
Alexandria, VA 22314
Tel: (703) 292-8780
FIRS: (800) 877-8339
TDD: (800) 281-8749
E-mail: ncsesweb@nsf.gov