 An official website of the United States government
Postdoc Employment at Federally Funded Research and Development Centers Increased 12% between 2017 and 2019
Federally funded research and development centers (FFRDCs) are some of the preeminent research facilities in the United States. Postdoctoral researchers (postdocs) perform high-level research in FFRDCs while gaining additional training to advance both their careers and strategic federal research. Of the nation’s 42 FFRDCs, 24 reported employing postdocs in 2019. In total, these 24 FFRDCs employed 3,335 postdocs. Since 2012, the number of postdocs working at FFRDCs has grown by 542 individuals—almost a 20% increase during this period, with a 12% increase since 2017. Overall, the FFRDCs that employ postdocs are expanding the postdoctoral training available at their centers and influencing an increasing number of early career scholars.
The data in this report are from the 2019 Survey of Postdocs at Federally Funded Research and Development Centers (FFRDC Postdoc Survey). This survey provides information about the demographic characteristics, sources of financial support, and fields of research of postdocs working at FFRDCs. It is conducted in conjunction with the Survey of Graduate Students and Postdoctorates in Science and Engineering, which is sponsored by the National Center for Science and Engineering Statistics (NCSES) within the National Science Foundation (NSF) and by the National Institutes of Health. The FFRDC Postdoc Survey provides some of the only publicly available data on the research training of early career doctorates at FFRDCs. The postdocs employed by FFRDCs represent an important part of the science and engineering workforce in the United States.
Postdoc Employment by FFRDC Sponsoring Agency and Administrator
FFRDCs conduct research and development (R&D) and related activities in support of a federal agency’s mission. They are intended to provide R&D capabilities that cannot be met by the federal government or the private sector alone. Currently, 13 federal agencies sponsor the 42 FFRDCs, with the Department of Energy and the Department of Defense sponsoring a majority of the FFRDCs (16 and 10, respectively). Over 90% of the 3,335 postdocs employed at FFRDCS in 2019 were working at Department of Energy–sponsored research facilities (see table 1).
FFRDCs are operated, managed, and administered by either a university, nonprofit organization, or an industrial firm. Among the FFRDCs with a postdoc program, those administered by universities employed the largest percentage of postdocs (41.9 %), followed by those administered by industrial firms (30.7%), and those administered by nonprofit organizations (27.3%). The growth in postdoc counts since 2012 has occurred across all three types of FFRDC administration.
Postdocs at federally funded research and development centers, by FFRDC type and sponsoring agency: 2012–19
FFRDC = federally funded research and development center.
a The Master Government List contains 42 FFRDCs. In the FFRDC Postdocs Survey, two FFRDCs are surveyed together.
b While there was no change in the number of FFRDCs between the 2015 and 2017 surveys, the Homeland Security Studies and Analysis Institute was replaced by the Homeland Security Operational Analysis Center.
Source(s):
National Center for Science and Engineering Statistics, Survey of Postdocs at Federally Funded Research and Development Centers.
Postdoc Fields of Research at FFRDCs
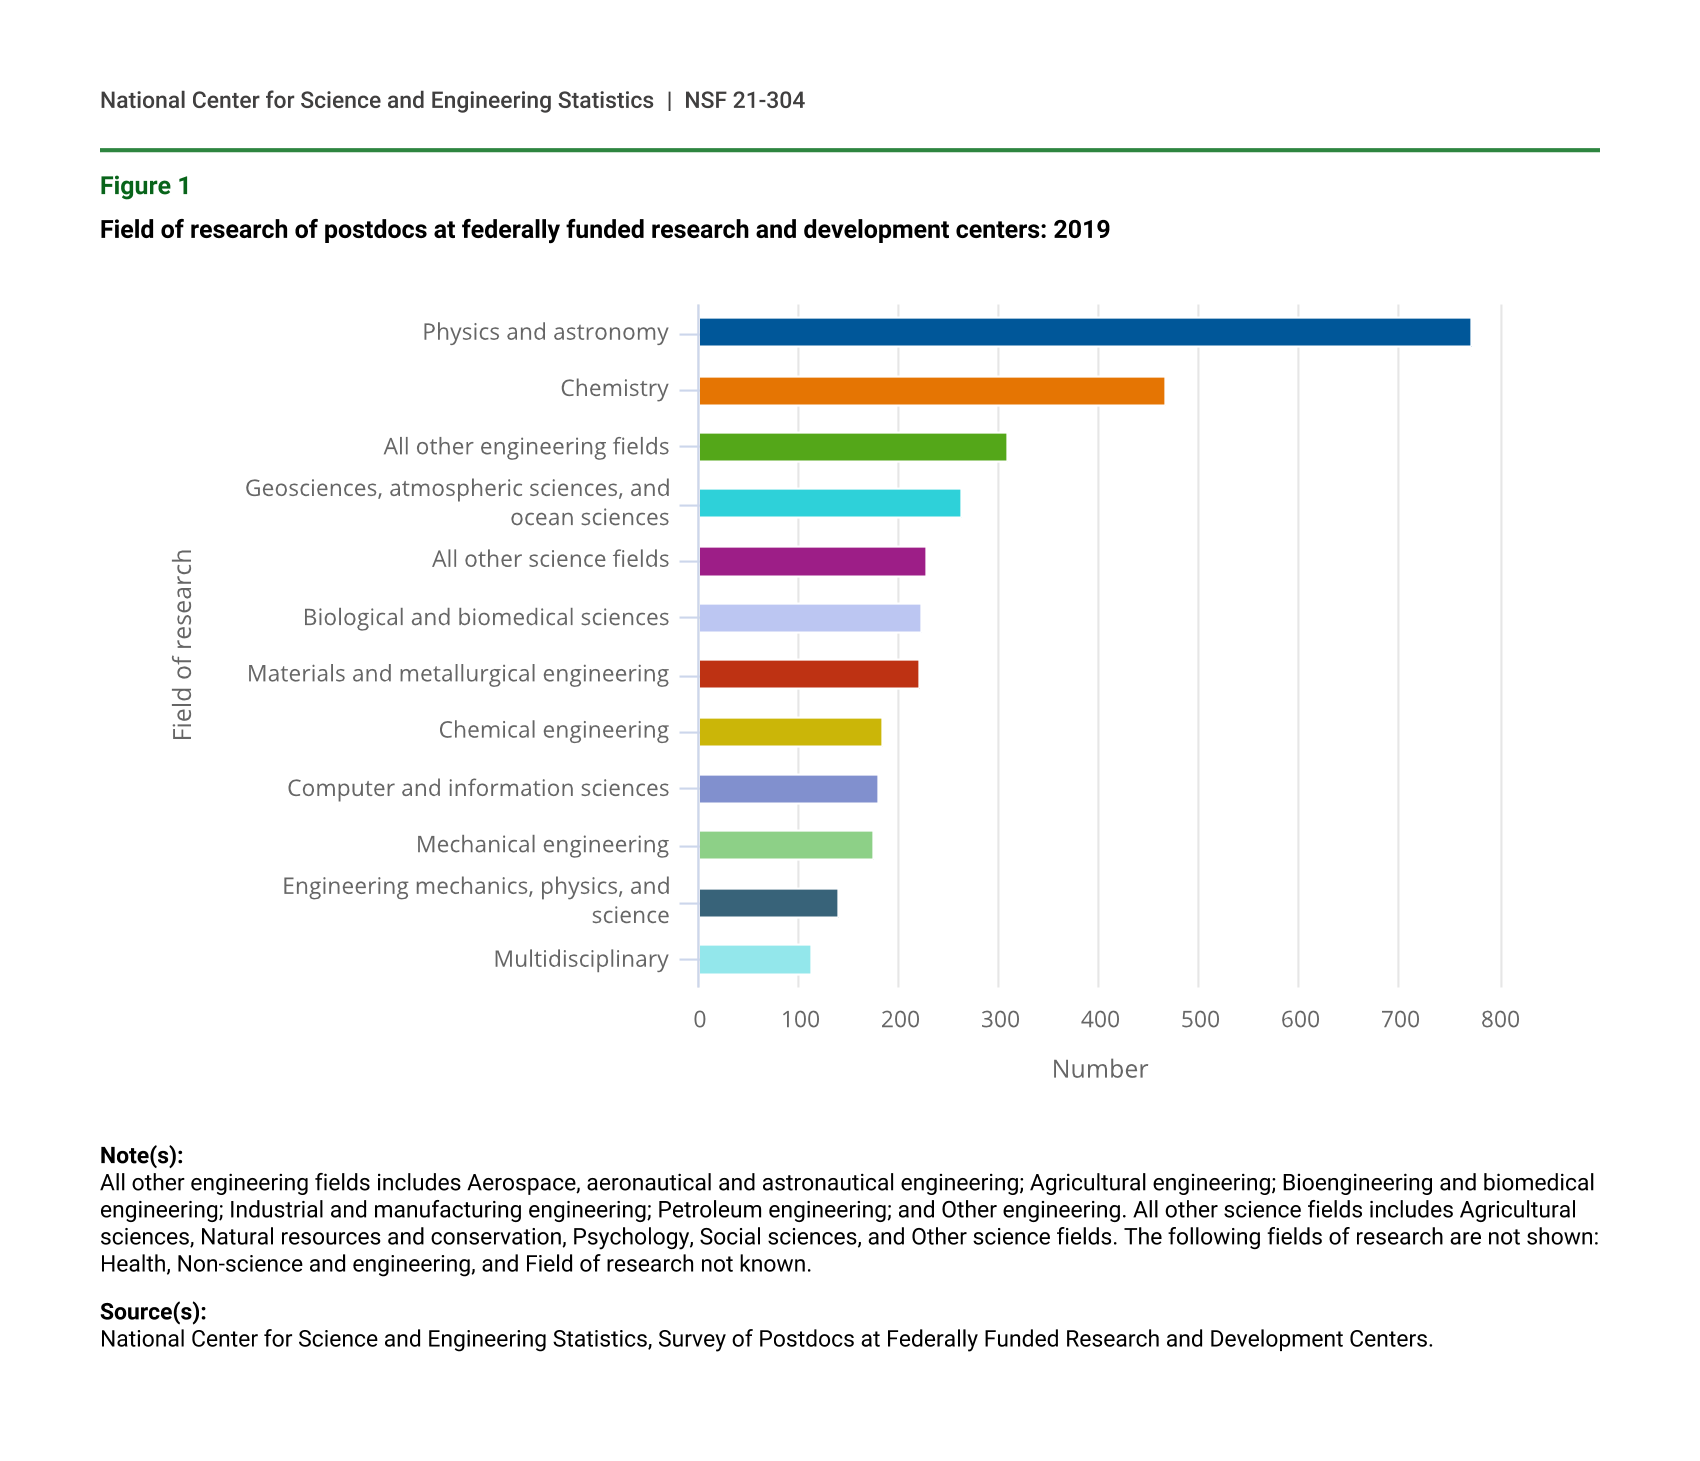
Science and engineering (S&E) fields accounted for 94.7% of all research performed by FFRDC postdocs in 2019. The most common research fields among postdocs reported by the FFRDCs include physics and astronomy (23.2%) and chemistry (14.0%), both physical science disciplines. Geosciences, atmospheric sciences, and ocean sciences was the next largest research field with 7.9% of the postdocs engaged in this area of research. (See figure 1 and table 2.)
The number of postdocs doing research in science fields in 2019 is similar to that in 2012 (2,132 postdocs compared with 2,108), although the percentage has declined about 12 points. The growth in FFRDC postdoc research is happening in engineering fields, which increased from a 22% share in 2012 to 31% in 2019. Additionally, 113 postdocs (3.4%) conducted multidisciplinary research in 2019. Together, these trends indicate that FFRDC postdocs are doing research and being trained in a more diverse set of fields than in 2012, including nontraditional or noncategorical research.
Field of research of postdocs at federally funded research and development centers: 2019
| Field of research | Total |
|---|---|
| Physics and astronomy | 773 |
| Chemistry | 467 |
| All other engineering fields | 308 |
| Geosciences, atmospheric sciences, and ocean sciences | 262 |
| All other science fields | 228 |
| Biological and biomedical sciences | 222 |
| Materials and metallurgical engineering | 221 |
| Chemical engineering | 183 |
| Computer and information sciences | 180 |
| Mechanical engineering | 176 |
| Engineering mechanics, physics, and science | 140 |
| Multidisciplinary | 113 |
Note(s):
All other engineering fields includes Aerospace, aeronautical and astronautical engineering; Agricultural engineering; Bioengineering and biomedical engineering; Industrial and manufacturing engineering; Petroleum engineering; and Other engineering. All other science fields includes Agricultural sciences, Natural resources and conservation, Psychology, Social sciences, and Other science fields. The following fields of research are not shown: Health, Non-science and engineering, and Field of research not known.
Source(s):
National Center for Science and Engineering Statistics, Survey of Postdocs at Federally Funded Research and Development Centers.
Field of research of postdocs at federally funded research and development centers: 2012 and 2019
* = value < 0.05%; na = not applicable.
a Natural resources and conservation was added in 2017.
Source(s):
National Center for Science and Engineering Statistics, Survey of Postdocs at Federally Funded Research and Development Centers.
Demographic Characteristics of Postdocs
The number of women employed as postdocs in FFRDCs increased between 2012 and 2019, as did the number of men (see table 3). While women gained 1.5 percentage points of the share of the total postdocs employed at FFRDCs, they continue to comprise only about a quarter of FFRDC postdocs. For context, the relatively low rate of women’s employment as FFRDC postdocs is similar to the percentage of U.S. doctorates awarded to women in related fields. From 2014 to 2018, women earned 30.3% of U.S. research doctorates in the physical sciences and 23.6% in engineering.
Postdocs at federally funded research and development centers, by sex, citizenship, race, and ethnicity: 2012–19
a Race and ethnicity data are available only for U.S. citizens and permanent residents.
b All other races includes American Indian or Alaska Native, Native Hawaiian or Other Pacific Islander, and More than one race.
Source(s):
National Center for Science and Engineering Statistics, Survey of Postdocs at Federally Funded Research and Development Centers.
Temporary visa holders remain the majority of FFRDC postdocs (57.2%), although their number is slightly lower (1.5 percentage points) than in 2012. The percentage of FFRDC postdocs who are temporary visa holders is higher than the annual percentage of U.S. doctorates awarded to temporary visa holders in S&E fields. The proportion of S&E doctorates awarded to temporary visa holders peaked at 41% in 2007, but overall it has held steady at around 36% since 2011. About one-fourth of the temporary visa holder postdocs at FFRDCs with S&E doctorates are women, a similar percentage as for U.S. citizens and permanent residents (27%).
Among U.S. citizens and permanent residents, the numbers of FFRDC postdocs in almost all racial and ethnic groups grew between 2012 and 2019. While the number of Black or African American postdocs at FFRDCs more than doubled during this period and the number of Hispanic or Latino postdocs increased by 41%, these two groups combined make up less than 5% of the postdocs at FFRDCs in 2019. By comparison, for the 5-year period from 2014 to 2018, Hispanics or Latinos earned 5.5% of U.S. research doctorates in the physical sciences, and Blacks or African Americans earned 3.0%. In engineering, Hispanics or Latinos earned 6.5% of doctorates and Blacks or African Americans earned 4.0%. These recent doctorates form the hiring pool of U.S. doctorate recipients that FFRDCs can draw upon for postdoc positions in these fields.
Data Sources, Limitations, and Availability
The 2019 FFRDC Postdoc Survey collected data from FFRDCs listed in the April 2019 Master Government List of FFRDCs. This list is maintained by NSF and available at https://www.nsf.gov/statistics/ffrdclist/. Representatives from each FFRDC report data on the number of postdocs employed at the institution; data reported to the survey are categorized by citizenship, sex, ethnicity and race, source of financial support, and fields of research. The reference date of the most recent survey is 1 October 2019; the survey is conducted in conjunction with the Survey of Graduate Students and Postdoctorates in Science and Engineering, which is sponsored by NCSES within NSF and by the National Institutes of Health.
The FFRDC Postdoc Survey defines a postdoc as an appointee who holds a PhD or equivalent doctoral degree; whose doctorate was awarded recently, generally within the past 5 years; whose appointment is for a limited term, generally no more than 5–7 years; who works under the supervision of a senior researcher; and whose appointment is primarily for the purpose of training in research or scholarship.
Use caution when assessing trend data because data comparability are affected by changes in how FFRDCs define their postdocs, maintain their administrative data, and report unknown responses.
Detailed data from this survey are available at https://www.nsf.gov/statistics/srvyffrdcpd/. For more information on the FFRDC Postdoc Survey, please contact NCSES author Michael Yamaner.
Notes
1For more information on the federal policy regarding the establishment, use, review, and termination of federally funded research and development centers (FFRDCs), see Code of Federal Regulations, Title 48, Part 35, Section 35.017.
2National Center for Science and Engineering Statistics (NCSES). 2020. Science and Engineering Degrees, by Race and Ethnicity of Recipients: 2005–15, tables 13 and 15. Alexandria, VA: National Science Foundation. Available at https://ncsesdata.nsf.gov/sere/2018/.
3National Center for Science and Engineering Statistics (NCSES). 2019. Doctorate Recipients from U.S. Universities: 2018, section U.S. Doctorate Awards, “Citizenship.” NSF 20-301. Alexandria, VA: National Science Foundation. Available at https://ncses.nsf.gov/pubs/nsf20301/report/u-s-doctorate-awards#citizenship.
4Race and ethnicity are collected only for U.S. citizens and permanent residents in this survey as well as in the Survey of Earned Doctorates. For the numbers of doctorate recipients, see table 16 in National Center for Science and Engineering Statistics. 2020. Science and Engineering Degrees, by Race and Ethnicity of Recipients: 2008–18. Alexandria, VA: National Science Foundation. Available at https://ncsesdata.nsf.gov/sere/2018/.
Suggested Citation
Stoetzel JM, Arbeit C, Yamaner MI; National Center for Science and Engineering Statistics. 2020. Postdoc Employment at Federally Funded Research and Development Centers Increased 12% between 2017 and 2019. NSF 21-304. Alexandria, VA: National Science Foundation. Available at https://ncses.nsf.gov/pubs/nsf21304/.
Contact Us
NCSES
National Center for Science and Engineering Statistics
Directorate for Social, Behavioral and Economic Sciences
National Science Foundation
2415 Eisenhower Avenue, Suite W14200
Alexandria, VA 22314
Tel: (703) 292-8780
FIRS: (800) 877-8339
TDD: (800) 281-8749
E-mail: ncsesweb@nsf.gov