 An official website of the United States government
 Fields of study
As researchers expand their understanding of the world, new fields of study emerge and existing fields change. Observing which fields of study are attracting growing proportions of students can provide early insight into where future research breakthroughs may occur.
Field of study trends
S&E
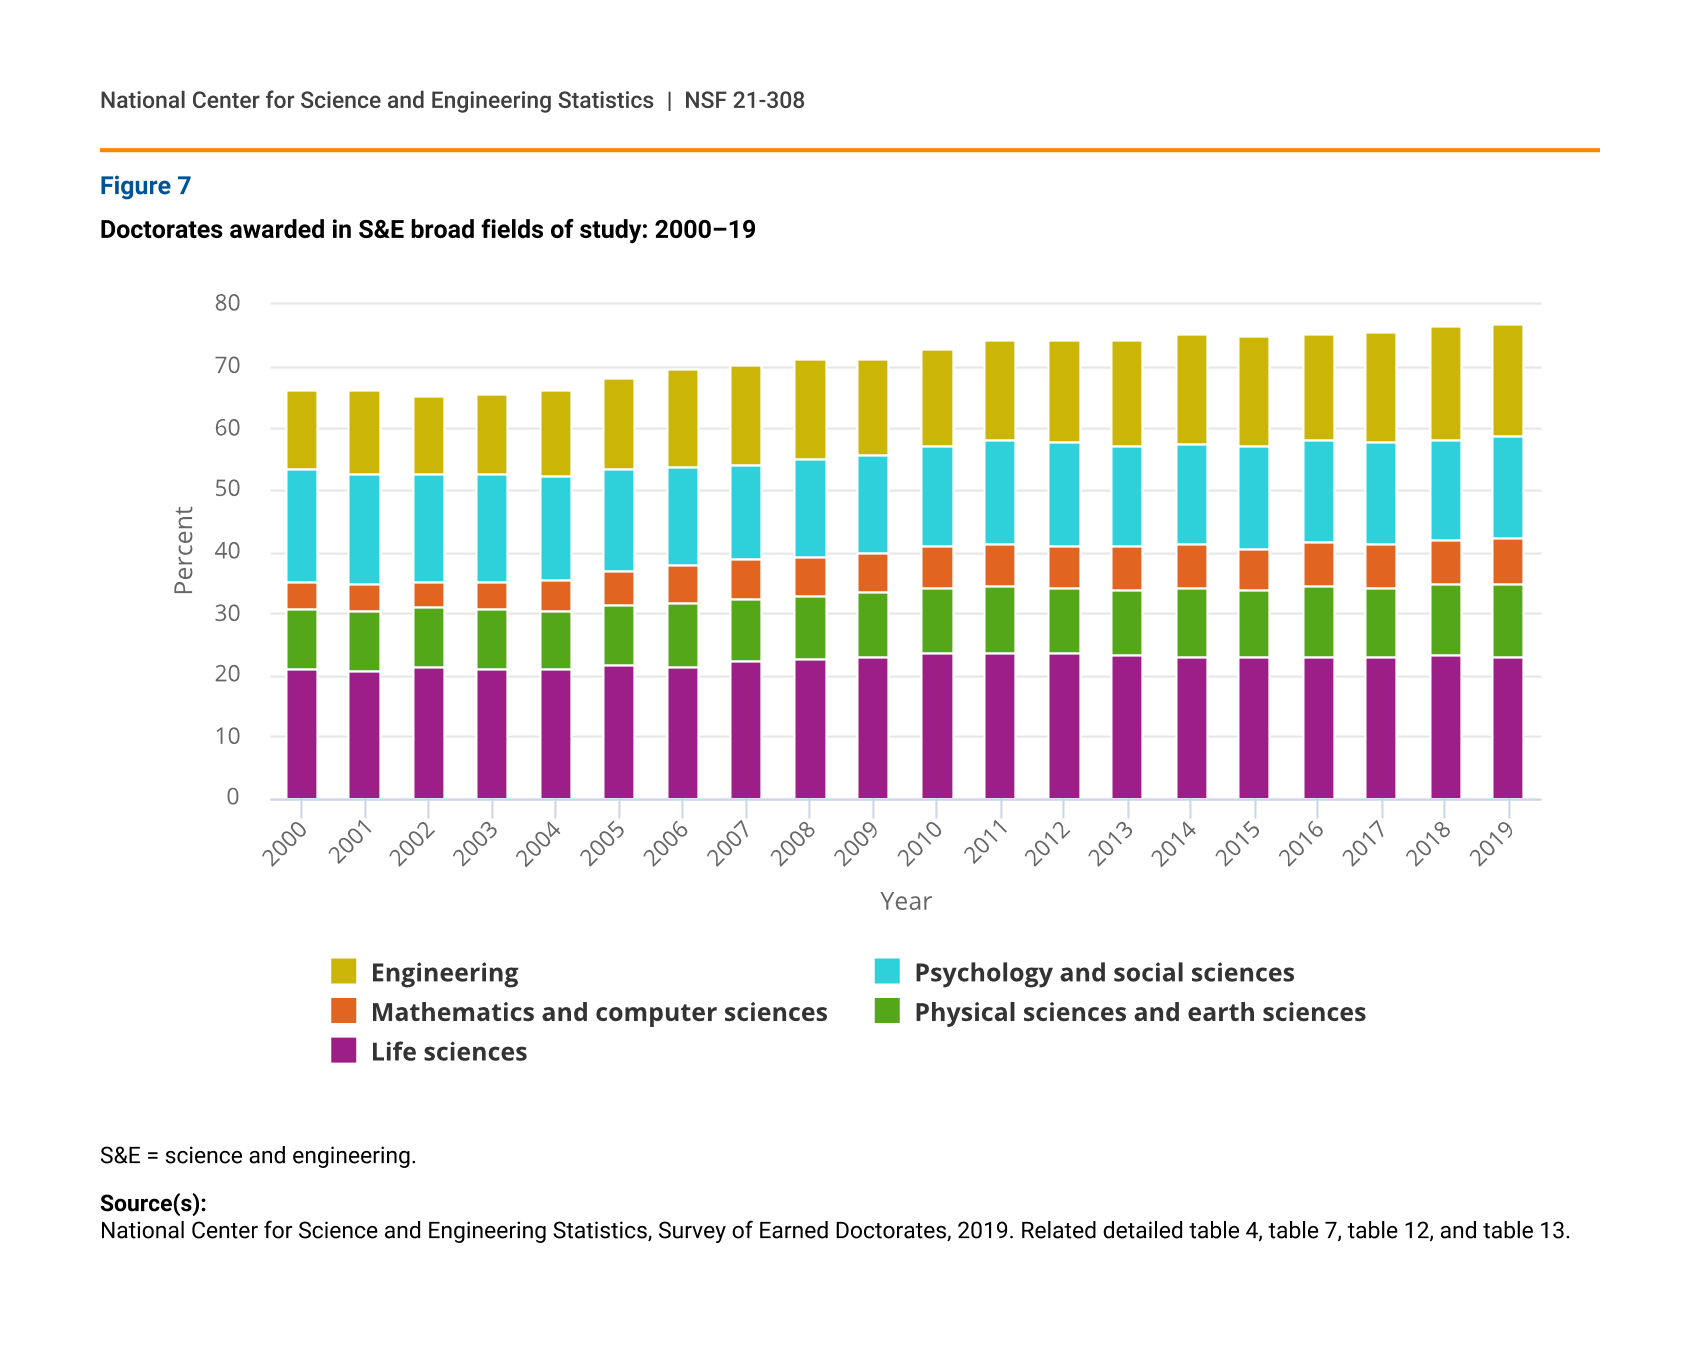
Doctorates in S&E fields are a growing share of all doctorates awarded. Every broad S&E field except for psychology and social sciences increased both its number and share of all doctorates over the past 2 decades. Psychology and social sciences increased in the number of doctorate recipients, but its share of all doctorates declined. Engineering had the largest growth among S&E fields, from 13% of all doctorates in 1999 to 19% in 2019 (figure 7).
Doctorates awarded in S&E broad fields of study: 2000–19
| Year | Life sciences | Physical sciences and earth sciences | Mathematics and computer sciences | Psychology and social sciences | Engineering |
|---|---|---|---|---|---|
| 2000 | 20.8 | 9.8 | 4.6 | 18.0 | 12.9 |
| 2001 | 20.5 | 9.9 | 4.5 | 17.6 | 13.5 |
| 2002 | 21.2 | 9.7 | 4.3 | 17.3 | 12.7 |
| 2003 | 20.9 | 9.7 | 4.6 | 17.4 | 13.0 |
| 2004 | 20.9 | 9.6 | 4.8 | 17.0 | 13.7 |
| 2005 | 21.5 | 10.0 | 5.4 | 16.5 | 14.8 |
| 2006 | 21.3 | 10.3 | 6.1 | 15.9 | 15.8 |
| 2007 | 22.2 | 10.3 | 6.3 | 15.2 | 16.1 |
| 2008 | 22.7 | 10.1 | 6.5 | 15.7 | 16.1 |
| 2009 | 23.0 | 10.4 | 6.4 | 16.0 | 15.4 |
| 2010 | 23.6 | 10.4 | 6.7 | 16.4 | 15.8 |
| 2011 | 23.6 | 10.8 | 6.7 | 16.8 | 16.4 |
| 2012 | 23.5 | 10.6 | 6.9 | 16.7 | 16.6 |
| 2013 | 23.2 | 10.6 | 6.9 | 16.3 | 17.1 |
| 2014 | 23.1 | 10.9 | 7.2 | 16.2 | 17.8 |
| 2015 | 22.8 | 10.8 | 7.0 | 16.5 | 18.0 |
| 2016 | 22.9 | 11.4 | 7.2 | 16.5 | 17.3 |
| 2017 | 23.0 | 11.1 | 7.0 | 16.6 | 17.9 |
| 2018 | 23.2 | 11.5 | 7.3 | 16.1 | 18.4 |
| 2019 | 22.9 | 11.8 | 7.6 | 16.3 | 18.5 |
S&E = science and engineering.
Non-S&E
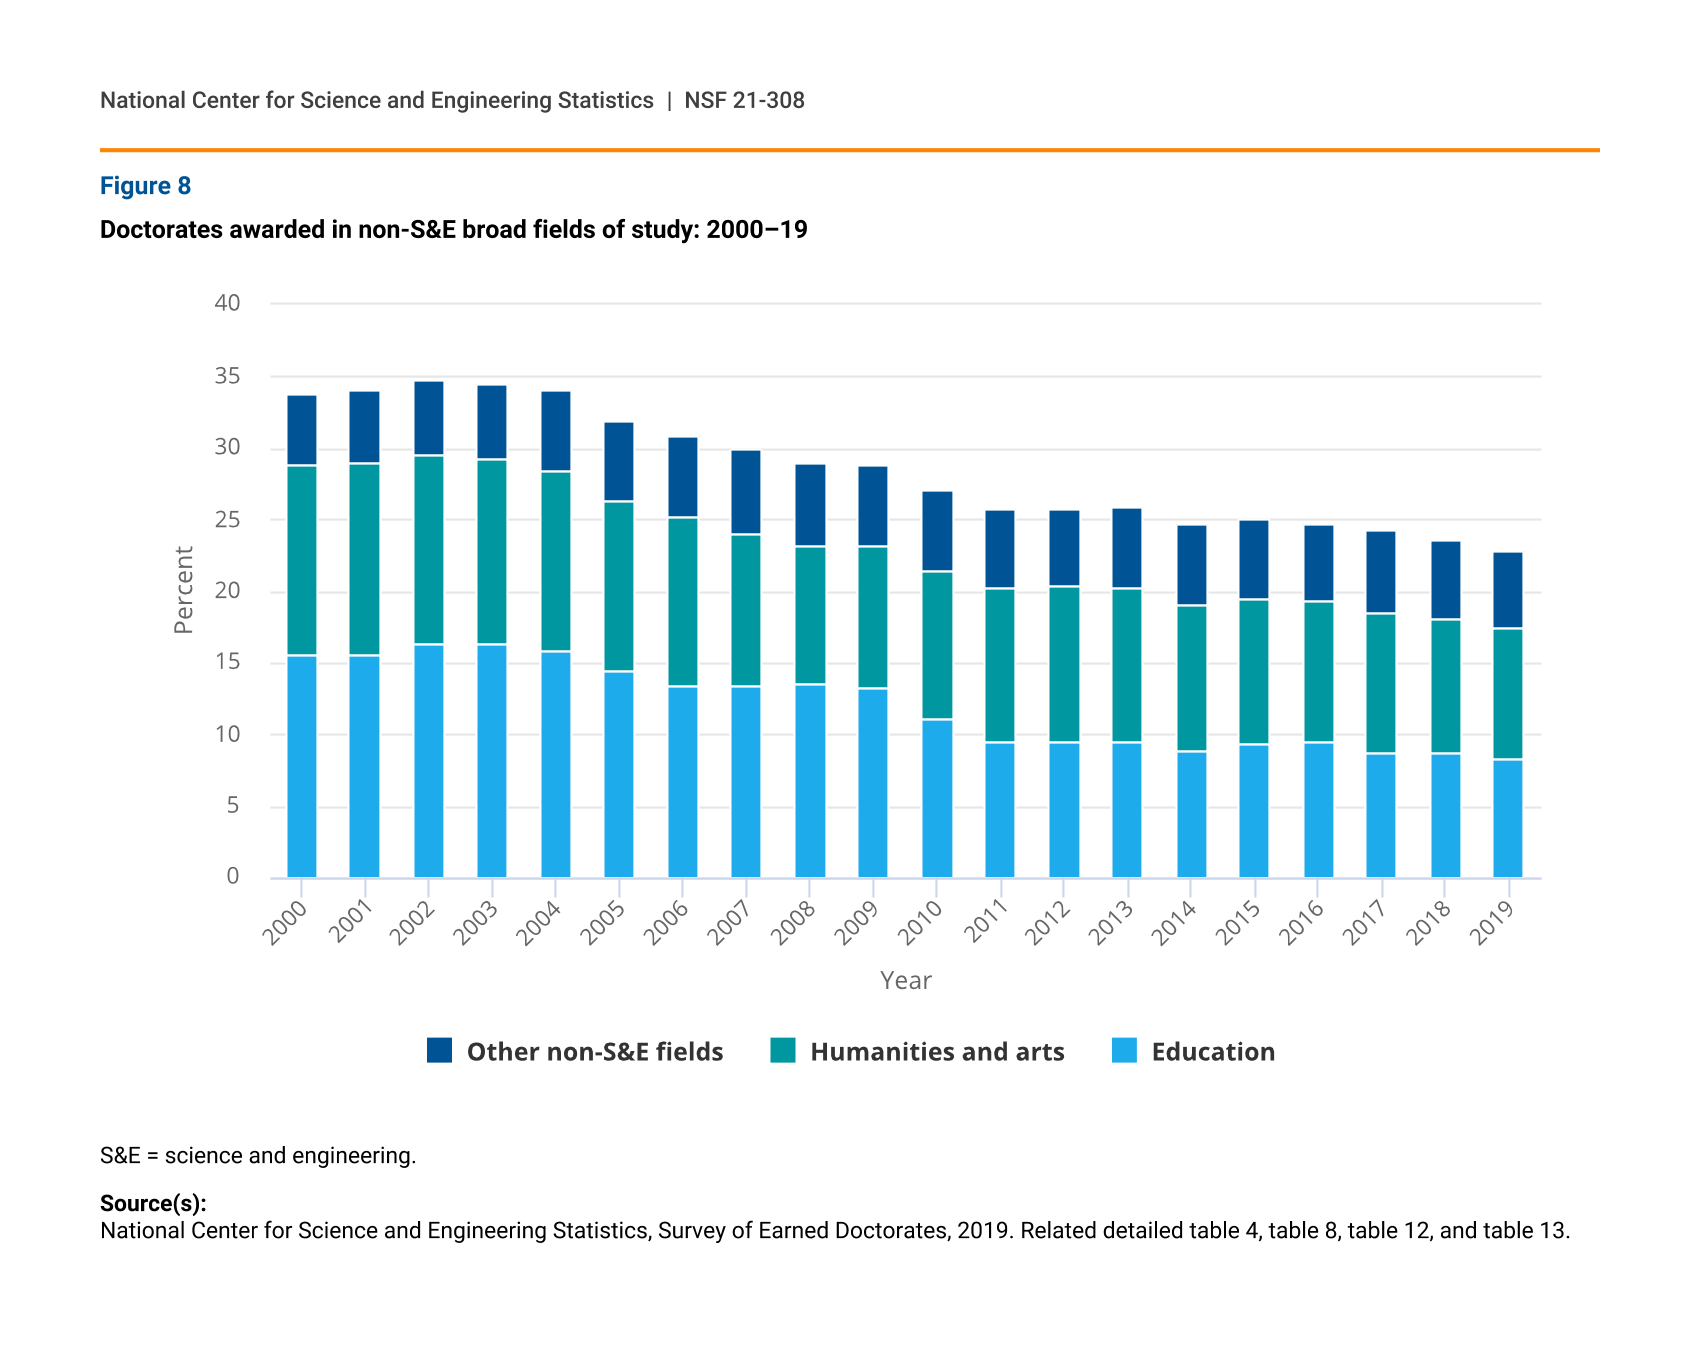
Within non-S&E fields, the number of doctorates awarded in education has declined over the past 2 decades, leading to a large, steady drop in the relative share of doctorates in that field. The number of humanities and arts doctorates increased during this period, but the field’s relative share fell 4 percentage points to 9% of all doctorates awarded in 2019. The number of doctorates in other non-S&E fields—such as business management and communication—increased, but their share remained fairly level (figure 8).
Doctorates awarded in non-S&E broad fields of study: 2000–19
| Year | Education | Humanities and arts | Other non-S&E fields |
|---|---|---|---|
| 2000 | 15.6 | 13.2 | 5.0 |
| 2001 | 15.6 | 13.3 | 5.1 |
| 2002 | 16.3 | 13.2 | 5.3 |
| 2003 | 16.3 | 12.9 | 5.2 |
| 2004 | 15.8 | 12.5 | 5.8 |
| 2005 | 14.4 | 12.0 | 5.5 |
| 2006 | 13.4 | 11.7 | 5.7 |
| 2007 | 13.4 | 10.6 | 5.9 |
| 2008 | 13.5 | 9.7 | 5.7 |
| 2009 | 13.2 | 9.9 | 5.7 |
| 2010 | 11.0 | 10.4 | 5.7 |
| 2011 | 9.5 | 10.7 | 5.5 |
| 2012 | 9.4 | 10.9 | 5.4 |
| 2013 | 9.4 | 10.8 | 5.7 |
| 2014 | 8.9 | 10.2 | 5.6 |
| 2015 | 9.3 | 10.2 | 5.5 |
| 2016 | 9.4 | 10.0 | 5.4 |
| 2017 | 8.8 | 9.7 | 5.8 |
| 2018 | 8.8 | 9.3 | 5.4 |
| 2019 | 8.3 | 9.1 | 5.4 |
S&E = science and engineering.
Temporary visa holders
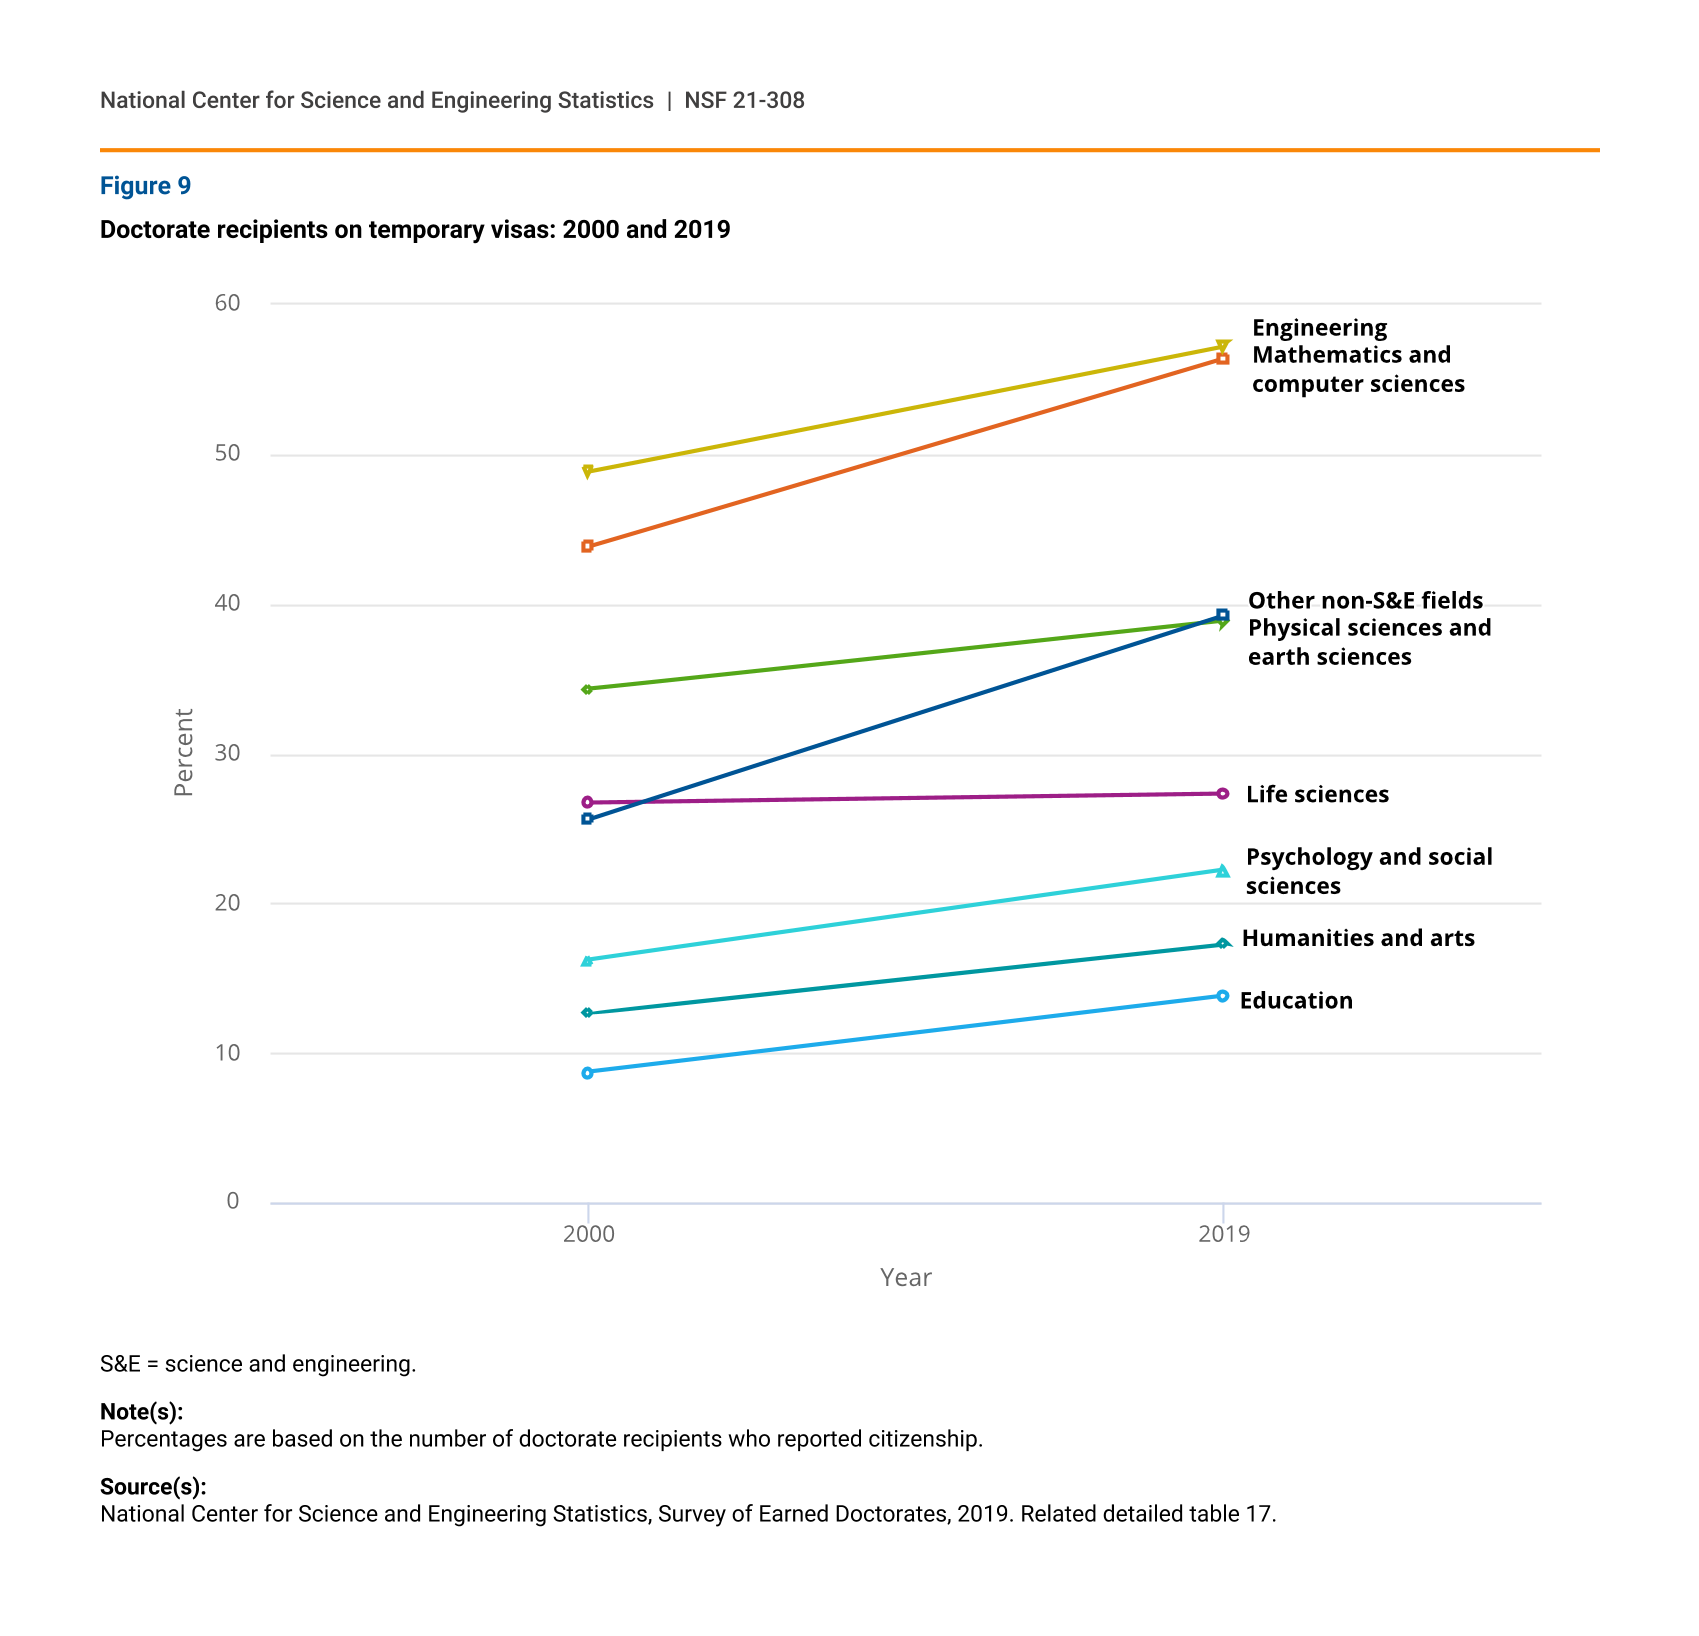
In the past 2 decades, the number of doctorate recipients who are U.S. citizens or permanent residents increased in every broad field of study except education, where it declined. During this period, the number of doctorates awarded to temporary visa holders increased in every broad field and at a faster rate than that of U.S. citizens and permanent residents.
In 2019, temporary visa holders earned the majority of doctorates awarded in engineering (57%) and in mathematics and computer sciences (56%). Since 2000, the proportion of temporary visa holders increased the most in those two broad fields and in the category of other non-S&E fields, which includes business management and administration, communication, and other non-S&E fields not elsewhere classified (figure 9).
Doctorate recipients on temporary visas: 2000 and 2019
| Year | Life sciences | Physical sciences and earth sciences | Mathematics and computer sciences | Psychology and social sciences | Engineering | Education | Humanities and arts | Other non-S&E fields |
|---|---|---|---|---|---|---|---|---|
| 2000 | 26.7 | 34.3 | 43.8 | 16.2 | 48.8 | 8.7 | 12.6 | 25.6 |
| 2019 | 27.3 | 38.9 | 56.4 | 22.2 | 57.2 | 13.8 | 17.2 | 39.2 |
S&E = science and engineering.
Note(s):
Percentages are based on the number of doctorate recipients who reported citizenship.
Source(s):
National Center for Science and Engineering Statistics, Survey of Earned Doctorates, 2019. Related detailed table 17.
Minority U.S. citizens and permanent residents
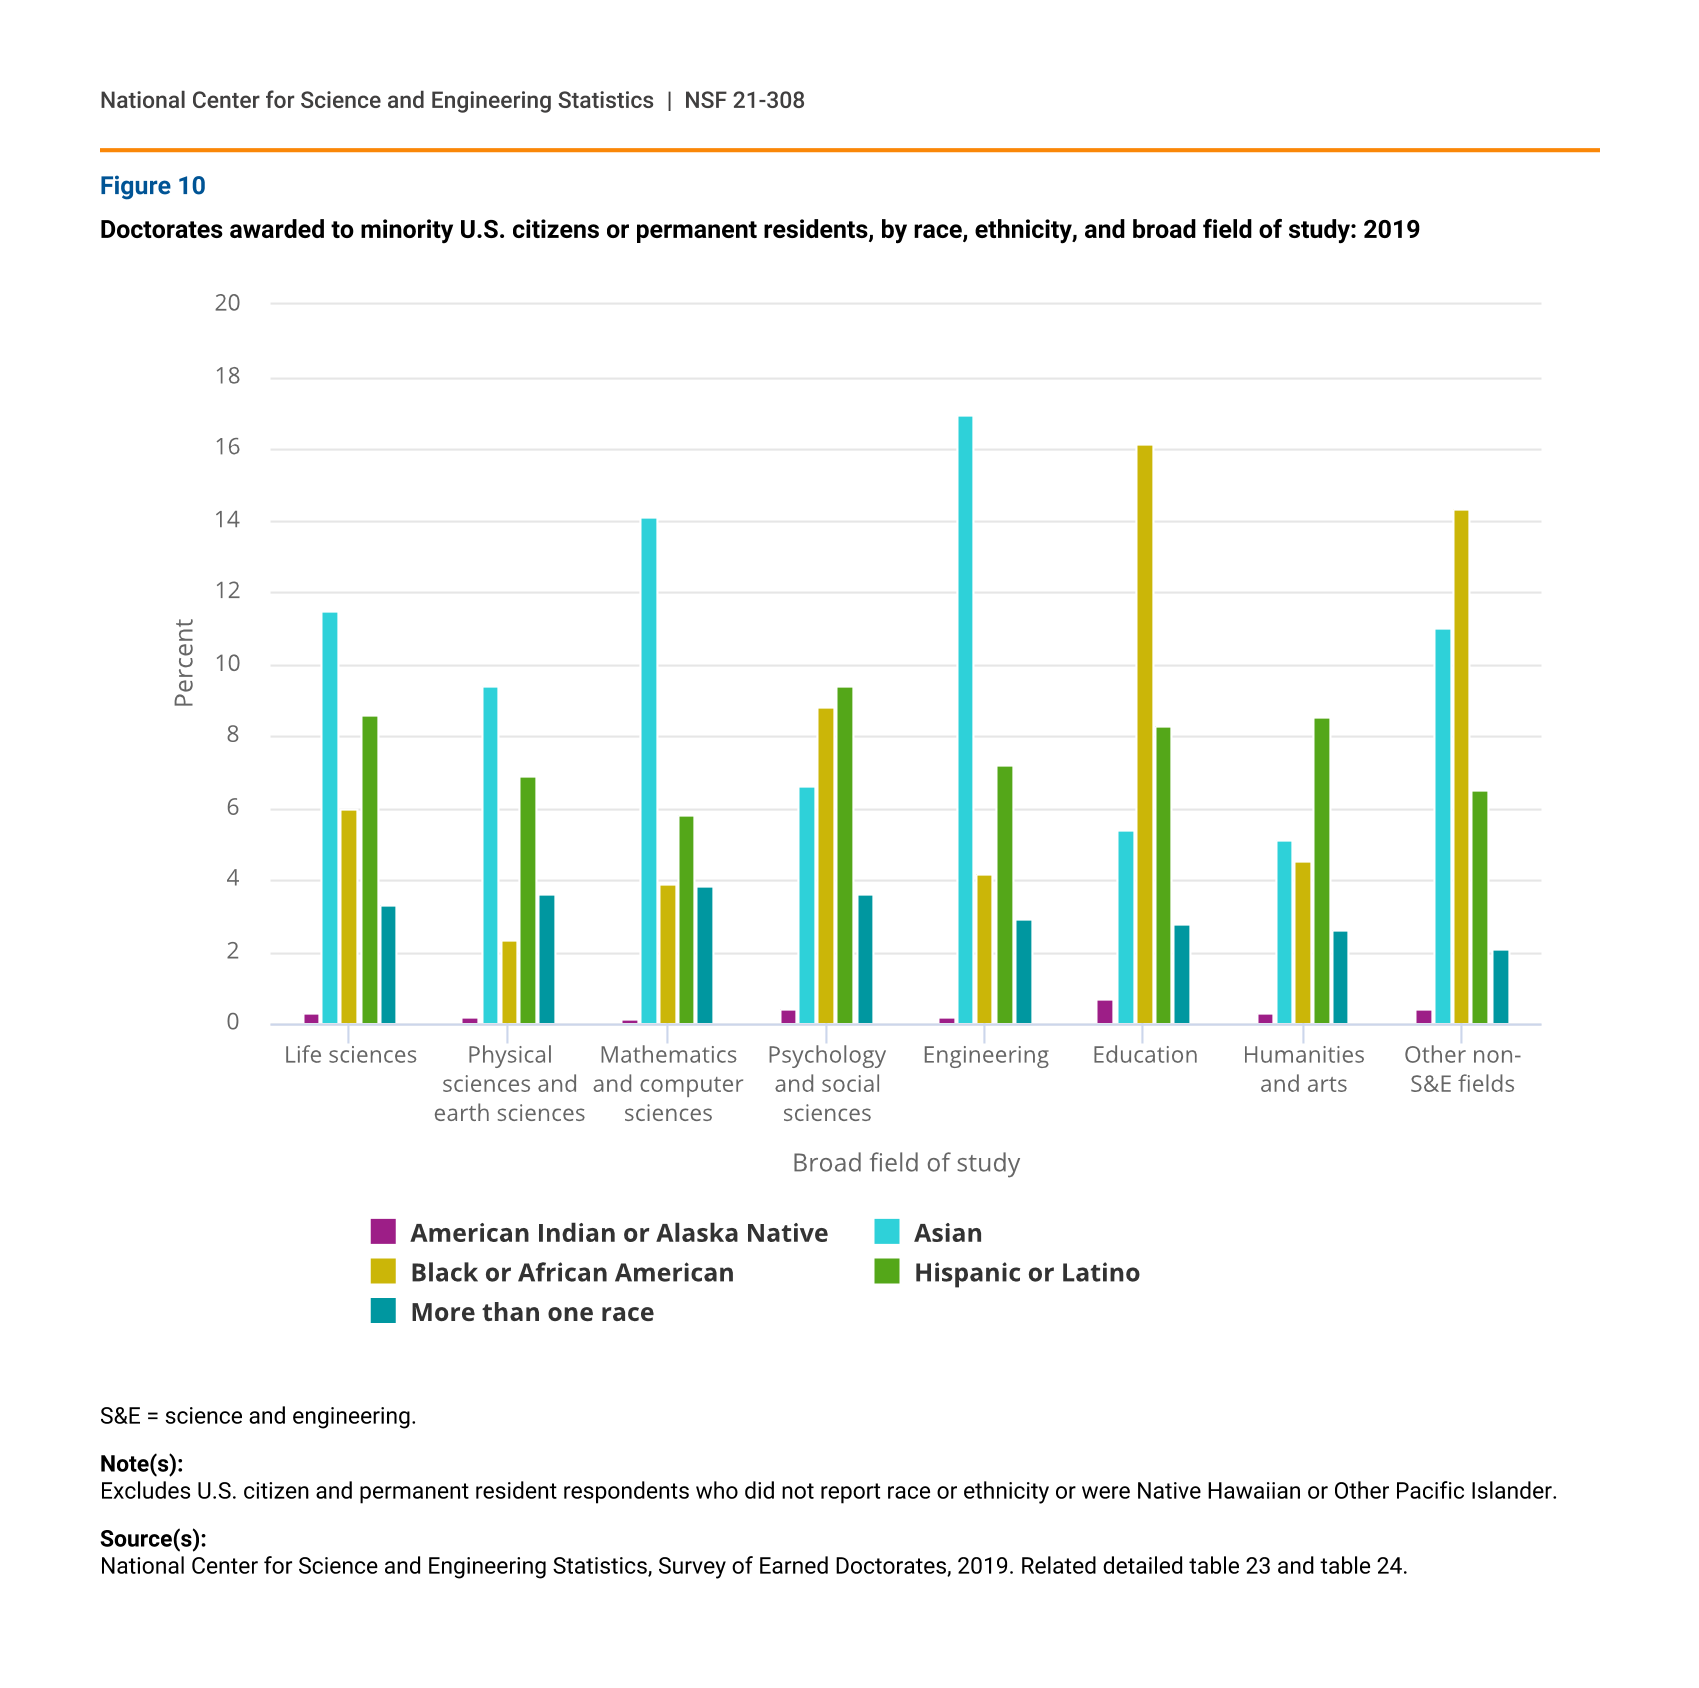
In 2019, 69% of the 35,274 doctorate recipients who were U.S. citizens or permanent residents were White; 10% were Asian, 8% were Hispanic or Latino, 7% were Black or African American, and 3% identified as more than one race. The remaining doctorate recipients were either American Indian or Alaska Native, Native Hawaiian or Other Pacific Islander, or did not report their race or ethnicity.
Among minority U.S. citizens and permanent residents, doctorate recipients of different racial or ethnic backgrounds are more heavily represented in some fields of study than in others. In 2019, Asians earned a larger share of doctorates than other racial and ethnic minority groups in life sciences, physical sciences and earth sciences, mathematics and computer sciences, and engineering. Black or African American doctorate recipients were the largest minority population in education and in other non-S&E fields. Hispanics or Latinos and Blacks or African Americans earned a larger proportion of doctorates in psychology and social sciences and in humanities and arts than did other minority groups (figure 10).
Doctorates awarded to minority U.S. citizens or permanent residents, by race, ethnicity, and broad field of study: 2019
| Broad field of study | American Indian or Alaska Native | Asian | Black or African American | Hispanic or Latino | More than one race |
|---|---|---|---|---|---|
| Life sciences | 0.3 | 11.5 | 6.0 | 8.6 | 3.3 |
| Physical sciences and earth sciences | 0.2 | 9.4 | 2.3 | 6.9 | 3.6 |
| Mathematics and computer sciences | 0.1 | 14.1 | 3.9 | 5.8 | 3.8 |
| Psychology and social sciences | 0.4 | 6.6 | 8.8 | 9.4 | 3.6 |
| Engineering | 0.2 | 16.9 | 4.2 | 7.2 | 2.9 |
| Education | 0.7 | 5.4 | 16.1 | 8.3 | 2.8 |
| Humanities and arts | 0.3 | 5.1 | 4.5 | 8.5 | 2.6 |
| Other non-S&E fields | 0.4 | 11.0 | 14.3 | 6.5 | 2.1 |
S&E = science and engineering.
Note(s):
Excludes U.S. citizen and permanent resident respondents who did not report race or ethnicity or were Native Hawaiian or Other Pacific Islander.
Women
Overview
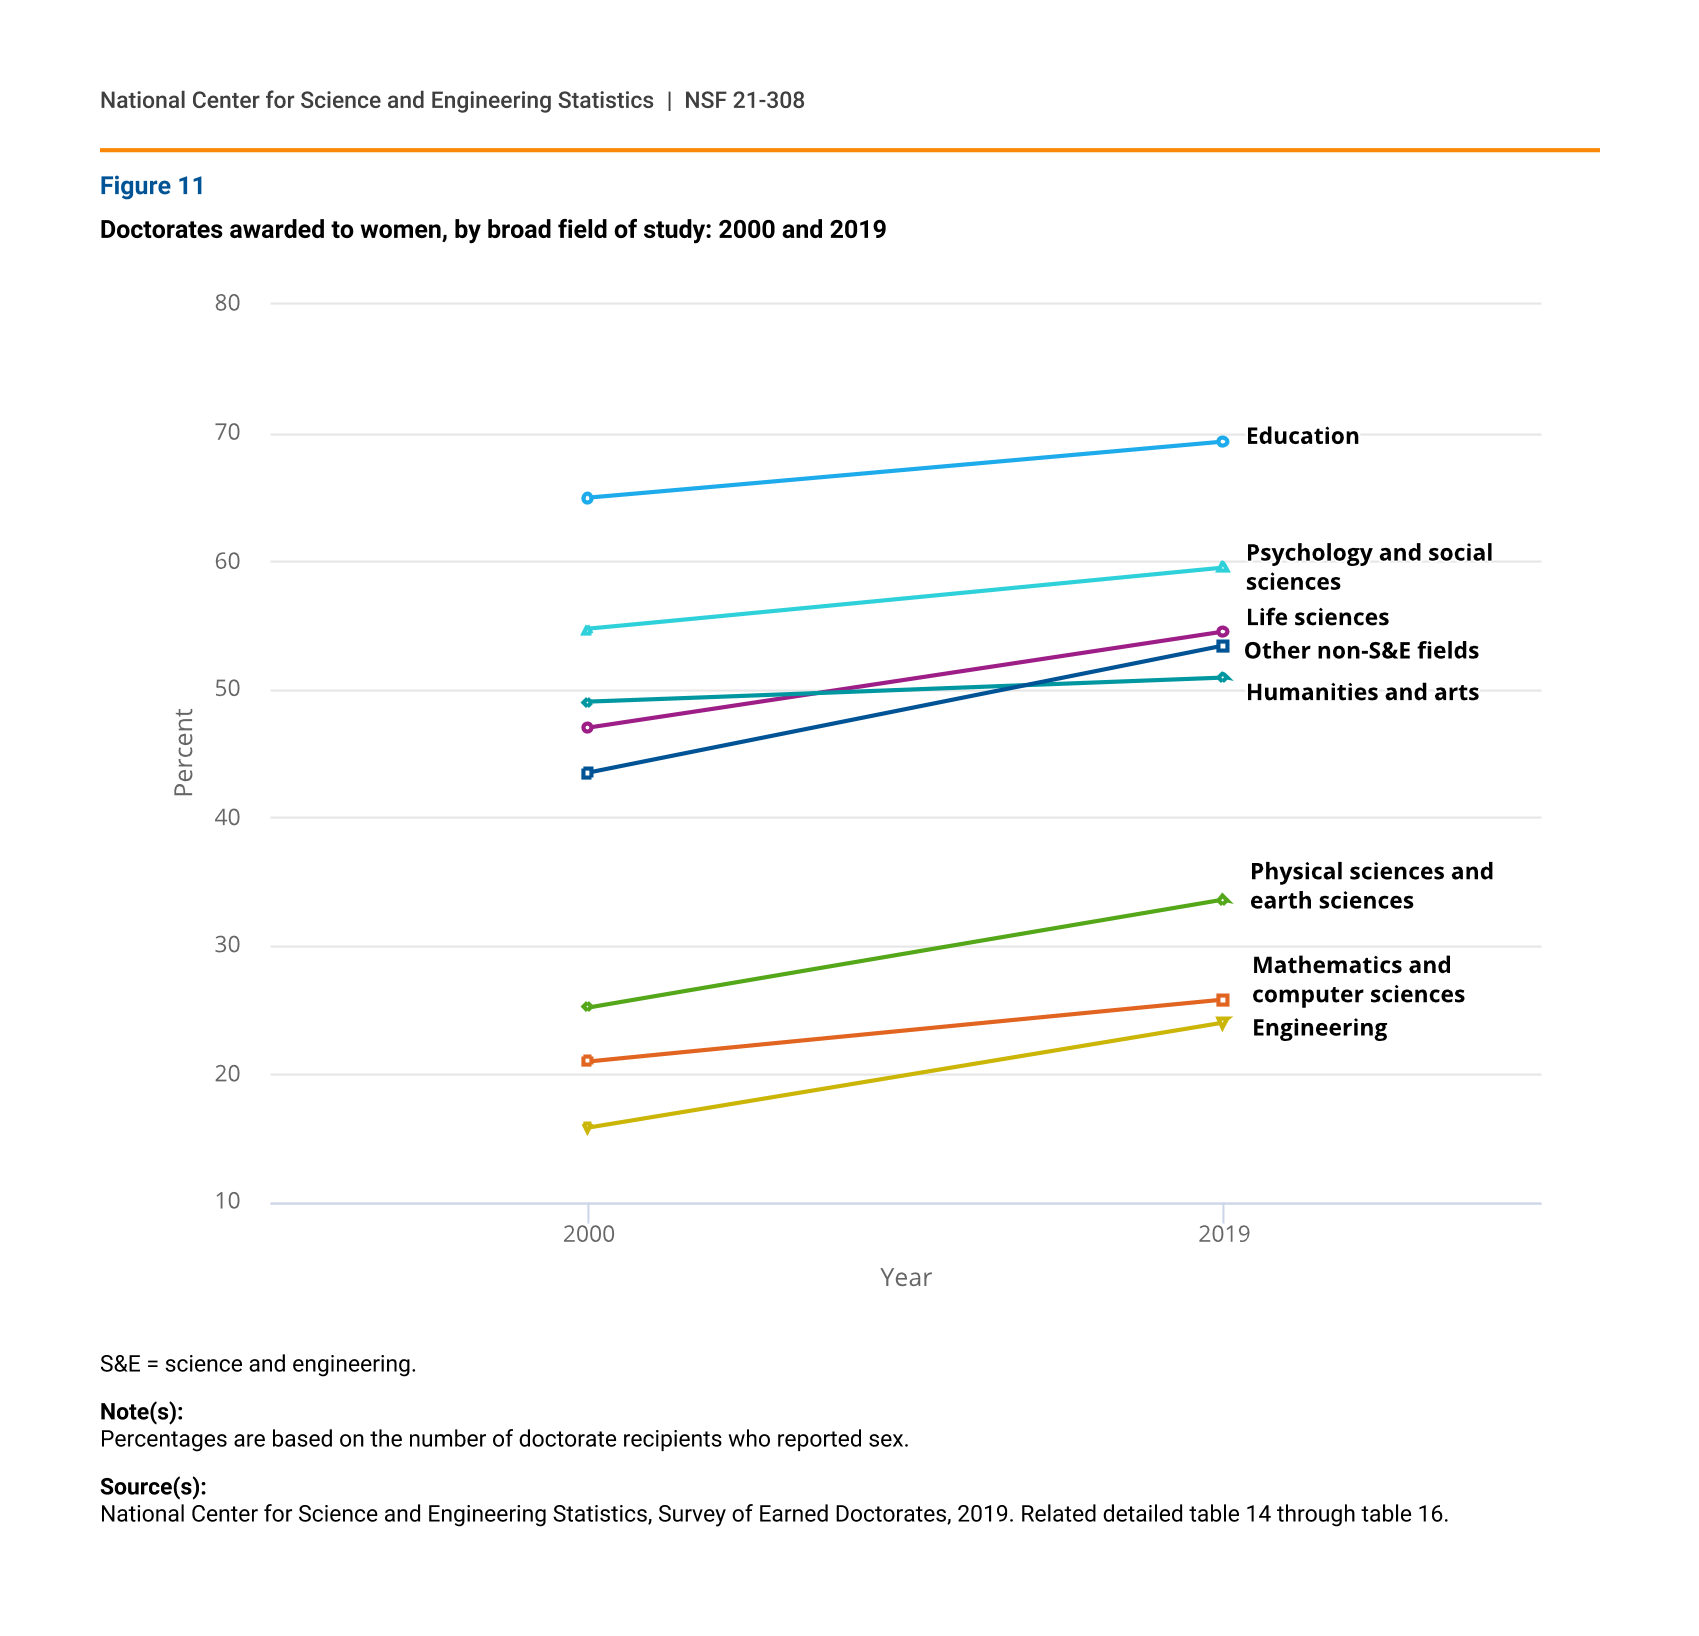
Women’s share of doctorates awarded has grown over the past 2 decades in all broad fields of study. In 2019, women earned half or more of the doctorates awarded in life sciences, psychology and social sciences, education, humanities and arts, and other non-S&E fields.
Women earned only between about a quarter and a third of the doctorates awarded in engineering, in mathematics and computer sciences, and in physical sciences and earth sciences in 2019. However, women’s shares of doctorates in these fields have grown over the past 20 years. From 2000 to 2019, the proportion of female doctorates grew considerably in life sciences (from 47% to 55%), in engineering (from 16% to 24%), and in physical sciences and earth sciences (from 25% to 34%). In psychology and social sciences and in mathematics and computer sciences women’s share grew by 5 percentage points during this period (figure 11).
Doctorates awarded to women, by broad field of study: 2000 and 2019
| Year | Life sciences | Physical sciences and earth sciences | Mathematics and computer sciences | Psychology and social sciences | Engineering | Education | Humanities and arts | Other non-S&E fields |
|---|---|---|---|---|---|---|---|---|
| 2000 | 47.0 | 25.2 | 21.0 | 54.7 | 15.8 | 64.9 | 49.0 | 43.5 |
| 2019 | 54.5 | 33.6 | 25.8 | 59.5 | 24.0 | 69.3 | 50.9 | 53.4 |
S&E = science and engineering.
Note(s):
Percentages are based on the number of doctorate recipients who reported sex.
Growing and declining fields
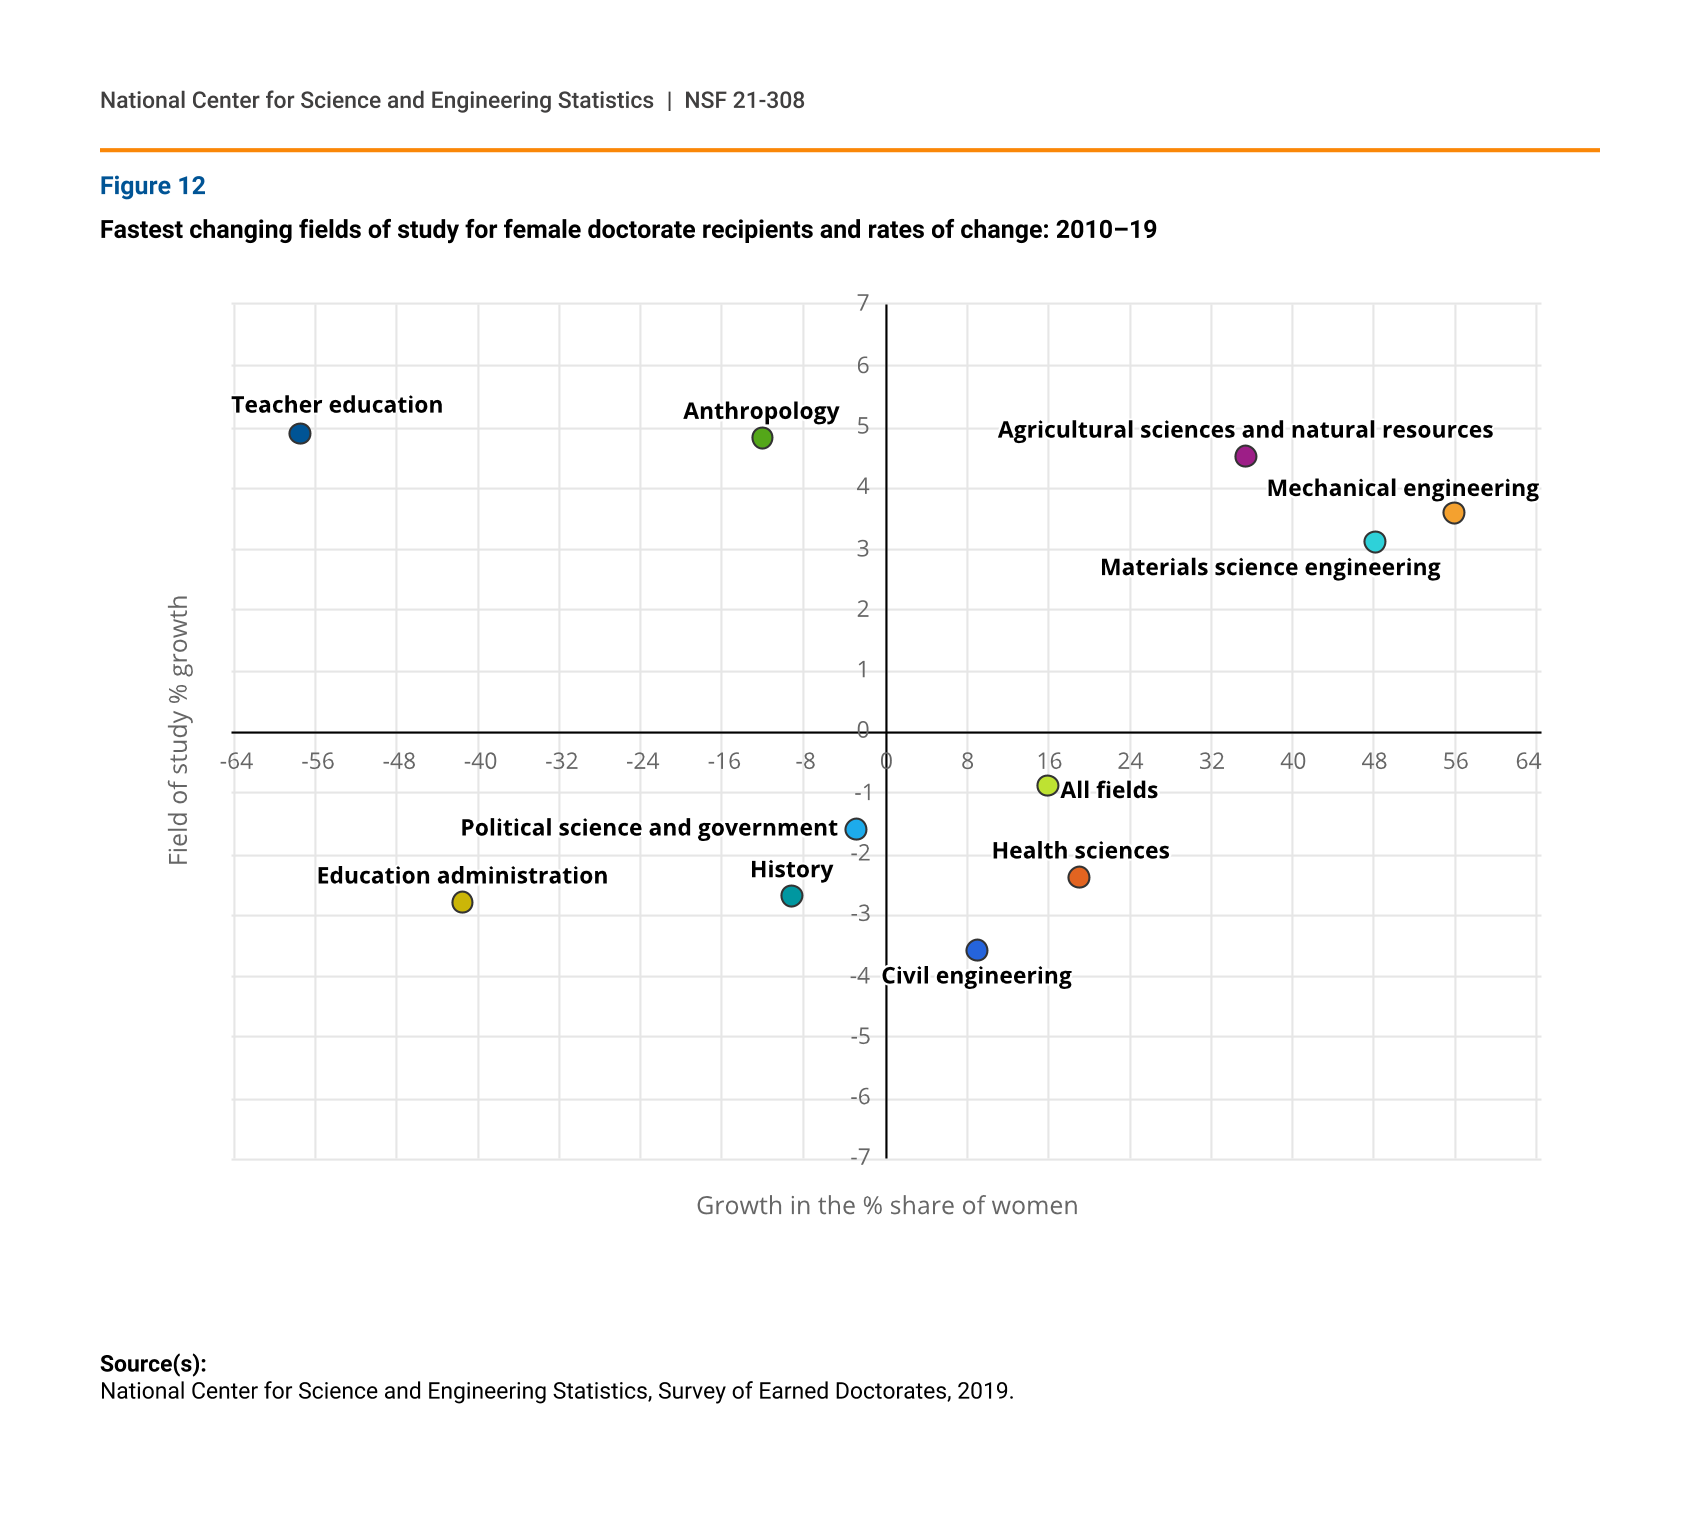
The growth or decline in the share of women doctorate recipients in different fields does not always track with the overall growth of those fields.
From 2010 to 2019, the proportion of female doctorate recipients increased between 3 and 4 percentage points in three fields where the overall numbers of doctorates increased: mechanical engineering, materials science engineering, and agricultural sciences and natural resources (figure 12). Women’s share of doctorates also increased about 5 percentage points in teacher education and anthropology, fields that declined in the overall number of doctorates awarded.
Fastest changing fields of study for female doctorate recipients and rates of change: 2010–19
| Field of doctorate | Growth in the % share of women | Field of study % growth |
|---|---|---|
| Teacher education | 4.9 | -57.6 |
| Anthropology | 4.8 | -12.2 |
| Agricultural sciences and natural resources | 4.5 | 35.5 |
| Mechanical engineering | 3.6 | 56.0 |
| Materials science engineering | 3.1 | 48.1 |
| All fields | -0.9 | 16.0 |
| Political science and government | -1.6 | -2.9 |
| Health sciences | -2.4 | 19.1 |
| History | -2.7 | -9.3 |
| Education administration | -2.8 | -41.7 |
| Civil engineering | -3.6 | 9.0 |
Source(s):
National Center for Science and Engineering Statistics, Survey of Earned Doctorates, 2019.
Despite the growth in the number of doctorate recipients in civil engineering and in the health sciences in the past 10 years, women’s shares of doctorates in these fields declined. The proportion of female doctorate recipients also declined in education administration, history, and political science and government—three fields in which the numbers of doctorates have declined as well.