 An official website of the United States government
 Special focus: Educational pathways to the doctorate
There are many educational pathways to the doctoral degree. This section explores additional details of doctorate recipients’ educational journeys, including other degrees doctorate recipients attained, prior attendance at community colleges, the types of institutions in which doctorate recipients earned bachelor’s degrees, and whether doctorate recipients changed their field of study between their bachelor’s or master’s degrees and their doctorate.
Degree awards obtained by doctorate recipients
The path to the doctorate starts in undergraduate institutions. Just 4% of 2019 doctorate recipients had earned an associate’s degree, while nearly all had earned at least one bachelor’s degree (96%). The majority had earned one master’s degree (59%) and 11% had earned more than one master’s degree prior to their doctorate. For virtually all 2019 doctorate recipients, their current doctorate was their first research doctoral award (table A).
Degrees earned by doctorate recipients before their doctoral award, by degree level: 2019
* = value < 0.05%.
Source(s):
National Center for Science and Engineering Statistics, Survey of Earned Doctorates, 2019.
Earning a professional doctoral degree concurrently or prior to the doctorate was not common (table B). Only 1% of doctorate recipients were earning a professional degree simultaneously; 2% had earned a professional degree before starting their doctoral program. For the most part, these professional degrees were medical degrees.
Doctorate recipients earning professional doctoral degrees: 2019
Note(s):
Percentages are based on the number of doctorate recipients who responded to the item on the professional doctorate degrees.
Source(s):
National Center for Science and Engineering Statistics, Survey of Earned Doctorates, 2019.
Community or 2-year college attendance and associate’s degree attainment
Time trend and field differences
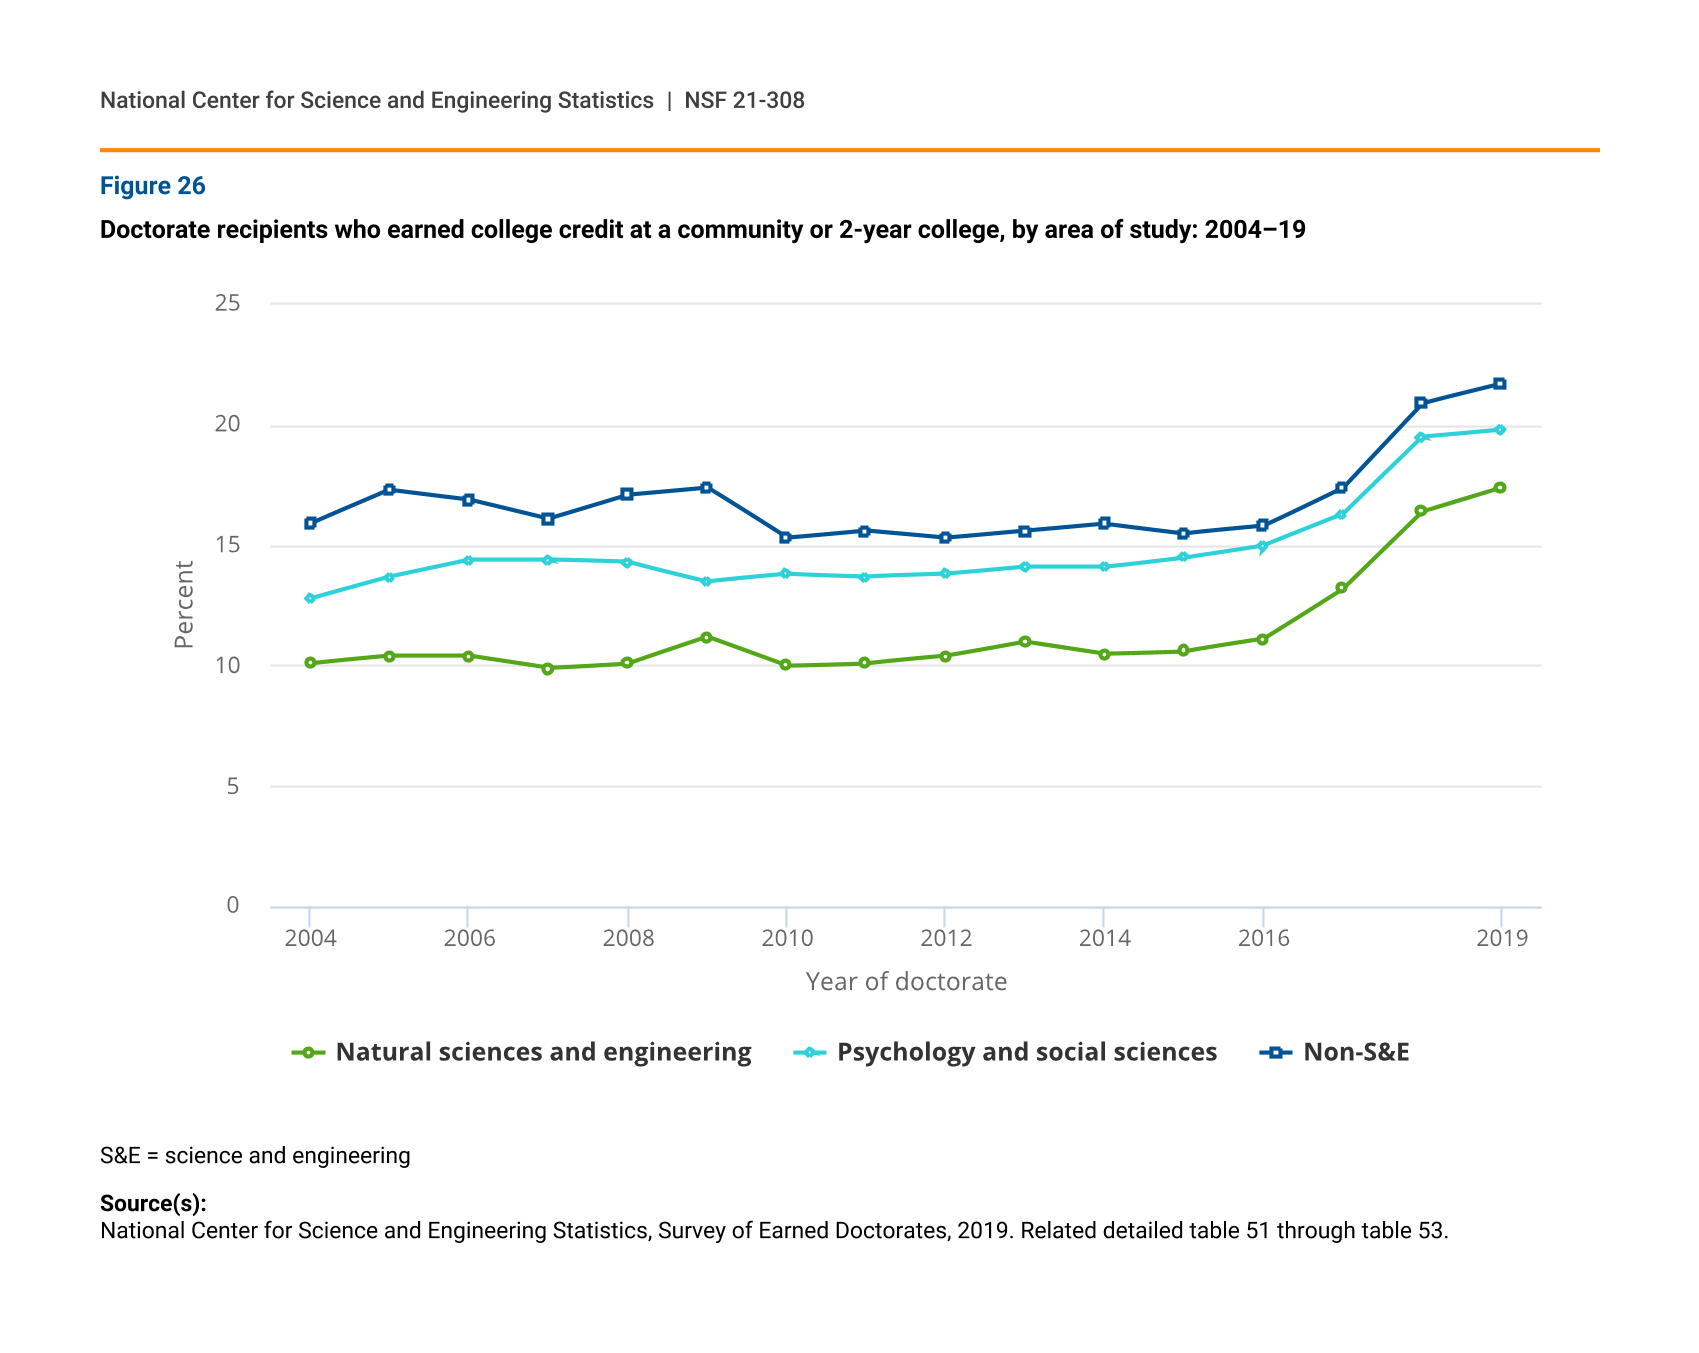
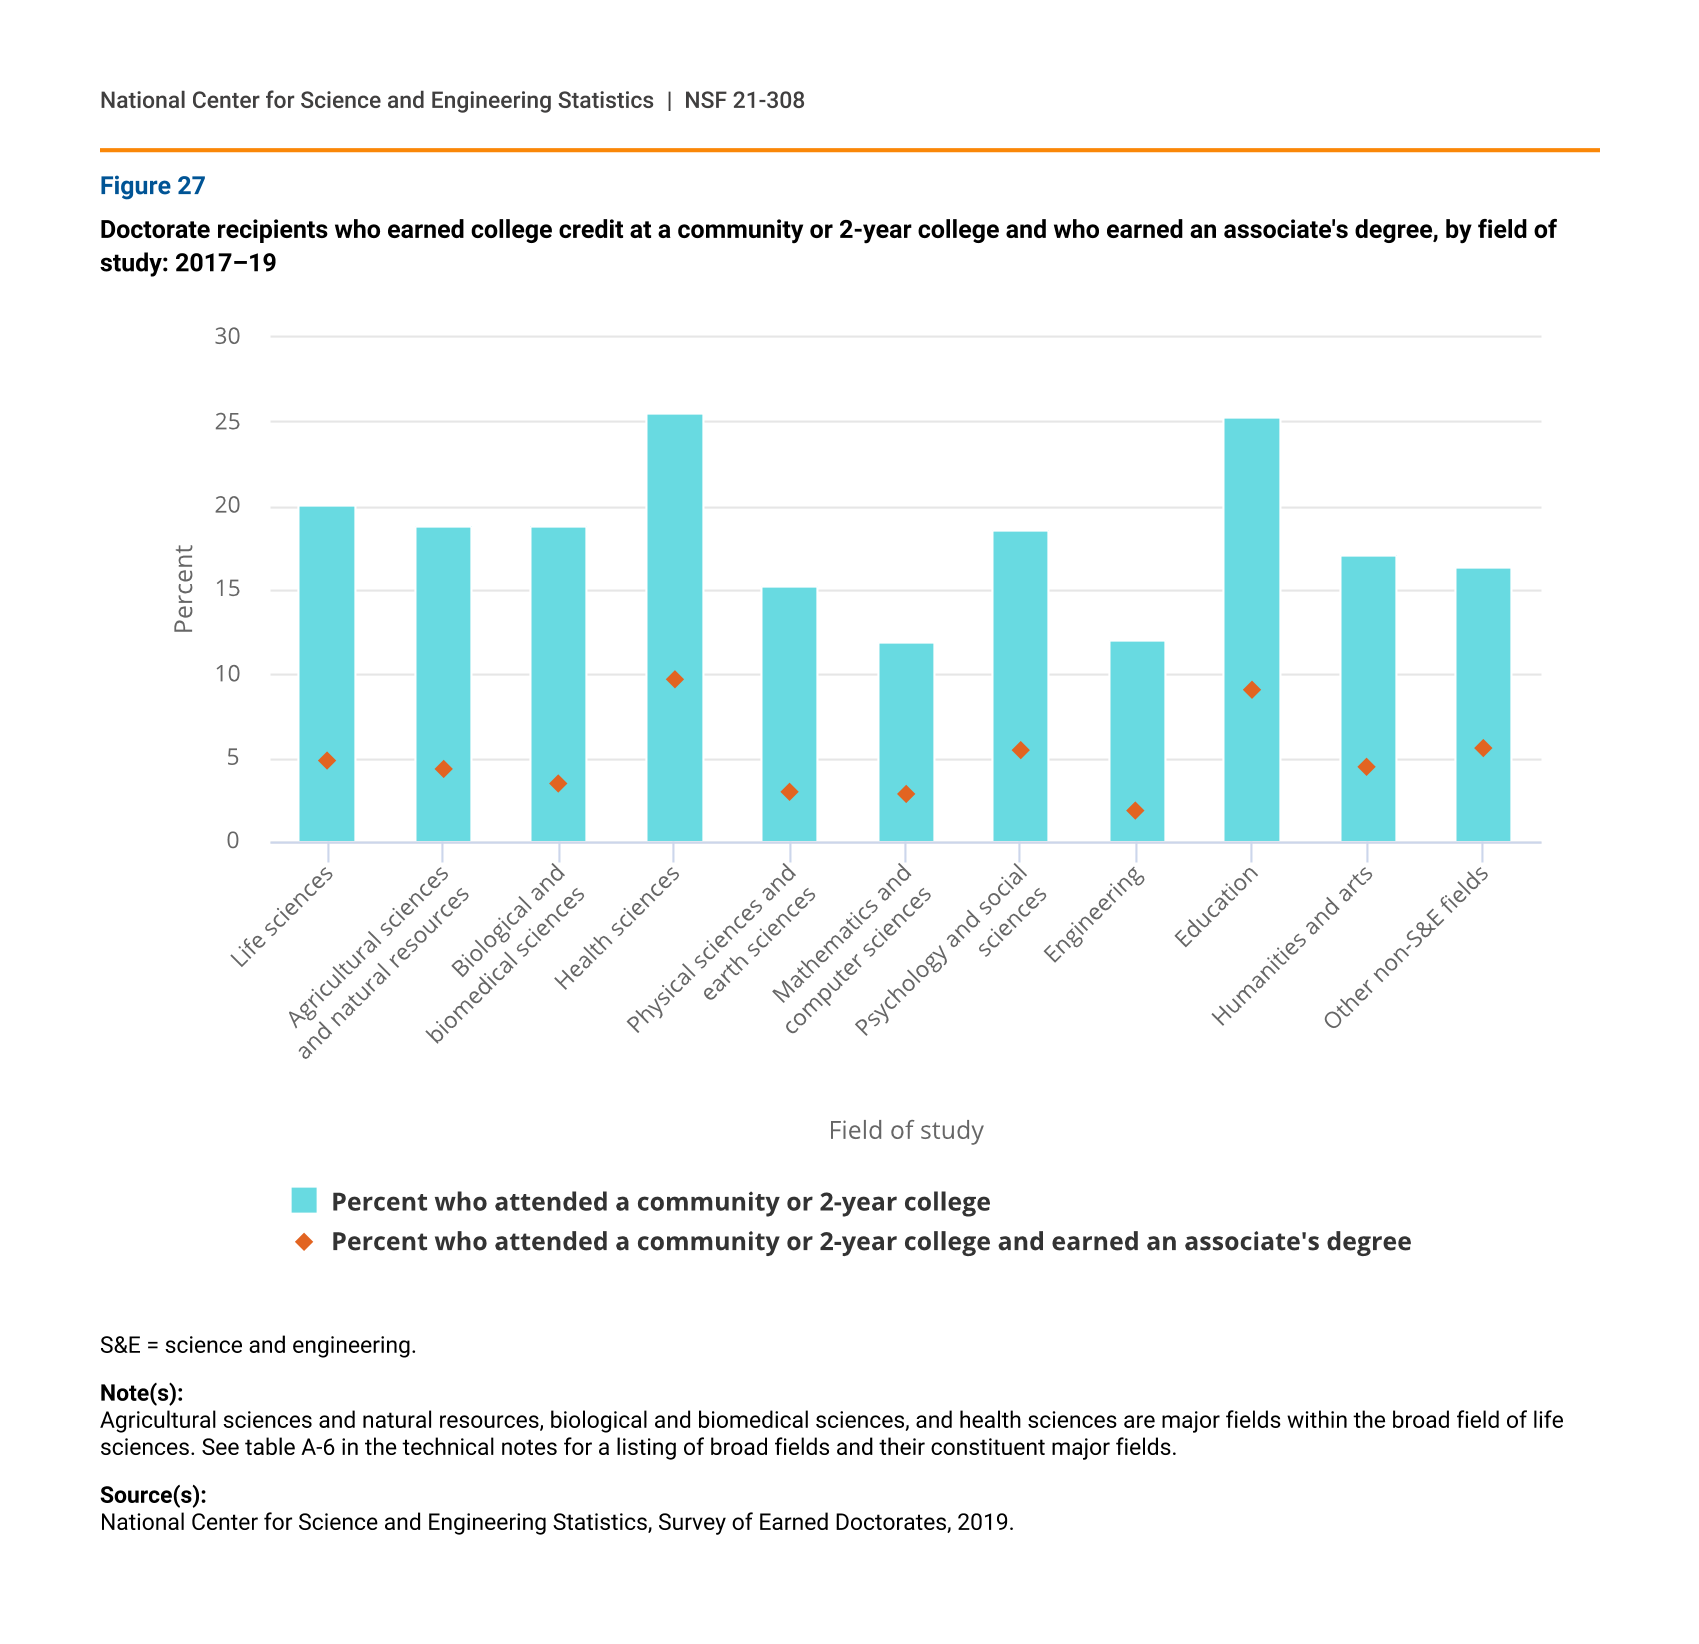
The proportion of doctorate recipients who had attended community college has been gradually increasing in all broad areas of study in the past 4–5 years (figure 26). It is measured as the proportion who had earned college credit from a community or 2-year college. Doctorate recipients in non-S&E fields are slightly more likely to have attended community college than those in S&E fields. Only a fraction of the doctorate recipients who attended community college had earned an associate’s degree (figure 27).
Doctorate recipients in the health sciences and in education were the most likely to have attended community college (26% and 25%, respectively) and also the most likely to have earned an associate’s degree (10% and 9%, respectively). Doctorate recipients in engineering and in mathematics and computer sciences were the least likely to have earned college credit from a community college (12% each) or an associate’s degree (2% and 3%, respectively).
Doctorate recipients who earned college credit at a community or 2-year college, by area of study: 2004–19
| Year of doctorate | Natural sciences and engineering | Psychology and social sciences | Non-S&E |
|---|---|---|---|
| 2004 | 10.1 | 12.8 | 15.9 |
| 2005 | 10.4 | 13.7 | 17.3 |
| 2006 | 10.4 | 14.4 | 16.9 |
| 2007 | 9.9 | 14.4 | 16.1 |
| 2008 | 10.1 | 14.3 | 17.1 |
| 2009 | 11.2 | 13.5 | 17.4 |
| 2010 | 10.0 | 13.8 | 15.3 |
| 2011 | 10.1 | 13.7 | 15.6 |
| 2012 | 10.4 | 13.8 | 15.3 |
| 2013 | 11.0 | 14.1 | 15.6 |
| 2014 | 10.5 | 14.1 | 15.9 |
| 2015 | 10.6 | 14.5 | 15.5 |
| 2016 | 11.1 | 15.0 | 15.8 |
| 2017 | 13.2 | 16.3 | 17.4 |
| 2018 | 16.4 | 19.5 | 20.9 |
| 2019 | 17.4 | 19.8 | 21.7 |
S&E = science and engineering
Doctorate recipients who earned college credit at a community or 2-year college and who earned an associate's degree, by field of study: 2017–19
| Field of study | Percent who attended a community or 2-year college | Percent who attended a community or 2-year college and earned an associate's degree |
|---|---|---|
| Life sciences | 20.1 | 4.8 |
| Agricultural sciences and natural resources | 18.8 | 4.4 |
| Biological and biomedical sciences | 18.8 | 3.5 |
| Health sciences | 25.5 | 9.7 |
| Physical sciences and earth sciences | 15.2 | 3.0 |
| Mathematics and computer sciences | 11.9 | 2.8 |
| Psychology and social sciences | 18.6 | 5.5 |
| Engineering | 12.0 | 1.9 |
| Education | 25.3 | 9.0 |
| Humanities and arts | 17.1 | 4.5 |
| Other non-S&E fields | 16.4 | 5.6 |
S&E = science and engineering.
Note(s):
Agricultural sciences and natural resources, biological and biomedical sciences, and health sciences are major fields within the broad field of life sciences. See table A-6 in the technical notes for a listing of broad fields and their constituent major fields.
Source(s):
National Center for Science and Engineering Statistics, Survey of Earned Doctorates, 2019.
Demographics and parental education
U.S. citizens and permanent residents are more than three times as likely as temporary visa holders to have attended a community college (figure 28). Among U.S. citizens and permanent residents, nearly a third of Hispanic or Latino and nearly half of American Indian or Alaska Native doctorate recipients had earned college credit from this type of institution. Asian doctorate recipients were the least likely to have attended community college (19%).
Community college attendance among U.S. citizen and permanent resident doctorate recipients varied by the educational attainment of their parents. Generally, community college attendance was higher at the lower parental educational attainment levels. For doctorate recipients whose parents had completed some college or less, about a third attended community college, compared with 27% for doctorate recipients whose parents had earned a bachelor’s degree and 22% for those whose parents had earned an advanced degree.
Doctorate recipients with college credit at a community or 2-year college, by sex, citizenship status, race and ethnicity, and highest parental educational attainment: 2019
| Demographic characteristic | Percent with college credit at a community or 2-year college |
|---|---|
| All doctorate recipients | 18.8 |
| Male | 17.6 |
| Female | 20.2 |
| U.S. citizen or permanent resident | 25.6 |
| Temporary visa holder | 7.4 |
| Hispanic or Latino | 31.5 |
| American Indian or Alaska Native | 44.2 |
| Asian | 18.7 |
| Black or African American | 27.3 |
| White | 25.8 |
| Other | 23.5 |
| High school or less | 35.8 |
| Some college | 36.2 |
| Bachelor's degree | 27.4 |
| Advanced degree | 21.5 |
Note(s):
Percentages for sex and citizenship status are based on total number of doctorate recipients. Percentages for race and ethnicity and highest parental educational attainment are based on U.S. citizens and permanent residents only. Hispanic or Latino may be any race; race categories exclude Hispanic origin. Other race or ethnicity includes more than one race, other race or race not reported, and ethnicity not reported. Advanced degree includes master's degree, professional degree, and research doctorate.
Source(s):
National Center for Science and Engineering Statistics, Survey of Earned Doctorates, 2019.
Baccalaureate origins of doctorate recipients
Type of baccalaureate institution
Both U.S. research institutions and foreign institutions play important roles in the baccalaureate education of U.S.-trained doctorates (table C). In 2019, about 91% of doctorate recipients who were U.S. citizens or permanent residents had earned their bachelor’s degree in the United States. In turn, nearly 90% of doctorate recipients who were temporary visa holders had obtained their baccalaureate abroad.
Location of baccalaureate-origin institution for doctorate recipients, by citizenship and field of study: 1999 and 2019
S&E = science an engineering.
Note(s):
Excludes respondents who did not report citizenship.
Source(s):
National Center for Science and Engineering Statistics, Survey of Earned Doctorates, 2019.
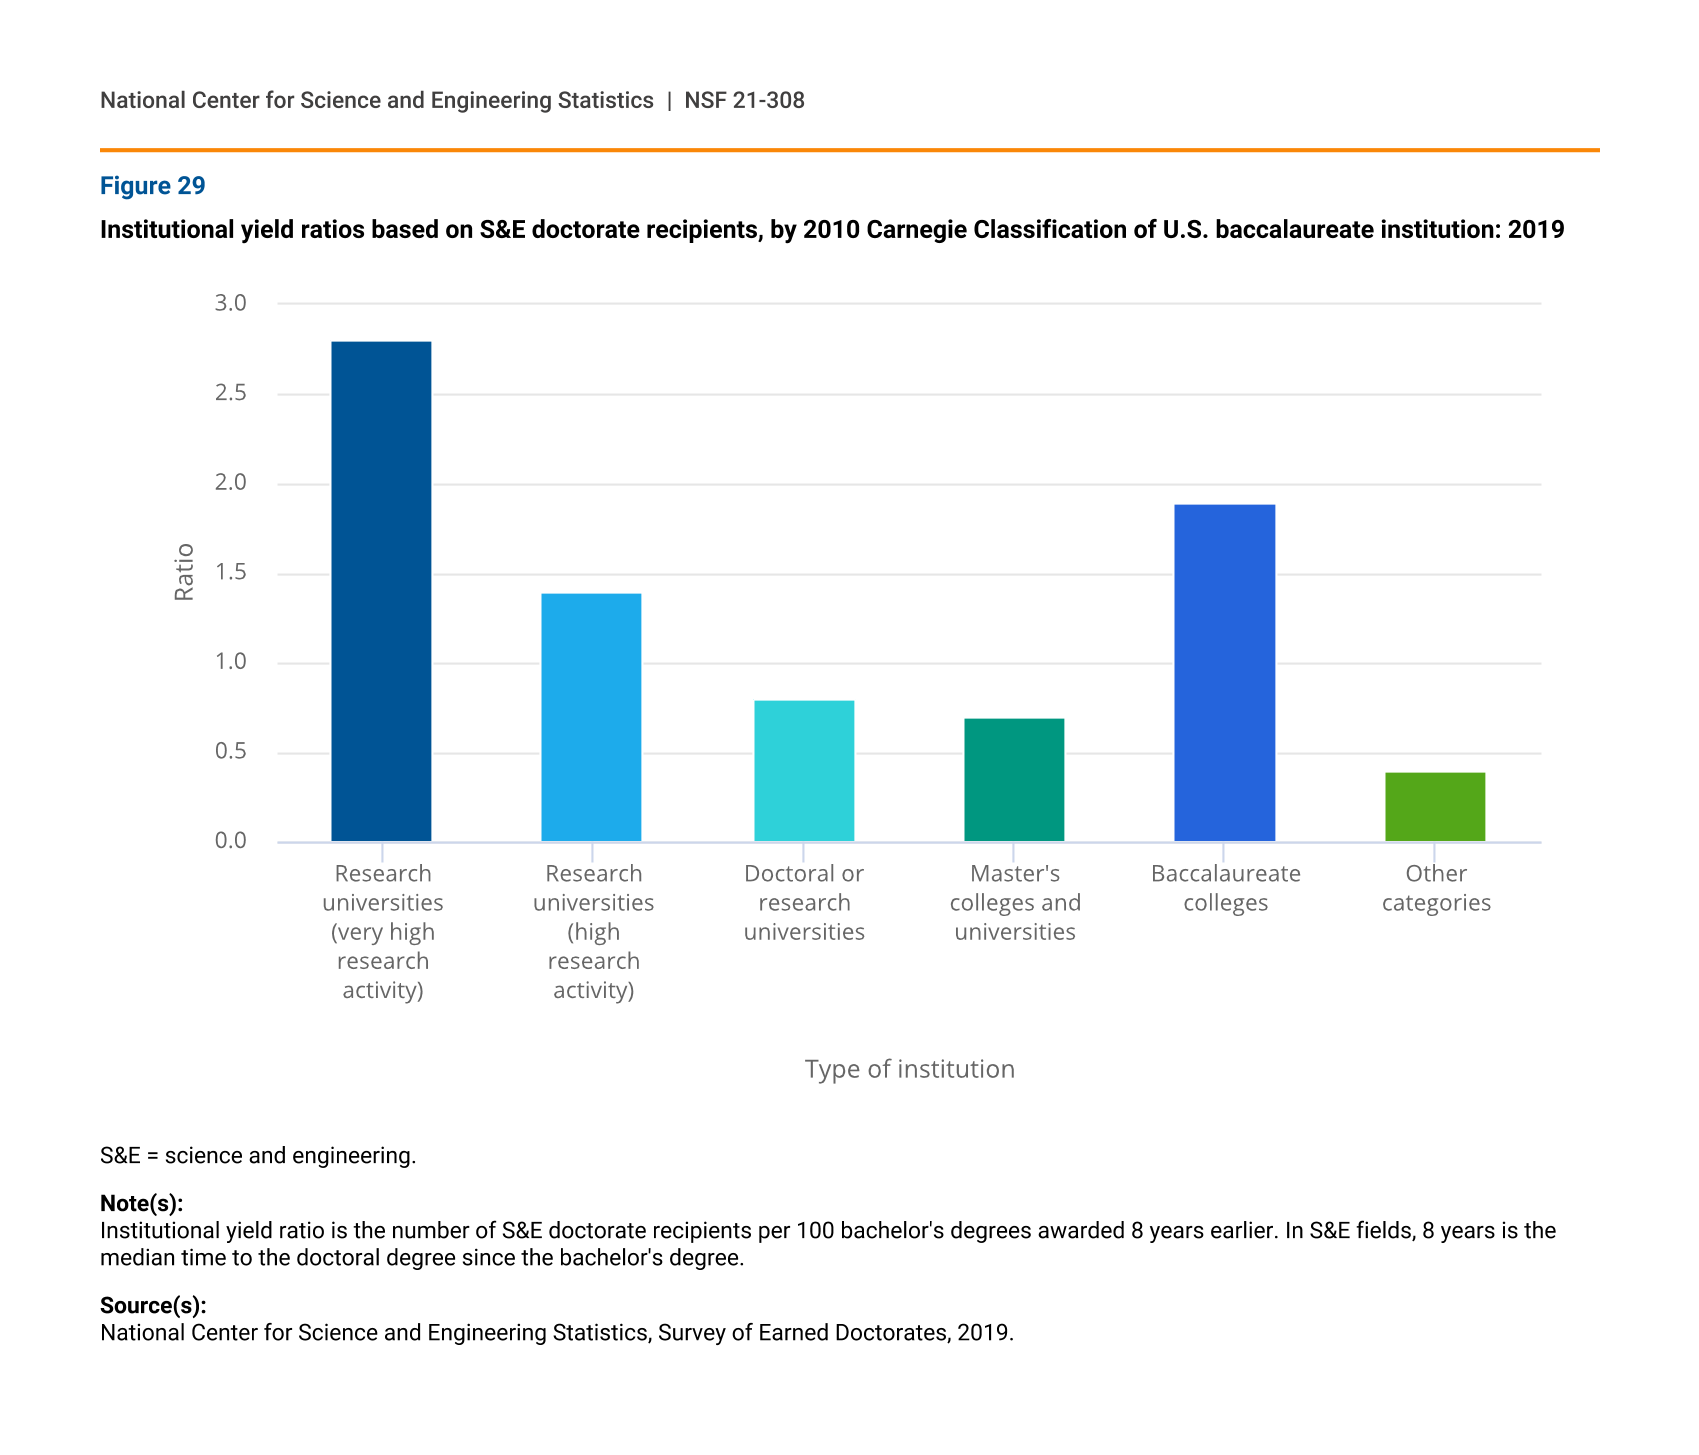
Among S&E doctorate recipients who earned their bachelor’s in the United States, universities with very high research activity and baccalaureate colleges were the most frequent baccalaureate institutions of doctorates recipients, when adjusted by the number of bachelor's degrees awarded in all fields by different types of academic institutions—the institutional yield ratio, see glossary (figure 29). For example, for every 100 individuals who earned their bachelor’s degree in 2011 from a very high research activity university, 2.8 of them are estimated to have completed an S&E doctorate in 2019; the number is 1.9 from baccalaureate colleges and 1.4 or fewer for other types of institutions.
Institutional yield ratios based on S&E doctorate recipients, by 2010 Carnegie Classification of U.S. baccalaureate institution: 2019
| Type of institution | Institutional yield ratio |
|---|---|
| Research universities (very high research activity) | 2.8 |
| Research universities (high research activity) | 1.4 |
| Doctoral or research universities | 0.8 |
| Master's colleges and universities | 0.7 |
| Baccalaureate colleges | 1.9 |
| Other categories | 0.4 |
S&E = science and engineering.
Note(s):
Institutional yield ratio is the number of S&E doctorate recipients per 100 bachelor's degrees awarded 8 years earlier. In S&E fields, 8 years is the median time to the doctoral degree since the bachelor's degree.
Source(s):
National Center for Science and Engineering Statistics, Survey of Earned Doctorates, 2019.
Baccalaureate origins in HBCUs
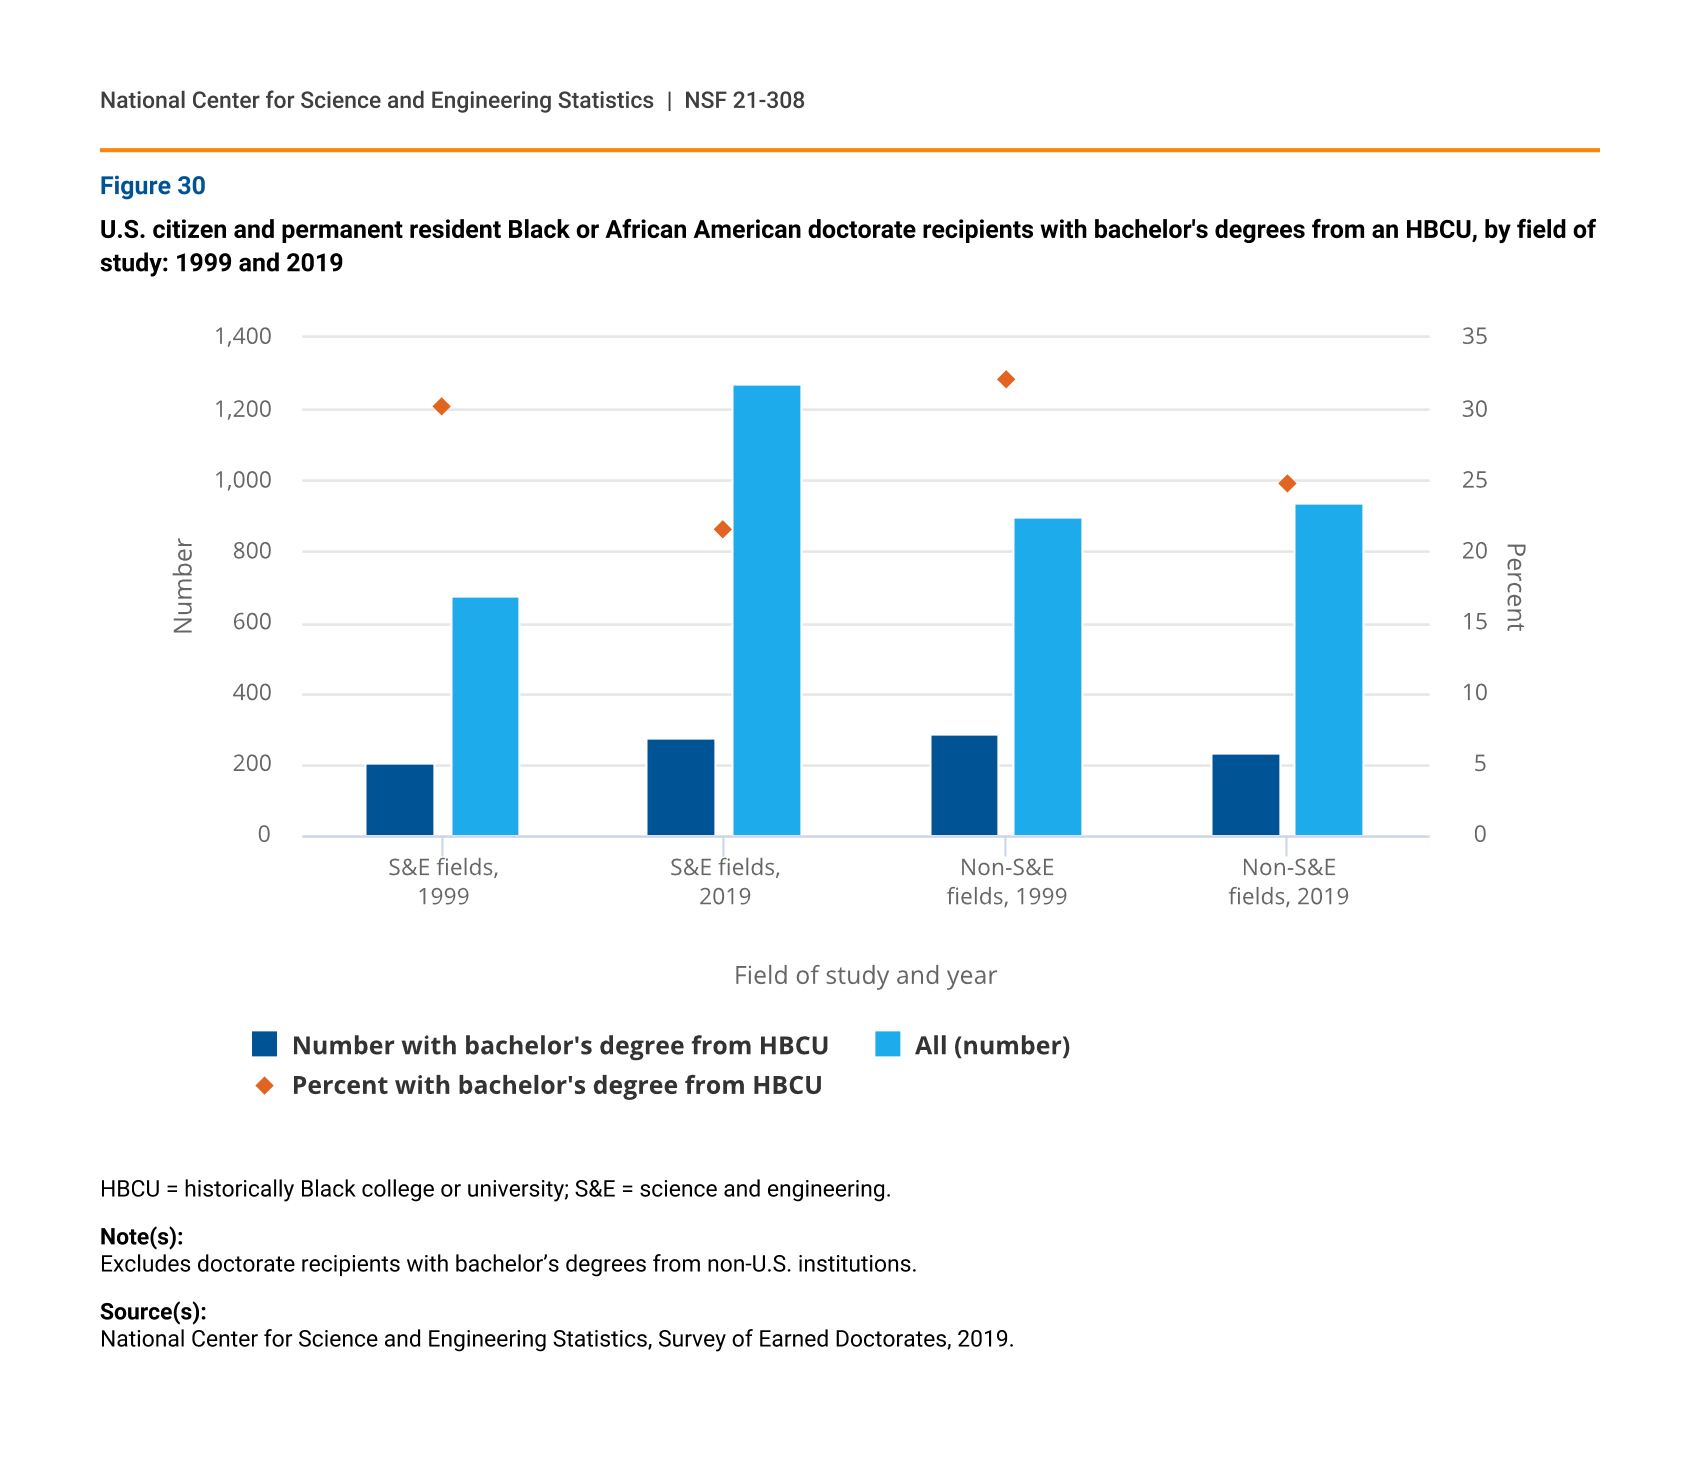
Although the number of Black or African American doctorate recipients who had earned a bachelor’s degree from a U.S. institution grew from 1,575 in 1999 to 2,210 in 2019, the number of those with a baccalaureate from a historically Black college or university (HBCU, see glossary) only grew from 493 to 508 in the same period (figure 30). As a result, the proportion of Black or African American doctorate recipients with baccalaureate degrees from HBCUs declined, both in S&E and non-S&E fields. The number of HBCUs is determined by law and generally constant over time while the overall number of Black or African American undergraduate students has increased.
U.S. citizen and permanent resident Black or African American doctorate recipients with bachelor's degrees from an HBCU, by field of study: 1999 and 2019
| Field of study and year | Number with bachelor's degree from HBCU | All (number) | Percent with bachelor's degree from HBCU |
|---|---|---|---|
| S&E fields, 1999 | 204 | 676 | 30.2 |
| S&E fields, 2019 | 275 | 1,271 | 21.6 |
| Non-S&E fields, 1999 | 289 | 899 | 32.1 |
| Non-S&E fields, 2019 | 233 | 939 | 24.8 |
HBCU = historically Black college or university; S&E = science and engineering.
Note(s):
Excludes doctorate recipients with bachelor’s degrees from non-U.S. institutions.
Source(s):
National Center for Science and Engineering Statistics, Survey of Earned Doctorates, 2019.
Baccalaureate origins in HHEs
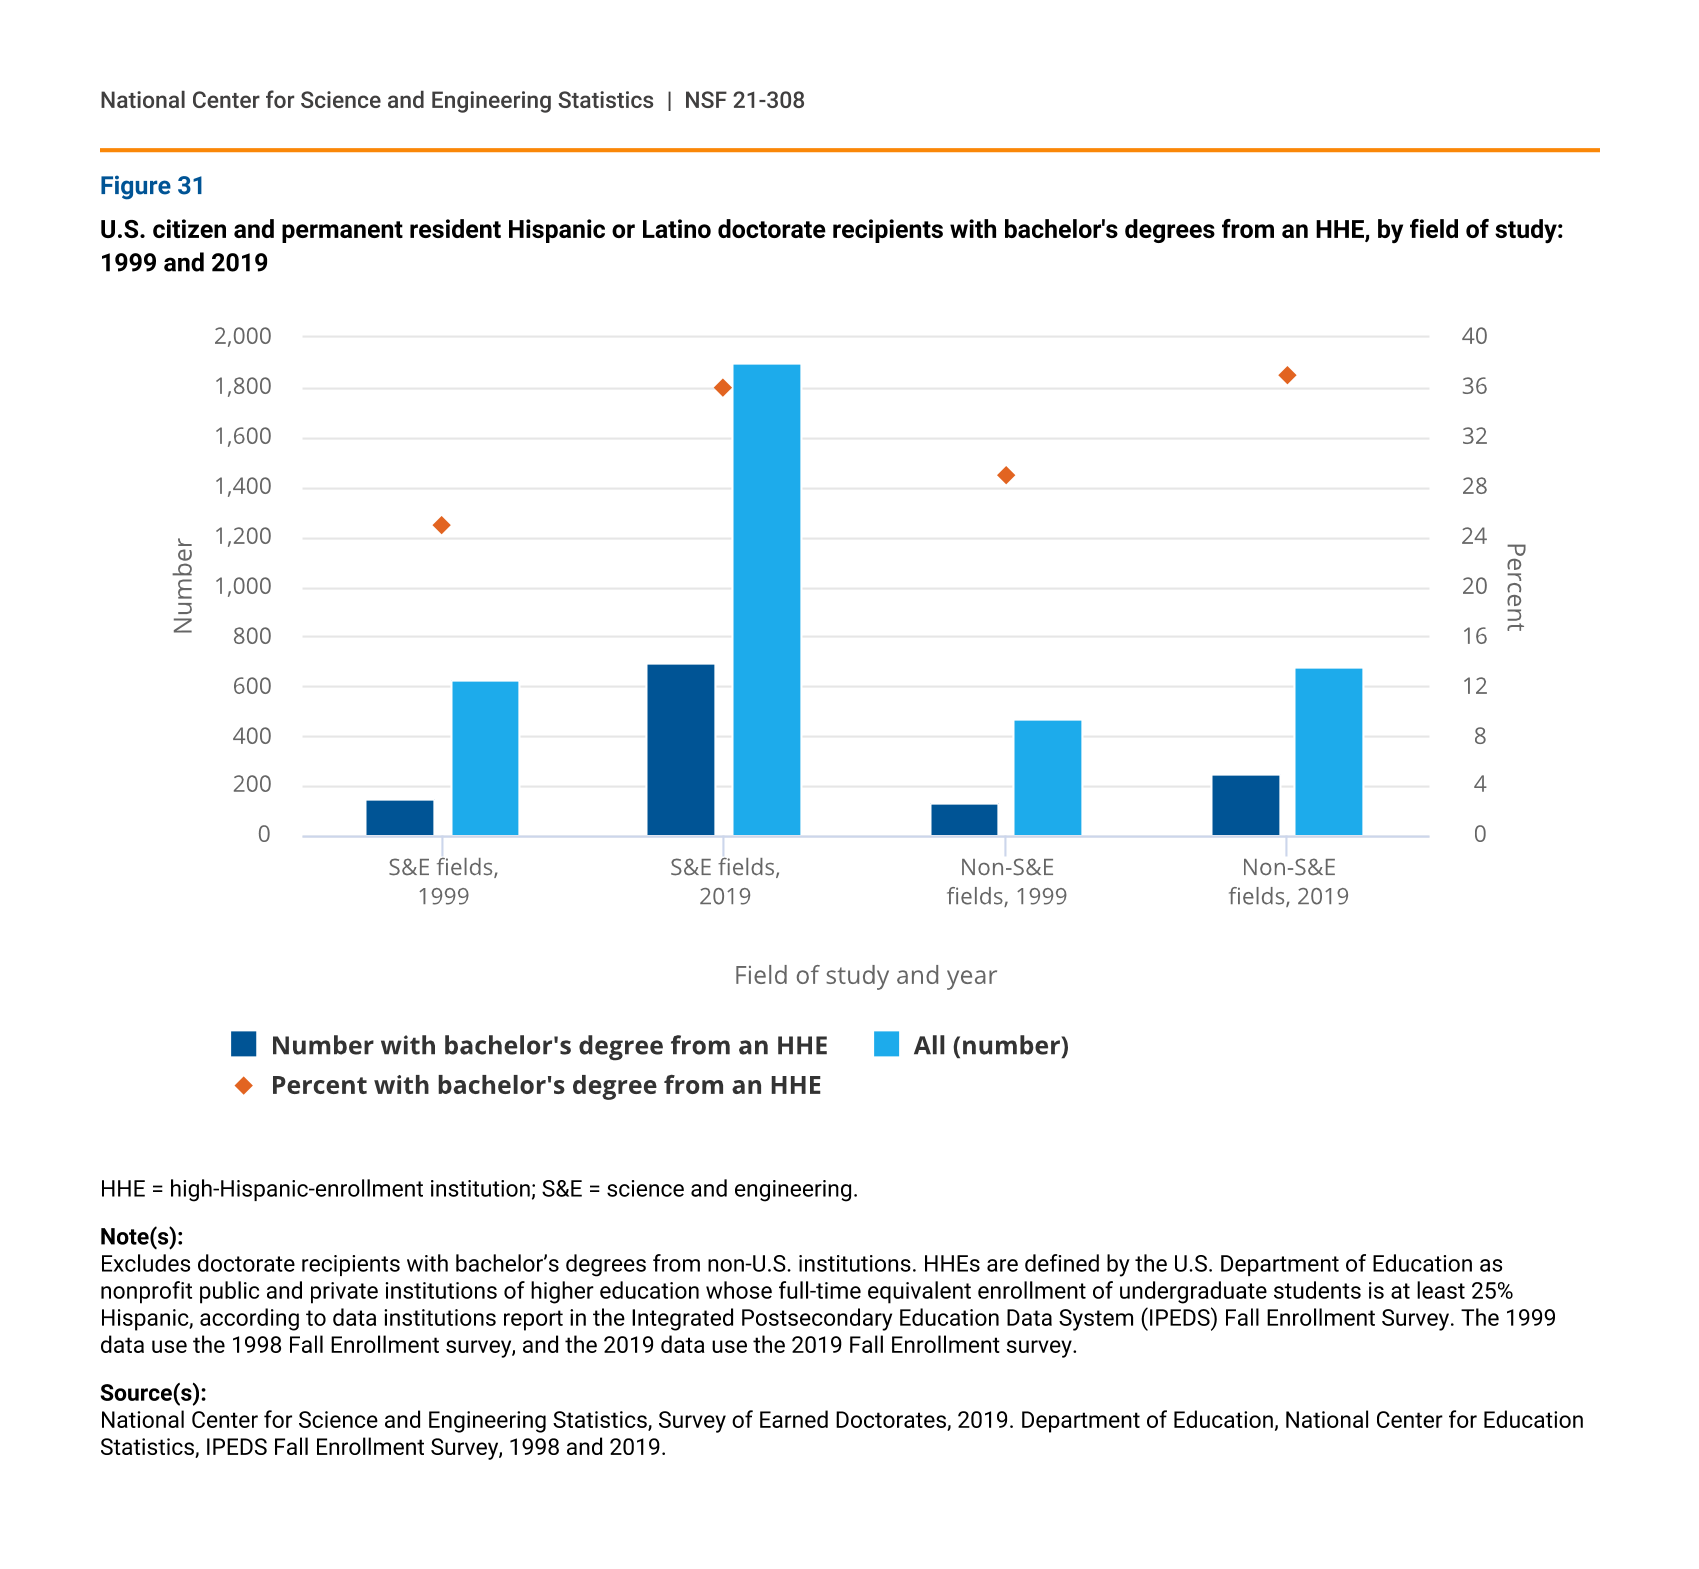
In the past 20 years, the number of Hispanic or Latino doctorate recipients who had earned a bachelor’s degree from a U.S. institution more than doubled to 2,578, and the number of those with a bachelor’s degree from a high-Hispanic-enrollment institution (HHE, see glossary) more than tripled to 939 (figure 31). Consequently, the proportion of Hispanic or Latino doctorate recipients with baccalaureates from an HHE increased, both in S&E and in non-S&E fields. Unlike HBCUs, the number of HHEs has increased over time, parallel with Hispanic or Latino undergraduate enrollment.
U.S. citizen and permanent resident Hispanic or Latino doctorate recipients with bachelor's degrees from an HHE, by field of study: 1999 and 2019
| Field of study and year | Number with bachelor's degree from an HHE | All (number) | Percent with bachelor's degree from an HHE |
|---|---|---|---|
| S&E fields, 1999 | 154 | 626 | 25 |
| S&E fields, 2019 | 692 | 1,901 | 36 |
| Non-S&E fields, 1999 | 133 | 467 | 29 |
| Non-S&E fields, 2019 | 247 | 677 | 37 |
HHE = high-Hispanic-enrollment institution; S&E = science and engineering.
Note(s):
Excludes doctorate recipients with bachelor’s degrees from non-U.S. institutions. HHEs are defined by the U.S. Department of Education as nonprofit public and private institutions of higher education whose full-time equivalent enrollment of undergraduate students is at least 25% Hispanic, according to data institutions report in the Integrated Postsecondary Education Data System (IPEDS) Fall Enrollment Survey. The 1999 data use the 1998 Fall Enrollment survey, and the 2019 data use the 2019 Fall Enrollment survey.
Source(s):
National Center for Science and Engineering Statistics, Survey of Earned Doctorates, 2019. Department of Education, National Center for Education Statistics, IPEDS Fall Enrollment Survey, 1998 and 2019.
Doctorate recipients with master’s degrees
Time trends in master’s degree by field
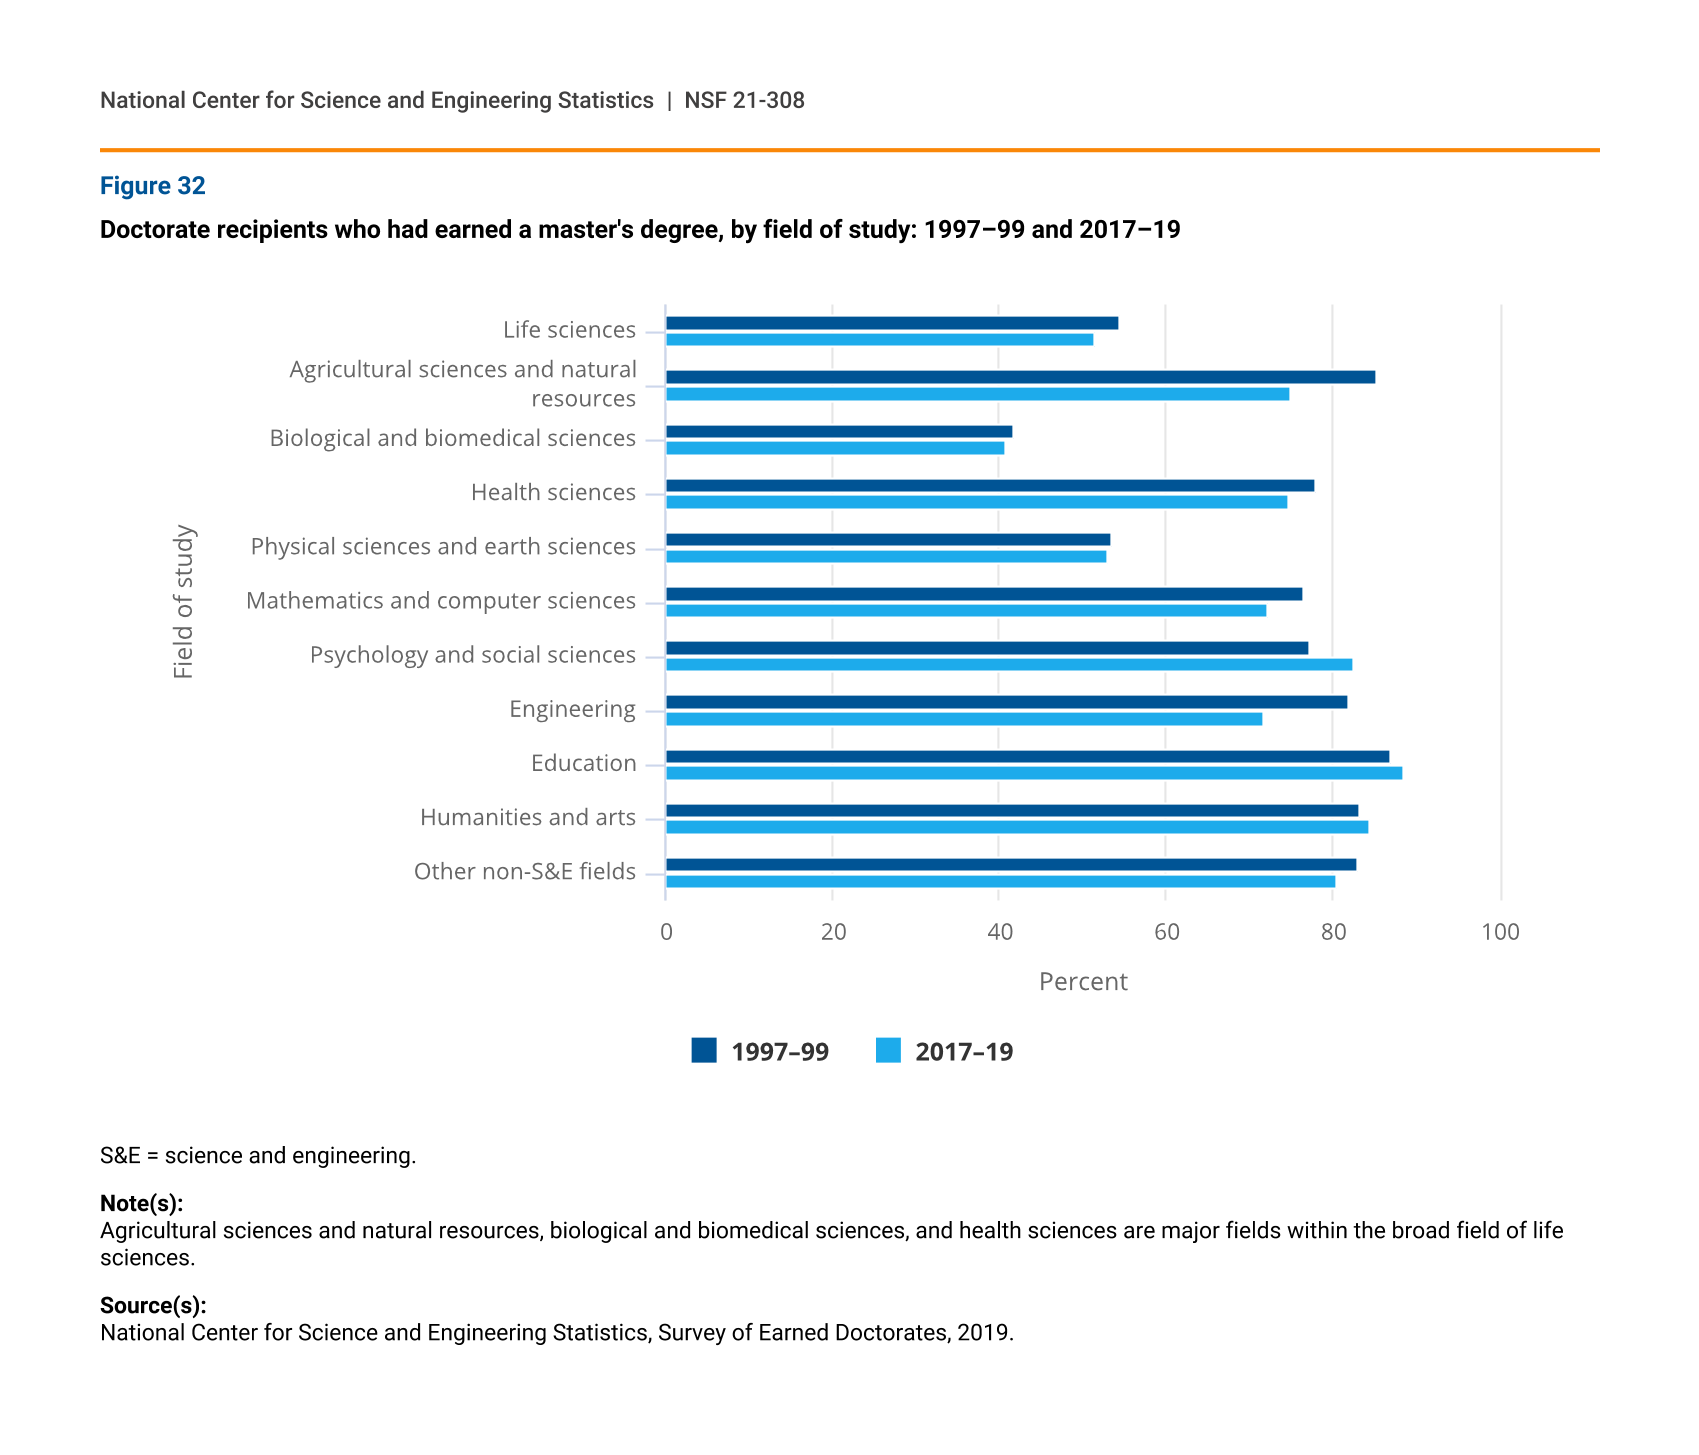
In most fields, the majority of doctorate recipients earned a master’s degree before their doctorate (figure 32). Doctorate recipients in the biological and biomedical sciences are the exception; 41% of those graduating in 2017–19 had earned a master’s degree on their path to the doctorate. In contrast, more than 80% of doctorate recipients in psychology and social sciences and in non-S&E fields had earned a master’s degree.
In most fields, the proportion of doctorate recipients who had earned a master’s on their way to their doctorate remained similar when compared with the proportion in the late 1990s. However, in engineering and in agricultural sciences and natural resources this proportion declined by 10%.
Doctorate recipients who had earned a master's degree, by field of study: 1997–99 and 2017–19
| Field of study | 1997–99 | 2017–19 |
|---|---|---|
| Life sciences | 54.4 | 51.6 |
| Agricultural sciences and natural resources | 85.3 | 74.9 |
| Biological and biomedical sciences | 41.8 | 40.8 |
| Health sciences | 78.1 | 74.8 |
| Physical sciences and earth sciences | 53.5 | 53.0 |
| Mathematics and computer sciences | 76.4 | 72.2 |
| Psychology and social sciences | 77.2 | 82.6 |
| Engineering | 82.0 | 71.8 |
| Education | 87.1 | 88.6 |
| Humanities and arts | 83.3 | 84.5 |
| Other non-S&E fields | 82.9 | 80.6 |
S&E = science and engineering.
Note(s):
Agricultural sciences and natural resources, biological and biomedical sciences, and health sciences are major fields within the broad field of life sciences.
Source(s):
National Center for Science and Engineering Statistics, Survey of Earned Doctorates, 2019.
Field switching between degree levels
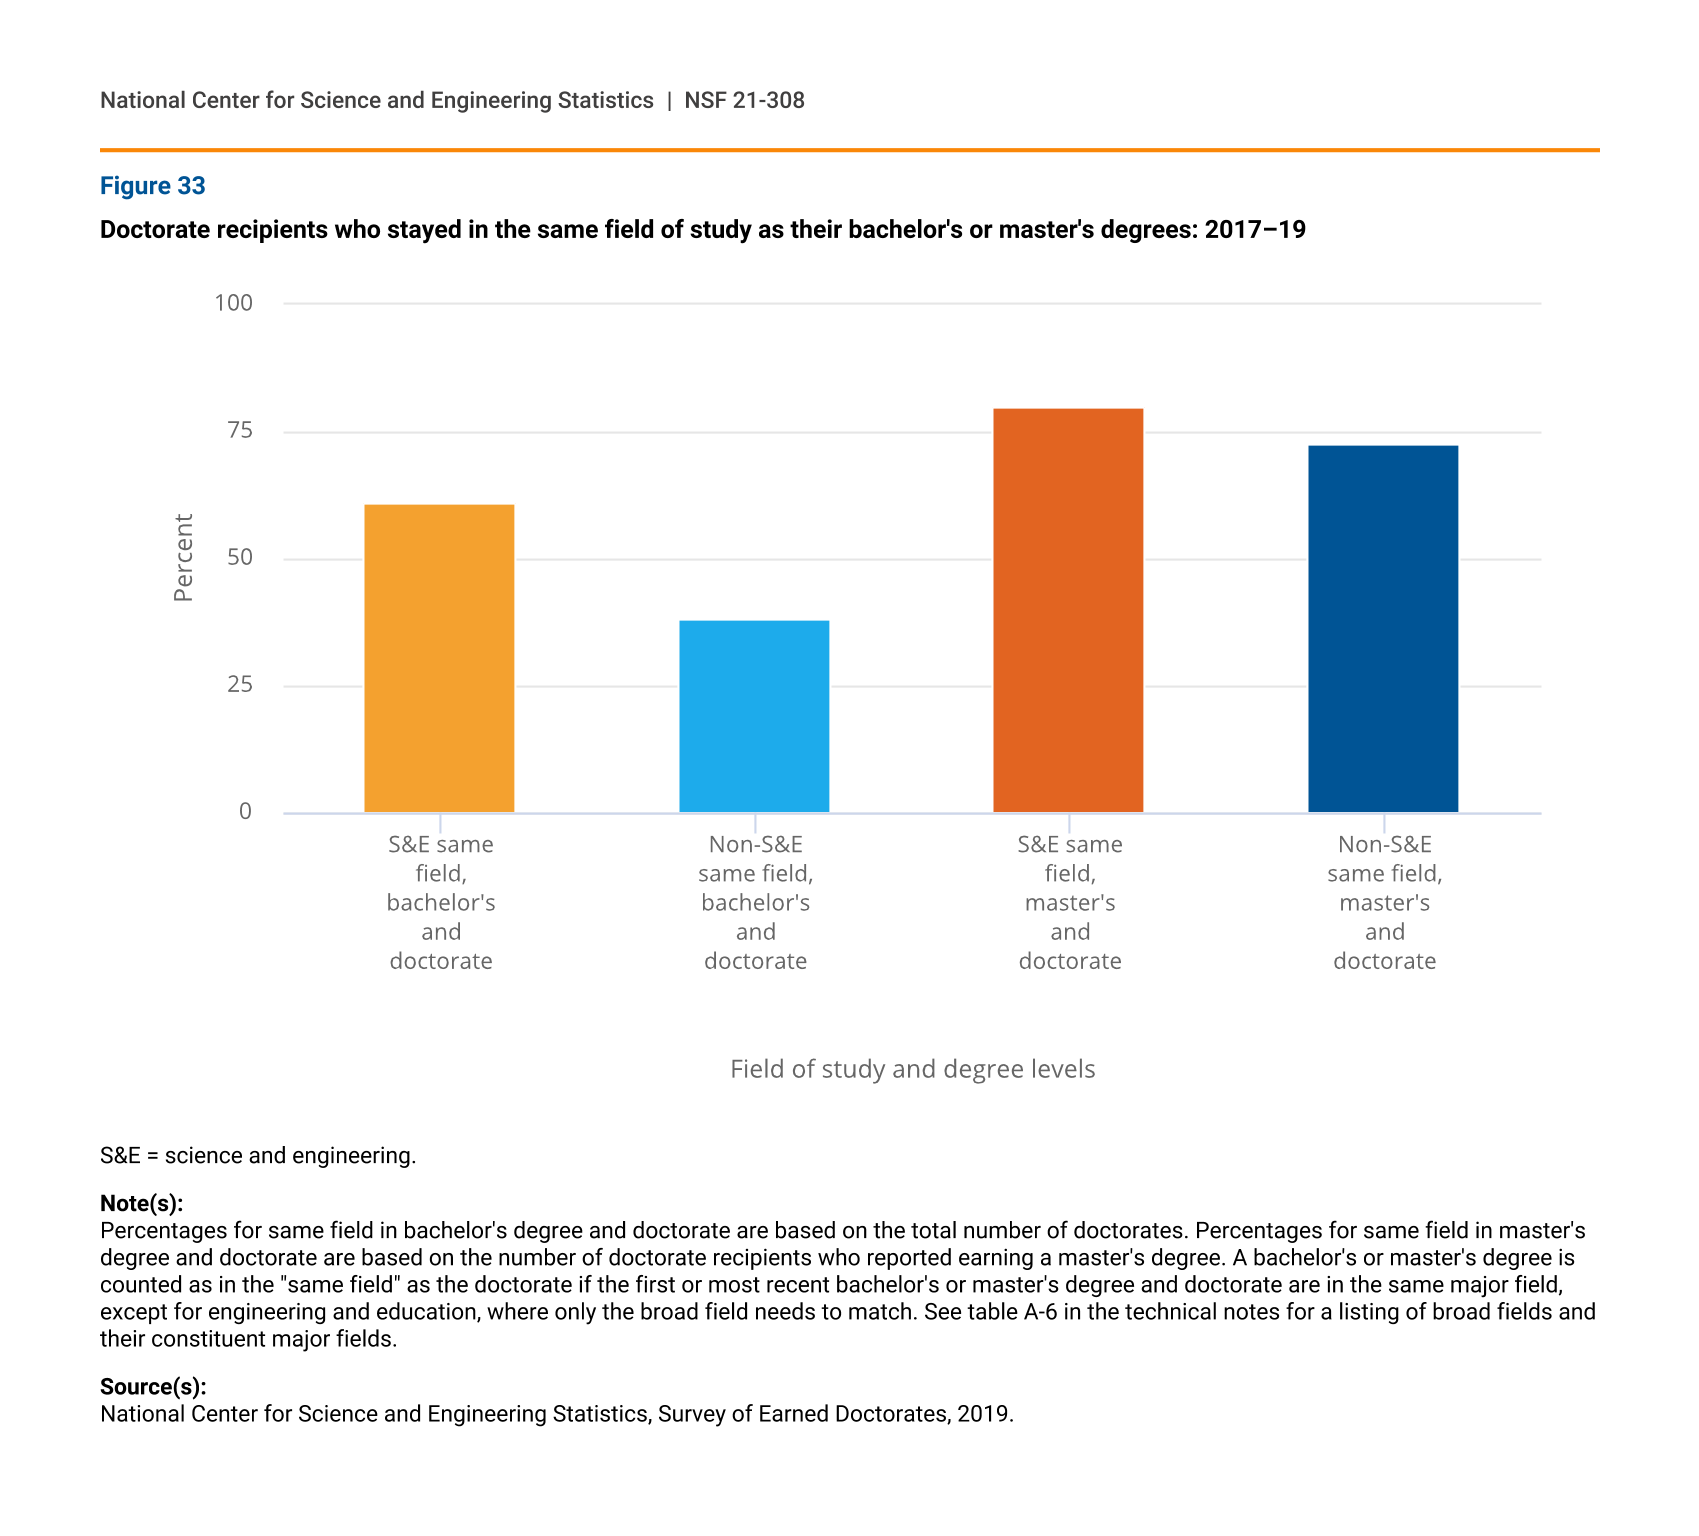
In general, doctorate recipients are more likely to hold doctoral and master’s degrees in the same field than to hold doctoral and bachelor’s degrees in the same field. However, S&E doctorate recipients are more likely than their counterparts in non-S&E fields to remain in the same bachelor’s and master’s field.
Among doctorate recipients who earned their doctorate degree in 2017–19, 61% of S&E doctorate recipients remained in the same field as their baccalaureate, compared with 38% of non-S&E doctorate recipients (figure 33). Eighty percent of S&E doctorate recipients stayed in the same field as their master’s degree, compared with 73% of those in non-S&E fields.
Doctorate recipients who stayed in the same field of study as their bachelor's or master's degrees: 2017–19
| Field of study and degree levels | Stayed in the same field |
|---|---|
| S&E same field, bachelor's and doctorate | 61.0 |
| Non-S&E same field, bachelor's and doctorate | 38.2 |
| S&E same field, master's and doctorate | 80.0 |
| Non-S&E same field, master's and doctorate | 72.5 |
S&E = science and engineering.
Note(s):
Percentages for same field in bachelor's degree and doctorate are based on the total number of doctorates. Percentages for same field in master's degree and doctorate are based on the number of doctorate recipients who reported earning a master's degree. A bachelor's or master's degree is counted as in the "same field" as the doctorate if the first or most recent bachelor's or master's degree and doctorate are in the same major field, except for engineering and education, where only the broad field needs to match. See table A-6 in the technical notes for a listing of broad fields and their constituent major fields.
Source(s):
National Center for Science and Engineering Statistics, Survey of Earned Doctorates, 2019.
Field switching between bachelor’s and doctoral degrees
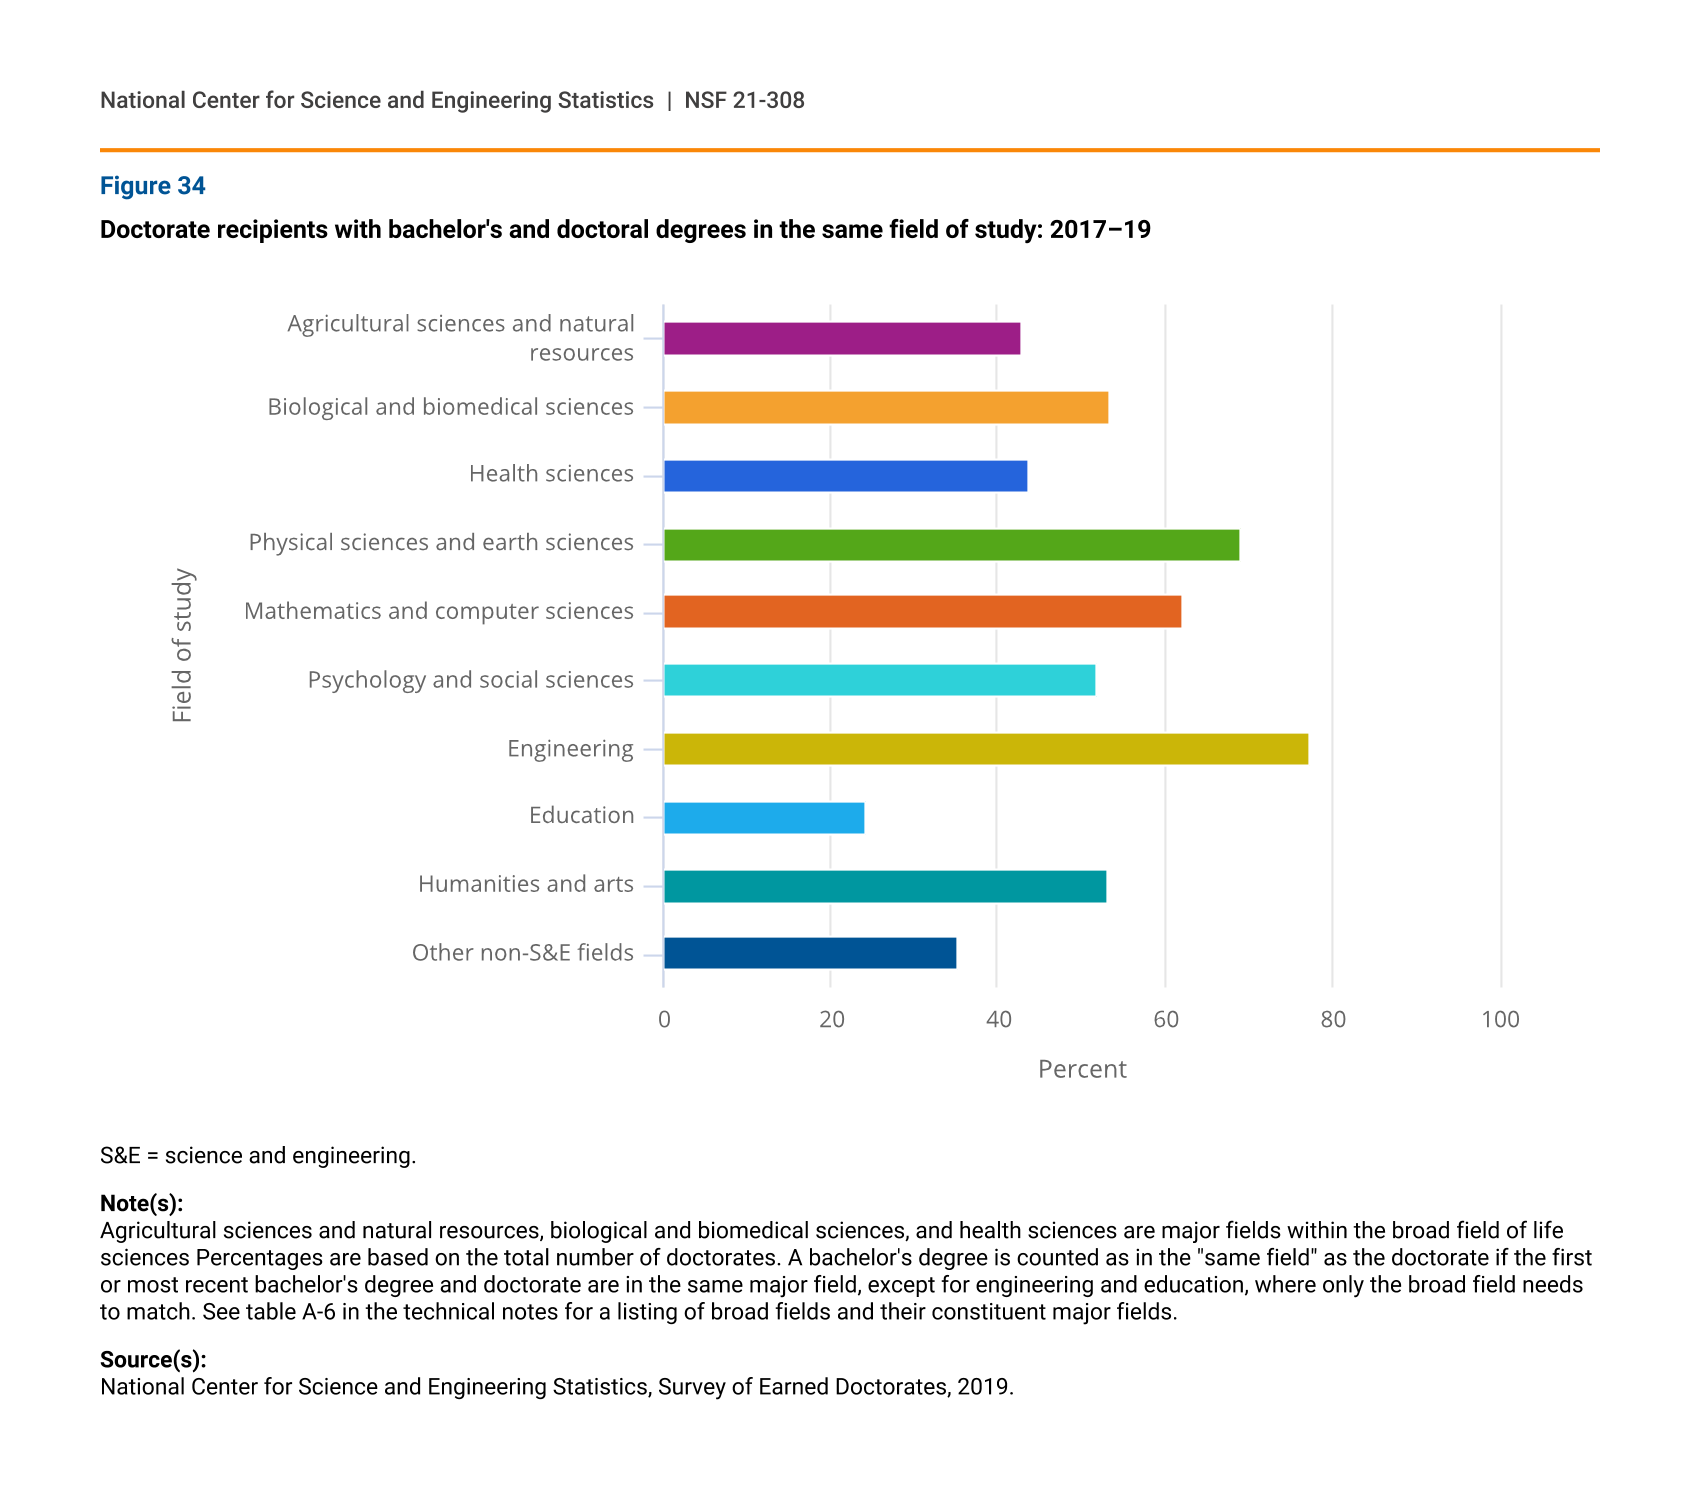
In 2017–19, the proportion of doctorate recipients who remained in the same field as their bachelor’s degree was highest in engineering (77%), physical sciences and earth sciences (69%), and mathematics and computer sciences (62%) (figure 34). In contrast, less than a quarter of those in education remained in the same field, possibly because a doctorate in education adds competencies that supplement prior degrees in subject-area fields.
Doctorate recipients with bachelor's and doctoral degrees in the same field of study: 2017–19
| Field of study | Same field for bacheor's and doctorate |
|---|---|
| Agricultural sciences and natural resources | 43.0 |
| Biological and biomedical sciences | 53.3 |
| Health sciences | 43.6 |
| Physical sciences and earth sciences | 69.2 |
| Mathematics and computer sciences | 62.2 |
| Psychology and social sciences | 51.8 |
| Engineering | 77.3 |
| Education | 24.1 |
| Humanities and arts | 53.0 |
| Other non-S&E fields | 35.2 |
S&E = science and engineering.
Note(s):
Agricultural sciences and natural resources, biological and biomedical sciences, and health sciences are major fields within the broad field of life sciences Percentages are based on the total number of doctorates. A bachelor's degree is counted as in the "same field" as the doctorate if the first or most recent bachelor's degree and doctorate are in the same major field, except for engineering and education, where only the broad field needs to match. See table A-6 in the technical notes for a listing of broad fields and their constituent major fields.
Source(s):
National Center for Science and Engineering Statistics, Survey of Earned Doctorates, 2019.
Field switching between master’s and doctoral degrees
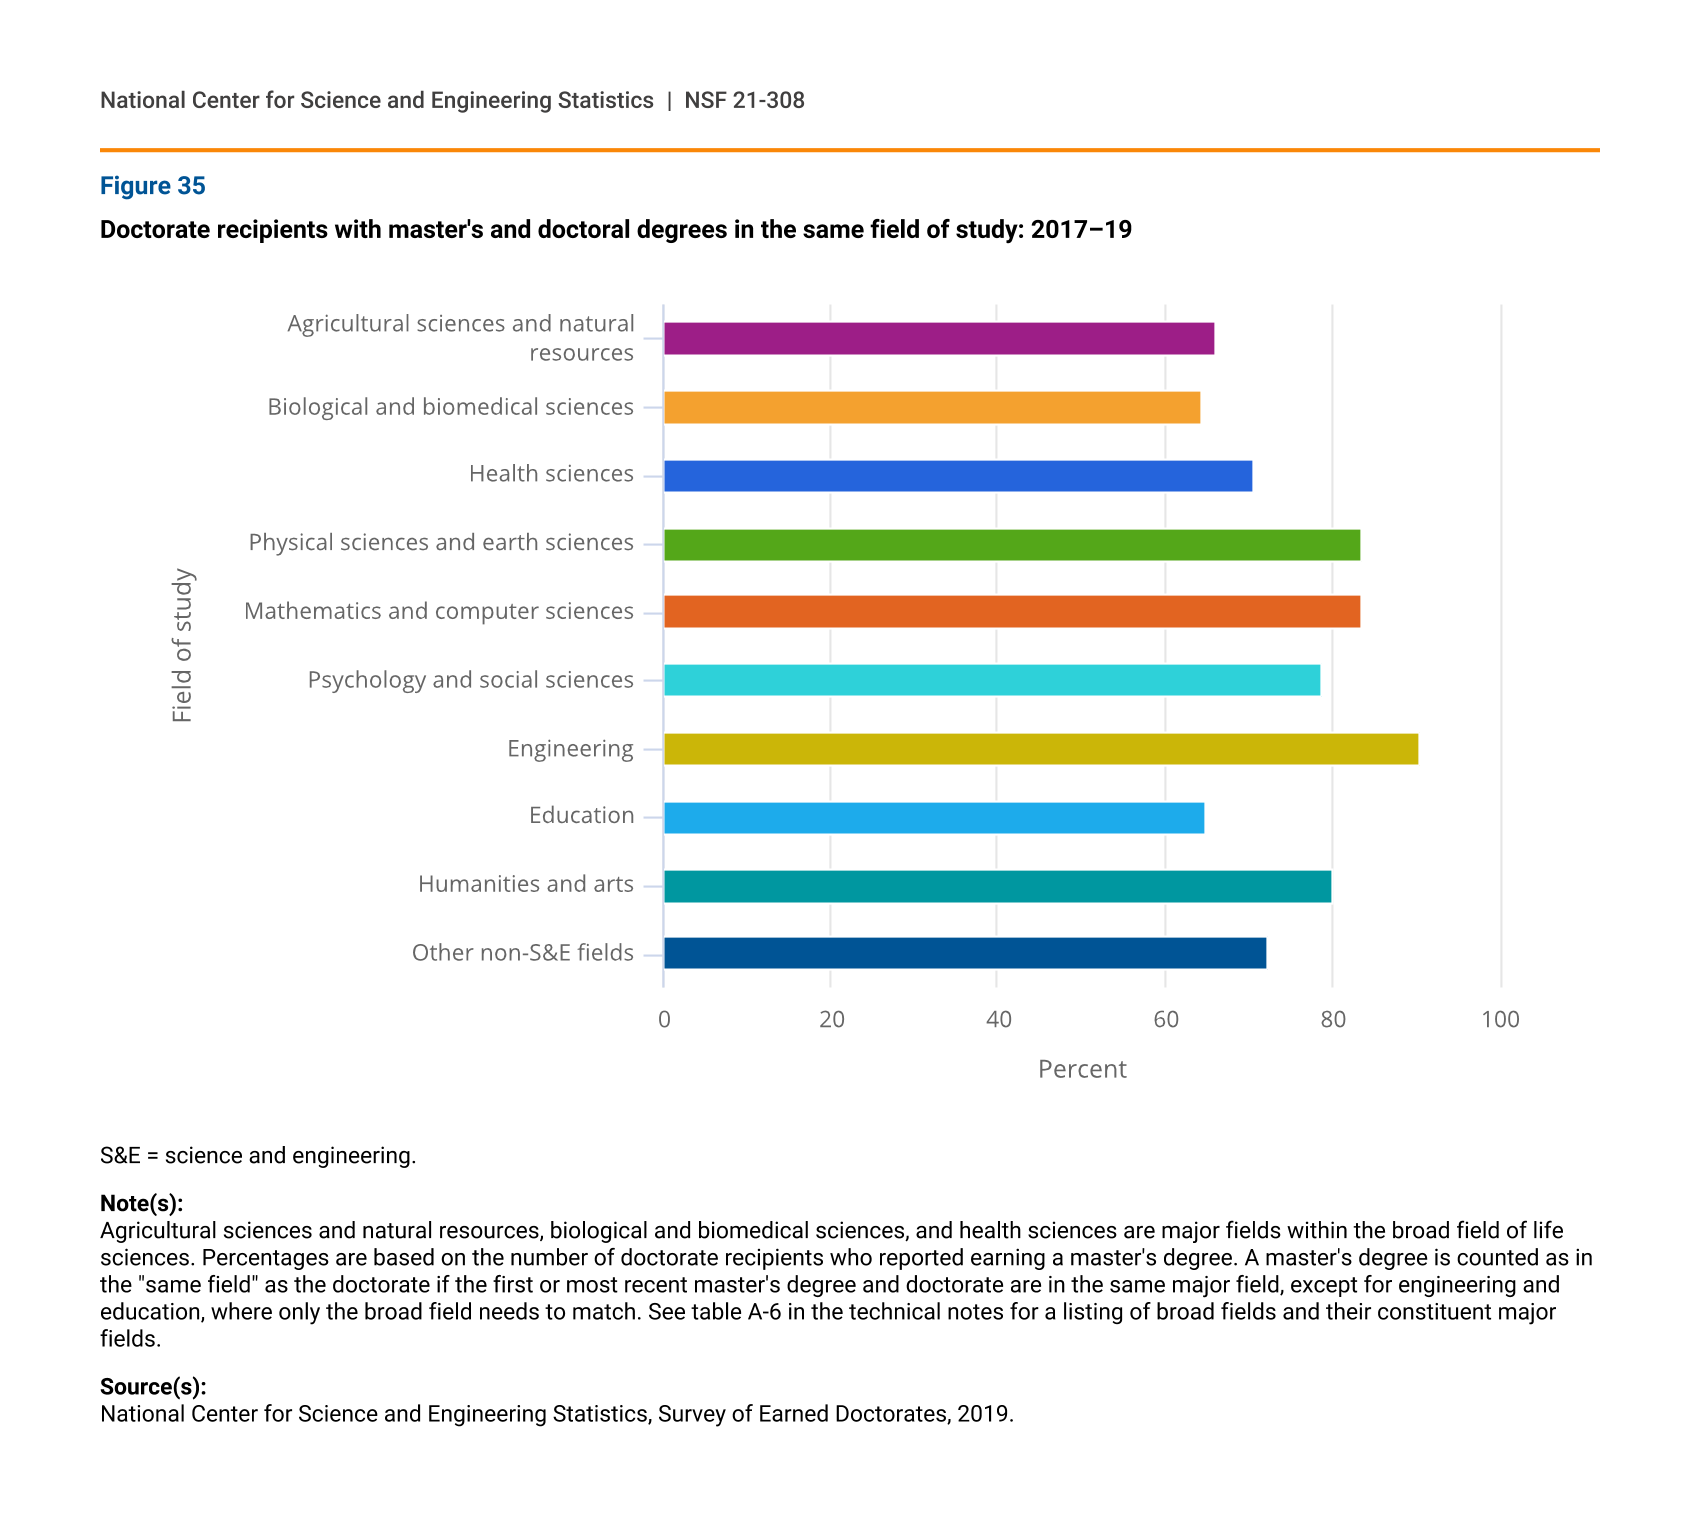
For all fields in 2017–19, the majority of the doctorate recipients remained in the same field as their master’s degree. However, the proportion was highest among those in engineering (90%), followed by those in mathematics and computer sciences (84%), physical sciences and earth sciences (84%), humanities and arts (80%), and psychology and social sciences (79%) (figure 35).
Doctorate recipients with master's and doctoral degrees in the same field of study: 2017–19
| Field of study | Same field for master's and doctorate |
|---|---|
| Agricultural sciences and natural resources | 66.1 |
| Biological and biomedical sciences | 64.3 |
| Health sciences | 70.5 |
| Physical sciences and earth sciences | 83.5 |
| Mathematics and computer sciences | 83.6 |
| Psychology and social sciences | 78.9 |
| Engineering | 90.4 |
| Education | 64.8 |
| Humanities and arts | 80.0 |
| Other non-S&E fields | 72.4 |
S&E = science and engineering.
Note(s):
Agricultural sciences and natural resources, biological and biomedical sciences, and health sciences are major fields within the broad field of life sciences. Percentages are based on the number of doctorate recipients who reported earning a master's degree. A master's degree is counted as in the "same field" as the doctorate if the first or most recent master's degree and doctorate are in the same major field, except for engineering and education, where only the broad field needs to match. See table A-6 in the technical notes for a listing of broad fields and their constituent major fields.
Source(s):
National Center for Science and Engineering Statistics, Survey of Earned Doctorates, 2019.
Field switching between degree levels by demographics
Baccalaureate and doctoral field
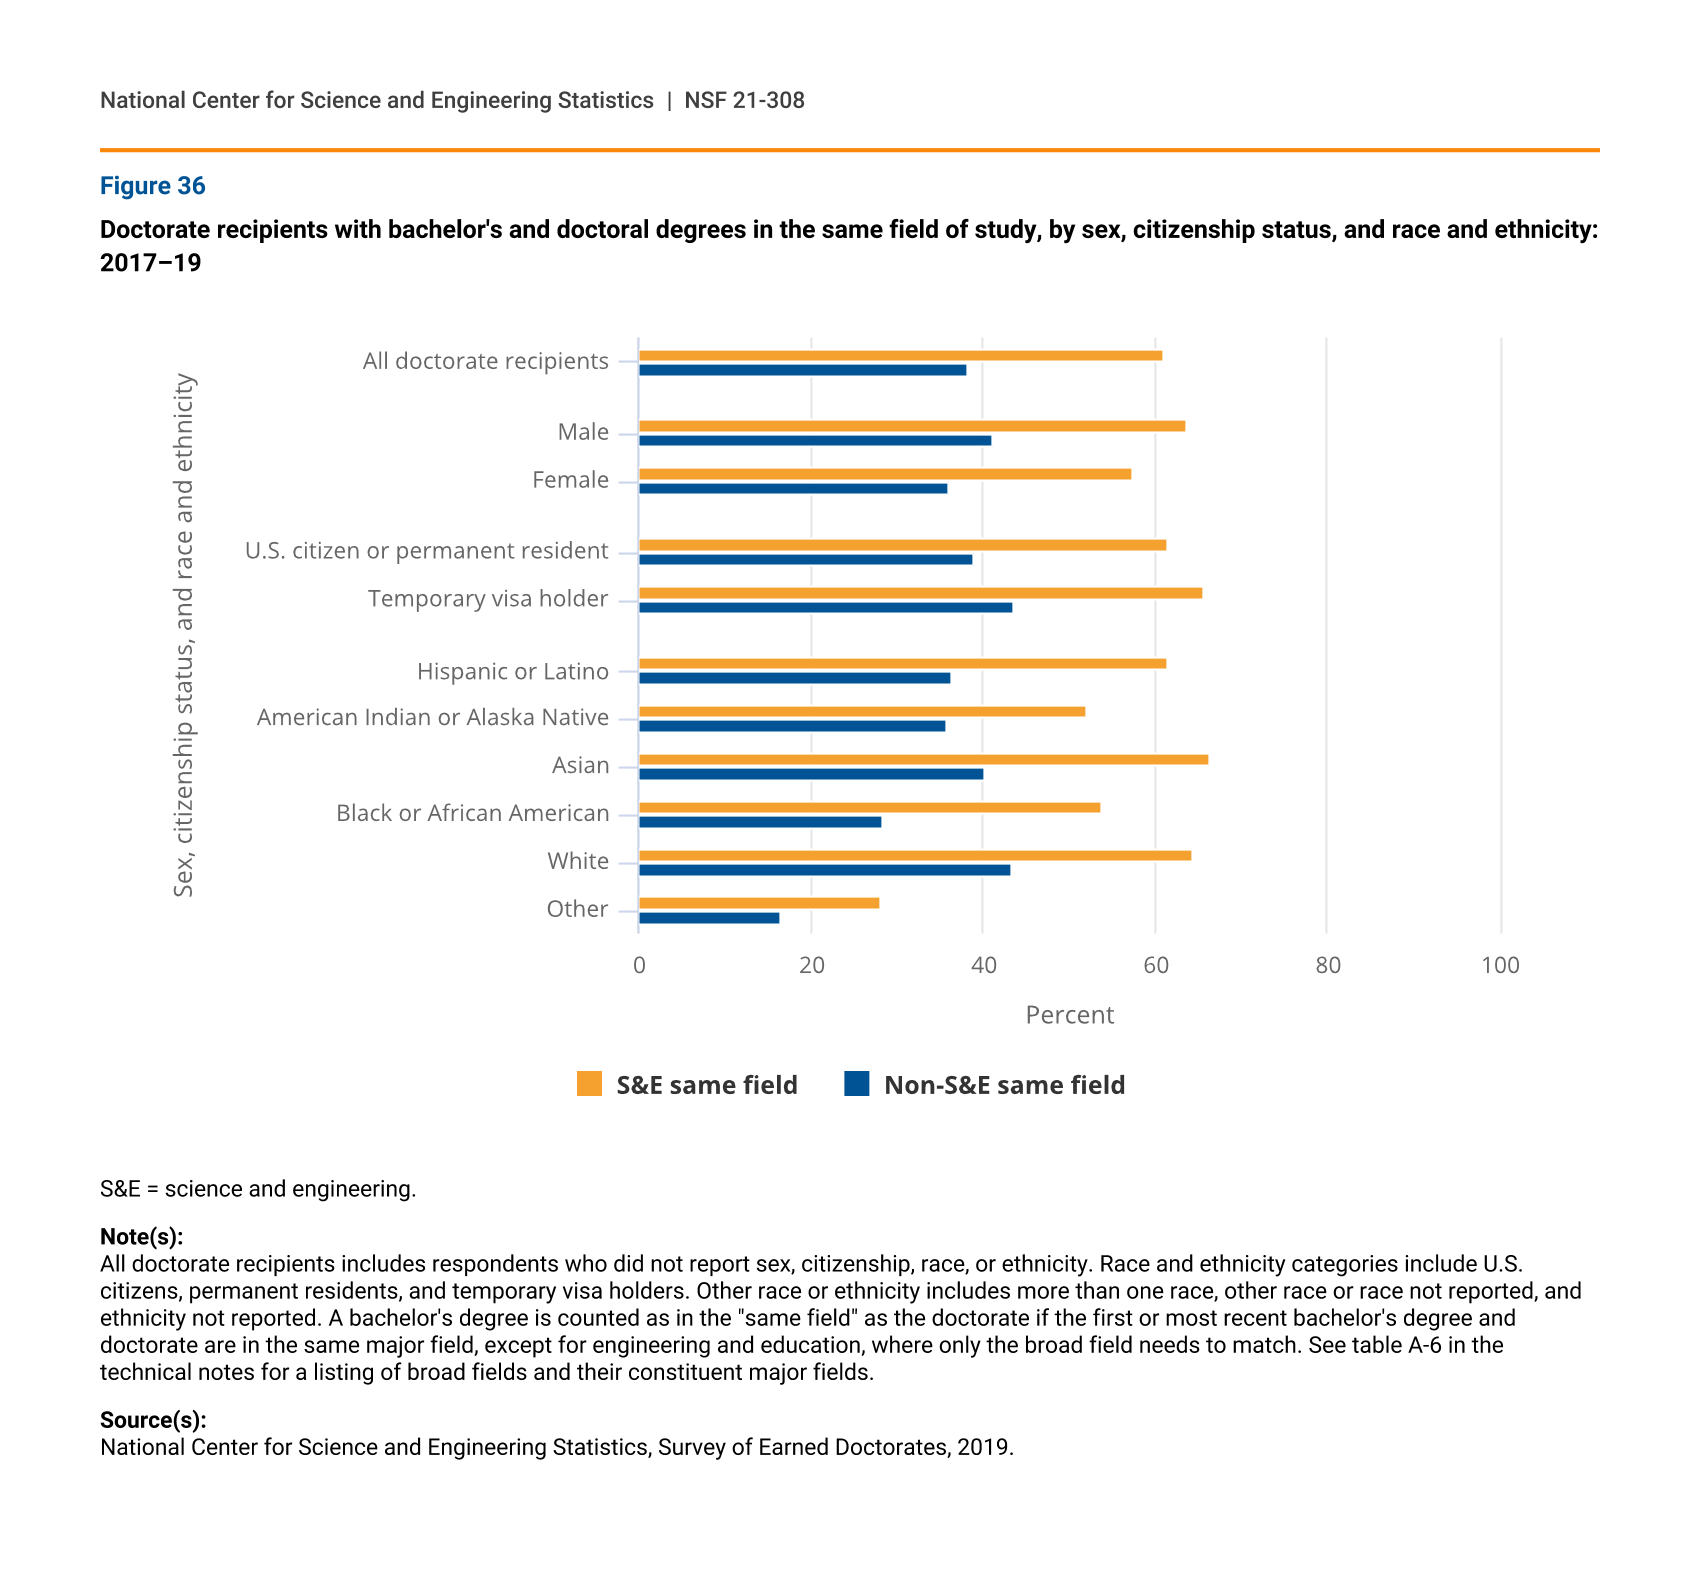
Among doctorates in both S&E and in non-S&E fields, men, temporary visa holders, and White, Asian, and Hispanic or Latino doctorate recipients were more likely than their respective counterparts to have stayed in the same field as their baccalaureate (figure 36).
Doctorate recipients with bachelor's and doctoral degrees in the same field of study, by sex, citizenship status, and race and ethnicity: 2017–19
| Sex, citizenship status, and race and ethnicity | S&E same field | Non-S&E same field |
|---|---|---|
| All doctorate recipients | 61.0 | 38.2 |
| Male | 63.8 | 41.1 |
| Female | 57.3 | 36.1 |
| U.S. citizen or permanent resident | 61.4 | 39.1 |
| Temporary visa holder | 65.5 | 43.5 |
| Hispanic or Latino | 61.5 | 36.2 |
| American Indian or Alaska Native | 52.0 | 35.8 |
| Asian | 66.4 | 40.3 |
| Black or African American | 53.7 | 28.3 |
| White | 64.3 | 43.4 |
| Other | 28.2 | 16.5 |
S&E = science and engineering.
Note(s):
All doctorate recipients includes respondents who did not report sex, citizenship, race, or ethnicity. Race and ethnicity categories include U.S. citizens, permanent residents, and temporary visa holders. Other race or ethnicity includes more than one race, other race or race not reported, and ethnicity not reported. A bachelor's degree is counted as in the "same field" as the doctorate if the first or most recent bachelor's degree and doctorate are in the same major field, except for engineering and education, where only the broad field needs to match. See table A-6 in the technical notes for a listing of broad fields and their constituent major fields.
Source(s):
National Center for Science and Engineering Statistics, Survey of Earned Doctorates, 2019.
Master’s and doctoral field
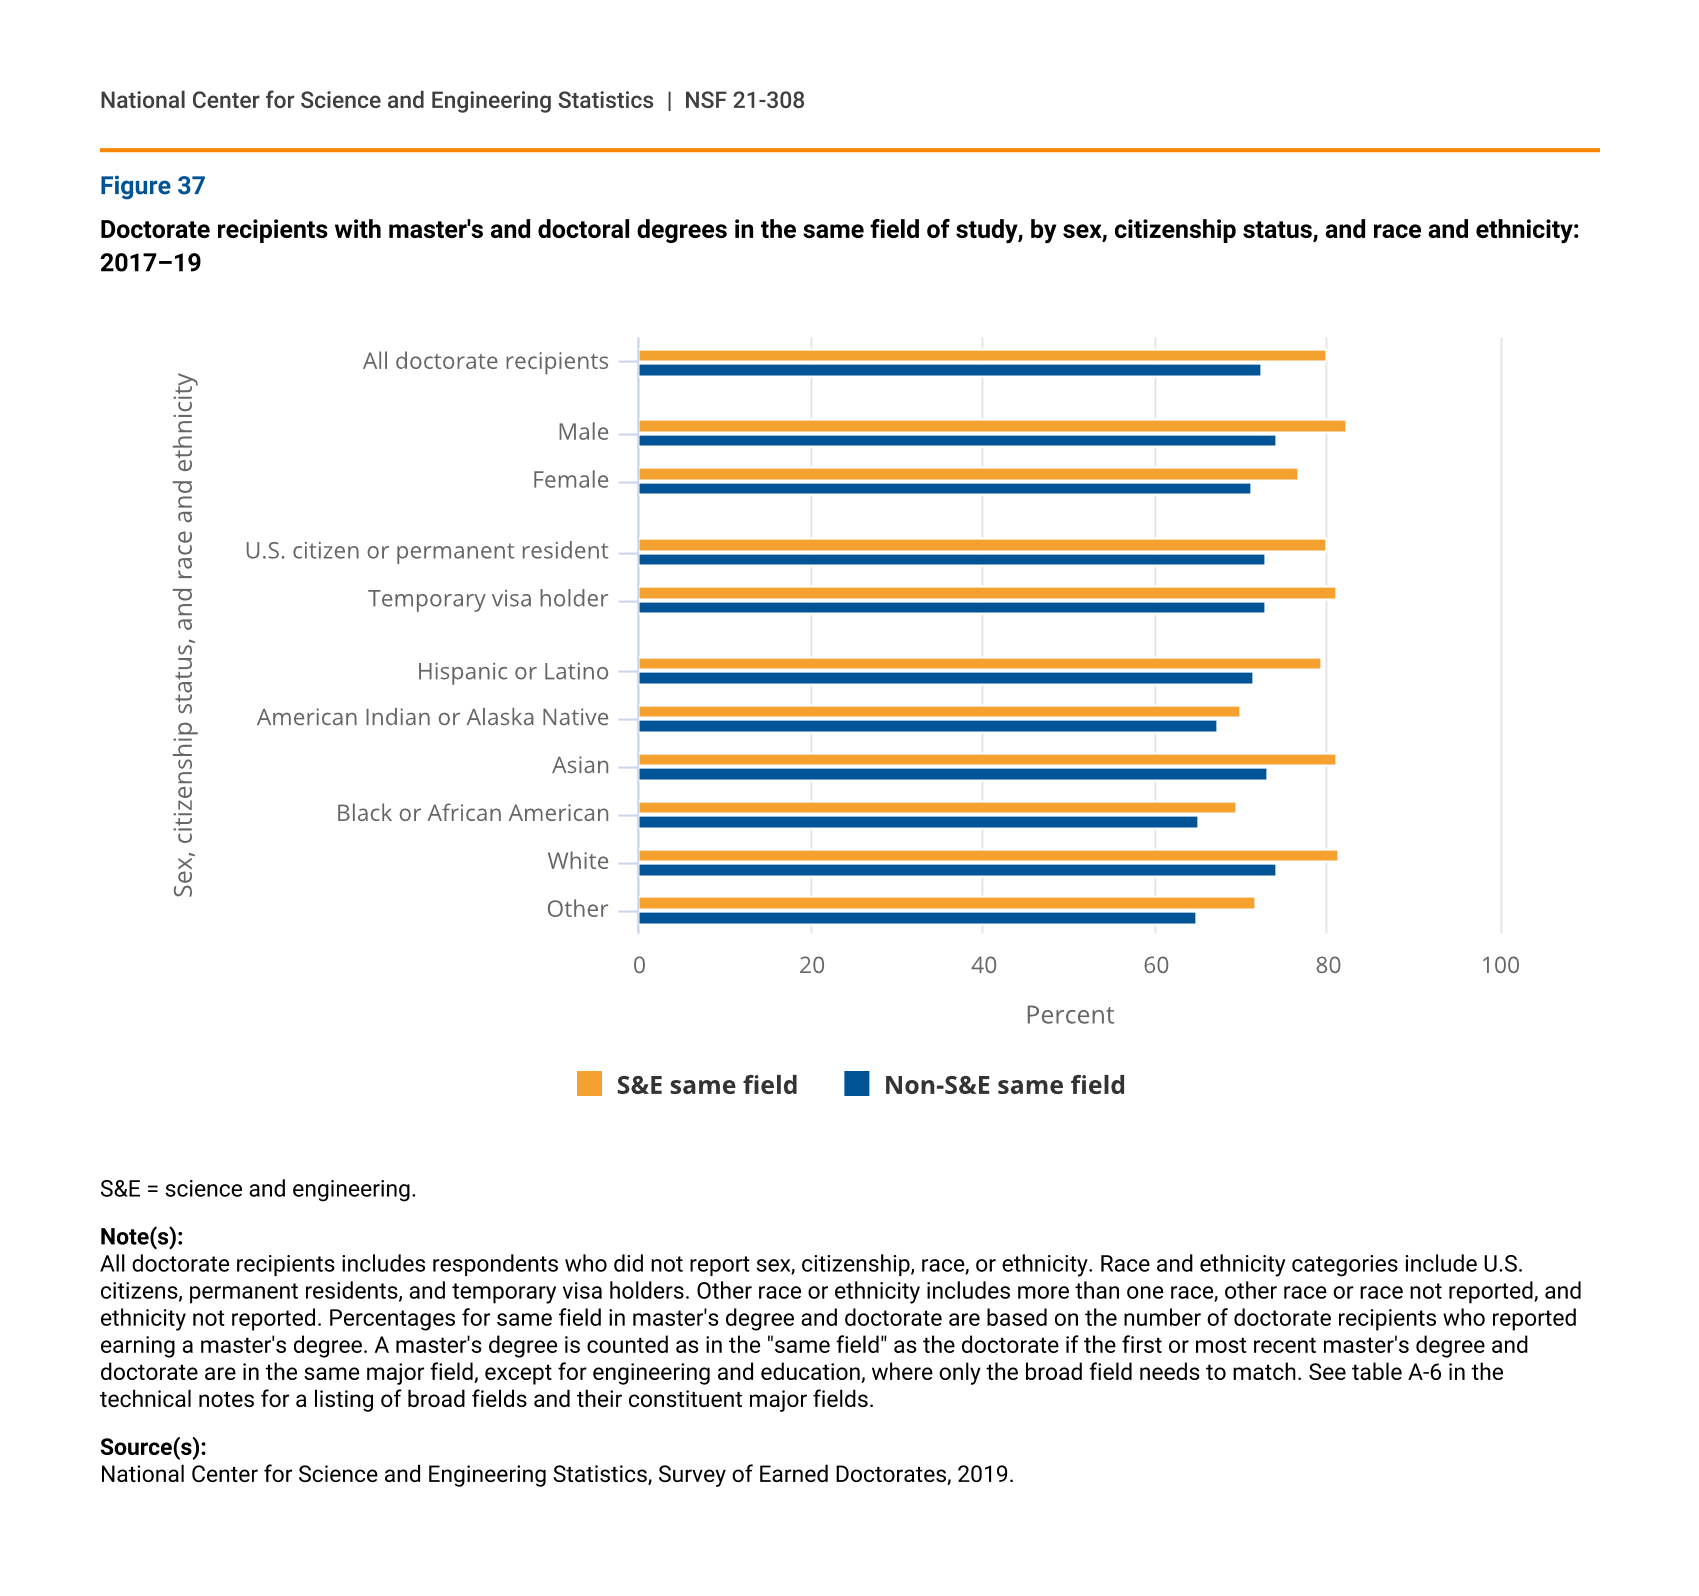
Although S&E doctorate recipients were more likely than those in non-S&E to have earned a master’s in the same field as their doctorate, U.S. citizens and permanent residents were as likely as temporary visa holders to have remained in the same field as their master’s, regardless of field of study. Among S&E doctorates, White, Asian, and Hispanic or Latino doctorate recipients were more likely to stay in the same S&E field as their master’s degree than Black or African American and American Indian or Alaska Native doctorate recipients (figure 37). Among non-S&E doctorates, White and Asian doctorate recipients were the most likely to have stayed in the same field and Black or African American doctorate recipients the least likely to do so.
Doctorate recipients with master's and doctoral degrees in the same field of study, by sex, citizenship status, and race and ethnicity: 2017–19
| Sex, citizenship status, and race and ethnicity | S&E same field | Non-S&E same field |
|---|---|---|
| All doctorate recipients | 80.0 | 72.5 |
| Male | 82.4 | 74.2 |
| Female | 76.8 | 71.3 |
| U.S. citizen or permanent resident | 79.9 | 72.8 |
| Temporary visa holder | 81.0 | 72.9 |
| Hispanic or Latino | 79.3 | 71.5 |
| American Indian or Alaska Native | 70.0 | 67.3 |
| Asian | 81.0 | 73.1 |
| Black or African American | 69.4 | 65.1 |
| White | 81.4 | 74.2 |
| Other | 71.6 | 64.9 |
S&E = science and engineering.
Note(s):
All doctorate recipients includes respondents who did not report sex, citizenship, race, or ethnicity. Race and ethnicity categories include U.S. citizens, permanent residents, and temporary visa holders. Other race or ethnicity includes more than one race, other race or race not reported, and ethnicity not reported. Percentages for same field in master's degree and doctorate are based on the number of doctorate recipients who reported earning a master's degree. A master's degree is counted as in the "same field" as the doctorate if the first or most recent master's degree and doctorate are in the same major field, except for engineering and education, where only the broad field needs to match. See table A-6 in the technical notes for a listing of broad fields and their constituent major fields.
Source(s):
National Center for Science and Engineering Statistics, Survey of Earned Doctorates, 2019.