 An official website of the United States government
 U.S. doctorate awards
Each new cohort of doctorate recipients increases the supply of prospective scientists, engineers, researchers, and scholars. Data on the composition of these cohorts reveal changes in the presence of different demographic groups.
Overall trends
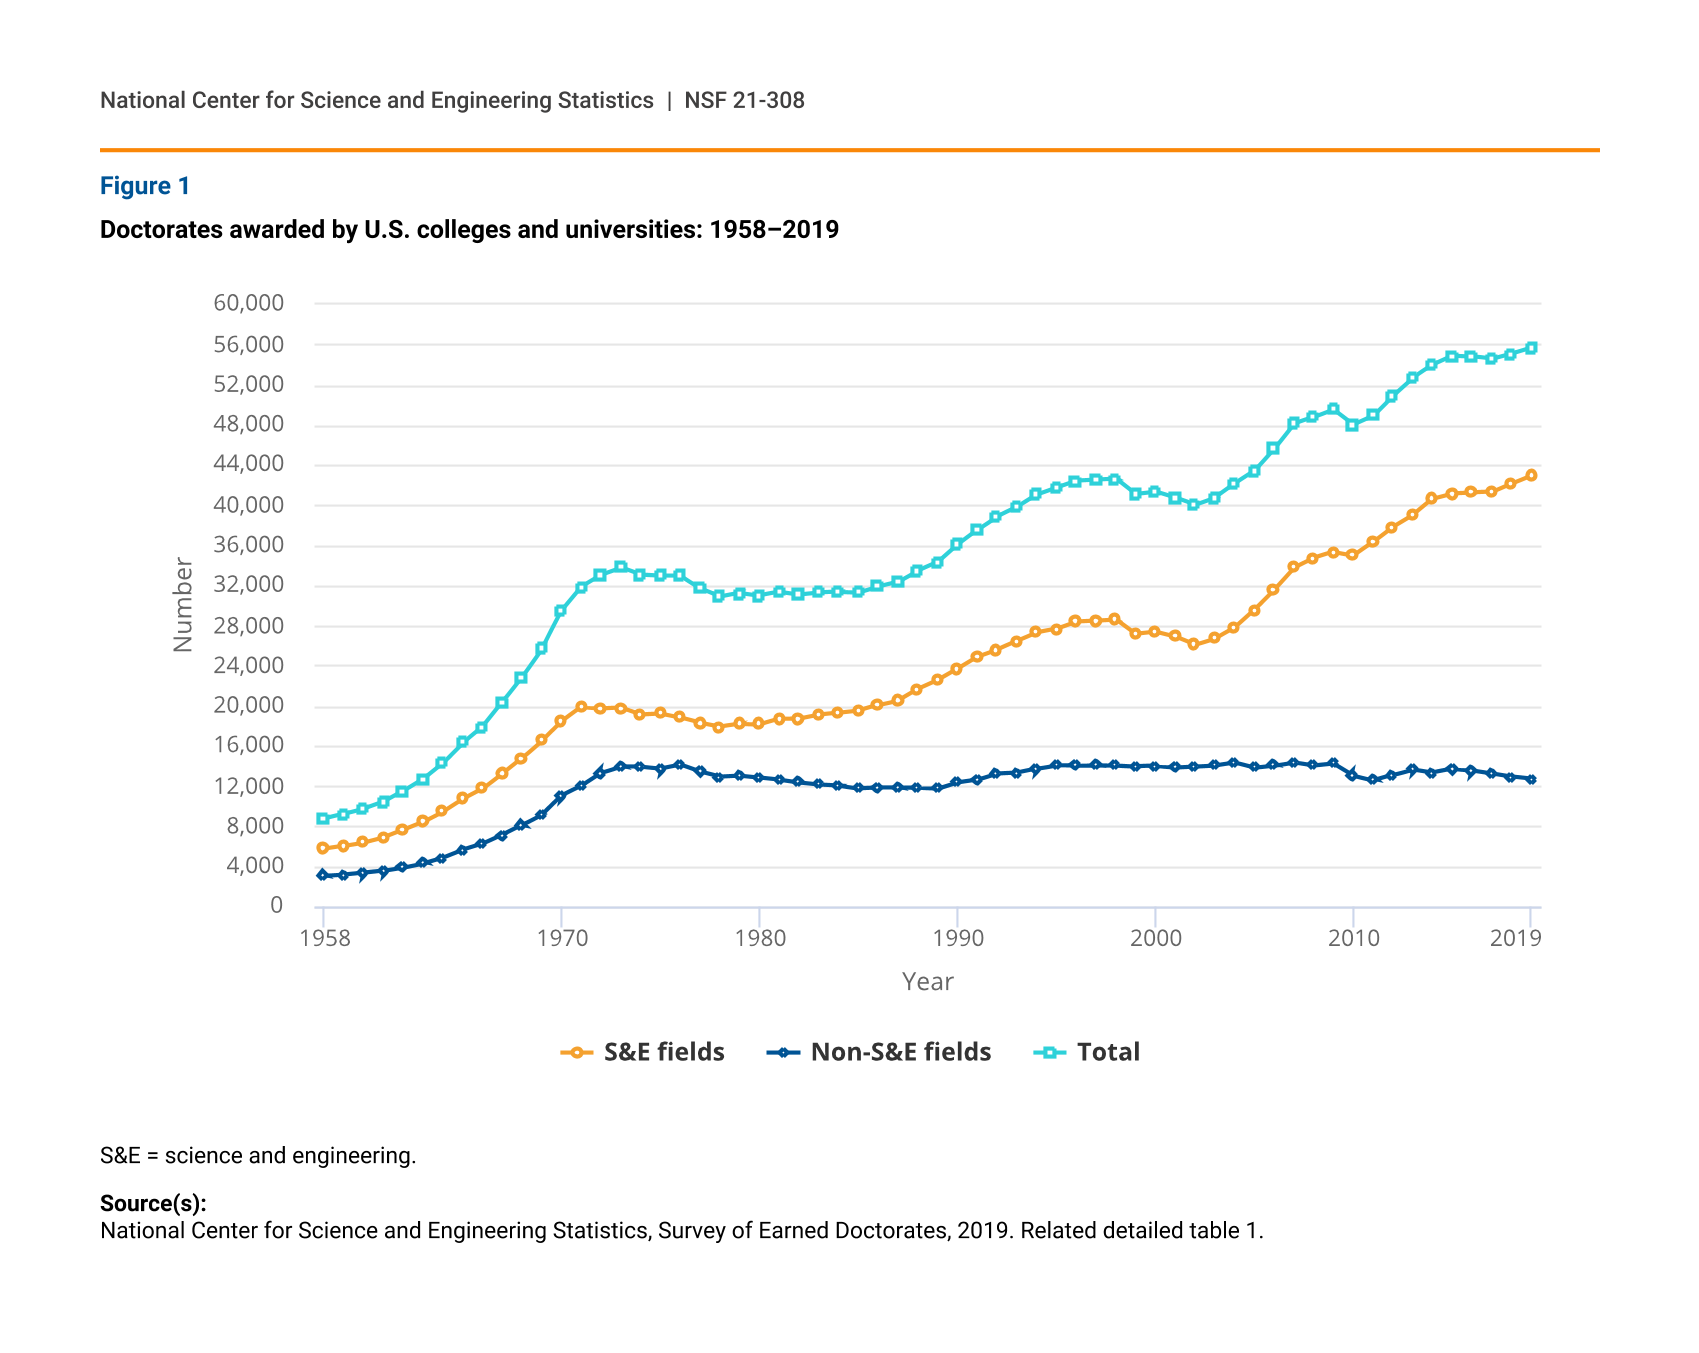
The number of research doctorate degrees awarded by U.S. institutions in 2019 increased to 55,703, according to the Survey of Earned Doctorates (SED) (figure 1). Since the survey’s inception, the number of doctorates awarded shows a strong upward trend—average annual growth of 3.2%—punctuated by periods of slow growth and even decline.
Since the SED began collecting data in 1957, the number of research doctorates awarded in science and engineering (S&E) fields has exceeded the number of non-S&E doctorates, and the gap has widened. From 1979 to 2019, the number of S&E doctorate recipients has more than doubled, while the number of non-S&E doctorates awarded in 2019 declined to just below the 1979 count. As a result, the proportion of S&E doctorates climbed from 58% in 1979 to 77% in 2019.
Doctorates awarded by U.S. colleges and universities: 1958–2019
| Year | S&E fields | Non-S&E fields | Total |
|---|---|---|---|
| 1958 | 5,751 | 3,022 | 8,773 |
| 1959 | 6,043 | 3,170 | 9,213 |
| 1960 | 6,388 | 3,345 | 9,733 |
| 1961 | 6,872 | 3,541 | 10,413 |
| 1962 | 7,612 | 3,888 | 11,500 |
| 1963 | 8,422 | 4,306 | 12,728 |
| 1964 | 9,462 | 4,863 | 14,325 |
| 1965 | 10,706 | 5,634 | 16,340 |
| 1966 | 11,732 | 6,217 | 17,949 |
| 1967 | 13,274 | 7,129 | 20,403 |
| 1968 | 14,824 | 8,113 | 22,937 |
| 1969 | 16,574 | 9,169 | 25,743 |
| 1970 | 18,458 | 11,040 | 29,498 |
| 1971 | 19,869 | 11,998 | 31,867 |
| 1972 | 19,752 | 13,289 | 33,041 |
| 1973 | 19,808 | 13,947 | 33,755 |
| 1974 | 19,137 | 13,910 | 33,047 |
| 1975 | 19,210 | 13,742 | 32,952 |
| 1976 | 18,821 | 14,125 | 32,946 |
| 1977 | 18,298 | 13,418 | 31,716 |
| 1978 | 17,952 | 12,923 | 30,875 |
| 1979 | 18,213 | 13,025 | 31,238 |
| 1980 | 18,169 | 12,850 | 31,019 |
| 1981 | 18,713 | 12,642 | 31,355 |
| 1982 | 18,736 | 12,372 | 31,108 |
| 1983 | 19,117 | 12,163 | 31,280 |
| 1984 | 19,285 | 12,049 | 31,334 |
| 1985 | 19,504 | 11,791 | 31,295 |
| 1986 | 20,064 | 11,833 | 31,897 |
| 1987 | 20,558 | 11,807 | 32,365 |
| 1988 | 21,675 | 11,822 | 33,497 |
| 1989 | 22,565 | 11,760 | 34,325 |
| 1990 | 23,689 | 12,376 | 36,065 |
| 1991 | 24,894 | 12,636 | 37,530 |
| 1992 | 25,616 | 13,270 | 38,886 |
| 1993 | 26,449 | 13,351 | 39,800 |
| 1994 | 27,304 | 13,730 | 41,034 |
| 1995 | 27,663 | 14,084 | 41,747 |
| 1996 | 28,405 | 14,032 | 42,437 |
| 1997 | 28,486 | 14,053 | 42,539 |
| 1998 | 28,592 | 14,044 | 42,636 |
| 1999 | 27,147 | 13,953 | 41,100 |
| 2000 | 27,378 | 13,991 | 41,369 |
| 2001 | 26,896 | 13,848 | 40,744 |
| 2002 | 26,088 | 13,943 | 40,031 |
| 2003 | 26,713 | 14,049 | 40,762 |
| 2004 | 27,794 | 14,328 | 42,122 |
| 2005 | 29,578 | 13,807 | 43,385 |
| 2006 | 31,584 | 14,036 | 45,620 |
| 2007 | 33,758 | 14,374 | 48,132 |
| 2008 | 34,717 | 14,059 | 48,776 |
| 2009 | 35,313 | 14,239 | 49,552 |
| 2010 | 34,997 | 13,031 | 48,028 |
| 2011 | 36,331 | 12,578 | 48,909 |
| 2012 | 37,846 | 13,097 | 50,943 |
| 2013 | 39,031 | 13,672 | 52,703 |
| 2014 | 40,630 | 13,356 | 53,986 |
| 2015 | 41,175 | 13,711 | 54,886 |
| 2016 | 41,240 | 13,569 | 54,809 |
| 2017 | 41,290 | 13,264 | 54,554 |
| 2018 | 42,158 | 12,945 | 55,103 |
| 2019 | 42,980 | 12,723 | 55,703 |
S&E = science and engineering.
Source(s):
National Center for Science and Engineering Statistics, Survey of Earned Doctorates, 2019. Related detailed table 1.
Citizenship
Overview
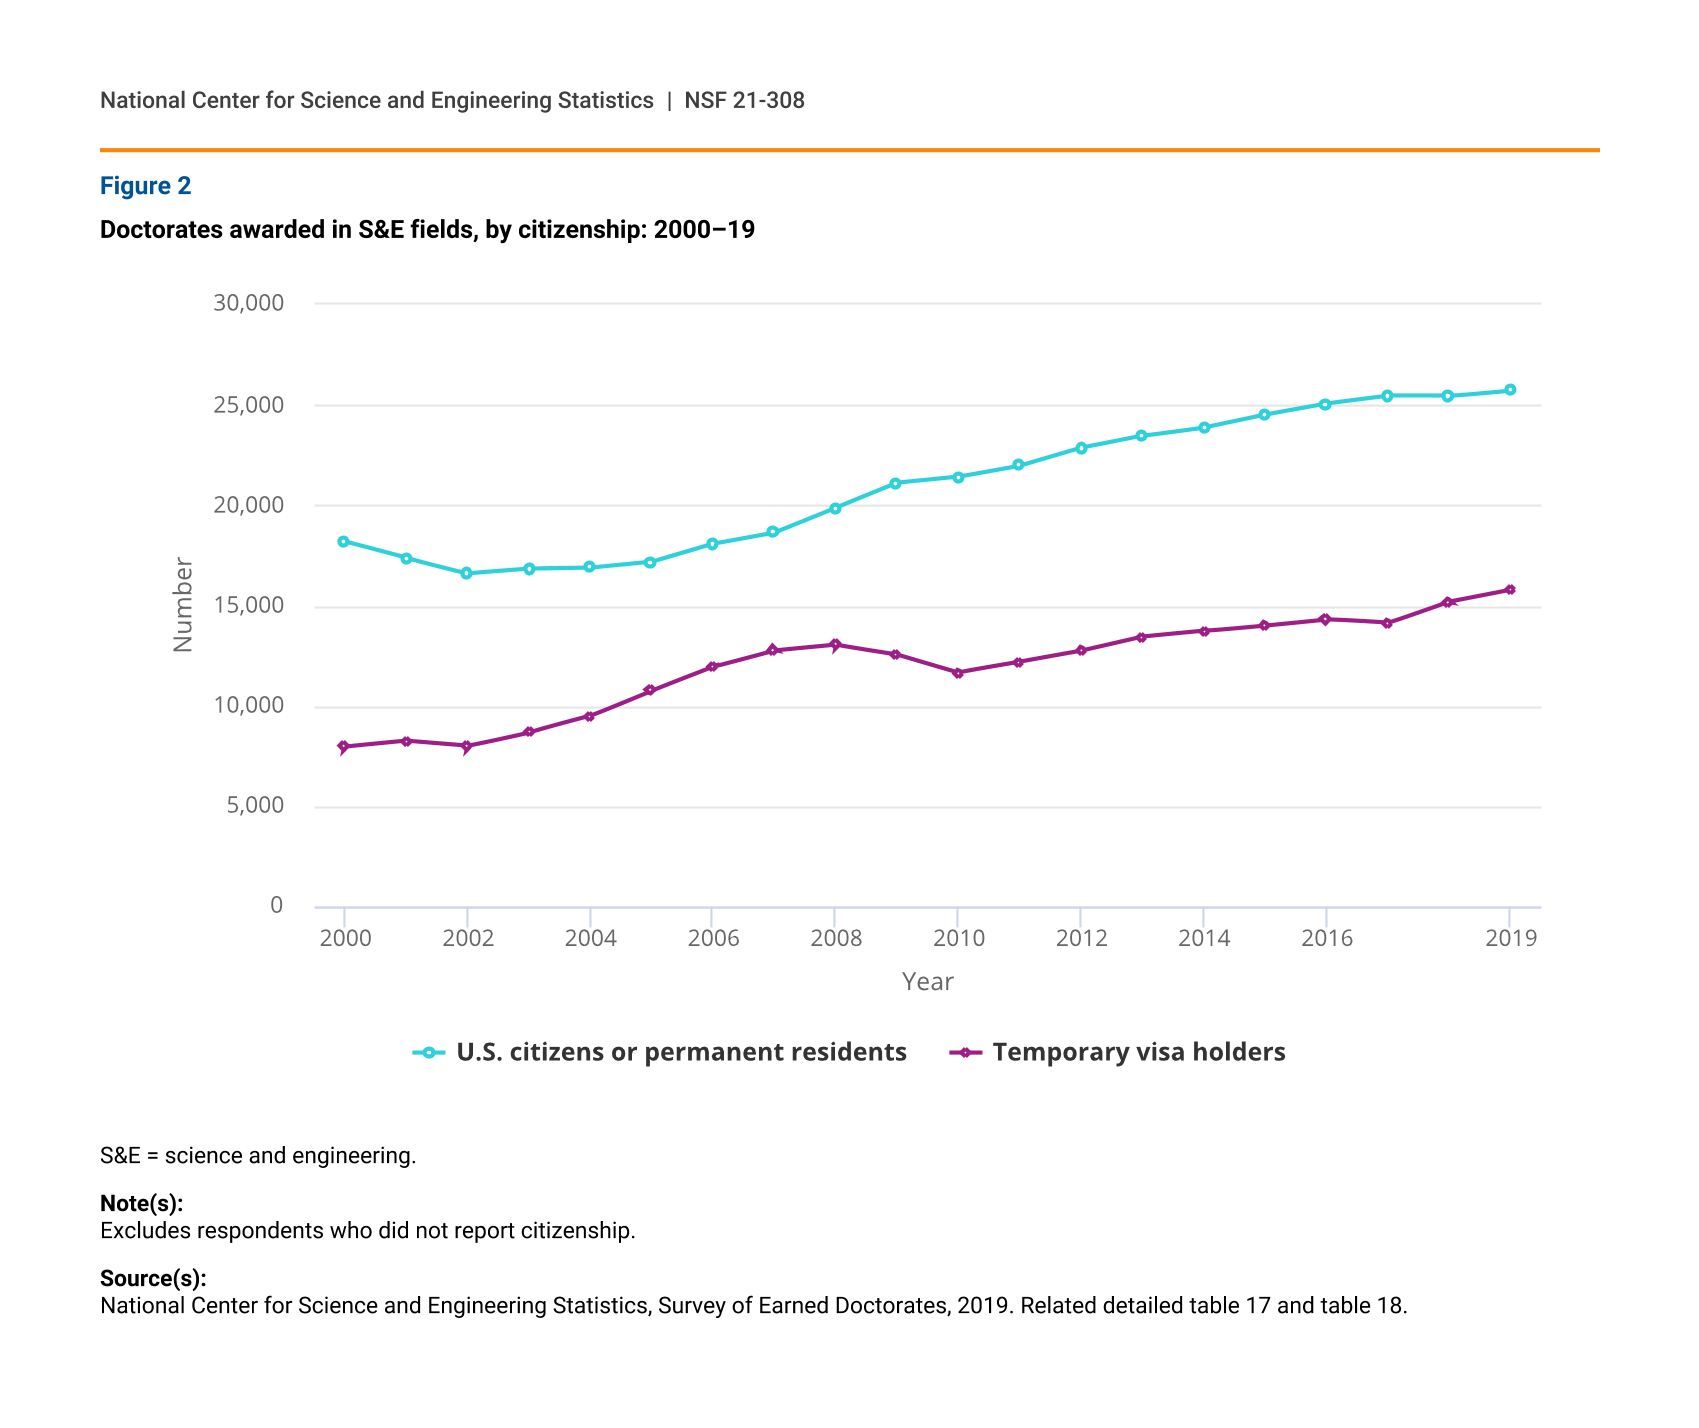
In 2019, the number of doctorates in S&E fields awarded to temporary visa holders was 15,801, an increase of 595 from 2018 (figure 2). Overall growth of doctorates awarded to temporary visa holders was up 99% since 2000 and 35% since 2010. Over the same period, the proportion of S&E doctorates awarded to temporary visa holders peaked at 41% in 2007, held steady at about 36% between 2010 and 2017, but increased to 38% in 2019.
In comparison, although starting from a larger base, the number of S&E doctorates awarded to U.S. citizens and permanent residents increased by 290 doctorates from 2018 to 2019 and experienced a slower relative growth overall (42% since 2000 and 20% since 2010).
Doctorates awarded in S&E fields, by citizenship: 2000–19
| Year | U.S. citizens or permanent residents | Temporary visa holders |
|---|---|---|
| 2000 | 18,173 | 7,950 |
| 2001 | 17,361 | 8,244 |
| 2002 | 16,608 | 8,000 |
| 2003 | 16,831 | 8,685 |
| 2004 | 16,879 | 9,494 |
| 2005 | 17,177 | 10,761 |
| 2006 | 18,073 | 11,941 |
| 2007 | 18,635 | 12,762 |
| 2008 | 19,869 | 13,045 |
| 2009 | 21,103 | 12,570 |
| 2010 | 21,406 | 11,675 |
| 2011 | 21,963 | 12,185 |
| 2012 | 22,857 | 12,729 |
| 2013 | 23,461 | 13,435 |
| 2014 | 23,883 | 13,725 |
| 2015 | 24,518 | 14,010 |
| 2016 | 25,060 | 14,313 |
| 2017 | 25,445 | 14,121 |
| 2018 | 25,428 | 15,206 |
| 2019 | 25,718 | 15,801 |
S&E = science and engineering.
Note(s):
Excludes respondents who did not report citizenship.
Countries or economies of foreign citizenship
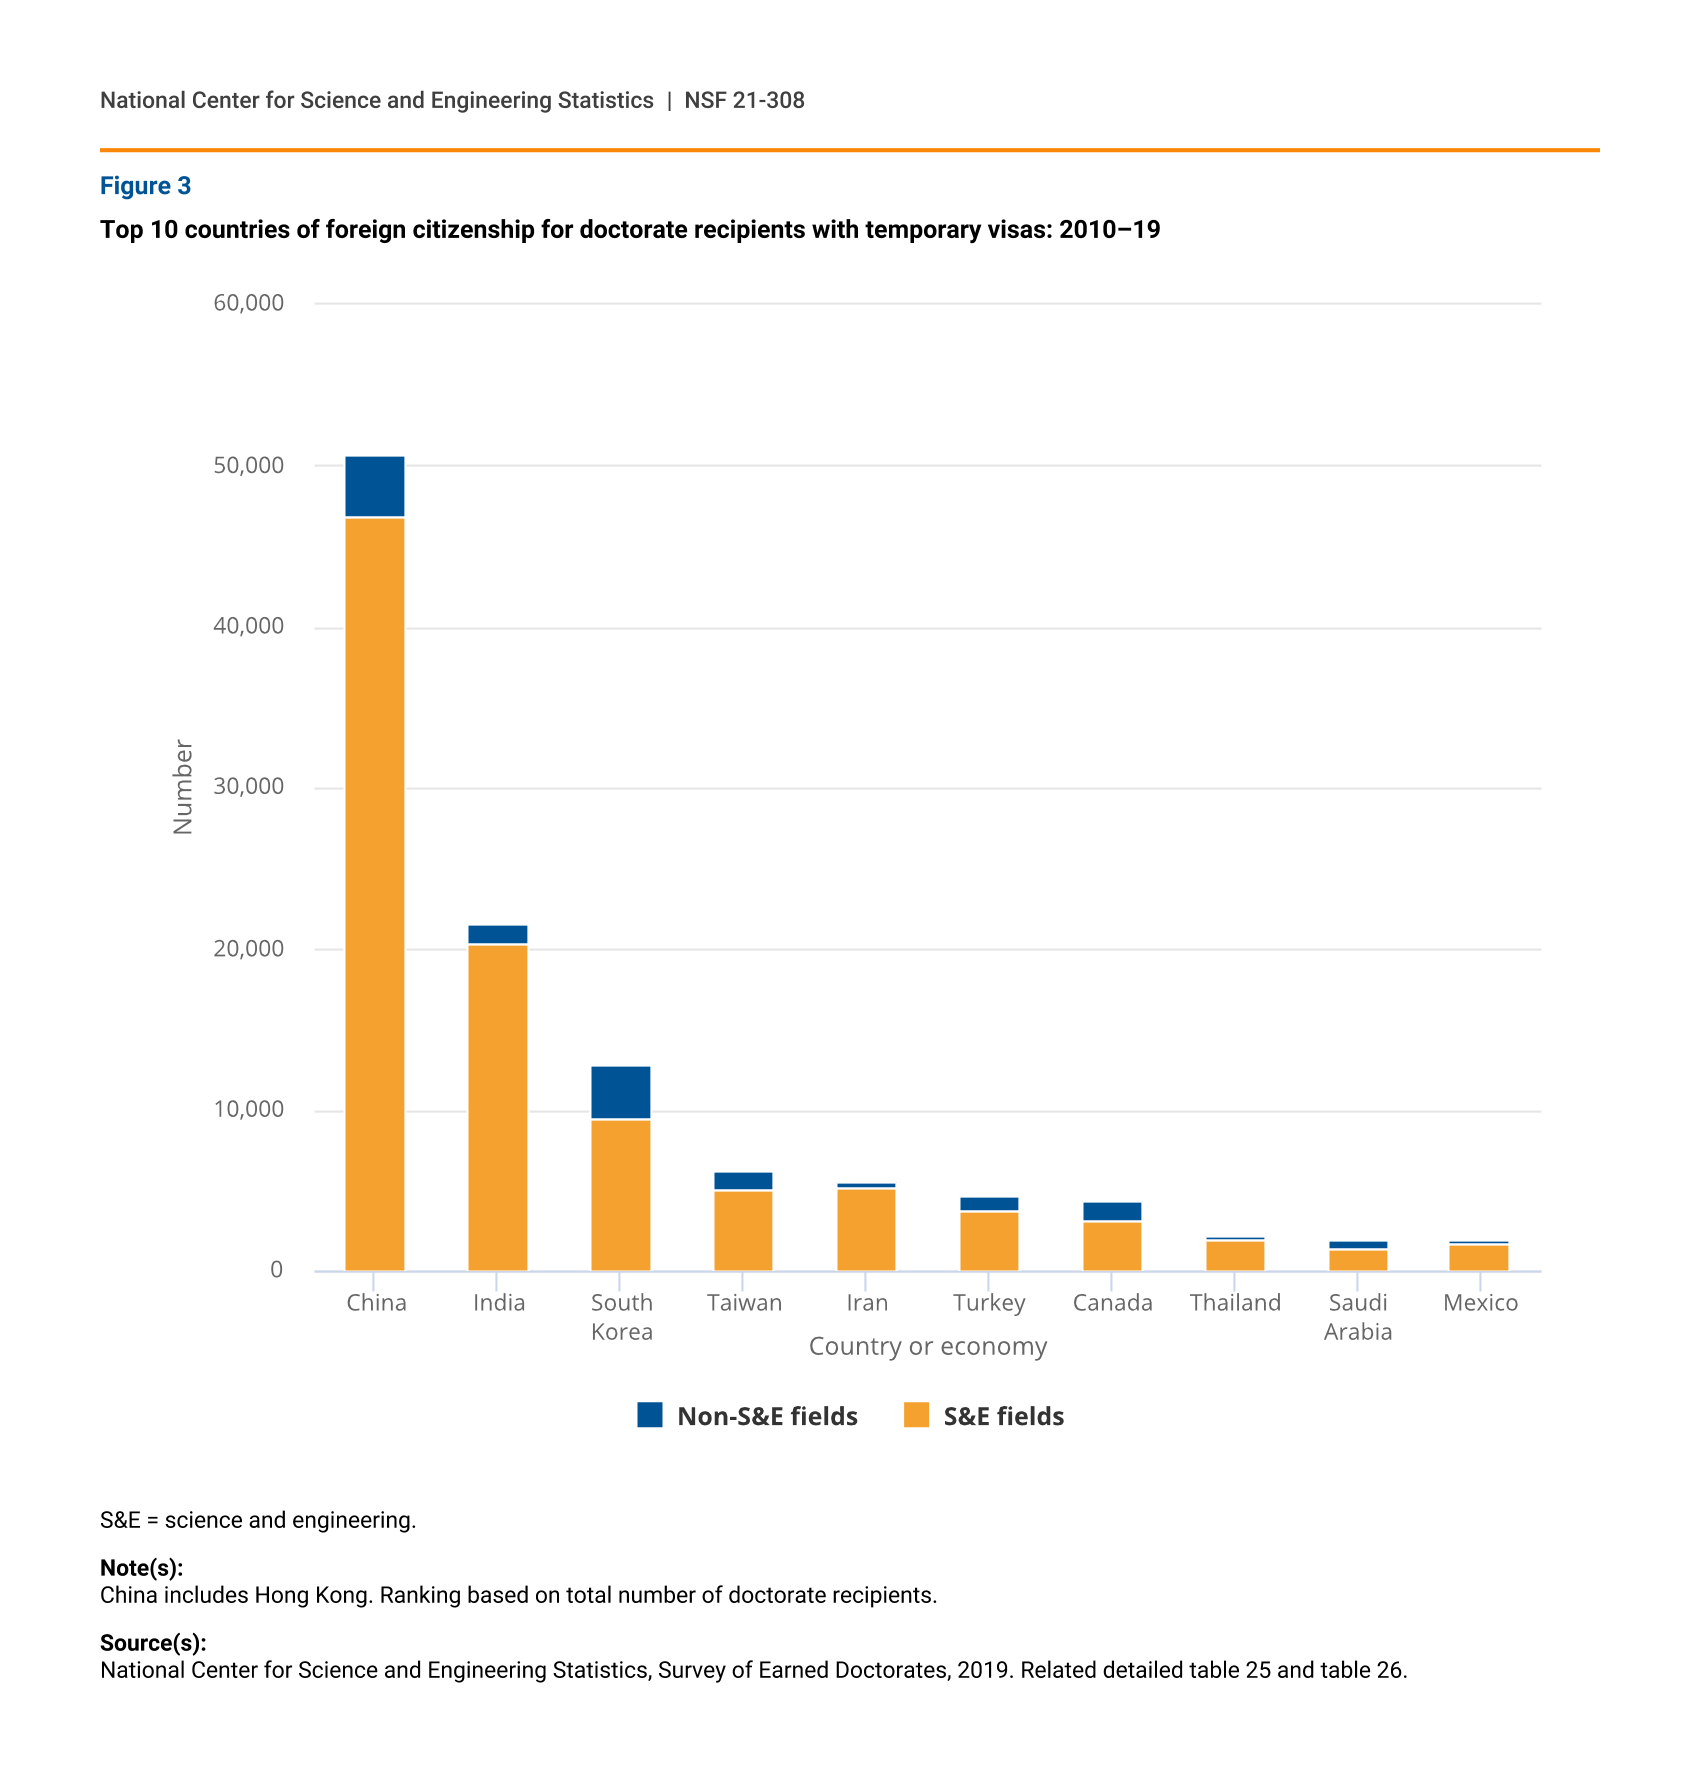
The number of doctorate recipients on temporary visas is highly concentrated in a few places of origin. In the past decade, 10 countries accounted for 70% of the 158,996 doctorates awarded to temporary visa holders, and the top three countries—China, India, and South Korea—accounted for over half (53%) (figure 3). Between 70% and 95% of doctorate recipients from these countries earned a doctorate in an S&E field.
Top 10 countries of foreign citizenship for doctorate recipients with temporary visas: 2010–19
| Country or economy | S&E fields | Non-S&E fields |
|---|---|---|
| China | 46,791 | 3,876 |
| India | 20,363 | 1,193 |
| South Korea | 9,405 | 3,349 |
| Taiwan | 5,098 | 1,061 |
| Iran | 5,201 | 305 |
| Turkey | 3,772 | 834 |
| Canada | 3,086 | 1,350 |
| Thailand | 1,892 | 263 |
| Saudi Arabia | 1,460 | 531 |
| Mexico | 1,630 | 307 |
S&E = science and engineering.
Note(s):
China includes Hong Kong. Ranking based on total number of doctorate recipients.
Sex
Citizenship
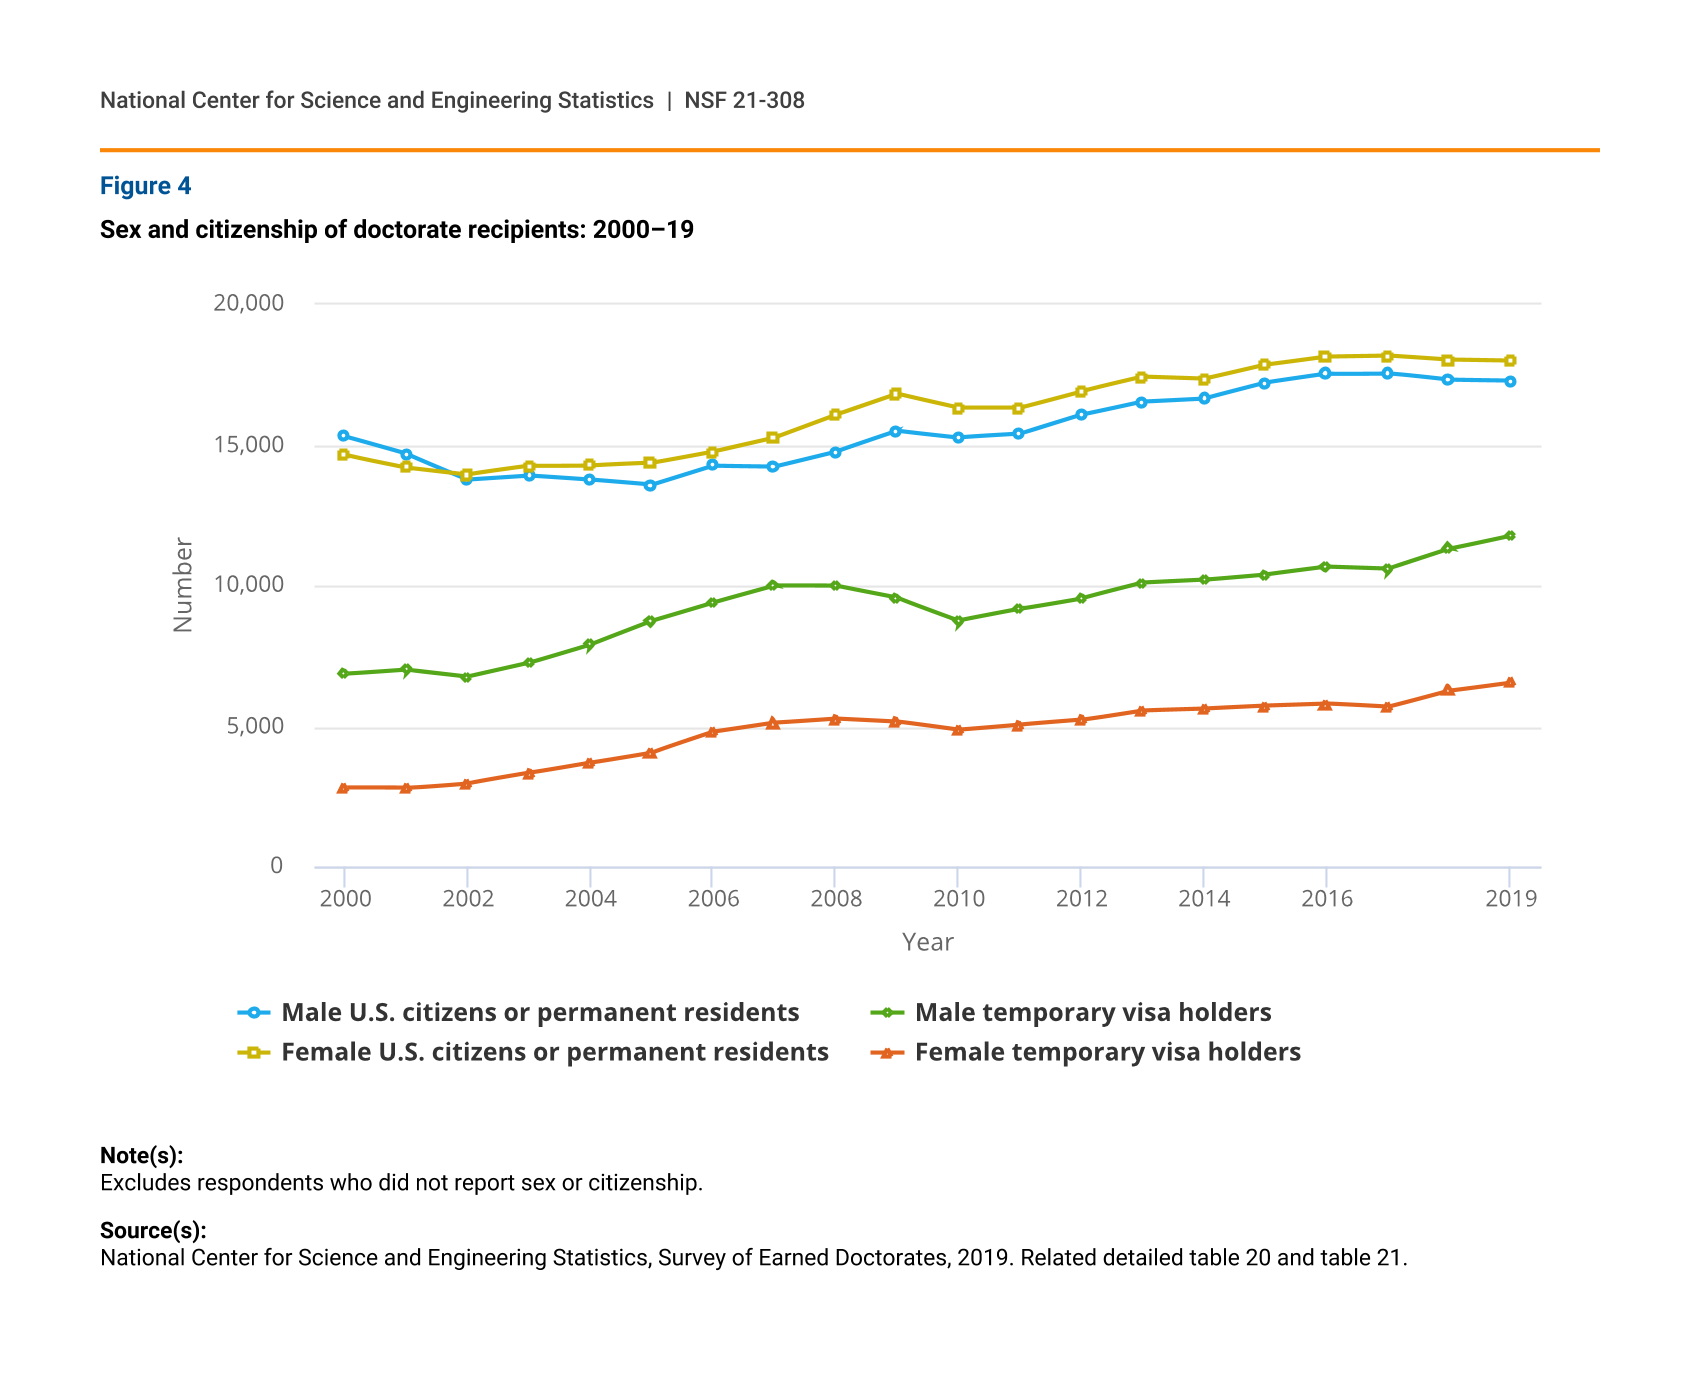
Overall, 46% of all doctorates in 2019 were awarded to women. Since 2002, women have earned just over half of all doctorates awarded to U.S. citizens and permanent residents and more than 31% of doctorates awarded to temporary visa holders (figure 4). From 2000 to 2008, the share of female doctorate recipients grew from 49% to 52% among U.S. citizens and permanent residents and from 29% to 35% among temporary visa holders. Since 2008, the shares of female doctorates in both citizenship categories have changed little.
Sex and citizenship of doctorate recipients: 2000–19
| Year | Male U.S. citizens or permanent residents | Male temporary visa holders | Female U.S. citizens or permanent residents | Female temporary visa holders |
|---|---|---|---|---|
| 2000 | 15,304 | 6,856 | 14,643 | 2,810 |
| 2001 | 14,684 | 7,011 | 14,209 | 2,800 |
| 2002 | 13,779 | 6,765 | 13,957 | 2,977 |
| 2003 | 13,920 | 7,257 | 14,250 | 3,340 |
| 2004 | 13,770 | 7,913 | 14,270 | 3,715 |
| 2005 | 13,586 | 8,749 | 14,357 | 4,079 |
| 2006 | 14,266 | 9,398 | 14,762 | 4,800 |
| 2007 | 14,240 | 9,994 | 15,260 | 5,128 |
| 2008 | 14,774 | 9,984 | 16,069 | 5,277 |
| 2009 | 15,508 | 9,564 | 16,818 | 5,167 |
| 2010 | 15,275 | 8,768 | 16,327 | 4,868 |
| 2011 | 15,396 | 9,179 | 16,329 | 5,056 |
| 2012 | 16,072 | 9,556 | 16,909 | 5,224 |
| 2013 | 16,550 | 10,103 | 17,414 | 5,571 |
| 2014 | 16,660 | 10,204 | 17,343 | 5,633 |
| 2015 | 17,218 | 10,395 | 17,853 | 5,734 |
| 2016 | 17,530 | 10,671 | 18,147 | 5,805 |
| 2017 | 17,552 | 10,600 | 18,183 | 5,686 |
| 2018 | 17,308 | 11,311 | 18,033 | 6,273 |
| 2019 | 17,279 | 11,783 | 17,994 | 6,567 |
Note(s):
Excludes respondents who did not report sex or citizenship.
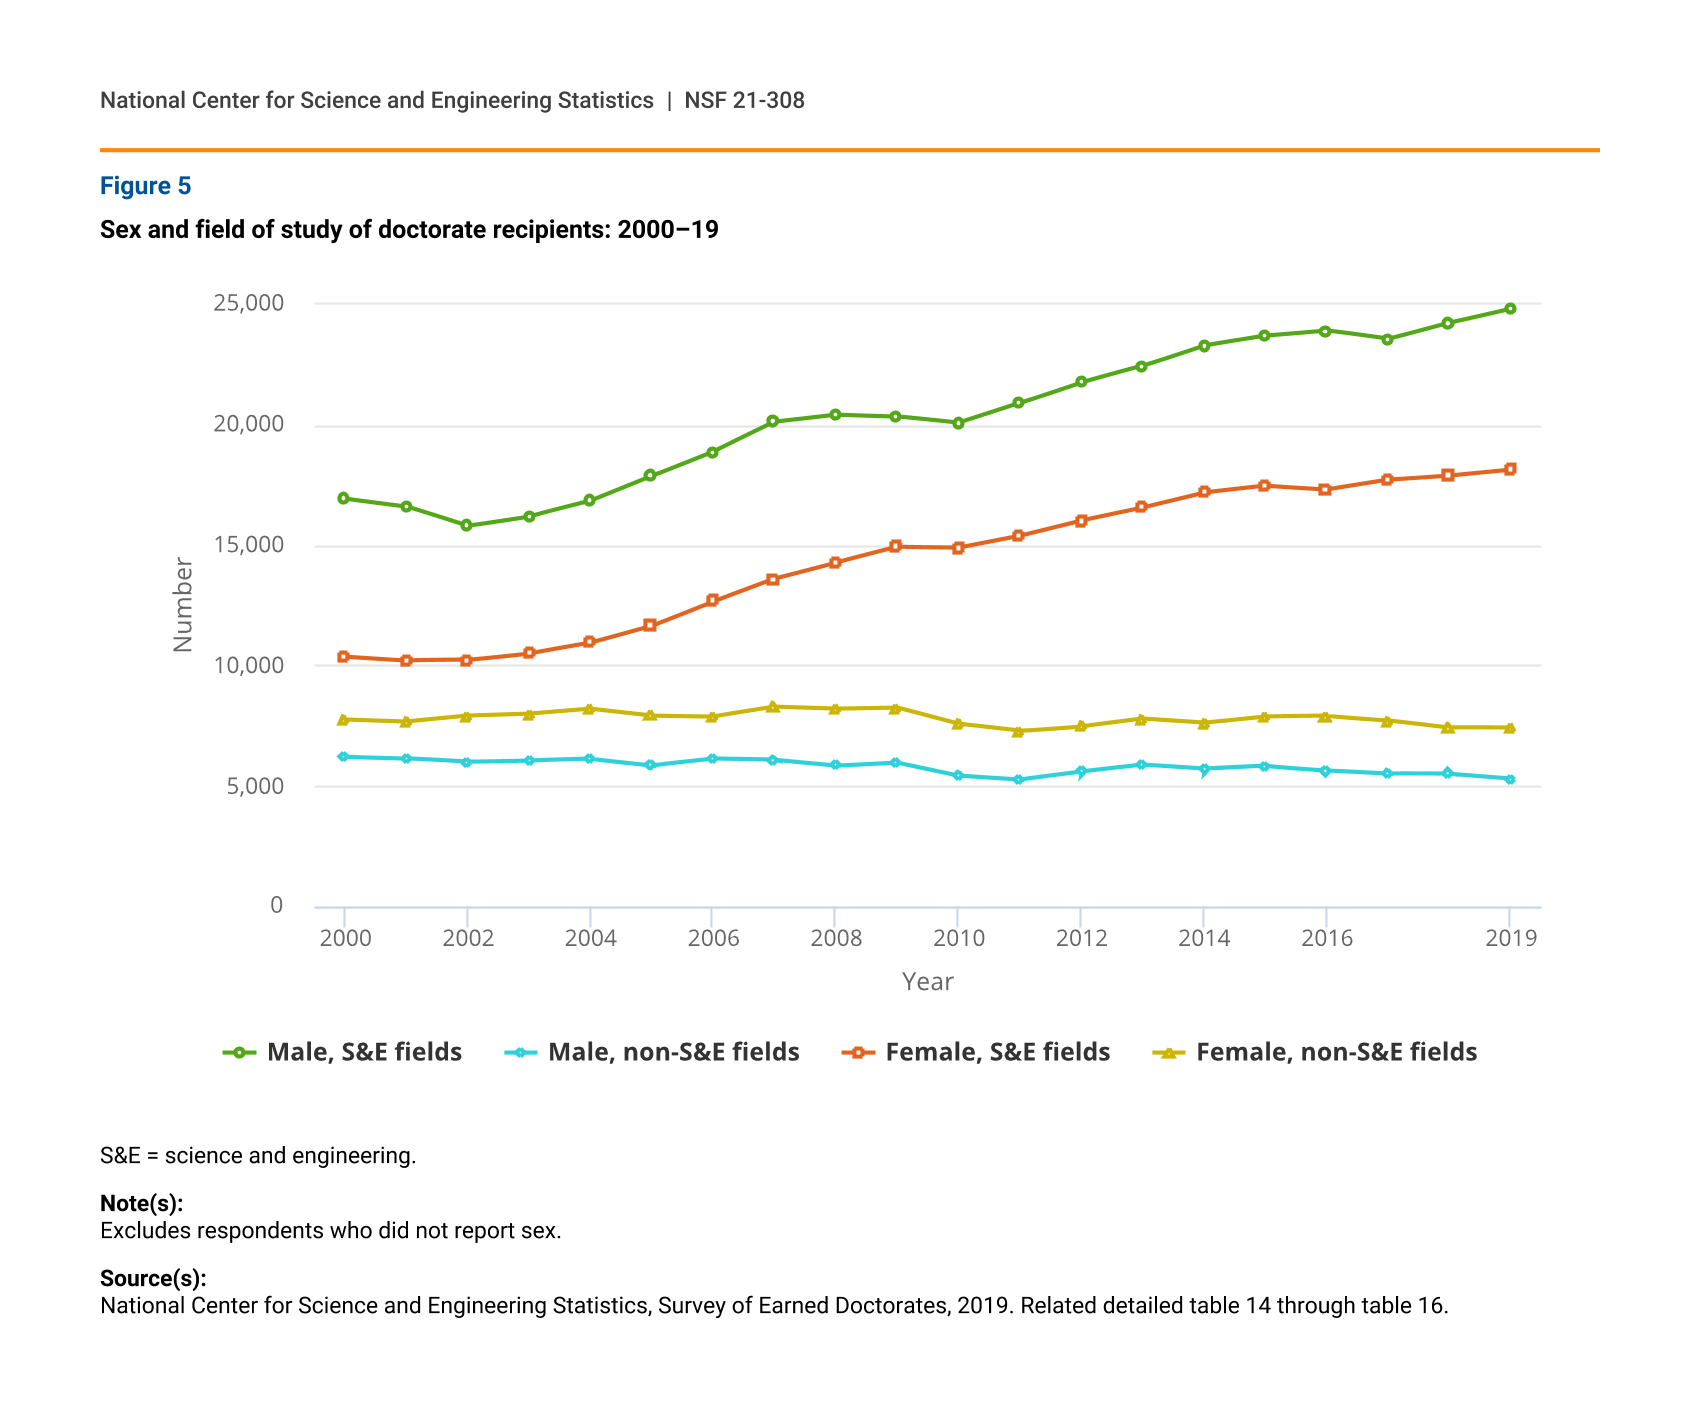
Field of study
Most of the growth in the number of doctorates earned by both men and women has been in S&E fields (figure 5). From 2000 to 2019, the number of female doctorate recipients in S&E fields increased by 75%, though starting from a small base, compared with 47% growth in the number of male S&E doctorates. Women’s share of S&E doctorates awarded increased from 38% in 2000 to 42% in 2009, and it has remained stable since then.
In non-S&E fields, 58% of doctorates were awarded to women in 2019, a share that has changed little since the late 2000s. The number of female non-S&E doctorate recipients declined by 5% between 2000 and 2019, while the number of male doctorate recipients in those fields declined by 15%.
Sex and field of study of doctorate recipients: 2000–19
| Year | Male, S&E fields | Male, non-S&E fields | Female, S&E fields | Female, non-S&E fields |
|---|---|---|---|---|
| 2000 | 16,945 | 6,220 | 10,376 | 7,755 |
| 2001 | 16,622 | 6,158 | 10,220 | 7,667 |
| 2002 | 15,802 | 6,004 | 10,236 | 7,904 |
| 2003 | 16,196 | 6,060 | 10,517 | 7,989 |
| 2004 | 16,836 | 6,129 | 10,957 | 8,198 |
| 2005 | 17,869 | 5,868 | 11,665 | 7,917 |
| 2006 | 18,886 | 6,134 | 12,676 | 7,883 |
| 2007 | 20,120 | 6,082 | 13,622 | 8,282 |
| 2008 | 20,419 | 5,852 | 14,289 | 8,205 |
| 2009 | 20,346 | 5,985 | 14,937 | 8,250 |
| 2010 | 20,075 | 5,449 | 14,912 | 7,576 |
| 2011 | 20,902 | 5,286 | 15,411 | 7,288 |
| 2012 | 21,761 | 5,601 | 16,041 | 7,485 |
| 2013 | 22,448 | 5,878 | 16,573 | 7,792 |
| 2014 | 23,302 | 5,706 | 17,189 | 7,624 |
| 2015 | 23,703 | 5,829 | 17,467 | 7,880 |
| 2016 | 23,915 | 5,657 | 17,314 | 7,908 |
| 2017 | 23,558 | 5,523 | 17,715 | 7,736 |
| 2018 | 24,248 | 5,506 | 17,891 | 7,430 |
| 2019 | 24,836 | 5,315 | 18,136 | 7,406 |
S&E = science and engineering.
Note(s):
Excludes respondents who did not report sex.
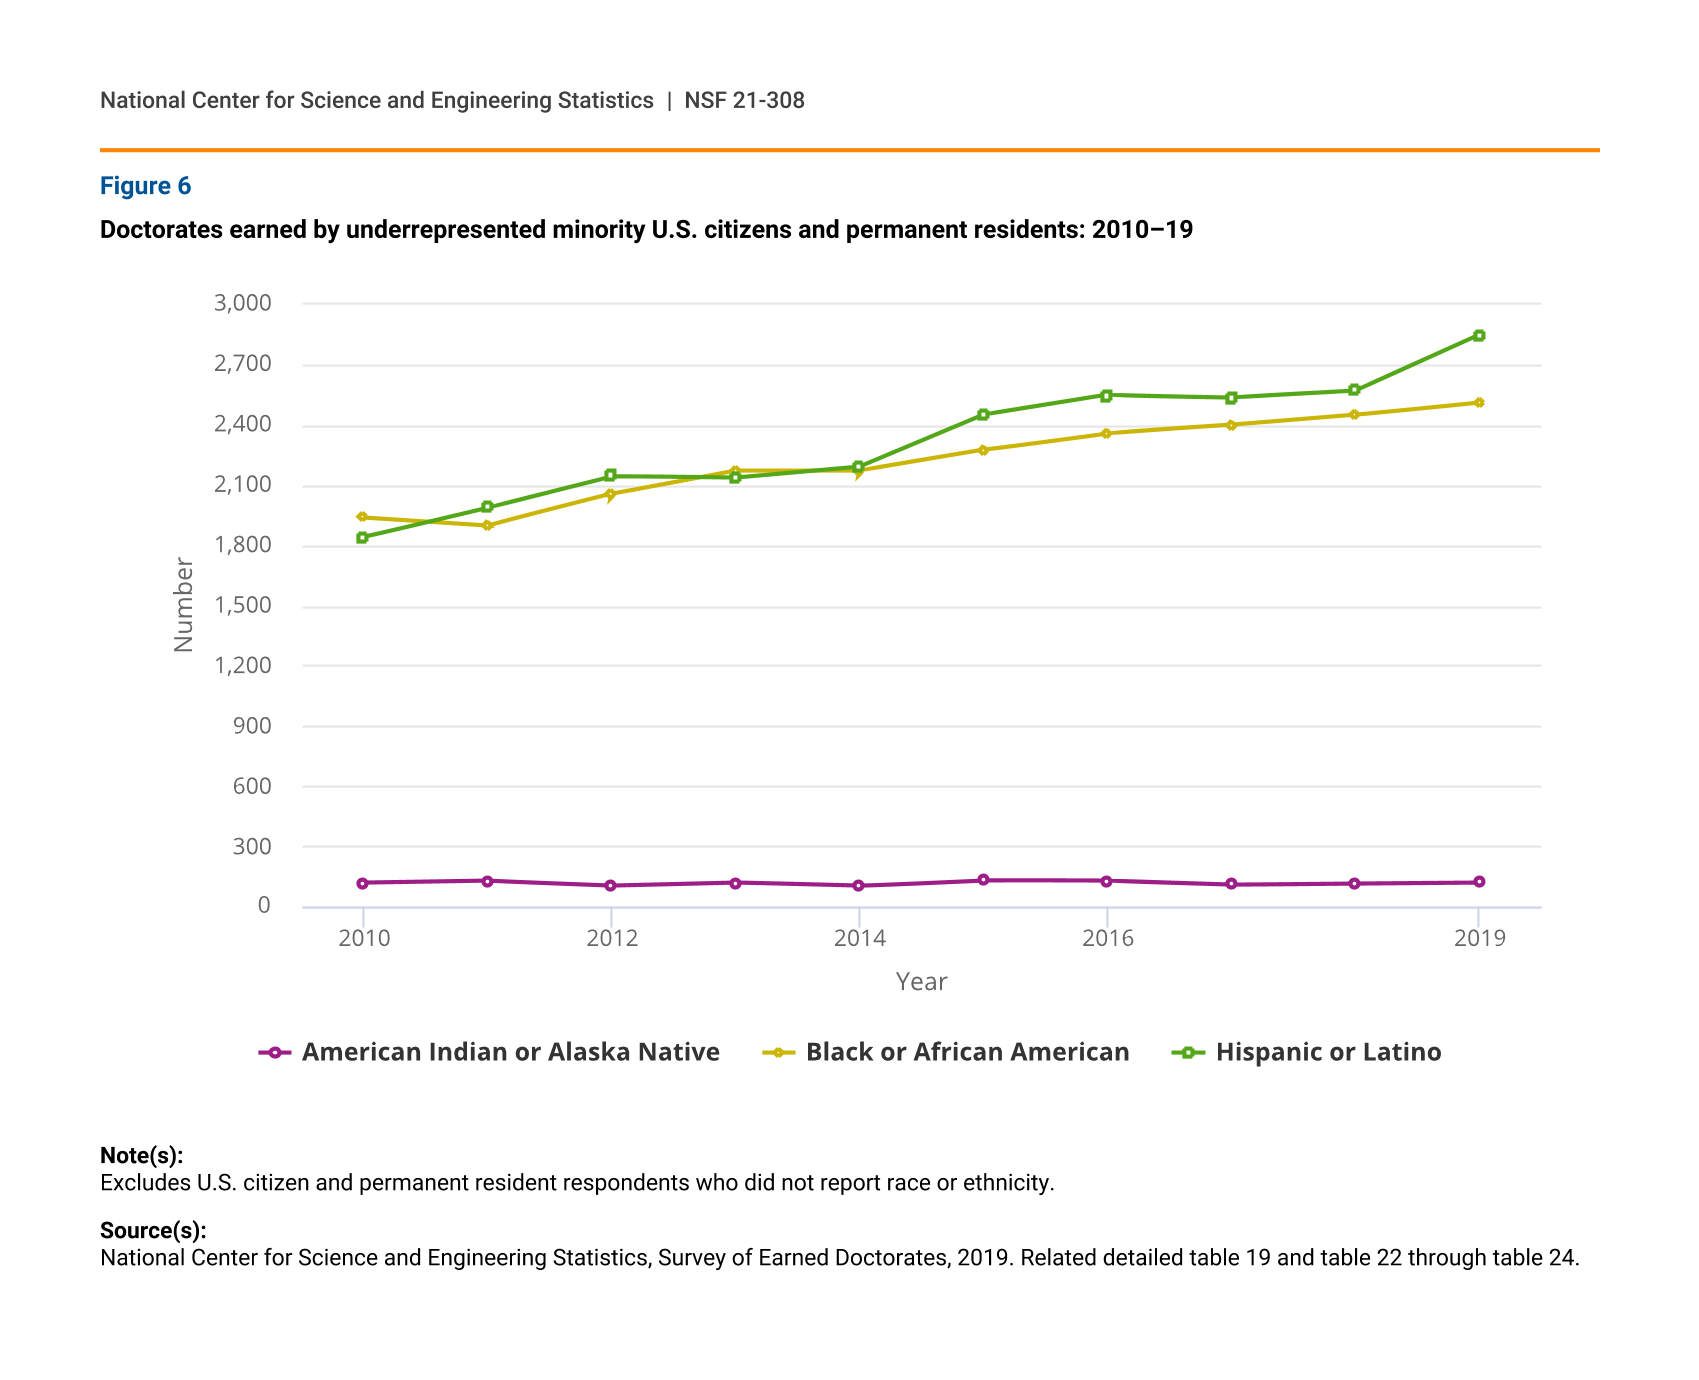
Race and ethnicity
Participation in doctoral education by underrepresented minorities who are U.S. citizens or permanent residents has been increasing, though starting from a small number. From 2010 to 2019, the number of Hispanic or Latino doctorate recipients increased from 1,842 to 2,848. As a result, the proportion of doctorates earned by this group grew from 6% to 8% during this period. Also during this period, the number of Black or African American doctorate recipients increased from 1,939 to 2,512, and the proportion of doctorates they earned increased from 6% to 7%. The number of American Indian or Alaska Native doctorate recipients changed little, from 117 in 2010 to 120 in 2019, remaining under 1% (figure 6).
Doctorates earned by underrepresented minority U.S. citizens and permanent residents: 2010–19
| Year | American Indian or Alaska Native | Black or African American | Hispanic or Latino |
|---|---|---|---|
| 2010 | 117 | 1,939 | 1,842 |
| 2011 | 127 | 1,899 | 1,989 |
| 2012 | 104 | 2,055 | 2,144 |
| 2013 | 119 | 2,172 | 2,135 |
| 2014 | 103 | 2,172 | 2,190 |
| 2015 | 131 | 2,275 | 2,449 |
| 2016 | 128 | 2,358 | 2,548 |
| 2017 | 109 | 2,399 | 2,537 |
| 2018 | 115 | 2,450 | 2,570 |
| 2019 | 120 | 2,512 | 2,848 |
Note(s):
Excludes U.S. citizen and permanent resident respondents who did not report race or ethnicity.