 An official website of the United States government
 U.S. Employment Higher in the Private Sector than in the Education Sector for U.S.-Trained Doctoral Scientists and Engineers: Findings from the 2019 Survey of Doctorate Recipients
In 2019, an estimated 1,148,800 individuals younger than 76 years of age worldwide held a research doctoral degree in a science, engineering, or health (SEH) field that was earned at a U.S. academic institution. A total of 1,008,950 (88%) were residing in the United States in 2019 (table 1). Among the 139,850 doctorate recipients living outside the United States in 2019, a majority (51%) lived in Asia and 21% lived in Europe (including Russia). These findings are from the 2019 Survey of Doctorate Recipients (SDR)—a unique source of information about the educational background, occupational achievements, and career movements of U.S.-trained scientists and engineers. The SDR, along with several other surveys conducted by the National Center for Science and Engineering Statistics (NCSES) within the National Science Foundation, provides data on the characteristics and global employment activities of individuals with U.S.-earned SEH doctorate degrees.
The labor force participation rate of U.S.-trained SEH doctorate holders was 85% in 2019 for those residing in the United States, compared with 90% among those living abroad (table 1). Among the 857,200 employed U.S.-trained SEH doctorate holders residing in the United States, the private sector (i.e., business or industry) employed the largest share (47%), followed by the education sector with a slightly smaller fraction (44%). In contrast, only 25% of the 126,000 U.S.-trained SEH doctorate holders employed abroad worked in the private sector, whereas 65% worked in the education sector. Among those working abroad, there are further marked differences between regions in these two sectors. For example, among U.S.-trained SEH doctorate holders working abroad, Asia employs 71% in the education sector and 21% in business or industry, but in Europe, the rates are 53% and 35%, respectively. The fractions of these doctorate holders working in government are much smaller, both in the United States and abroad (9% and 10%, respectively).
U.S.-trained SEH doctorate holders, by residence location, employment status, and employment sector: 2019
SEH = science, engineering, and health.
a Includes individuals who were not working during the survey reference week but had been seeking work in the 4 weeks prior to February 2019 or who were on layoff from their job.
b Includes individuals who were not in the labor force during the survey reference week and had not been seeking work in the prior 4 weeks because of family responsibilities, chronic illness, or other reasons.
c Europe includes Russia.
Note(s):
Residence location is based on reported living location on 1 February 2019. The worldwide and non-U.S. residing population totals include an estimated 300 individuals who were living abroad but in an unspecified location. Educational institution includes 4-year colleges or universities, medical schools (including university-affiliated hospitals or medical centers), university-affiliated research institutes, 2-year colleges, community colleges, technical institutes, precollege institutions, and other educational institutions. Business or industry includes private for profit, private nonprofit, self-employed or business owners in incorporated or nonincorporated business, and employers not broken out separately. Government includes U.S. federal, state, and local government and non-U.S. government at any level. Numbers are rounded to the nearest 50. Percentages are rounded to the nearest 0.1%. Detail may not sum to total due to rounding.
Source(s):
National Center for Science and Engineering Statistics, Survey of Doctorate Recipients, 2019.
Employment Sector and Work Activities in the United States and Abroad
In addition to differences in the broad sectors of employment across regions, there are marked international differences in the distribution of work activities across sectors, especially in performing research and development, which includes basic research, applied research, development, or design. Overall, 411,600 of the employed U.S.-trained SEH doctorate holders had a primary work activity in the area of R&D—that is, more of their work hours are spent on an R&D activity during a typical week than on any other work activity. This total includes 351,000 working in the United States and 60,600 working abroad (table 2). In both regions, these numbers represent over 40% of the total employed in 2019. For those whose primary work activity is R&D and who reside in the United States, half (50%) are employed in the business or industry sector and 40% are in the education sector. Among those workers who reside outside of the United States and whose primary work activity is R&D, only 20% are in the business or industry sector and 67% are in the education sector.
Employed U.S.-trained SEH doctorate holders, by residence location, primary work activity, and employment sector: 2019
SEH = science, engineering, and health.
a Derived from question A31: "On which two activities in question A30 did you work the most hours during a typical week on this job?" Question A30 presents a selection of 14 work activities. Respondents are asked to indicate which work activities "occupied at least 10 percent of your time during a typical work week on this job."
b Includes accounting, human resources, production, sales, quality management, professional services (health care, counseling, financial and legal services), and other activities not otherwise classified.
Note(s):
Residence location is based on reported living location on 1 February 2019. Educational institution includes 4-year colleges or universities, medical schools (including university-affiliated hospitals or medical centers), university-affiliated research institutes, 2-year colleges, community colleges, technical institutes, precollege institutions, and other educational institutions. Business or industry includes private for profit, private nonprofit, self-employed or business owners in incorporated or nonincorporated business, and employers not broken out separately. Government includes U.S. federal, state, and local government and non-U.S. government at any level. Numbers are rounded to the nearest 50. Percentages are rounded to the nearest 0.1%. Detail may not sum to total due to rounding.
Source(s):
National Center for Science and Engineering Statistics, Survey of Doctorate Recipients, 2019.
Sector distributions also varied significantly for the specific work activities comprising R&D. Those reporting basic research as their primary work activity overwhelmingly work in the education sector both in the United States (80%) and abroad (85%), whereas those reporting design as their primary work activity are primarily in the business or industry sector (85% in the United States and 82% abroad). In contrast, almost half (49%) of those doing applied research in the United States work in the business or industry sector, compared with 22% of those doing applied research abroad (table 2). Development, another component of R&D, is highly concentrated in the private sector in the United States (89%) and abroad (65%). Overall, the R&D activities of U.S.-trained SEH doctorate holders exhibit substantial differences in sector distributions between the United States and abroad, with a pronounced shift toward a larger fraction of research activities taking place in the business or industry sector in the United States than abroad.
For employed U.S.-trained SEH doctorate holders whose primary work activity is something other than R&D, the differences in sector distributions between the United States and abroad are less pronounced. As expected, almost all individuals with teaching as their primary work activity are employed in the education sector, both in the United States (96%) and abroad (98%). Among those whose primary work activity is management and administration, 58% of individuals are employed in the business or industry sector in the United States, compared with 49% abroad. Finally, among individuals whose primary work activity involves computer applications, 84% work in the business or industry sector in the United States, compared with 65% abroad.
Work Activities by Doctoral Degree Field
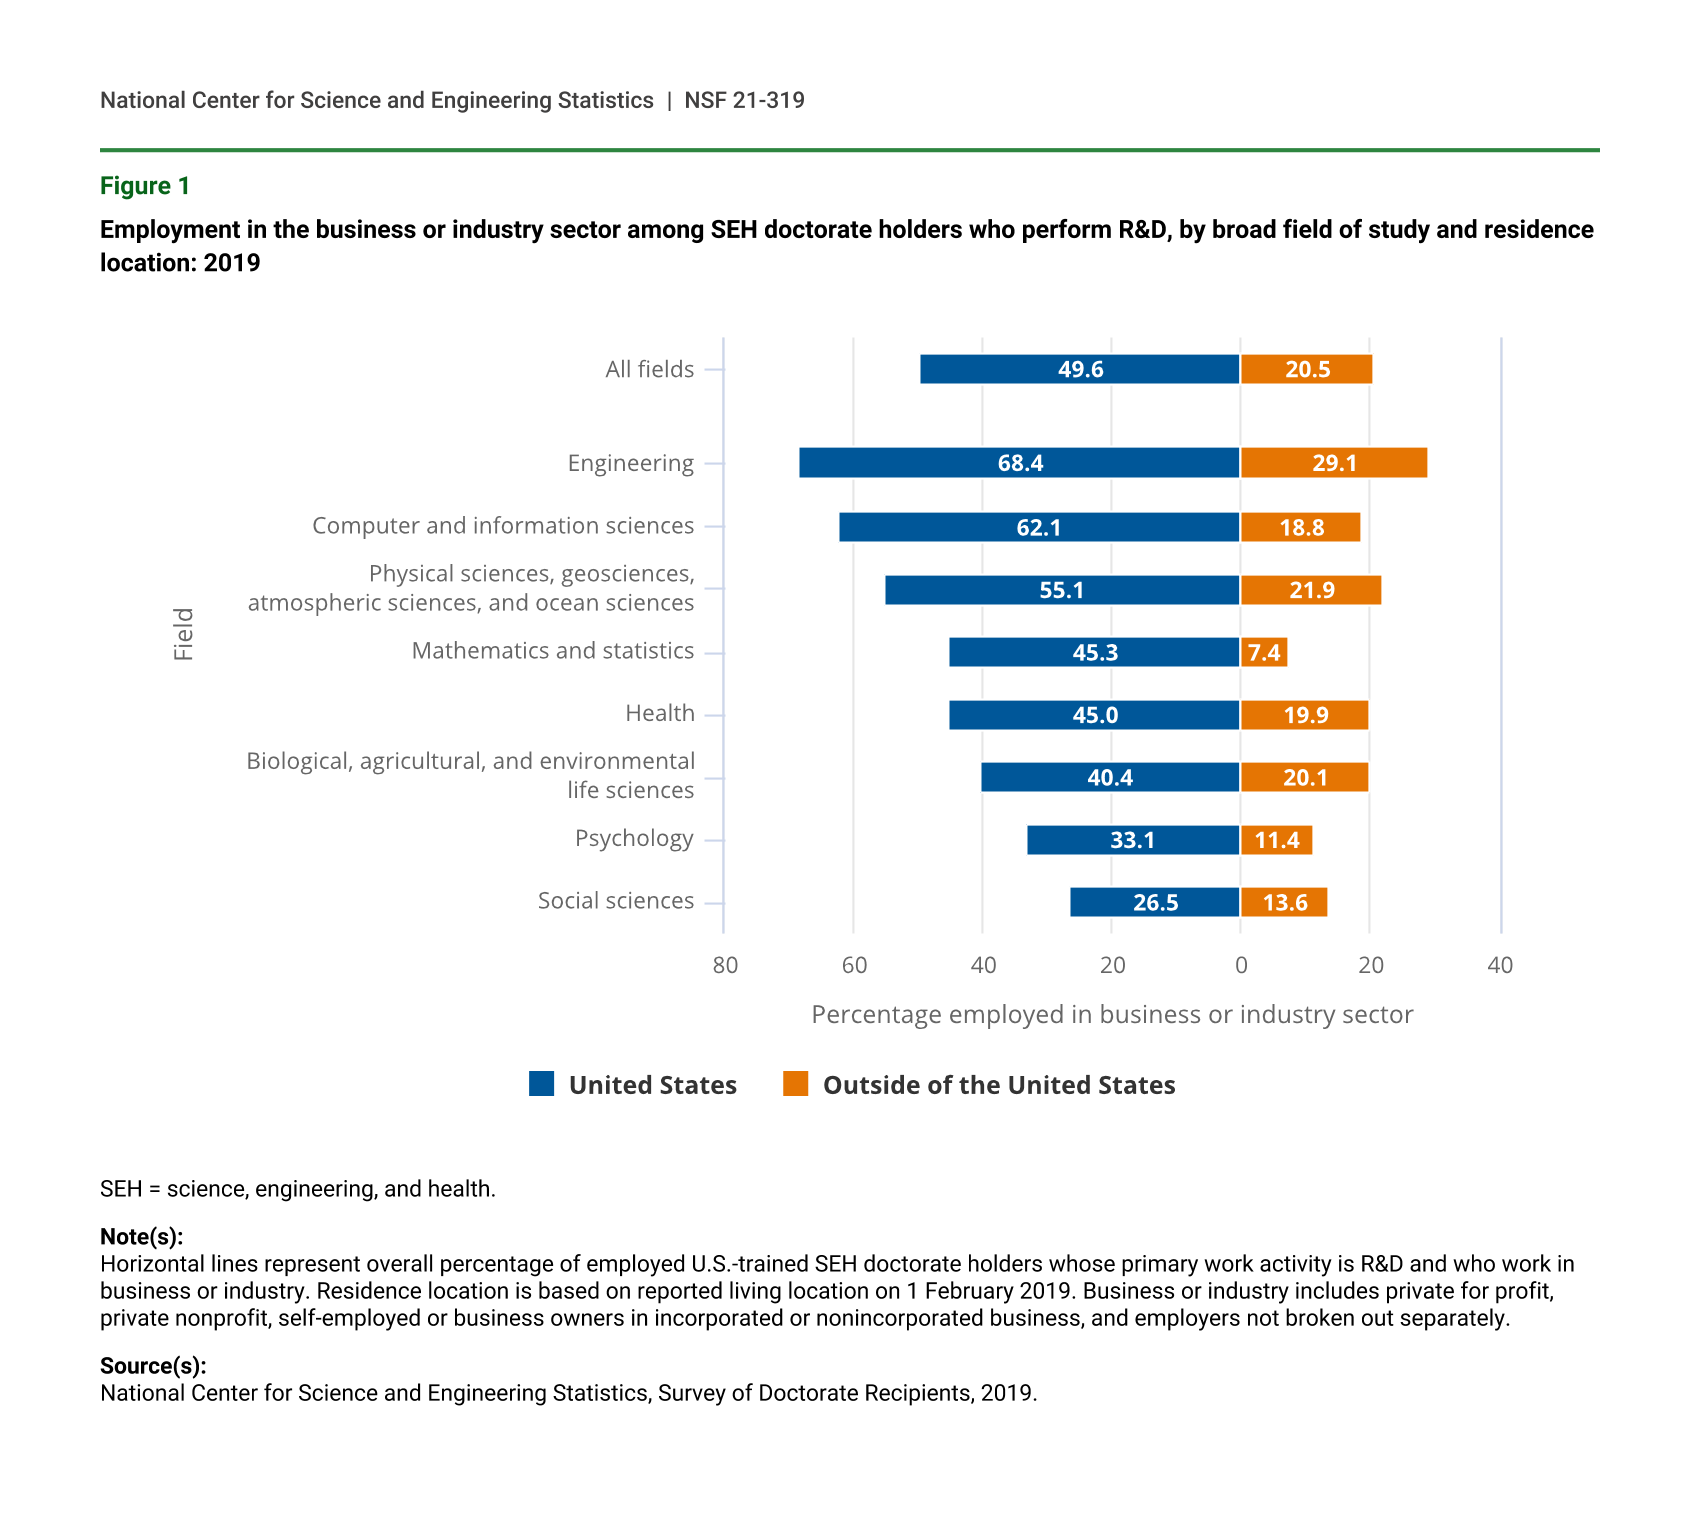
As noted above, 50% of U.S.-trained SEH doctorate holders whose primary work activity is R&D and who reside in the United States work in the business or industry sector. However, there are large differences depending on the doctoral degree field of the individuals. Figure 1 shows the degree fields sorted by descending fractions of working in the business or industry sector for U.S.-residing SEH doctorate holders whose primary work activity is R&D. At the lower end are those with degrees in social sciences (27%) and psychology (33%), whereas at the other end, 68% of those with a degree in engineering and 62% of those with a degree in computer and information sciences who perform R&D as their primary work activity are employed in this sector.
Outside of the United States, only 20% of U.S.-trained SEH doctorate holders whose primary work activity is R&D are employed in the business or industry sector. This proportion also varies widely by broad degree field (figure 1). For mathematics and statistics doctoral degree holders working abroad with a primary work activity in R&D, only 7% work in the business or industry sector, the lowest fraction among the broad fields of degree and significantly below social sciences and psychology. This contrasts with 45% for those in the United States in that broad degree field, which is close to the average fraction across all degree fields in the United States.
Employment in the business or industry sector among SEH doctorate holders who perform R&D, by broad field of study and residence location: 2019
| Field | United States | Outside of the United States |
|---|---|---|
| All fields | 49.6 | 20.5 |
| Engineering | 68.4 | 29.1 |
| Computer and information sciences | 62.1 | 18.8 |
| Physical sciences, geosciences, atmospheric sciences, and ocean sciences | 55.1 | 21.9 |
| Mathematics and statistics | 45.3 | 7.4 |
| Health | 45.0 | 19.9 |
| Biological, agricultural, and environmental life sciences | 40.4 | 20.1 |
| Psychology | 33.1 | 11.4 |
| Social sciences | 26.5 | 13.6 |
SEH = science, engineering, and health.
Note(s):
Horizontal lines represent overall percentage of employed U.S.-trained SEH doctorate holders whose primary work activity is R&D and who work in business or industry. Residence location is based on reported living location on 1 February 2019. Business or industry includes private for profit, private nonprofit, self-employed or business owners in incorporated or nonincorporated business, and employers not broken out separately.
Source(s):
National Center for Science and Engineering Statistics, Survey of Doctorate Recipients, 2019.
Trends in Employment Sector in the United States, 1999–2019
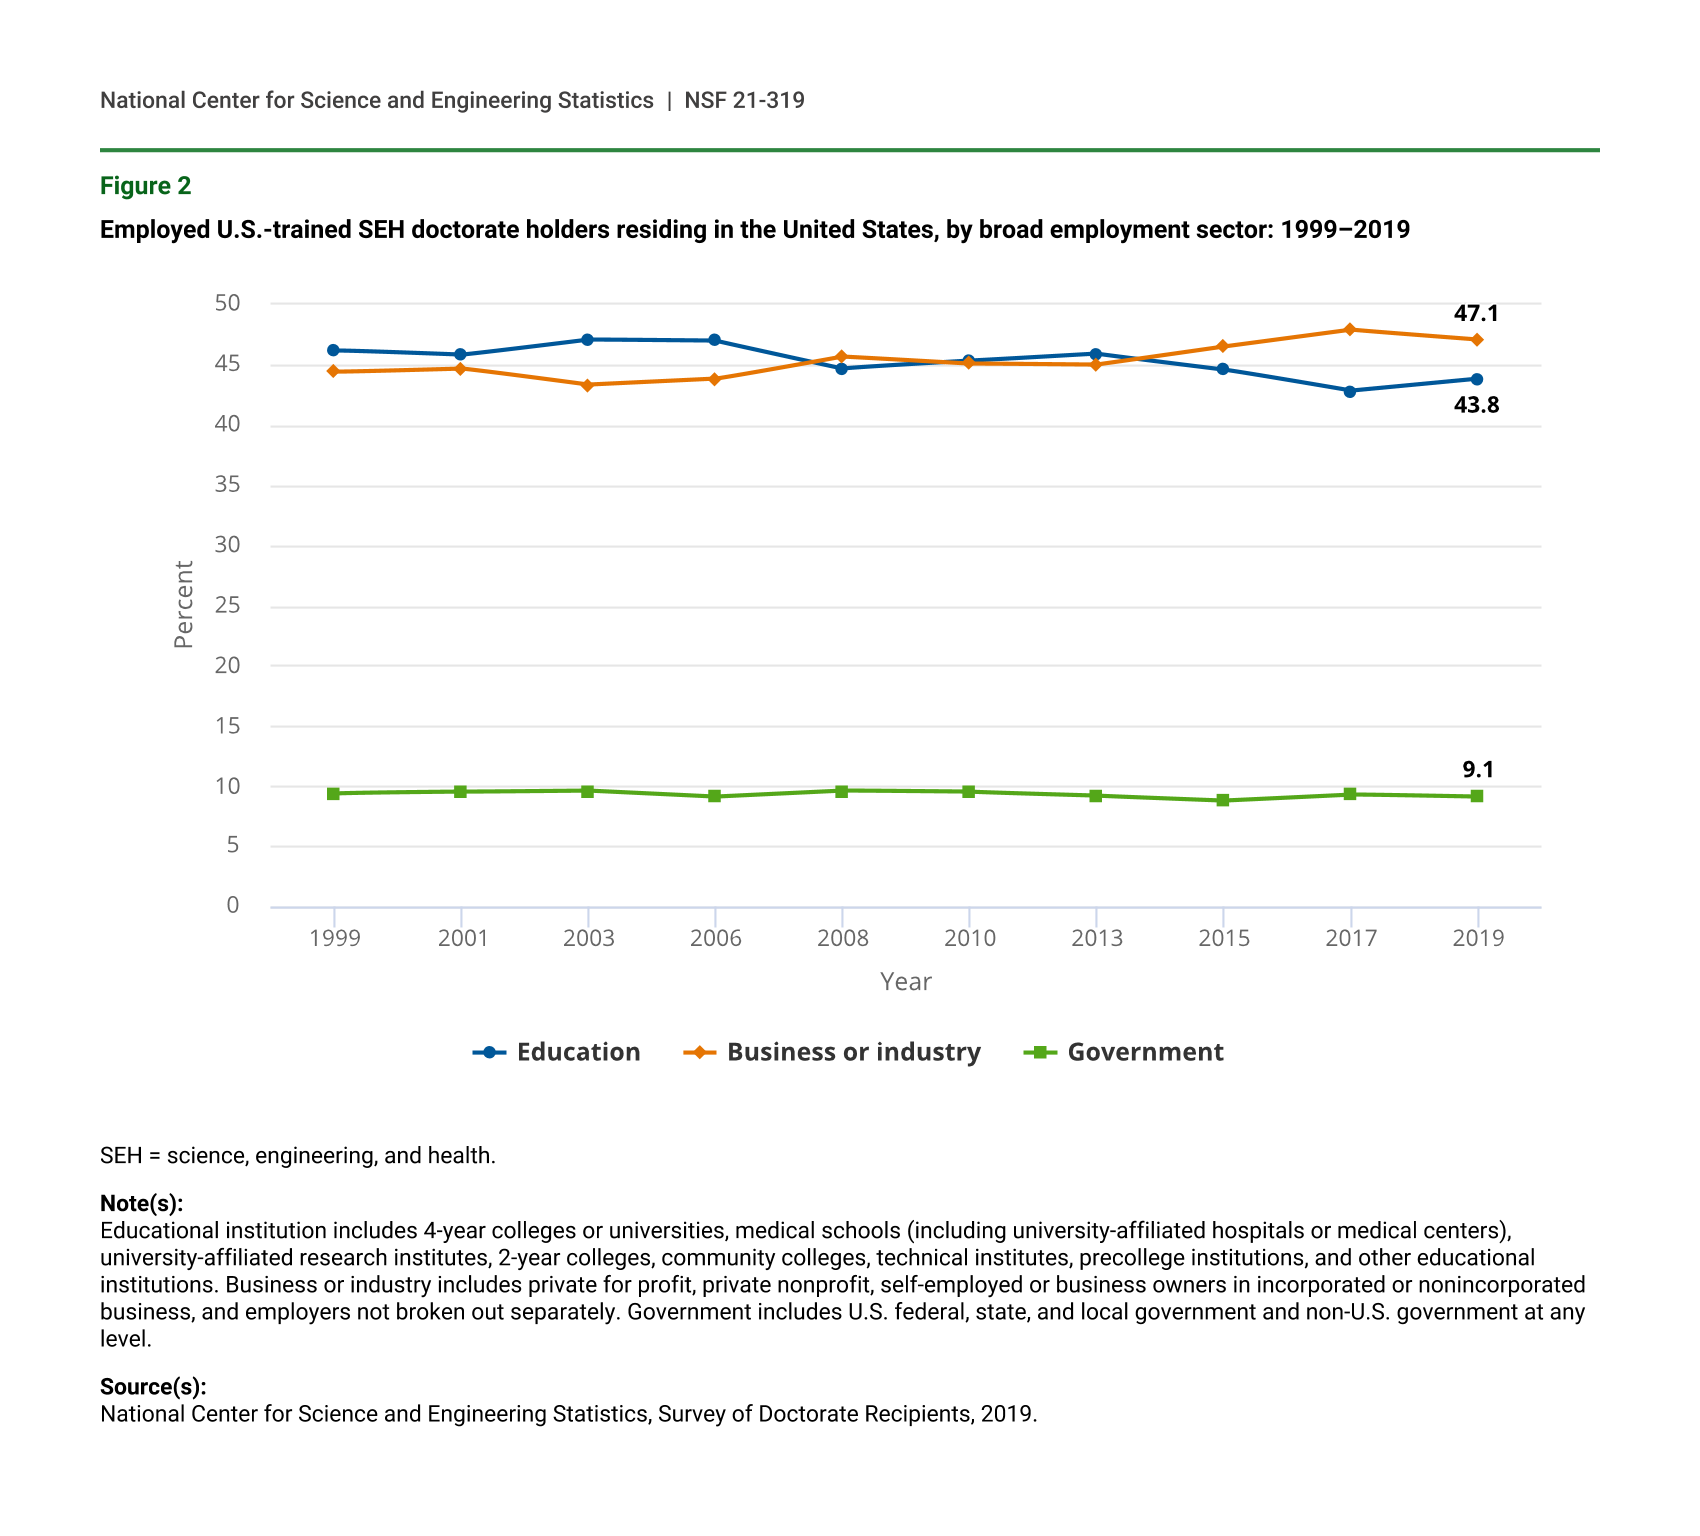
For the employed U.S.-trained SEH doctorate holders residing in the United States, SDR data collected since 1999 are available to compare the employment sector distribution over a 20-year period. As figure 2 shows, the employment sector distribution has shifted slightly over this period. The education sector exhibited a moderate decrease overall, from 46% in 1999 to 44% in 2019, while the private sector (i.e., business or industry) increased from 44% to 47%. The government sector employed a relatively minor and stable fraction of these doctorate holders in the United States during this period, representing less than 10% in each survey cycle. Notably, since 2015, the private sector has overtaken the education sector to become the largest sector of employment for U.S.-trained SEH doctorate holders residing in the United States.
Employed U.S.-trained SEH doctorate holders residing in the United States, by broad employment sector: 1999–2019
| Year | Education | Business or industry | Government |
|---|---|---|---|
| 1999 | 46.2 | 44.4 | 9.4 |
| 2001 | 45.8 | 44.7 | 9.5 |
| 2003 | 47.1 | 43.3 | 9.6 |
| 2006 | 47.0 | 43.8 | 9.1 |
| 2008 | 44.7 | 45.7 | 9.6 |
| 2010 | 45.3 | 45.1 | 9.5 |
| 2013 | 45.9 | 45.0 | 9.2 |
| 2015 | 44.6 | 46.5 | 8.8 |
| 2017 | 42.8 | 47.9 | 9.3 |
| 2019 | 43.8 | 47.1 | 9.1 |
SEH = science, engineering, and health.
Note(s):
Educational institution includes 4-year colleges or universities, medical schools (including university-affiliated hospitals or medical centers), university-affiliated research institutes, 2-year colleges, community colleges, technical institutes, precollege institutions, and other educational institutions. Business or industry includes private for profit, private nonprofit, self-employed or business owners in incorporated or nonincorporated business, and employers not broken out separately. Government includes U.S. federal, state, and local government and non-U.S. government at any level.
Source(s):
National Center for Science and Engineering Statistics, Survey of Doctorate Recipients, 2019.
Employment Sector and Salaries in the United States
As shown in table 1, a large majority of the 857,200 U.S.-trained SEH doctorate holders employed in the United States worked primarily in the private sector (47%) and the education sector (44%). However, substantial differences in their salaries exist between these sectors, with a median salary in the business or industry sector of approximately $142,000, compared with $93,000 in the education sector (table 3). The government sector, which employed 9% of these individuals, had a median salary of approximately $120,000. These results are for individuals working full time (i.e., 35 hours or more a week) in all three sectors.
Median salaries of full-time employed U.S.-trained SEH doctorate holders in the United States, by broad field of degree, years since doctorate, and employment sector: 2019
SEH = science, engineering, and health.
Note(s):
Salary is self-reported basic annual salary in principal job before deductions as of the week of 1 February 2019 and does not include bonuses, overtime, or additional compensation for summertime teaching or research. Educational institution includes 4-year colleges or universities, medical schools (including university-affiliated hospitals or medical centers), university-affiliated research institutes, 2-year colleges, community colleges, technical institutes, precollege institutions, and other educational institutions. Business or industry includes private for profit, private nonprofit, self-employed or business owners in incorporated or nonincorporated business, and employers not broken out separately. Government includes U.S. federal, state, and local government and non-U.S. government at any level. Median annual salaries are for principal job and are rounded to nearest $1,000. Full time is based on working 35 or more hours per week.
Source(s):
National Center for Science and Engineering Statistics, Survey of Doctorate Recipients, 2019.
Table 3 also shows the median salaries of employed U.S.-trained SEH doctorate holders residing in the United States by broad field of doctoral degree within these sectors. In the education sector, the overall range of these median salaries by degree field is from $88,000 (physical sciences, geosciences, atmospheric sciences, and ocean sciences) to $107,000 (computer and information sciences). In the business or industry sector, the overall range of these median salaries by degree field is $115,000 (psychology) to $179,000 (computer and information sciences). In the government sector, the overall range of these median salaries by degree field is $109,000 (psychology) to $144,000 (mathematics and statistics). Computer science has the highest median salaries in both the education and the private sectors. Interestingly, although the median salary for individuals with degrees in mathematics and statistics in the education sector ($90,000) is similar to the overall median salary in that sector, they have the second highest median salary ($159,000) in the business or industry sector, and they are among those with the highest median salary in the government sector.
The median salaries by employment sectors and doctoral degree fields can be further examined by considering years of experience. As expected, the median salaries are typically higher as the number of years since the doctorate degree was awarded increases. However, these increases vary by degree field and by employment sector. For individuals with doctoral degrees in computer and information sciences, the difference in median salaries between those who obtained their degrees more than 20 years ago and those who obtained them 10 or less years ago, ranges from $26,000 in government to $35,000 in education. For individuals with degrees in the biological, agricultural, and environmental life sciences, the difference in median salaries was at least $56,000 across sectors between those who obtained their degrees more than 20 years ago and those who obtained their degree less than 10 years ago.
Data Sources, Limitations, and Availability
Data presented here are from the 2019 SDR, which collects data on individuals who earned research doctoral degrees in SEH fields from U.S. institutions. The target population of the SDR consists of all U.S.-trained SEH doctoral graduates who were younger than 76 years of age and not institutionalized or terminally ill on 1 February 2019. The SDR has been conducted since 1973 and is sponsored by NCSES and by the National Institutes of Health. The estimates in this InfoBrief are based on responses from a sample of the population and may differ from actual values because of sampling variability. As a result, apparent differences between the estimates for two or more groups may not be statistically significant. All comparative statements in this report have undergone statistical testing and are significant at the 90% confidence level unless noted otherwise. In addition, the estimates presented are rounded to the nearest 50 ($1,000 for salaries), although percentage calculations are based on unrounded estimates. More information on the SDR can be found at (https://www.nsf.gov/statistics/srvydoctoratework/). Data from the SDR are also included in NCSES reports, such as Science and Engineering Indicators and Women, Minorities, and Persons with Disabilities in Science and Engineering.
Notes
1For the R&D activities, applied research is study directed toward gaining scientific knowledge to meet a recognized need. Basic research is study directed toward gaining scientific knowledge primarily for its own sake. Development is defined as using knowledge gained from research for the production of materials and devices. Design refers to the design of equipment, processes, structures, or models.
2The sample design of the Survey of Doctorate Recipients has gone through multiple changes in terms of population coverage since the 1999 survey cycle. These changes have steadily improved the population coverage over time, with the pilot of an internationally residing sample starting in SDR 2003 to the large-scale expansion in the 2015 survey cycle to complete the coverage of the internationally residing population. Some of these sample design changes could have an effect on the employment sector distribution trend data for the period of 1999–2019.
Suggested Citation
Opsomer J, Chen A, Chang W-Y, and Foley D; National Center for Science and Engineering Statistics (NCSES). 2021. U.S. Employment Higher in the Private Sector than in the Education Sector for U.S.-Trained Doctoral Scientists and Engineers: Findings from the 2019 Survey of Doctorate Recipients. NSF 21-319. Alexandria, VA: National Science Foundation. Available at https://ncses.nsf.gov/pubs/nsf21319/.
Contact Us
NCSES
National Center for Science and Engineering Statistics
Directorate for Social, Behavioral and Economic Sciences
National Science Foundation
2415 Eisenhower Avenue, Suite W14200
Alexandria, VA 22314
Tel: (703) 292-8780
FIRS: (800) 877-8339
TDD: (800) 281-8749
E-mail: ncsesweb@nsf.gov